Article

Educational Scale-Bridging Approach towards Modelling of Electric Potential, Electrochemical Reactions, and Species Transport in PEM Fuel Cell

1
Faculty of Mechanical Engineering, University of Ljubljana, Aškerčeva 6, 1000 Ljubljana, Slovenia
2
Faculty of Education, University of Ljubljana, Kardeljeva Ploščad 16, 1000 Ljubljana, Slovenia
3
National Institute of Chemistry, Hajdrihova Ulica 19, 1000 Ljubljana, Slovenia
*
Author to whom correspondence should be addressed.
Catalysts 2023, 13(7), 1131; https://doi.org/10.3390/catal13071131
Submission received: 6 June 2023 / Revised: 6 July 2023 / Accepted: 14 July 2023 / Published: 20 July 2023
(This article belongs to the Topic Hydrogen Energy Technologies, 2nd Volume)

Abstract

:
The use of hydrogen fuel cells as a mobile source of electricity could prove key to the future decarbonisation of heavy-duty road and marine transportation. Due to the complex interplay of various physicochemical processes in fuel cells, further development of these devices will depend on concerted efforts by researchers from various fields, who often lack in-depth knowledge of different aspects of fuel cell operation. These knowledge gaps can be filled by information that is scattered in a wide range of literature, but is rarely covered in a concise and condensed manner. To address this issue, we propose an educational-scale-bridging approach towards the modelling of most relevant processes in the fuel cell that aims to adequately describe the causal relations between the processes involved in fuel cell operation. The derivation of the model equations provides an intuitive understanding of the electric and chemical potentials acting on protons at the microscopic level and relates this knowledge to the terminology commonly used in fuel cell research, such as catalyst electric overpotential and internal membrane resistance. The results of the model agreed well with the experimental data, indicating that the proposed simple mathematical description is sufficient for an intuitive understanding of fuel cell operation.

Graphical Abstract

1. Introduction

Electrochemical devices such as fuel cells, electrolysers, and batteries are key building blocks for achieving future environmental and climate goals. They are indispensable components of future energy systems and electrified vehicle powertrains. Therefore, a wide range of stakeholders is involved in the development and use of these devices, covering the entire chain from core components to the integration of fuel cell systems into the energy of vehicle systems, which has a crucial impact on the design, function, and use of these devices. Due to widely different academic backg rounds, the stakeholders often lack in-depth knowledge and understanding of the electrochemical and transport processes in fuel cells, which can lead to unnecessary frustrations and hinder progress in understanding and developing the aforementioned systems. These facts were the main motivation for the present paper, in which we intended to systematically elucidate the physical background of the fundamental electrochemical and transport phenomena in fuel cells.
This systematic journey begins with basic thermodynamics, continues with its application to real materials encountered in fuel cells, and ends with an explanation of processes under non-equilibrium conditions, i.e., finite current. The following key questions will be answered with the help of insightful phenomenological explanations and their interrelations to the main governing equations:
  • Why do two different reactants fed to two electrodes produce a finite voltage or potential difference?
  • Why and how does the choice of reactants affect the fuel cell voltage?
  • Why do hydrogen molecules at the anode of the fuel cell preferentially decompose into two protons and two electrons, even though the products have much higher chemical energy?
  • What is overpotential or, an even more intriguing version of this question: is overpotential a cause or a consequence of the electrochemical process in the fuel cell?
  • Why does the voltage of a fuel cell decrease with increasing current density?
  • What forces the protons to travel through the membrane from the anode to the cathode side of the fuel cell?
The answers to these questions are generally known, but they are scattered over a large number of books and papers, ranging from basic electrochemistry [1] to more focused works on fuel cell operation principles [2,3]. Basic electrochemistry books [1] do well in explaining the microscopic principles of electrochemical processes, but do not apply them to the specific selection of the chemical species, materials, and “experimental” conditions found in a realistic fuel cell device. In the literature dealing with fuel cell operation principles, the results of electrochemical studies are taken as a given fact and applied to realistic systems without explaining their origin in detail, often avoiding an adequate explanation of the causal relations between the processes.
A proper understanding of processes in the fuel cell is closely related to the modelling procedures employed to describe the operation of these devices. Since computational models are typically evaluated based on the output data they produce and the compatibility with the experimental measurements, the proper understanding of the underlying physical processes and causal relationships is usually not the primary focus in the process of model development. In particular, the electric current through the fuel cell is often considered the driving force for the processes in the device, from which the overpotential at the interfaces is determined.
There are approximately four distinct ways in which this modelling approach is handled in the literature. The first is the use of a data-driven approach [4,5,6,7,8], which is widely used in system-level analyses, but has limited applicability in studies aimed at simultaneous optimisation of performance and lifetime. This is because the accuracy of data-driven models generally does not extend beyond the parameter variation learning space, and training data-driven models on a variation space with very high dimensionality proves difficult and time consuming.
The second approach relies on electrochemical models based on the Tafel equation derived from the Butler–Volmer equation, in which the forward reaction is superimposed on the backward reaction. This is a reasonable approximation for operating points with high current densities and consequently high activation overpotentials. However, it has a major drawback in the low-current-density region, where the error of the approximation increases exponentially as the current density approaches zero, which necessarily means that activation losses cannot be well characterised. The described method was used in the publications [9,10,11,12,13,14,15,16,17,18,19].
The third approach is based on electrochemical models based on the Tafel equation extended with various corrections for the low-current-density range to reduce the calibration error of the terms in the activation loss expression. In [20,21], a linearisation of the Butler–Volmer equation for the anode side and the use of the Tafel equation for the cathode side was proposed to solve this problem. In [22,23,24], the subsequent replacement of the natural logarithm in the Tafel equation by a sinusoidal hyperbolic fit was proposed. The proposed replacement successfully reduces the total error in the low-current-density range, but leads to incorrectly placed individual terms in the activation loss equation, which affects the calibration procedure and the performance of the model.
The fourth approach is based on a thermodynamically consistent derivation of the model of [25,26] and provides a consistent analytically derived expression for the polarisation curve in the low-current-density regions, where the parameters describing the activation losses are typically prone to calibration errors. While these approaches are generally less computationally demanding and often work well in stationary conditions, yielding plausible results, they can lead to an incomplete or misguided understanding of the causal relations between processes. On the other hand, mean-field elementary kinetics models [27,28], based on the binding energies of reactants and intermediates on catalyst surfaces in electrochemical environments, intuitively and in detail cover the causal relations between processes at the micro-scale and serve as a direct scale-bridging platform to the results of density functional theory calculations [29,30,31]. However, due to the high computational cost, they cannot be used directly in fuel cell operation simulations.
The modelling approaches, reviewed in previous paragraphs, are indispensable tools in the precise and efficient description of fuel cell operation, but do not provide much insight into the underlying mechanisms and understanding of the basic principles of fuel cell operation. To address this gap, we propose a new educational modelling approach, aimed at improving the intuitive understanding of the physical and chemical processes underlying the fuel cell operation. The proposed scale-bridging model systematically addresses and combines the mathematical descriptions of physical processes taking place at different size scales, starting from fundamental microscopic molecular processes involved in electrochemical reactions over mesoscopic processes of chemical species transport in the fuel cell to the macroscopic fuel cell operation parameters, observed in experimental measurements. To maximise the educational value of the proposed model, the number of model parameters and variables was minimised as much as possible, while still maintaining and properly describing the causal relationships between the physical quantities described in the model. In this way, the proposed model offers an innovative and insightful perspective on the physico-chemical processes inside the fuel cell and provides new generations of researchers with a useful tool for quickly and effectively learning the working principles of hydrogen fuel cells.

2. Model Description

The fuel cell produces electrical energy from hydrogen and oxygen by feeding each of the reactants to the gas feed channels on each side of the cell, schematically presented in Figure 1. Hydrogen diffuses through the anode gas diffusion layer (GDL) to the anode catalyst layer, which consists of a carbon support structure on which the catalyst nanoparticles (typically platinum) are deposited. The catalyst surface serves as an active area where the electrochemical hydrogen oxidation reaction (HOR) takes place, splitting the hydrogen molecule into two electrons and two protons. The catalyst carbon support and the GDL are both electrically conductive, so the electrons produced in the HOR can travel through them and through the external electrical load R towards the cathode side of the fuel cell. The protons produced in the HOR enter the ionomer, a solid proton-conducting material, typically made of Nafion or a similar polymer. The ionomer covers the catalyst particles and connects them with the membrane, which is made of the same material and allows protons to travel from the anode to the cathode side while blocking (almost completely) the diffusion of gaseous reactants. In the cathode catalyst layer, the protons are recombined with electrons and oxygen in an electrochemical oxygen reduction reaction (ORR), which diffuses from the cathode feed channels through the cathode GDL to the cathode catalyst layer. This leads to the formation of water, which diffuses back through the GDL to the gas channels and through the membrane to the anode side, allowing proton transport via the hydronium ion and enhancing the Grotthuss mechanism [32]. The goal of the model is to describe these processes using simple mathematical relations to explain what the driving forces behind these processes are and how they can be used to extract useful electric work from the fuel cell.
The state of the fuel cell is described in the model by seven time-dependent quantities (marked in red in Figure 1):
  • c H 2 , a n ( t ) – hydrogen concentration in the anode catalyst layer;
  • c O 2 , c a t ( t ) – oxygen concentration in the cathode catalyst layer;
  • c H 2 O , c a t ( t ) – water concentration in the cathode catalyst layer;
  • c H + , a n ( t ) – proton concentration in the anode catalyst layer;
  • c H + , c a t ( t ) – proton concentration in the cathode catalyst layer;
  • U a n , e l ( t ) – anode catalyst electric potential;
  • U c a t , e l ( t ) – cathode catalyst electric potential.
The fuel cell operating conditions are determined by the species concentrations in the channels, which are affected by the feed rate and pressure, the temperature controlled by the cooling system, and the external electrical load. These quantities are used as the input parameters to the model and are shown in blue in Figure 1:
  • c H 2 , c h ( t ) – hydrogen concentration in the anode gas feed channel;
  • c O 2 , c h ( t ) – oxygen concentration in the cathode gas feed channel;
  • c H 2 O , c h ( t ) – water concentration in the cathode gas feed channel;
  • T ( t ) – fuel cell temperature;
  • R ( t ) – electric resistivity of the external load.
The dynamics of the model variables are governed by a simple set of ordinary differential equations describing the following processes:
  • Electrochemical (EC) processes in the anode and cathode catalyst layer;
  • Diffusion (dif) of gaseous reactants and products through the GDL;
  • Proton transport through the membrane (mem);
  • Electron (el) transport through the external electric load.
Equation (1) lists the contributions of specific processes to the temporal dynamics of each of the model variables:
d c H 2 , a n ( t ) d t = d c H 2 , a n d t E C + d c H 2 , a n d t d i f , d c O 2 , c a t ( t ) d t = d c O 2 , c a t d t E C + d c O 2 , c a t d t d i f , d c H 2 O , c a t ( t ) d t = d c H 2 O , c a t d t E C + d c H 2 O , c a t d t d i f , d c H + , a n ( t ) d t = d c H + , a n d t E C + d c H + , a n d t m e m , d c H + , c a t ( t ) d t = d c H + , c a t d t E C + d c H + , c a t d t m e m , d U a n , e l ( t ) d t = d U a n , e l d t E C + d U a n , e l d t e l , d U c a t , e l ( t ) d t = d U c a t , e l d t E C + d U c a t , e l d t e l .
Note that all modelled variables are affected by electrochemical processes (ECs), describing species production/consumption, while species transport is described by either diffusion (gaseous species), membrane transport (protons), or electrical conduction (electrons).
In the remainder of the paper, we explain in detail the underlying physics of each process and how it relates to the various model parameters, and we derive mathematical expressions for each of the terms in Equation (1). We start in Section 3 with general considerations of electrochemical processes to explain the dynamics in the anode electrode and extend the explanation to the cathode electrode in Section 4. Gas diffusion is explained in Section 5, proton transport in the membrane in Section 6, and electron transport in Section 7.

3. Electrochemical Processes on Hydrogen Electrode

3.1. Microscopic Picture of an Electrochemical Reaction

We begin our discussion by explaining the processes that occur on the anode side of the fuel cell. The reason for this is that the anode reaction is much simpler than the cathode reaction, comprising only a reaction between hydrogen, protons, and electrons:
2 H + + 2 e H 2 .
This reaction is the same as the one used in the standard hydrogen electrode (SHE), defined as a porous platinum electrode, dipped in 1 M acid solution, and surrounded by hydrogen bubbling around it at a pressure of 1 atm [1]. These idealised conditions are very similar to those in the fuel cell anode and will be used to explain the basic principles of electrochemical processes, with detailed differences between the two systems discussed later in Section 3.6.
The first step in understanding the electrochemical reaction Equation (2) is to identify how the species involved in the reaction relate to the definition of the standard hydrogen electrode. The protons on the left side of the reaction are present in the acid solution. Strong acids dissociate completely in water, so the proton concentration is equal to the molarity of the acid. To form gaseous hydrogen (right-hand side of Equation (2)), the protons are combined with the electrons. These are provided by the metal surface, in our case by a platinum catalyst, in which the electrons are not strongly bound, but form an electron cloud and can, therefore, be easily detached from the metal under certain conditions.
The two-sided arrows in Equation (2) indicate that the reaction can proceed in either direction, depending on various conditions, which we will discuss in detail later in the paper. In general, the direction of the reaction is determined by which configuration is energetically favourable. Comparing the energy of isolated protons and electrons with that of the hydrogen molecule, we find that the state of particles bound in a molecule is energetically favourable and the preferred direction of reaction Equation (2) is from right to left [33]. We, therefore, first examined the situation in which no hydrogen is present and only protons from the acid interact with electrons from the platinum and in which the acid and catalyst are initially at the same electric potential. When we dip the electrode in the acid, the electrons on its surface come into contact with the protons in the acid and the proton reduction reaction will take place:
2 H + + 2 e H 2 ,
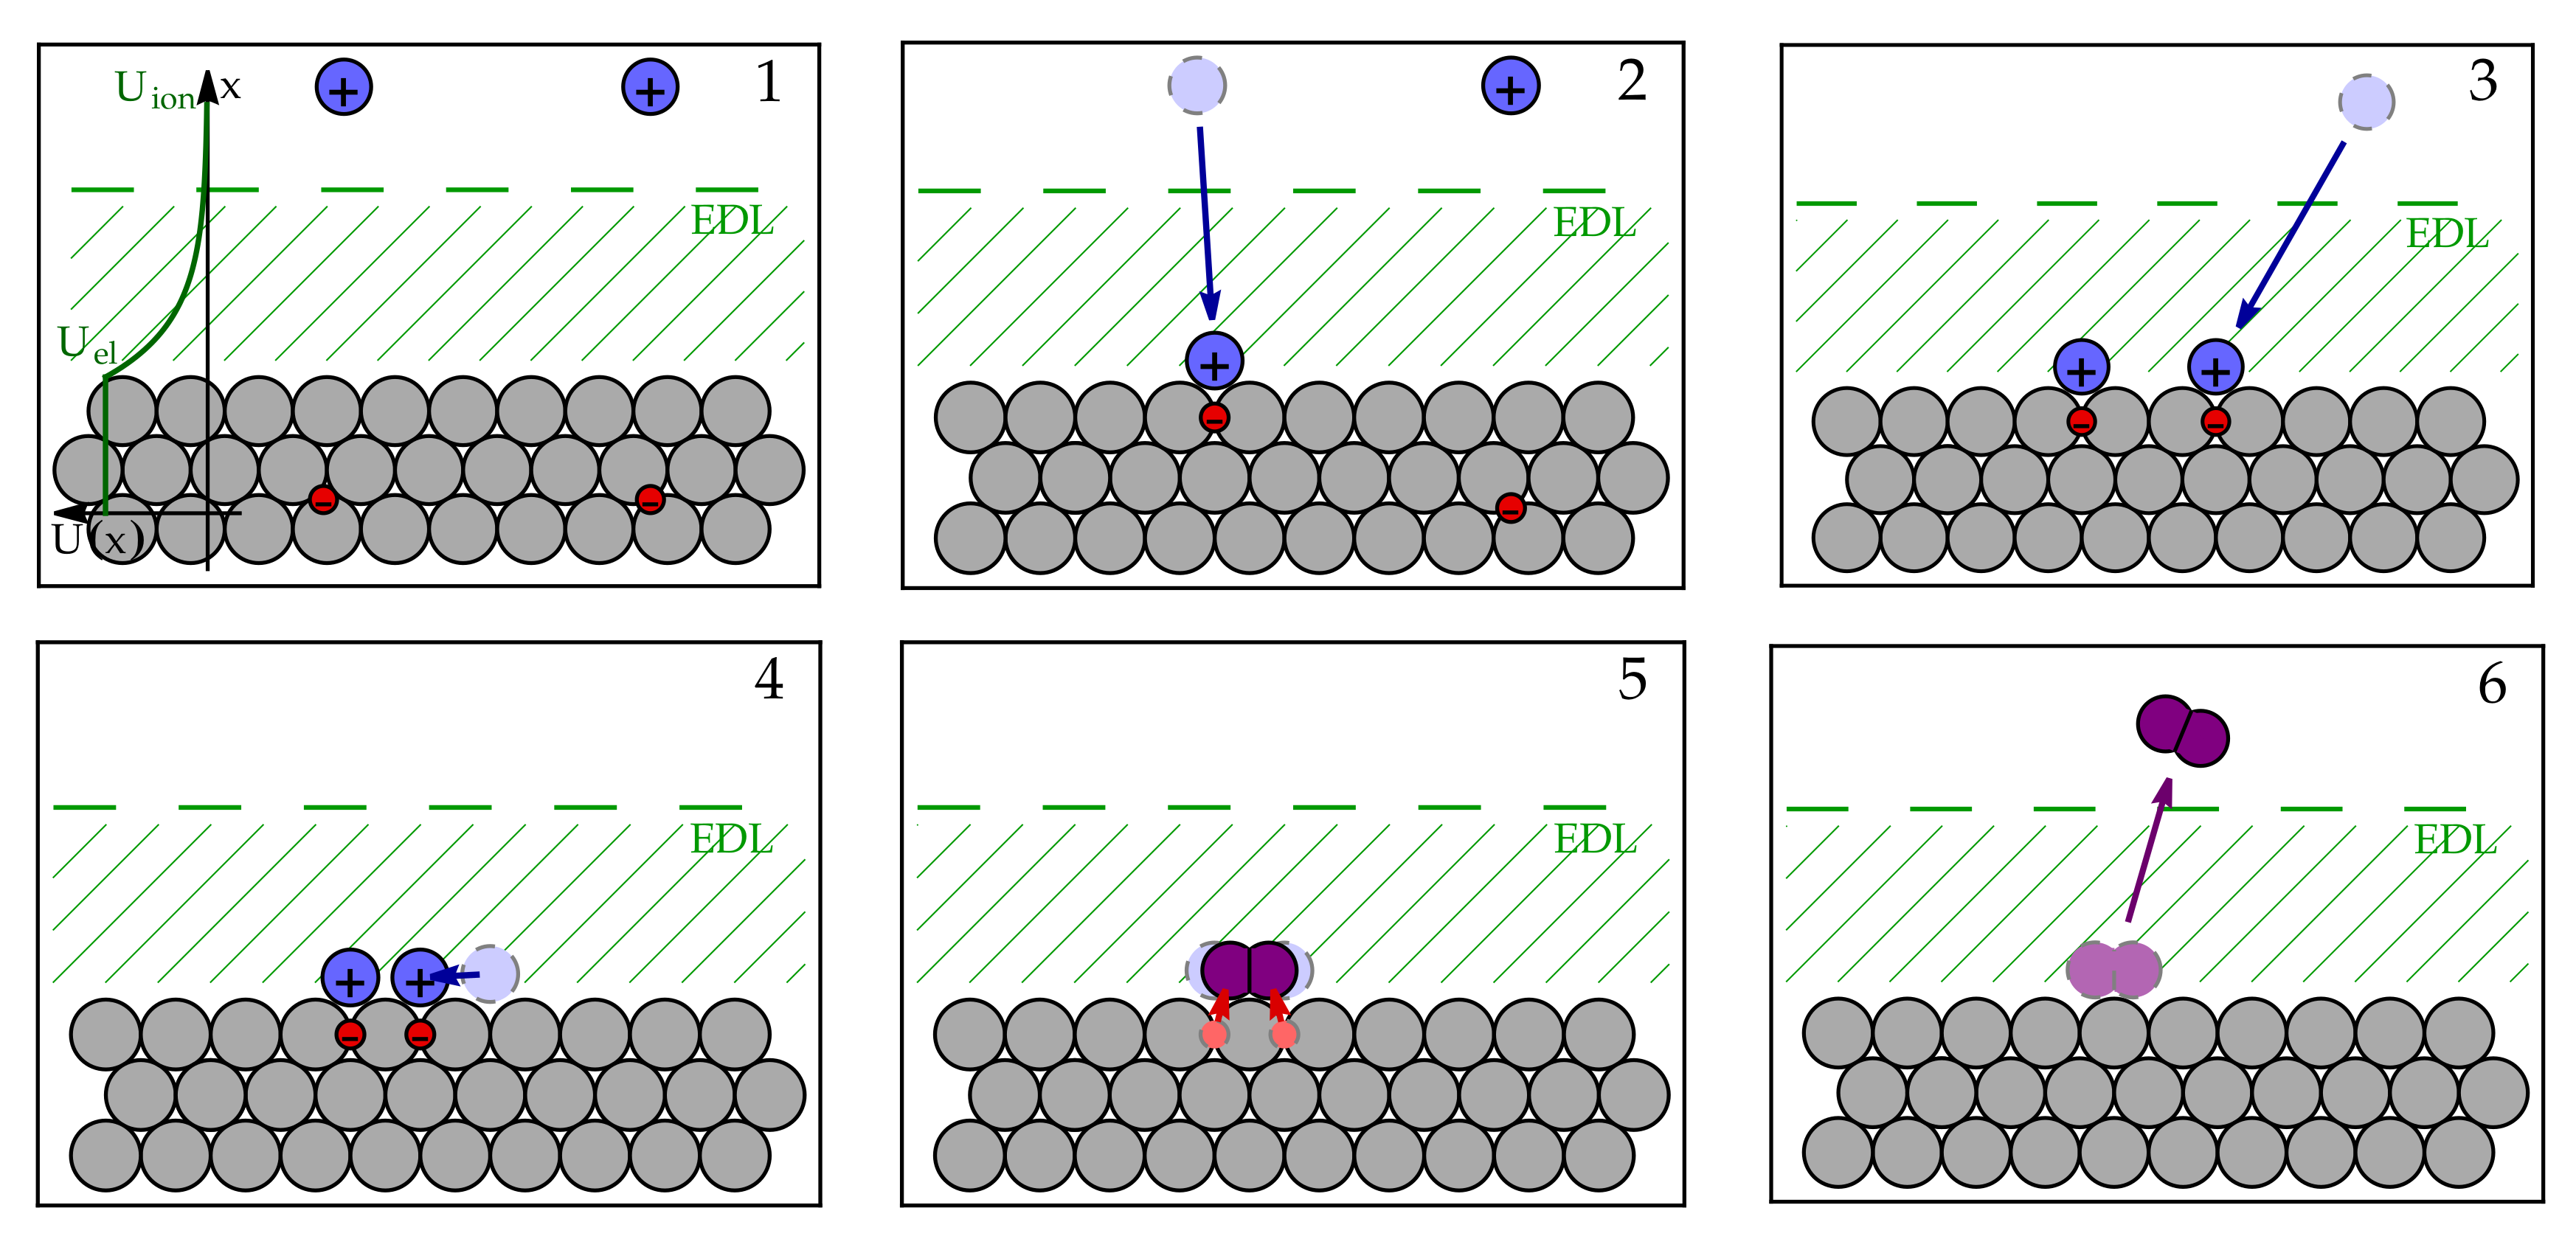
consuming protons from the acid and electrons from the electrode. This slightly decreases the proton concentration in the acid, which decreases its acidity (and increases the pH value). More importantly, in an electrically isolated electrode, the deficit of negatively charged electrons leads to an increase in its electric potential. As a result, the negatively charged ions from the acid are attracted to the electrode surface and form the so-called electric double layer (EDL) [1]. While the detailed picture of its formation and properties are important for the reaction dynamics on the electrode surface, a simple picture of the finite increase in electric potential across a small surface layer, as shown in Figure 2, is sufficient for the basic understanding of its effect on the reaction dynamics. Since the electric potential difference between the electrolyte and electrode is now positive, the double layer presents an energy barrier for protons seeking to react with electrons, thus slowing down the reaction. This intuitive explanation introduces two important factors that affect the reaction rate: (1) the concentration of reactants required for the reaction and (2) the energy difference between the initial and final state, which is closely related to the electric phenomena on the electrode surface because the interacting particles are electrically charged.
The hydrogen oxidation reaction:
H 2 2 H + + 2 e ,
does not occur spontaneously because it is energetically unfavourable for hydrogen to decompose into protons. However, as discussed in the next section, the proper management of the species concentration and the electric potential drop across the double layer can cause the reaction to proceed in this direction as well.

3.2. Simple Kinetic Model of Electrochemical Reaction Rates

To represent the process in mathematical terms, we used a simple kinetic model to describe the rates of electrochemical reactions [1]. To describe the reaction kinetics, we identified six distinct states, schematically presented in Figure 2, through which the system transitions from the initial state (State 1 in Figure 2) to the final state (State 6). The chemical enthalpy of the i-th state is denoted H c h , i , the electric energy as E e l , i , and the total electrochemical enthalpy as H i = H c h , i + E e l , i .
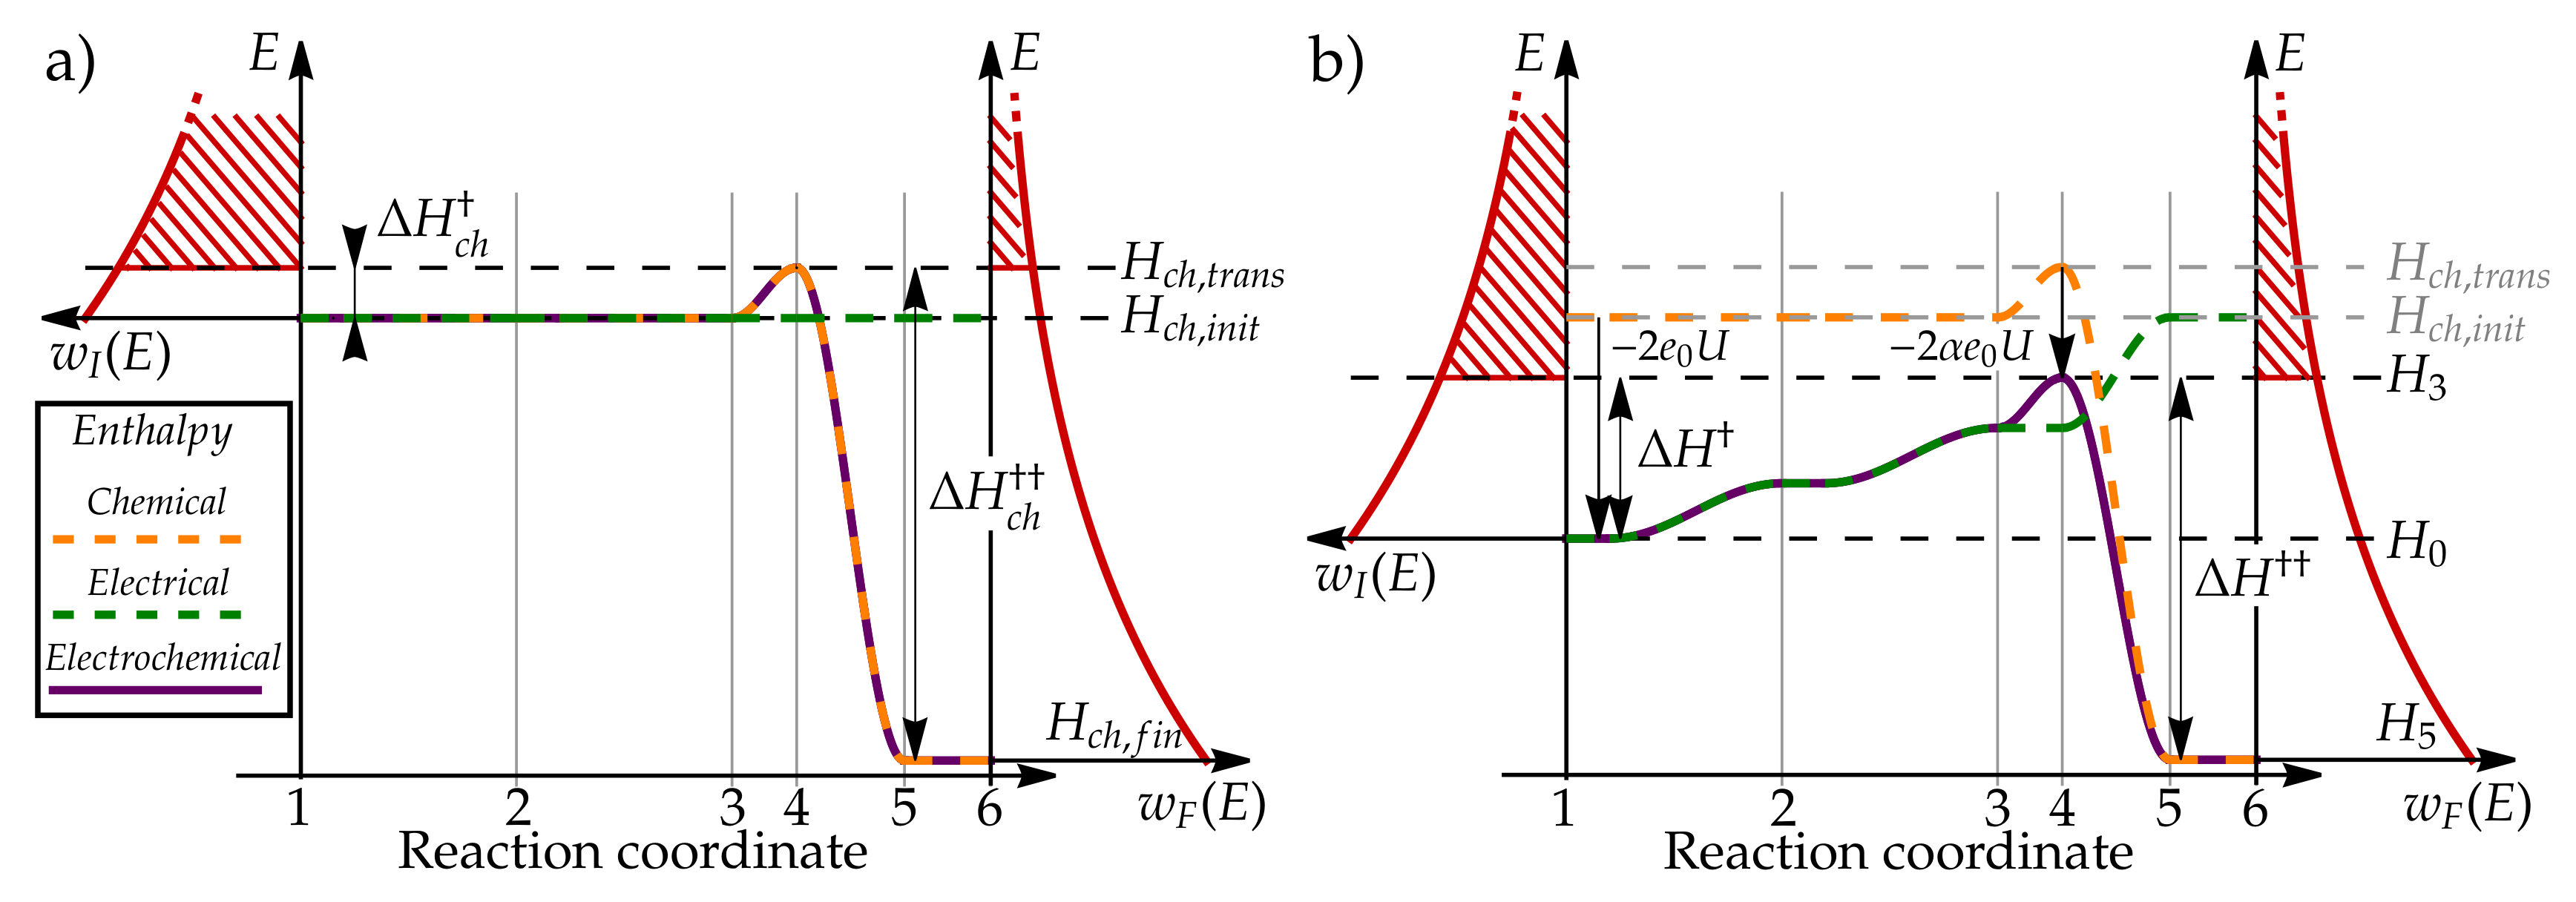
When the electrode is not electrically charged, the transition of protons from the bulk electrolyte to the electrode surface ( 1 2 3 ) leads to a change in the system enthalpy ( H c h , 1 = H c h , 2 = H c h , 3 = H c h , i n i t ), as schematically presented in Figure 3a). In the next step ( 3 4 ), the protons must arrange themselves in a configuration in which they can bond with two electrons to form a hydrogen molecule. This so-called transition state is energetically unfavourable due to the electrostatic repulsion between two positively charged particles, which results in the chemical enthalpy of the transition state H c h , 4 = H c h , t r a n s being higher than the enthalpy of the other configurations (as schematically presented in Figure 3). When protons and electrons form the hydrogen molecule ( 4 5 6 ), the enthalpy decreases significantly due to the formation of a chemically stable and electrically neutral molecule with enthalpy H c h , 5 = H c h , 6 = H c h , f i n .
When the electrode is electrically charged, the EDL that forms on its surface acts as an electric potential step of magnitude:
U = U e l U i o n ,
which affects the energy of electrically charged species, e.g., protons, as they approach the surface, as shown in green in Figure 2. Since the hydrogen molecule is electrically neutral, the electrochemical enthalpy of States 5 and 6 remains unchanged:
H 5 = H c h , f i n ,
H 6 = H c h , f i n .
The change in enthalpy of the initial State 1 can be explained in two ways. If one assumes that the electrode potential was increased with respect to the fixed potential in the electrolyte, the energy of each electron decreases by Δ E e l = e 0 U . On the other hand, if we assume that the electrolyte potential has been lowered compared to the fixed electrode potential, the energy of each proton decreases by Δ E H + = e 0 U . Both descriptions are consistent with each other and show that the energy decrease is proportional to the number of charged particles in each state, resulting in enthalpy:
H 1 = H c h , i n i t 2 e 0 U .
To describe the electric energy of transition states, we considered the energy required for the proton to transition from the bulk electrolyte to the electrode surface, which is approximately Δ E e l e 0 U . However, taking into account that the proton adsorbed to the electrode surface still feels the EDL electric field and that its charge is partially neutralised by surface electrons, the resulting energy difference Δ E e l = e 0 U ( 1 α ) is somewhat smaller (see Appendix A). The difference in the electrostatic energy of the protons between the electrolyte and the electrode surface is parameterised by the so-called charge transfer coefficient α , ( 0 < α < 1 ) [1], which describes how the energy of the transition states is related to the electrode potential U. Therefore, the enthalpy of the transition States 2 and 3 is
H 2 = H c h , i n i t ( 1 + α ) e 0 U ,
H 3 = H c h , i n i t 2 α e 0 U .
We further assumed that the charge configuration of transition State 4 is similar to that of State 3:
H 4 = H c h , t r a n s 2 α e 0 U .
This relation conveys an intuitive explanation of the charge transfer coefficient α as a description of the transition state energy change at the charged electrode. As we will further explore in Section 3.5, the charge transfer coefficient plays a significant role in how oxidation and reduction rates are affected by the changes in the electric potential U.
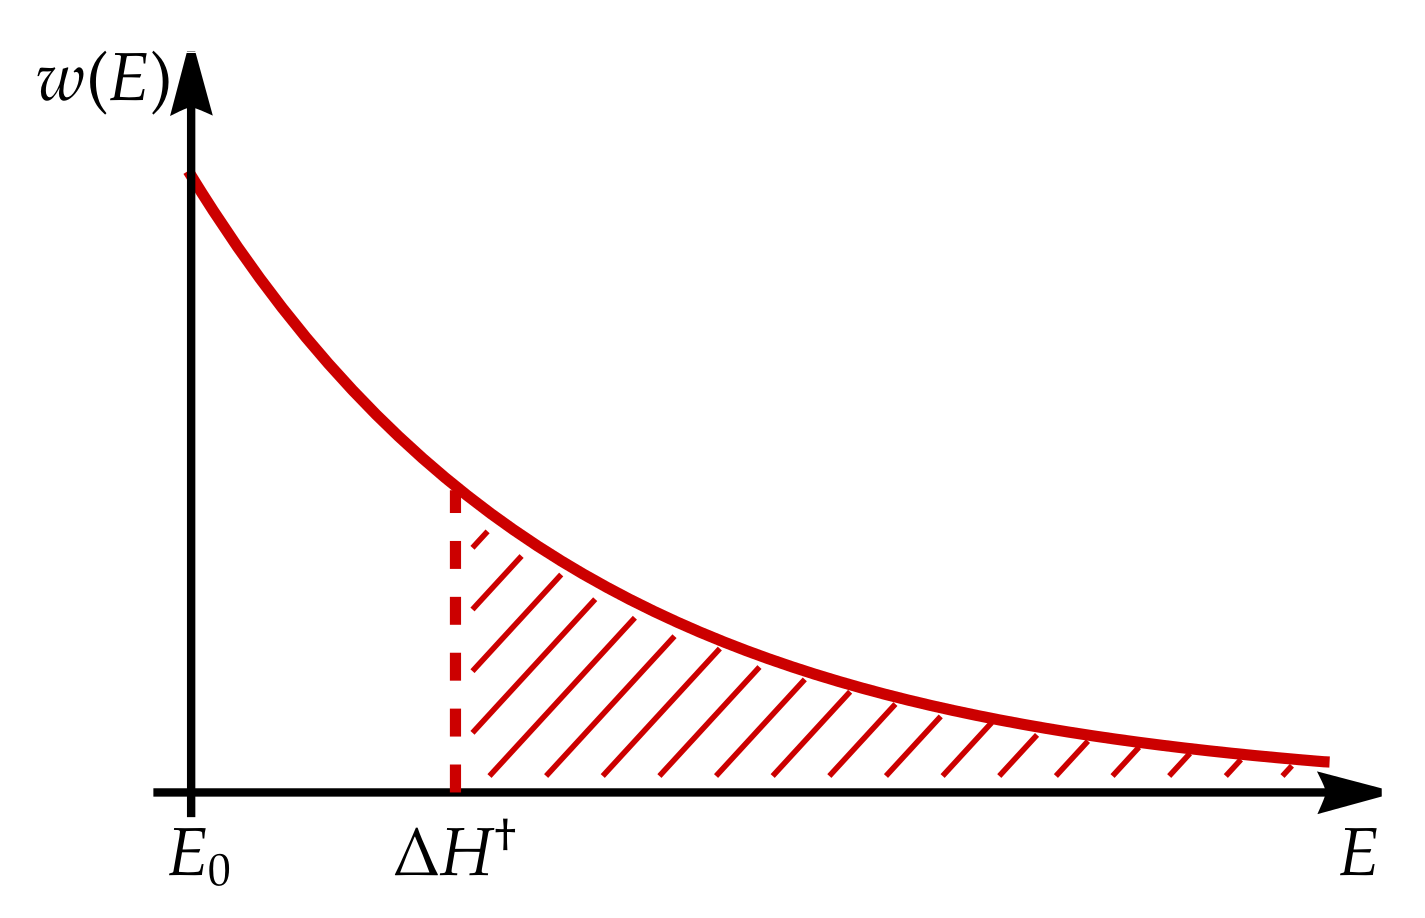
This intuitive description of the energy landscape of the reaction coordinate (schematically presented in Figure 3) allows us to calculate the rate of the reaction Equation (2). We start with the assumption that the reaction rate is proportional to the concentration of the particles involved in the reaction: the higher the concentration, the more likely the particles will approach the electrode surface and the more likely the reaction will occur. Second, only the particles that have high enough energy to overcome the enthalpy barrier can react. This energy is provided by thermal fluctuations. We know from thermodynamics that, in any system of finite temperature, the energy of the individual constituents is not at a fixed value, but is distributed among them according to the Boltzmann distribution [34]. From this, it follows (see Appendix B for the derivation) that the probability that a proton has sufficient energy to overcome the potential barrier Δ H is determined as
p E > Δ H = e Δ H k B T .
This rule can be used to determine the rate of proton adsorption to the electrode surface:
r 1 2 = c H + e H 2 H 1 k B T ,
r 2 3 = c H + e H 3 H 2 k B T .
and the probability that adsorbed protons form a transition state:
p 3 4 = e H 4 H 3 k B T .
The transformation from the transition state to the hydrogen molecule ( 4 5 ) and its desorption from the surface ( 5 6 ) reduces the enthalpy, so the process can be characterised by a constant probability p 4 6 , which can be absorbed in a rate factor k R e d . To calculate the actual reaction rate, we must further multiply the probabilities by the surface area of the electrode S on which the reaction takes place:
r R e d = k R e d S r 1 2 r 2 3 p 3 4 = = k R e d S c H + 2 e H 4 H 1 k B T = = k R e d S c H + 2 e Δ H k B T .
While the value of the factor k R e d can currently be determined ab initio by rather complex calculations (e.g., [35]), the detailed value is not crucial for the basic understanding we are trying to convey. Note that the reaction rate with respect to enthalpy levels depends only on the enthalpy difference between the transition and initial states:
Δ H = H 4 H 1 = Δ H c h + 2 ( 1 α ) e 0 U .
H c h = H c h , t r a n s H c h , i n i t denotes the difference in chemical enthalpy between the initial and transition states, while the exact enthalpies of the intermediate states are irrelevant at this level of detail.
For easier tracking of units, the expression Equation (16) is conventionally rewritten as a molar flux density j R e d = r R e d / S :
j R e d = γ R e d c H + c H + , r e f 2 e Δ H k B T = γ R e d c H + c H + , r e f 2 e Δ H c h + 2 ( 1 α ) e 0 U k B T ,
where we defined the activity coefficients of the species γ R e d = k R e d ( c H + , r e f ) 2 by multiplying the probability factor k R e d by a reference concentration of protons c H + , r e f [1]. This results in both the reaction rate j R e d and the reaction rate constant γ R e d being expressed as a molar flux density in units of m o l / ( m 2 s ) .
A similar procedure for constructing the reaction rate can be carried out for the oxidation direction of Equation (4), describing the decay of hydrogen into protons. The reaction rate will now be proportional to the concentration of hydrogen c H 2 and exponentially dependant on the difference in enthalpy between the transition state and the state of molecular hydrogen:
Δ H = H 4 H 6 = Δ H c h 2 α e 0 U .
Δ H c h = H c h , t r a n s H c h , f i n denotes the difference in chemical enthalpy between the transition and final state, and the term 2 α e 0 U describes how the enthalpy difference is affected by electrode charging. The oxidation reaction rate is then written similarly to Equation (18):
j O x = γ O x c H 2 c G , r e f e Δ H k B T = γ O x c H 2 c G , r e f e Δ H c h 2 α e 0 U k B T .
We again define the reference gas concentration c G , r e f to preserve the units of the reaction rate constant γ O x .
By combining both terms, we can calculate the overall rate of reaction Equation (2) as a difference between the reduction and oxidation reaction rate. To simplify the expression, we furthermore define species activities as a ratio between the actual and reference concentration a H + = c H + / c H + , r e f and a H 2 = c H 2 / c G , r e f . This results in
j = j R e d j O x = γ R e d a H + 2 e Δ H c h + 2 ( 1 α ) e 0 U k B T γ O x a H 2 e Δ H c h 2 α e 0 U k B T .
In this expression, we already see some terms, familiar from the Butler–Volmer Equation [1], namely terms 2 ( 1 α ) e 0 U and 2 α e 0 U in exponents. Most importantly, the rate and direction of reaction are affected by the electric potential difference U between the bulk electrolyte and the electrode, caused by the EDL. The increase in potential U will decrease the exponential term in the reduction direction and increase the exponential term in the oxidation direction, thus decreasing the consumption of protons, which is consistent with our previous explanation of protons being repulsed by the electric field in the EDL. The decrease in U will have the opposite effect: an increase in the reduction exponential term will promote the reaction of protons to hydrogen and suppress the hydrogen decay into protons.

3.3. Equilibrium Electric Potential

This raises an obvious question: Does the reaction ever reach equilibrium, and does it do so spontaneously? To answer these questions, we must also consider the changes in electrode potential due to the reaction taking place on its surface. The direction of the reduction of the reaction from protons to hydrogen also consumes electrons and, therefore, increases the potential of the electrically isolated electrode. This, in turn, decreases the rate of the reduction reaction and increases the rate of the oxidation reaction, thus decreasing the rate at which the potential on the electrode changes. In simple mathematical terms, the rate of change of the electric potential of the electrode can be described as
d U d t = 2 F S C e l j ,
where S is the electrode surface, C e l its capacitance, F the Faraday constant, and the factor 2 describes the number of electrons exchanged in the reaction.
Thus, the electric potential of the isolated electrode reaches equilibrium when the reduction and oxidation rates of the reaction are equal, j R e d = j O x , resulting in a net reaction rate of zero j = 0 . The equilibrium value of the electric potential, calculated from Equation (21), is
U e q = 1 2 e 0 H c h , i n i t + k B T log γ R e d a H + 2 H c h , f i n + k B T log γ O x a H 2 2 ,
resulting in electrochemical enthalpy landscape of the reaction Equation (2), schematically presented in Figure 4.
As we can see, the equilibrium electric potential U e q depends on the activities of the reactants and products in the system. For certain standard conditions, where the proton concentrations c H + and the hydrogen concentrations c H 2 are equal to their reference concentrations c H + , r e f and c H 2 , r e f , respectively, the activities are equal to unity. These conditions are used to define the standard equilibrium potential:
U 0 = 1 2 e 0 Δ H c h + k B T log γ R e d γ O x ,
which is almost proportional to the enthalpy difference between the initial state of two protons in the electrolyte and the final state of the hydrogen molecule Δ H c h = H c h , i n i t H c h , f i n , corrected by the logarithm of the ratio of the activity coefficients of the species γ R e d and γ O x . The potential difference can indeed be calculated by rather complex microscopic models, taking into account the detailed properties of the EDL and the interaction between the proton and the surrounding electrolyte, yielding a value U 0 = 4.44 ± 0.02 V [36]. The potential difference is indeed quite large and must be taken into account if we are trying to properly understand the microscopic conditions on the electrode surface.
However, how does this result relate to the value of the standard hydrogen electrode potential found in every chemistry textbook where U 0 = 0 V by definition? This question could best be answered by a direct measurement: put one measurement probe into the electrolyte, hold the other to the electrode, and measure the voltage. Unfortunately, such a measurement would not give us the answer we are looking for. When the voltage-measuring probe, which is necessarily made of an electrically conductive material, is dipped into the electrolyte, electrochemical processes very similar to those just explained would take place on its surface, causing an EDL to form and, thus, increasing its electric potential compared to the bulk electrolyte. Therefore, it is in the nature of the system we want to study that we cannot measure the potential of the bulk electrolyte. All we can do is measure the potential differences between different electrodes, all shifted from the electrolyte potential by a certain EDL voltage shift. From this point of view, it makes sense to define the standardised hydrogen electrode as the reference point to which other types of electrodes are compared.

3.4. Nernst Equation

Now, let us answer the question: How does the equilibrium electrode potential change when the concentration of the reactants is shifted from their reference values? The intuitive picture developed so far can easily support the answer to this question. If the EDL serves as a barrier that prevents protons from reacting with electrons in the metal, a higher proton concentration requires a higher EDL potential difference for the equilibrium state to be reached. On the other hand, a higher hydrogen concentration causes more hydrogen molecules to dissociate into protons and donate the missing electrons to the electrode, decreasing the equilibrium electrode potential.
This equilibrium can be expressed mathematically by Equation (23), which we simplify by expressing the enthalpy difference Δ H c h = H c h , i n i t H c h , f i n in terms of U 0 . This yields the well-known Nernst equation [1]:
U e q = U 0 + R T 2 F log a H + 2 a H 2 ,
where we multiply the numerator and denominator of the logarithm prefactor by the Avogadro constant N A and apply the definitions R = k B N A and F = e 0 N A .
From this derivation, it is clear that the equilibrium potential changes with the concentration of the species, since they affect the reduction and oxidation reaction rate, which is proportional to their concentration. It should be noted, however, that this potential is only reached at electrically isolated electrodes at equilibrium and in the absence of side reactions, e.g., reduction of the potential in reactions with the crossover gasses, and that it has no real physical significance under conditions where either net reduction or oxidation occurs.

3.5. Butler–Volmer Equation

As explained phenomenologically in Section 3.1 and mathematically in Equation (22), the electric potential at the electrode tends to stabilise at some equilibrium potential. Any imbalance in the reduction or oxidation reaction rate will result in either an accumulation or deficit of electrons in the electrode, causing a shift in the electric potential, which quickly leads to the equilibrium reaction. Therefore, if we want to achieve a steady rate of reaction, we need to provide an external potential that will force the system out of equilibrium. This can be achieved by adding or removing additional electrons from the electrode via an external voltage or current source.
It is convenient to express the reaction rate in terms of the overpotential η = U U 0 , which denotes the difference between the actual electrode potential U and the standard equilibrium potential U 0 . Note that the constant value U 0 (Equation (24)), chosen as the reference value, is unaffected by the Nernst potential shift (Equation (25)), making the final result easier to understand in terms of the effects of concentration on the reaction rates.
Putting U = U 0 + η in Equation (21) and using U 0 from Equation (24), then after some simplification, one arrives at the following expression:
j = γ O x γ O x γ R e d α e α Δ H c h Δ H c h k B T a H + 2 e 2 ( α 1 ) e 0 η k B T a H 2 e 2 α e 0 η k B T .
We make a further simplification by defining the exchange current density j 0 as
j 0 = γ O x γ O x γ R e d α e α Δ H c h Δ H c h k B T ,
which is completely defined by the properties and energy levels of the reaction and is independent of the electric potential U. This leads to a standard form of the Butler–Volmer reaction:
j = j 0 a H + 2 e 2 ( 1 α ) F η R T a H 2 e 2 α F η R T ,
known from chemistry textbooks. From this form, we can clearly see how increasing or decreasing the electric potential U affects the reaction rate. When U is increased above U 0 ( η > 0 ), the exponent in the second term increases, promoting the reaction from hydrogen to protons. At the microscopic level, the hydrogen more willingly donates its electrons to the more-positively charged electrode and, therefore, more easily decomposes to protons. The protons, on the other hand, are repelled by a higher potential, and their reaction with the electrons in the electrode is, therefore, suppressed. If the potential is lowered ( η < 0 ), the situation is reversed. A lower EDL potential barrier repels protons less effectively, allowing them to react more readily with electrons to form hydrogen. The hydrogen, in turn, is less willing to donate its electrons to a negatively charged electrode and is, therefore, more likely to remain in its molecular form.
The charge transfer coefficient α , defined in Section 3.1, determines how much the changes in electric potential described above affect the reduction and oxidation reaction rates. When α is close to 1, the energy of the transition state behaves similarly to that of the initial state, resulting in the difference between them remaining nearly constant, so that the rate of the reduction reaction is not significantly affected. In this case, the energy difference between the transition and final states changes significantly, so the electric potential has a strong effect on the oxidation reaction rate. For α close to zero, the situation is just the opposite. The energy of the transition state remains constant regardless of the electric potential, resulting in an unchanged oxidation reaction rate and a strongly affected reduction reaction rate.
The Butler–Volmer equation can also be expressed in a slightly modified form by comparing the potential U with the Nernst equilibrium potential U e q Equation (25) instead of the standard equilibrium potential U 0 Equation (24). The reaction rate Equation (28) in this case can be expressed as
j = j 0 * e 2 ( 1 α ) F ( U U e q ) R T e 2 α F ( U U e q ) R T .
where the exchange current density:
j 0 * = γ R a H 2 a H 2 γ R a H + 2 γ D α e α Δ H c h Δ H c h k B T
depends on the concentrations of the chemical species. While this form is sometimes more convenient for calculations, note that, in this notation, both the equilibrium potential U e q and the exchange current density j 0 * are functions of the activities of the reactant and the product, making understanding their effects on the reaction rate less intuitive.

3.6. Electrochemical Processes in the Fuel Cell Anode Catalyst Layer

We will now apply the knowledge gained so far to the anode catalyst layer of the hydrogen fuel cell. The goal is to propose some simple equations describing how the anode processes affect the temporal dynamics of the hydrogen concentration c H 2 , a n , the proton concentration c H + , a n , and the anode EDL potential difference U a n = U a n , e l U a n , i o n .
In the hydrogen fuel cell, the hydrogen oxidation reaction takes place on the anode catalyst layer, consuming the hydrogen and transforming it to protons, so that the reaction rate:
j a n = j 0 a H + , a n 2 e 2 ( 1 α ) F ( U a n U 0 ) R T a H 2 , a n e 2 α F ( U a n U 0 ) R T
should be negative j a n < 0 . As explained in the previous section, this requires that the electric potential on the anode U a n be greater than the equilibrium potential U a n > U 0 . The removal of electrons from the anode, required to reach such a potential, is achieved by the external electric current from the cathode to the anode, which is explained in more detail in Section 7.
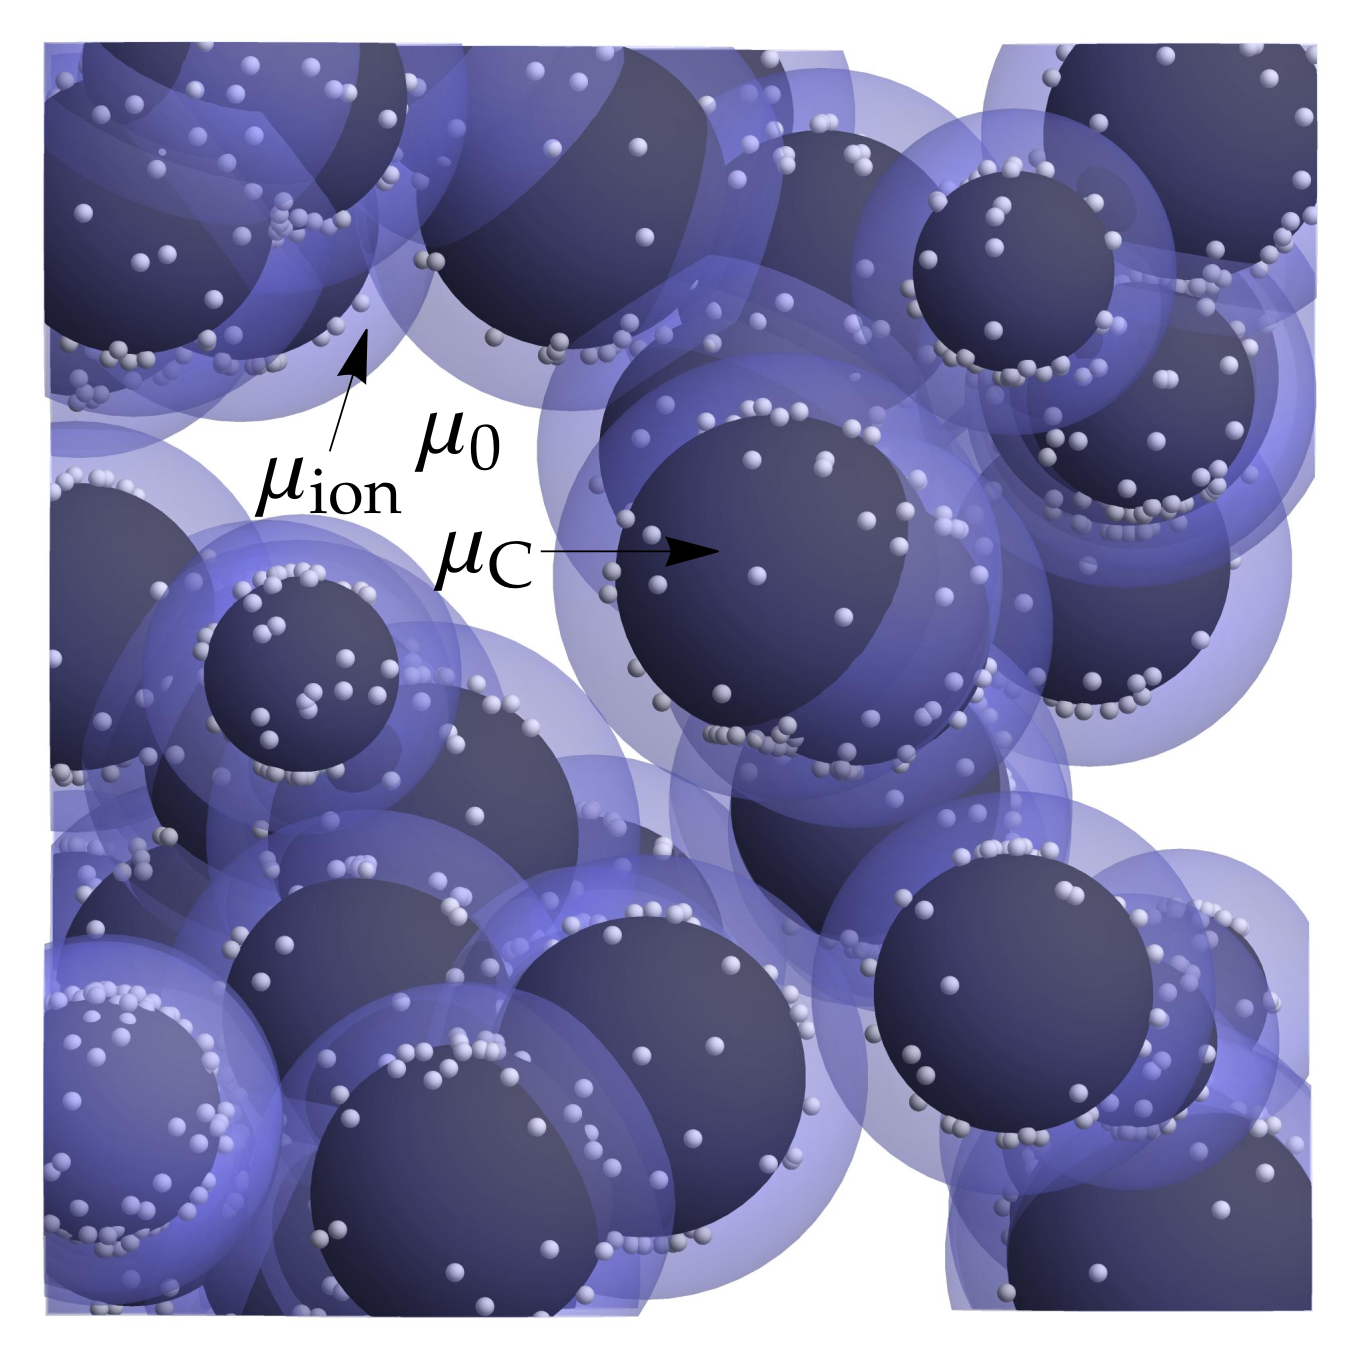
When this condition is met, hydrogen is consumed in an electrochemical reaction to produce protons and electrons. To describe how the process affects the concentrations of these three species, we modelled the anode catalyst layer as a porous structure with thickness d c a t , volumetric ratio of ionomer material μ i o n , and volumetric ratio of void space μ 0 . The rest of the volume μ C is filled with catalyst material, which in low-temperature fuel cells typically consists of Pt nanoparticles dispersed on the surface of the highly porous carbon support structure. The structure of the catalyst is schematically presented in Figure 5. The electrochemically active catalyst surface area of the electrode:
S E C = S F C × ρ P t L o a d × E S A ,
can be estimated from the macroscopic fuel cell surface area S F C ( m 2 ) , the Pt loading ρ P t L o a d ( g/m 2 ) , which describes the total mass of Pt dispersed over the specific FC surface, and the catalyst electrochemical surface area E S A ( m 2 /g), which describes the catalyst surface per mass of the dispersed catalyst. This quantity mainly depends on the size of catalyst particles r P t and can be estimated as E S A = 3 ρ P t r P t [37], where ρ P t is the bulk density of platinum.
To describe how the hydrogen concentration in the catalyst layer changes with time, we multiply the electrochemical reaction rate Equation (28) by the catalyst surface area to calculate the molar consumption rate and divide it by the void volume accessible to hydrogen within the catalyst layer V 0 = V c a t μ 0 , where V c a t = S F C d c a t is the total volume of the catalyst layer:
d c H 2 , a n d t E C = S E C V 0 j a n .
Note that the anode reaction rate in the fuel cell j a n < 0 , so the hydrogen concentration decreases.
The proton concentration is determined by a similar equation:
d c H + , a n d t E C = S E C V i o n j a n ,
but with a different accessible volume V i o n = V c a t μ i o n , since the protons are in the ionomer.
The concentration of electrons is reflected in electric charging of the electrode. Since the thickness of the EDL ( d E D L ) over which the potential drop occurs is relatively small compared to the electrochemically active surface area of the electrode S E C , the anode can effectively be described as a planar capacitor with linearly proportional charge and electric potential: e = C U . The anode capacitance C a n is estimated as
C a n = S E C ε ε 0 d E D L ,
where ε 0 is the vacuum permittivity and ε is the dielectric constant of the ionomer. The rate of change of the electric potential of the anode due to the electrochemical reaction is obtained by dividing the electric current due to the electrochemical reaction I E C = d e E C d t = 2 F S E C j a n , which describes the rate of charge transfer, by the capacitance C a n :
d U a n , e l d t E C = I E C C a n = 2 F d E D L ε ε 0 j a n .
Therefore, an electrochemical reaction in which hydrogen is consumed to produce protons and electrons tends to reduce the electric potential at the anode, which in turn decreases the rate of the electrochemical reaction Equation (31). If no external current is provided to the anode, such as, for example, in open-circuit fuel cell operation, the potential decreases to the equilibrium potential defined by the Nernst Equation (25), and the electrochemical reaction stops.
Equations (33), (34), and (36) describe the effects of the electrochemical reactions in the anode on the concentrations of hydrogen and protons and the electric charging of the anode electrode. Note that these quantities are also affected by other physical processes in the fuel cell, such as diffusion and conduction, which are discussed in more detail in Section 5, Section 6 and Section 7.

4. Cathode Electrochemical Processes

4.1. Kinetic Model of Cathode Reaction Rates

In this section, we describe what happens to the electrons and protons produced in the anode electrochemical reaction when they approach the cathode electrode where an additional species, oxygen, is introduced. We will use the understanding of electrochemical processes obtained in Section 3 on a simpler example of a hydrogen electrode to describe a more-complex electrochemical reaction that occurs at the cathode electrode to explain the reaction between protons and electrons in the presence of oxygen. The details of the transport of protons and electrons from the anode to the cathode are discussed in detail in Section 6 and Section 7.
Because there are more species involved in the cathode reaction, namely protons H + , electrons e , and oxygen O 2 , the cathode’s chemistry is richer and more than one reaction can occur. The best-known is the four-electron oxygen reduction reaction (ORR), which leads to the formation of water:
O 2 + 4 H + + 4 e 2 H 2 O .
In the anode reaction example in Section 3, the rate of the electrochemical reaction was determined by the concentrations of the reactants and their probability of forming a transition state, which in turn was determined by the enthalpy values of the chemical states involved in the reaction. We followed the same line of reasoning also for the cathode case. Note that the enthalpies for the cathode reaction are denoted as H c to distinguish them from the anode term H.
The initial and final states are well-defined, and so are their enthalpies, H i n i t c and H f i n c , respectively, which, similar to the anode reaction, change with the electrode potential U in proportion to the charge transferred during the reaction, which is for ORR equal to 4 e 0 :
H i n i t c = H c h , i n i t c 4 e 0 U ,
H f i n c = H c h , f i n c .
The transition between the initial and final states, however, is now much more complex compared to the anode reaction and involves different intermediate states of molecular and atomic oxygen adsorbed on the electrode surface with different numbers of protons bound to them. The reaction can, therefore, proceed along different reaction pathways, and more importantly, the oxygen reduction and water oxidation pathways can differ significantly, as shown by DFT calculations, e.g., in Anderson et al. [38]. Therefore, an accurate description of reaction rates corresponding to the ORR would require the inclusion of various reaction steps and the calculation of the concentration of all intermediate species. However, as we learned in the derivation of the HOR rate in Section 3, even if several intermediate states are involved, the reaction rate is determined only by the concentration of reactants and the largest increase in enthalpy H c encountered in the reaction, required to form the so-called rate-limiting transition state. In complex reactions such as the ORR, the reduction and oxidation pathways can have different rate-limiting transition states with different enthalpies, as shown schematically in Figure 6.
Regardless of the exact details of the relevant reaction pathway, we labelled the enthalpy of the reduction transition state by H t r a n s , R e d c and assumed that it varies with electrode potential U as
H t r a n s , R e d c = H c h , t r a n s , R e d c 4 α R e d e 0 U ,
where the charge transfer coefficient 0 < α R e d < 1 describes how the enthalpy of the relevant transition state changes with electrode potential U.
The enthalpy of the transition state relevant to the oxidation direction is described in a similar way:
H t r a n s , O x c = H c h , t r a n s , O x c 4 α O x e 0 U ,
with charge transfer coefficient 0 < α O x < 1 .
Based on the results from Section 3, we constructed the reaction rates of the cathode reactions in the reduction j c a t , R e d and oxidation j c a t , O x directions by multiplying the concentrations of the reactants with the exponential of the appropriate enthalpy difference:
j c a t , R e d = γ R e d c a O 2 a H + 4 e Δ H c k B T .
j c a t , O x = γ O x c a H 2 O 2 e Δ H c k B T .
The reaction rate is proportional to the activities of the relevant species ( a H + = c H + / c H + , r e f , a O 2 = c O 2 / c G , r e f , a H 2 O = c H 2 O / c G , r e f ) and exponential to the enthalpy difference between the relevant intermediate states.
The enthalpy difference again depends on the electrode potential U:
Δ H c = H t r a n s , R e d c H i n i t c = Δ H c h c + 4 ( 1 α R e d ) e 0 U ,
Δ H c = H t r a n s , O x c H f i n c = Δ H c h c 4 α O x e 0 U ,
schematically presented in Figure 6. As in the anode case, Δ H c h c = H c h , t r a n s , R e d c H c h , i n i t c and Δ H c h c = H c h , t r a n s , O x c H c h , f i n c denote the chemical enthalpy differences at the electrically neutral electrode.
The total rate of the electrochemical reaction of the cathode at the charged electrode is calculated as the difference between the reduction and oxidation reaction rates:
j c a t = j c a t , R e d j c a t , O x = γ R e d c a O 2 a H + 4 e Δ H c h c + 4 ( 1 α R e d ) e 0 U k B T γ O x c a H 2 O e Δ H c h c 4 α O x e 0 U k B T .
The expression can be simplified considerably by introducing the equilibrium potential, where the net reaction rate is zero. As at the anode, the reduction reaction consumes electrons and, thus, charges the electrode positively. This in turn increases the enthalpy difference Δ H c and suppresses the reduction reaction rate, while at the same time, Δ H c decreases and, thus, increases the oxidation reaction rate. Under standard conditions, i.e., at a H + = a O 2 = a H 2 O = 1 , the reactions equalise at a potential:
U 0 c = Δ H c h c Δ H c h , t r a n s c + k B T log γ R e d c γ O x c 4 e 0 ( 1 Δ α ) ,
dominated mainly by the enthalpy difference between the initial and final states Δ H c h c = H c h , i n i t c H c h , f i n c , but is also affected by the difference in the transition state enthalpies Δ H c h , t r a n s c = H c h , t r a n s , R e d c H c h , t r a n s , O x c . If both the reduction and oxidation reactions have the same rate-limiting transition state, as is the case for the HOR, the term Δ H c h , t r a n s c simply vanishes. The standard equilibrium potential is also affected by the difference in the charge transfer coefficients Δ α = α R e d α O x .
The value of the standard equilibrium potential of the reaction Equation (37) is U 0 c = 1.23 V compared to the standard hydrogen electrode reaction Equation (2) because the energy released in the reaction of protons with oxygen, which produces water, is higher than in the reaction of protons to hydrogen molecules. The change in electric potential across the EDL at the cathode electrode is, therefore, greater than at the anode electrode. The absolute value is obtained as the sum of the EDL potential of the standard hydrogen electrode and the relative cathode potential compared to SHE: U 0 c 1.23 V + 4.44 V = 5.67 V.
The Nernst potential for the four-electron oxygen reaction is determined in a manner similar to the standard equilibrium potential, but with nonstandard concentration values, resulting in the following formula:
U e q c = U 0 c + R T 4 F ( 1 Δ α ) log a O 2 a H + 4 a H 2 O 2 .
The equilibrium potential increases with oxygen and proton activity because greater electrical repulsion is required to suppress the reaction when more protons are present, similar to the case of the anode reaction.

4.2. Butler–Volmer Equation

The Butler–Volmer equation for the cathode reaction rate is obtained by expressing the transition state enthalpies in terms of the standard equilibrium potential, which simplifies Equation (46) to
j c a t = j R e d , 0 c a O 2 a H + 4 e 4 ( 1 α R e d ) F η c R T j O x , 0 c a H 2 O 2 e 4 α O x F η c R T ,
where the overpotential η c = U U 0 c is expressed as the difference between the actual potential U and the standard equilibrium potential for the cathode reaction U 0 c . Note that the exchange current densities are now different for the reduction and oxidation parts of the equation:
j R e d , 0 c = k 0 γ R e d γ O x γ R e d 1 α R e d 1 Δ α ,
j O x , 0 c = k 0 γ O x γ O x γ R e d α O x 1 Δ α ,
with
k 0 = exp α O x ( H c h , i n i t c H c h , t r a n s , R e d c ) + ( 1 α R e d ) ( H c h , f i n c H c h , t r a n s , O x c ) k B T ( 1 Δ α ) .
The reaction rate constants j R e d , 0 c and j O x , 0 c are defined by the detailed structure of the transition states of the reaction, but are independent of the concentration of the reactants and products or the electric potential of the electrode. The effects of concentrations and potential are expressed in a very similar way to the anode Butler–Volmer Equation (31): The reaction rate in each direction is proportional to the concentration of the relevant species with the corresponding power law and exponentially dependent on the overpotential η c . In the fuel cell, the reaction proceeds in the direction of reduction, consuming oxygen and hydrogen and producing water, which requires a potential that is lower than the equilibrium potential U < U 0 c ( η c < 0 ), as indicated by the negative exponential in the first term of Equation (49). When the potential U is higher than U 0 c ( η c > 0 ), the direction may reverse and promote the dissociation of water into protons and oxygen, which is the case in electrolyzer systems.

4.3. Electrochemical Processes in Fuel Cell Cathode Catalyst Layer

The electrochemical reactions at the cathode electrode of the fuel cell take place in an environment similar to that at the anode side, i.e., in a catalyst layer consisting of porous-carbon-supported catalyst particles mixed with the ionomer. For simplicity, we assumed the same proportions of catalyst ( μ C ), ionomer ( μ i o n ), and void volume ( μ 0 ), and the same catalyst thickness in both the anode and cathode catalyst layers.
The cathode electrochemical reaction rate:
j c a t = j R e d , 0 c a O 2 , c a t a H + , c a t 4 e 4 ( 1 α R e d ) F ( U c a t U 0 c ) R T j O x , 0 c a H 2 O 2 e 4 α O x F ( U c a t U 0 c ) R T ,
depends on and affects the concentrations of all three species involved: oxygen ( c O 2 , c a t = a O 2 , c a t c G , r e f ), water ( c H 2 O = a H 2 O c G , r e f ), and protons ( c H + , c a t = a H + , c a t c H + , r e f ), and on the potential difference between the cathode catalyst and ionomer U c a t = U c a t , e l U c a t , i o n .
Similar to the anode catalyst layer, the rates of electrochemical consumption or production in the cathode catalyst layer are expressed as time derivatives of concentrations:
d c O 2 , c a t d t E C = S E C V c a t μ 0 j c a t ,
d c H + , c a t d t E C = 4 S E C V c a t μ i o n j c a t ,
d c H 2 O , c a t d t E C = + 2 S E C V c a t μ V j c a t .
In addition to electrochemical production and consumption, the concentrations are also affected by the diffusion of gases from the GDL and the conduction of protons through the membrane, which will be discussed in more detail in Section 5 and Section 6.
The consumption or production of electrons is expressed similarly to the anode side by treating the EDL as a capacitor, resulting in a change in electric potential:
d U c a t , e l d t E C = 4 F d E D L ε ε 0 j c a t .
During fuel cell operation, oxygen, protons, and electrons are consumed in the cathode catalyst, resulting in a positive value of j c a t and increasing the electric potential of the cathode U c a t , e l . When no external electric current flows through the cell, the potential increases until it reaches the value determined by the species concentration via the Nernst Equation (48) when the reaction stops. However, under actual operating conditions, the external electric current flows from the cathode to the anode (see Section 7), ensuring a sufficiently low electric potential U c a t , e l to maintain the positive sign of the cathode reaction j c a t . The dynamics of the electric potential U c a t , i o n of the catalyst ionomer is discussed in in more detail in Section 6.

5. Gaseous Species Transport

As explained in the previous section, oxygen and hydrogen are consumed and water is produced during fuel cell operation. Where do these species come from, and how are they transported to the catalyst layer where they react?
The reactants and products involved in the electrochemical processes in the fuel cell are in gaseous form at the temperatures at which fuel cells normally operate. The reactants are fed to the fuel cell through the gas feed channels from which they travel through the gas diffusion layer (GDL) to the catalyst layer [39]. The transport is driven by concentration and pressure differences. At the anode, hydrogen is consumed in the reaction, resulting in a lower pressure in the catalyst layer compared to the pressure in the channel. Detailed modelling of gas diffusion can be quite complicated due to the porous structure of the GDL [40], but the main causal relationship can still be described by modelling a molar flux proportional to the concentration difference:
j H 2 , d i f = D G D L , a n d G D L , a n ( c H 2 , c h c H 2 , a n ) ,
where D G D L , a n and d G D L , a n denote the effective GDL diffusivity and thickness, respectively, and c H 2 , c h is the hydrogen concentration in the gas feed channel.
The transport processes on the cathode side are similar, with the oxygen being transported from the gas feed channel to the catalyst:
j O 2 , d i f = D G D L , c a t , O 2 d G D L , c a t ( c O 2 , c h c O 2 , c a t ) .
Water transport is more complex because the phase change from the gaseous to the liquid state can lead to a variety of additional phenomena within the GDL [26]. However, from the simple perspective of causal relations, we also modelled this transport by a simple effective diffusion:
j H 2 O , d i f = D G D L , c a t , H 2 O d G D L , c a t ( c H 2 O , c h c H 2 O , c a t ) ,
where the effective diffusion coefficient for water D G D L , c a t , H 2 O is different from the oxygen coefficient D G D L , c a t , O 2 .
Diffusion fluxes replenish the reactants consumed in the electrochemical reaction and dispose of the products from the catalyst layer. The following equations describe their effects on the concentrations of species in the catalyst layer:
d c H 2 , a n d t d i f = j H 2 , d i f d c a t μ 0 ,
d c O 2 , c a t d t d i f = j O 2 , d i f d c a t μ 0 ,
d c H 2 O , c a t d t d i f = j H 2 O , d i f d c a t μ 0 ,
where d c a t denotes the catalyst layer thickness, and we assumed that gasses reside only in the void fraction μ 0 of the catalyst layer. For simplicity, we assumed the same catalyst properties on the anode and cathode sides.
The transport of reactants plays a crucial role in fuel cell performance at high current densities when their consumption in electrochemical reactions is high. Since the lowest possible value of oxygen and hydrogen concentrations in the catalyst is zero, the transport fluxes Equations (58) and (59) are theoretically limited by values j H 2 , d i f , m a x = D G D L , a n d G D L , a n c H 2 , c h and j O 2 , d i f , m a x = D G D L , c a t , O 2 d G D L , c a t c O 2 , c h . As this limit is approached, the concentration of reactants in the catalyst decreases due to an imbalance between electrochemical consumption and diffusion transport, leading to a depletion of reactants and, consequently, a decrease in electrochemical reaction rates.

6. Proton Transport in the Fuel Cell Membrane

We already explained in Section 3.6 how the protons are produced in the electrochemical reaction in the anode catalyst layer when the hydrogen concentration and electrical potential are sufficiently high and, in Section 4.3, how the protons are consumed in the cathode catalyst layer. Therefore, to maintain a steady reaction, the protons must be transferred from the anode to the cathode side of the fuel cell.
In the hydrogen fuel cell, protons are transported across a proton-conducting membrane that prevents (or minimises) the transport of gaseous species, i.e., hydrogen and oxygen, but allows the transport of protons. In principle, proton transport can occur via two mechanisms: diffusion, caused by the gradient of the proton concentration, or electric conduction, where proton movement is forced by the internal electric field in the membrane. In real systems, the diffusivity of protons is relatively low compared to the conductivity, so the main mechanism of proton transport is electric conduction [3].
This raises the question: Where does the electric field come from that forces the transport of protons? To answer this question, we need to understand the basic properties of the proton-conducting polymers from which the membrane is made. The polymer consists of long perfluorinated chains of carbon atoms in which side chains are attached [41]. These side chains end with sulphonic groups ( S O 3 H ) from which the proton can easily detach when the membrane is sufficiently hydrated. This leads to a fixed volume concentration c S O 3 of immobile negatively charged S O 3 groups, which is overlaid by the concentration of positively charged protons H + , c H + , which can move through the membrane material. At equilibrium, the concentrations of both species are equal c S O 3 = c H + , resulting in a net electric charge concentration of zero:
ρ e = F ( c H + c S O 3 ) = 0 ,
where the Faraday constant F transforms the molar concentration to the electric charge density.
When an electrochemical reaction takes place in the fuel cell, the local proton concentration on the electrode surface changes: the concentration increases on the anode surface and decreases on the cathode surface. This leads to a local change in the net electric charge concentration:
ρ e , a n = F ( c H + , a n c S O 3 ) > 0 ,
ρ e , c a t = F ( c H + , c a t c S O 3 ) < 0 .
This electric charge is a source of the electric field according to Gauss’s law:
· E = ρ e ε ε 0 ,
where ε is the value of the dielectric constant within the electrolyte.
If we assume that the fuel cell catalyst layer is relatively thin compared to the fuel cell surface area, the charge density due to proton concentration imbalance can be effectively expressed as the surface charge density σ e l = ρ e l d c a t μ i o n , where d c a t is the catalyst thickness and μ i o n is the ionomer volumetric ratio. The anode and cathode catalyst layers can then be seen as two parallel plates of a plate capacitor, with the charges on the plates producing a combined electric field of magnitude:
E m e m = E a n E c a t = σ e l , a n σ e l , c a t 2 ε ε 0 ,
pointing from the anode to the cathode. The difference between the charge densities σ e l , a n σ e l , c a t can be expressed by the proton concentrations c H + , a n and c H + , c a t using Equations (65) and (66) as
σ e l , a n σ e l , c a t = F d c a t μ i o n c H + , a n c H + , c a t .
The electric potential drop across the membrane is calculated as the product of the electric field and the membrane thickness d m e m :
U m e m = E m e m d m e m = F d m e m d c a t μ i o n ( c H + , a n c H + , c a t ) 2 ε ε 0 .
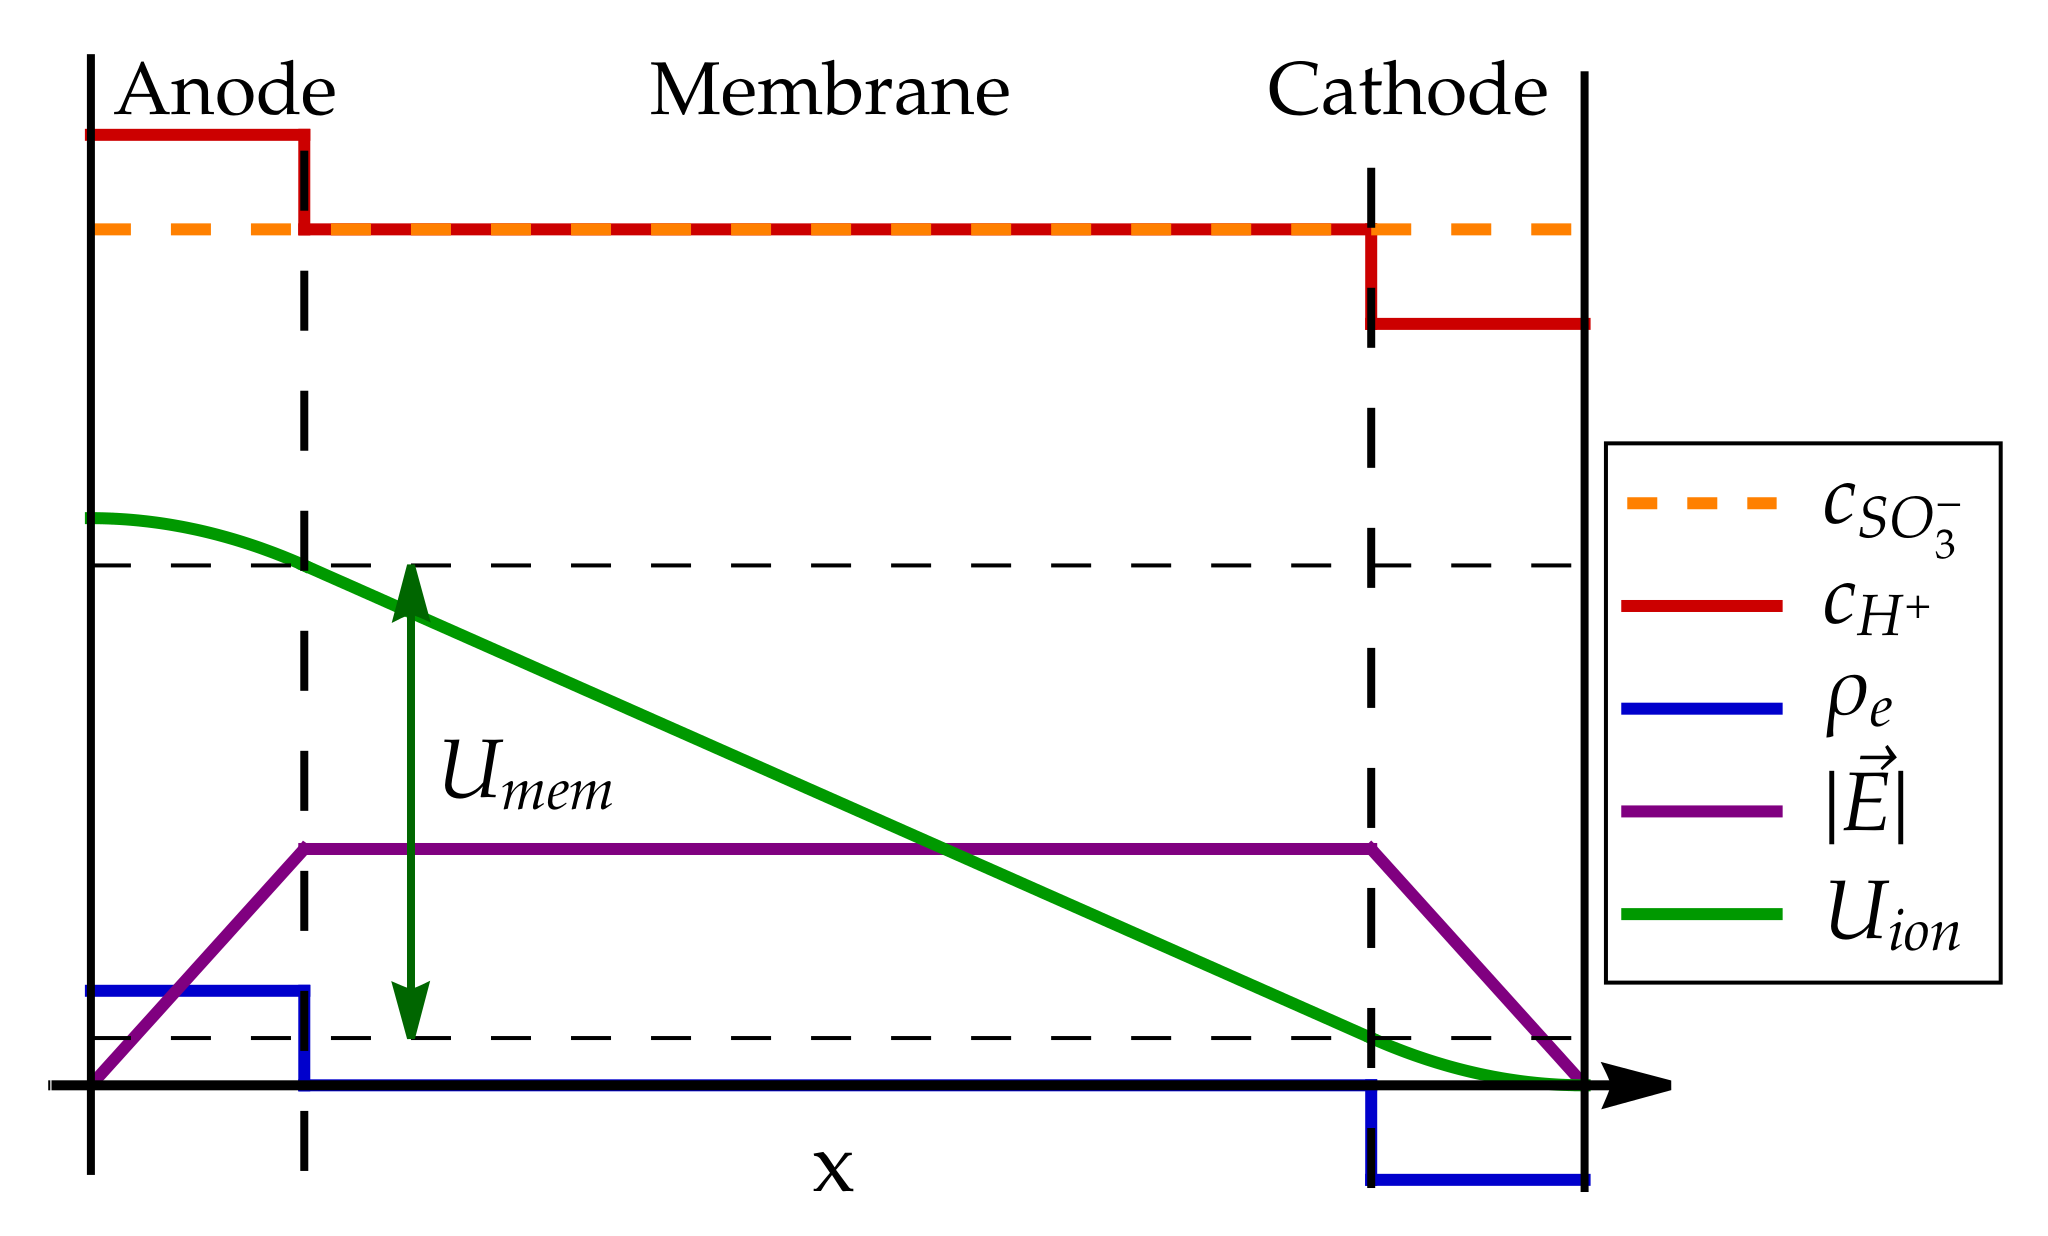
Note that this electric field is completely contained within the electrolyte and is shielded from the external electric field by the EDL. The field is, therefore, distinct from the electric field between the anode and the cathode electrode outside the fuel cell, which points from the cathode towards the anode. The electric field and electric potential profile through the MEA is schematically presented in Figure 7.
The electric potential in the membrane affects the fuel cell dynamics in two ways. As explained in Section 3.6 and Section 4.3, the electrochemical reaction rates depend on the electric potential difference between the electrode and ionomer, U = U e l U i o n . The membrane potential U m e m creates the difference in ionomer potential between the anode and cathode sides U m e m = U i o n , a n U i o n , c a t . Since the zero value of the electric potential can be chosen arbitrarily, we can set the ionomer potential on the cathode surface to zero U i o n , c a t = 0 and calculate the ionomer potential on the anode surface as
U i o n , a n = F d m e m d c a t μ i o n ( c H + , a n c H + , c a t ) 2 ε ε 0 = U m e m .
Thus, the ionomer electric potentials U i o n , a n and U i o n , c a t depend directly on the concentrations of protons c H + , a n and c H + , c a t in the anode and cathode catalyst layers.
In addition to changing the ionomer potential, the electric field in the electrolyte also causes an electric force on charged particles, in this case protons, forcing them to move in the direction of the field, i.e., from the anode to the cathode, resulting in an electric current density j H + , e l = σ H + E , where σ H + is the conductivity of the electrolyte. The molar flux of protons is proportional to the electric current: j H + = j H + , e l F , which can, therefore, be related to the membrane voltage drop U m e m Equation (70):
j H + = σ H + U m e m d m e m F = σ H + d c a t μ i o n ( c H + , a n c H + , c a t ) 2 ε ε 0 .
This equation shows that the transport of protons is a direct result of the imbalance between the proton concentration in the anode and the cathode, which creates the electric field in the electrolyte.
The proton flux leads to the balancing of the proton concentrations in the catalyst layers:
d c H + , a n d t m e m = j H + d c a t μ i o n = σ H + ( c H + , a n c H + , c a t ) 2 ε ε 0 ,
d c H + , c a t d t m e m = + j H + d c a t μ i o n = σ H + ( c H + , a n c H + , c a t ) 2 ε ε 0 .
The characteristic time of this relaxation τ = ε ε 0 / σ H + can be estimated from the electrolyte conductivity and the dielectric constant. For Nafion with σ H + 5 S/m [2] and ε 20 [42], the relaxation is fast, τ 10 10 s, indicating that any inhomogeneity in proton concentration inside the membrane is almost immediately balanced out. Therefore, the imbalance in electric charge caused by the difference in proton and sulphonic group concentration can only occur very close to the electrode surface where the protons are generated or consumed. This justifies our assumption that the net electric charge density inside the membrane is zero and that the system can, therefore, be effectively described as a planar capacitor. The magnitude of the proton concentration deviations can be estimated from the typical electric current density in the fuel cell j e l 10 4 A/m 2 using Equation (72), resulting in ( c H + , a n c H + , c a t ) 10 6 mol/m 3 , which is very small compared to the concentration of protons and sulphonic groups in Nafion c n a f 1800 mol/m 3 [41].
Short relaxation times and small concentration differences show that the proton concentration in the membrane can be considered homogeneous in most cases, and the modelling of its dynamics can usually be avoided, unless the model aims at describing the dynamics in the frequency range ν > 10 10 Hz. However, the explanation of these processes is important to understanding the causal chain between proton production and consumption in the catalyst layer and the mechanism of their transport inside the membrane.

7. Electron Transport

As explained in Section 3 and Section 4, the electrochemical reactions at the anode and cathode in the fuel cell are a source and sink of electrons that cause a change in the electric potential of the electrodes. The equilibrium electric potential for the electrochemical reaction at the cathode is higher than at the anode, resulting in an electric potential difference between the cathode and anode, which can be used to extract useful electric work from the fuel cell. The electric voltage of the fuel cell is equal to the electric potential difference between the cathode and anode U F C = U c a t , e l U a n , e l . The electric current through the external load with resistance R connected to the fuel cell is then
I = U F C R .
This current results in potentially useful electric work performed on the load P = I U F C . From the point of view of electrochemical processes in the fuel cell, the electric current I represents an additional sink and source of electrons in the anode and cathode electrodes, affecting their electric potential as follows:
d U a n , e l d t e l = + I C a n ,
d U c a t , e l d t e l = I C c a t ,
with C a n and C c a t introduced previously in Section 3.6 and Section 4.3, respectively. By combining these two equations with electrochemically induced changes in the electrode potential, the time evolution of the potential at each of the electrodes can be calculated.
It is instructive to write the fuel cell voltage U F C also in terms of voltage drops across the anode and cathode EDL and across the membrane Equation (5), which leads to the expression:
U F C = U c a t , e l U a n , e l = U c a t + U i o n , c a t U a n U i o n , a n = U c a t U a n U m e m ,
which makes it clear that the fuel cell voltage U F C is affected by both the electrochemical reaction rates and the proton transport in the membrane. In terms of the anode and cathode overpotentials η a n = U a n U 0 and η c a t = U c a t U 0 c , the fuel cell voltage can be written as follows:
U F C = U F C , 0 η a n + η c a t U m e m ,
where we defined the ideal fuel cell voltage U F C , 0 = U 0 c U 0 = 1.23 V. The actual voltage is smaller than the ideal value because of the anode overpotential η a n > 0 , the cathode overpotential η c a t < 0 and the membrane potential drop U m e m > 0 .

8. Modelling Results and Discussion

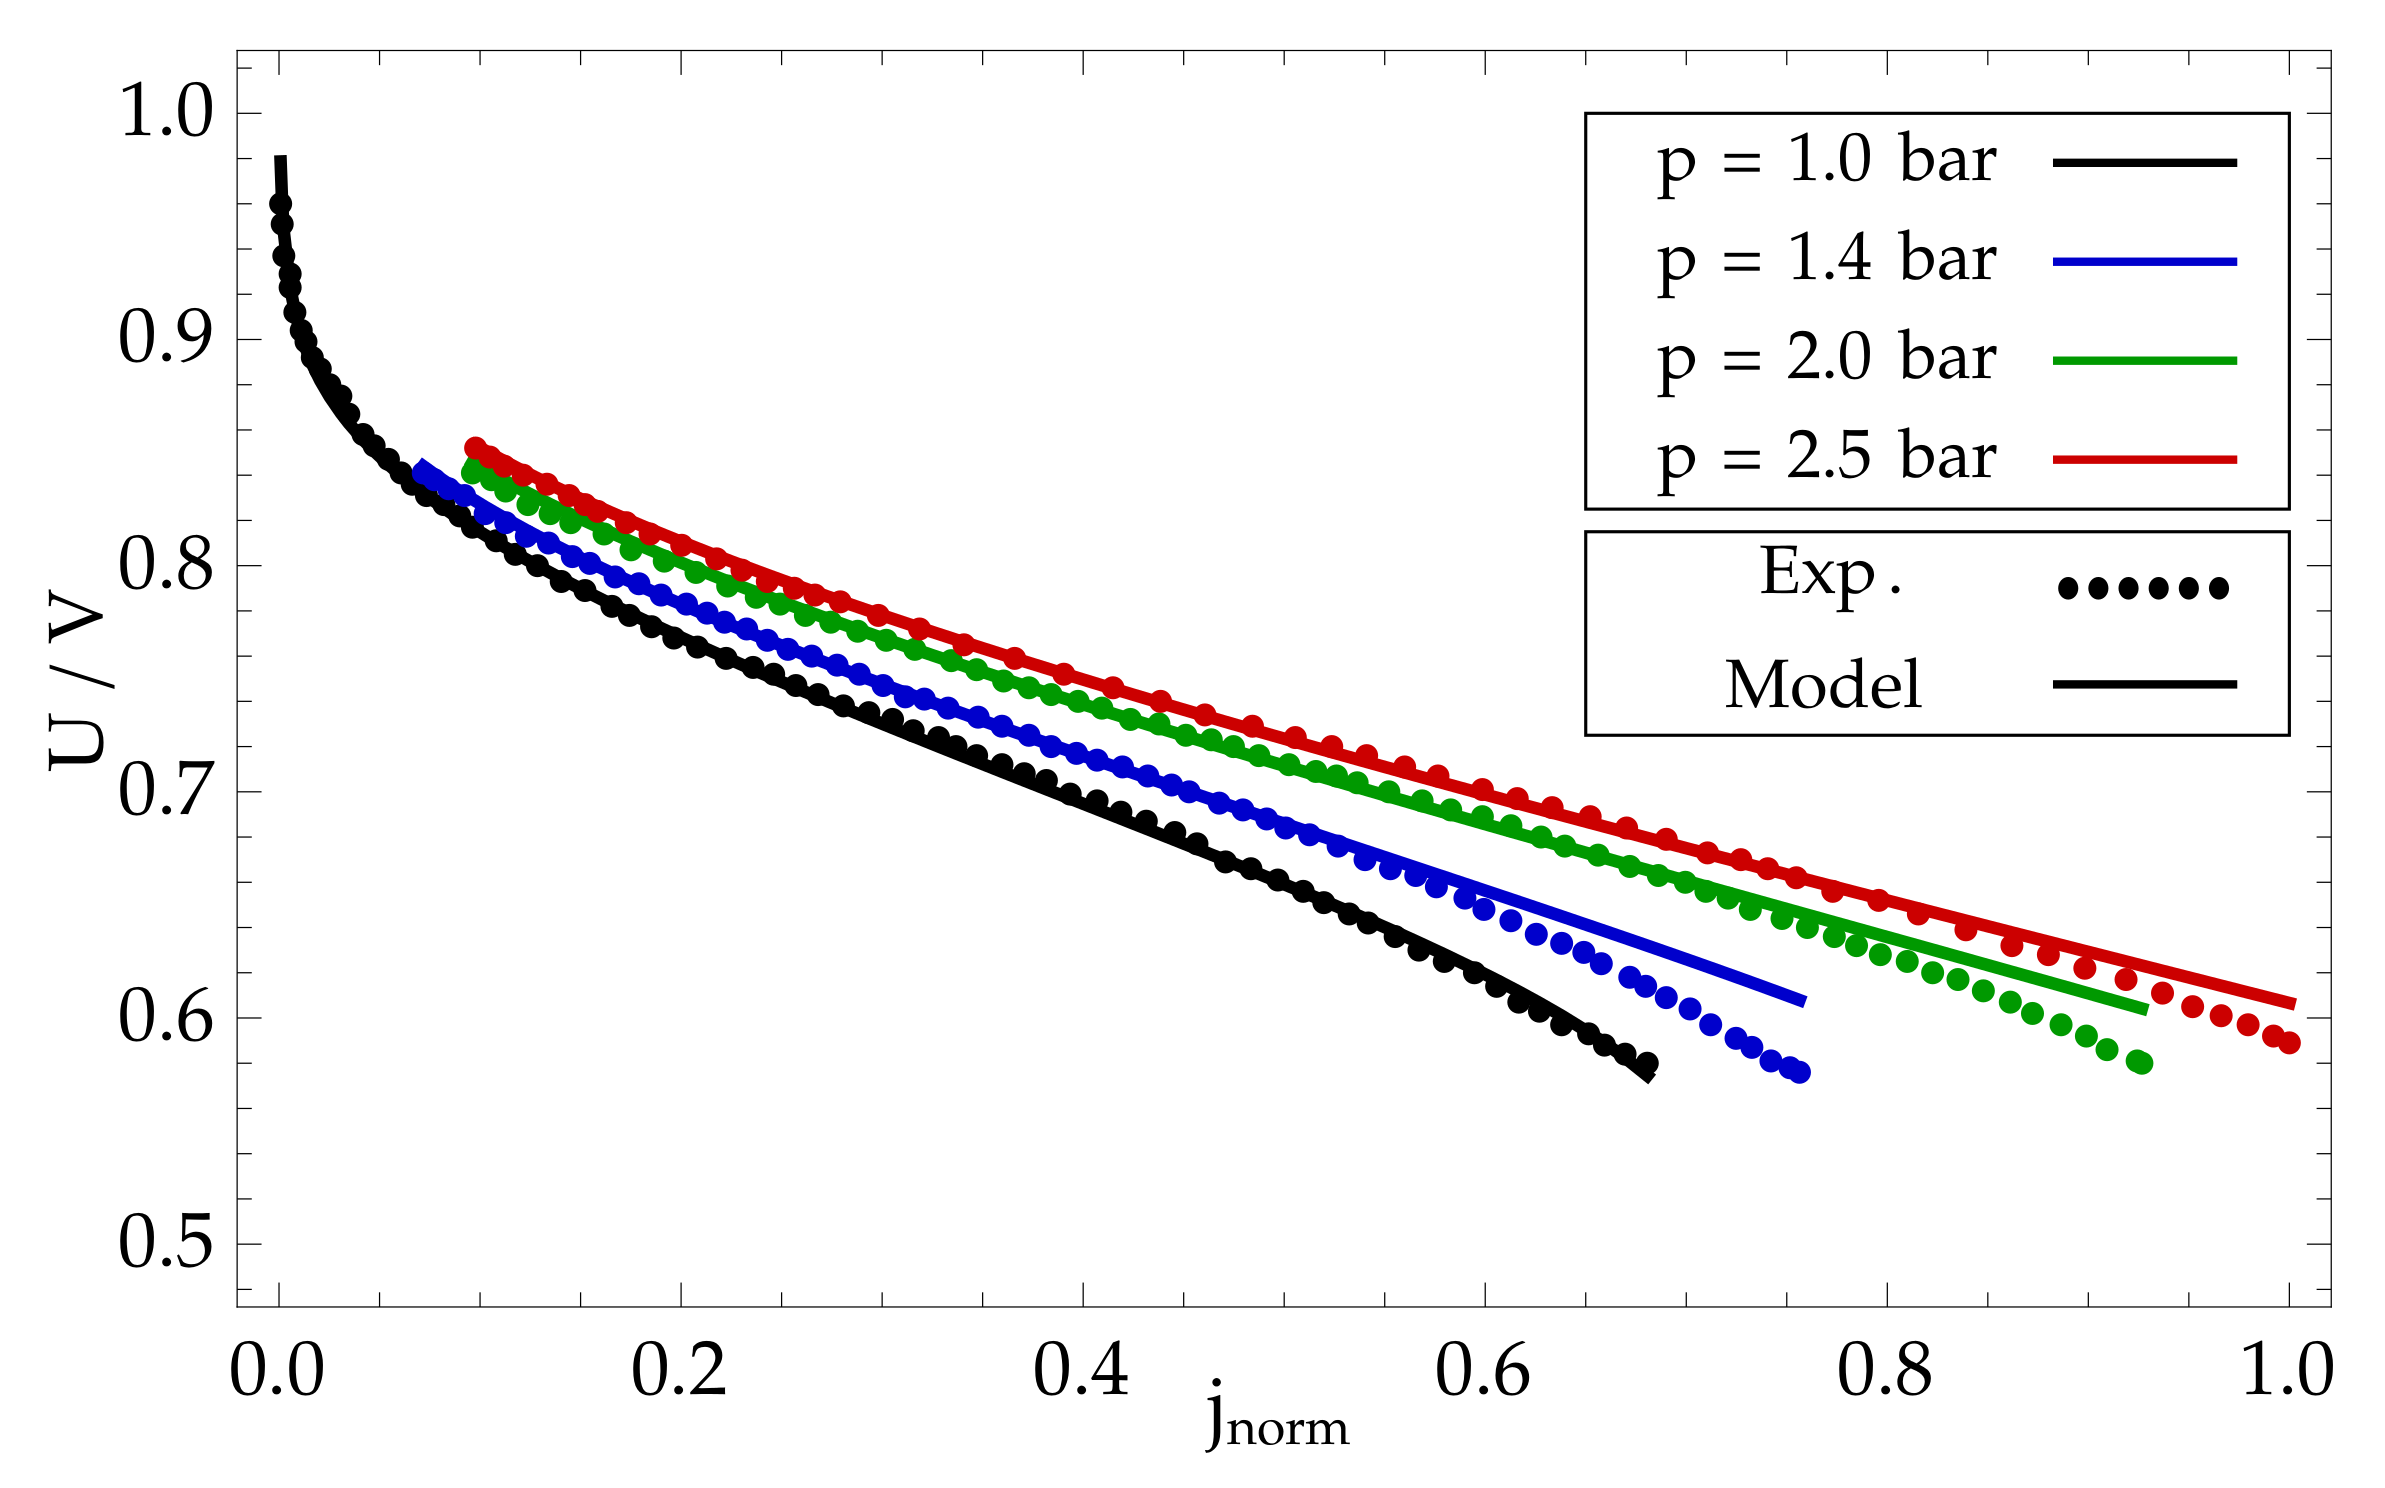
The model was tested by simulating four polarisation curves, measured at different inlet gas pressures of hydrogen and oxygen: p = 1.0 , 1.4 , 2.0 , 2.5 bar. The gas flows were set by constant stoichiometry on the anode side λ a n = 1.3 , 1.3 , 1.3 , 1.3 and on the cathode side λ c a t = 1.8 , 1.7 , 1.7 , 1.7 , where the stoichiometry is defined as the ratio between the flow of reactants into the fuel cell and the consumption of reactants in the electrochemical reaction λ = ϕ r e a c t , i n / ϕ r e a c t , E C . The temperature was assumed to be constant and determined by the cooling medium with temperature T = 70 , 73 , 74 , 76 ° C. Set of differential Equations (1) describing the model was implemented in Python programming language and solved using the solve_ivp routine from Scipy library [43]. The calibration of the model parameters is described in detail in Appendix C.
The measured polarisation curves are compared in Figure 8 with the modelled results calculated using the calibrated model parameters. The values agreed well, indicating that the simple proposed model is able to adequately explain the main physical processes occurring in the fuel cell. Note that this model is introduced with a pedagogical goal and, therefore, does not include submodels for specific detailed phenomena, such as the formation and transport of liquid water [26], which increases the accuracy of the results at high current densities.
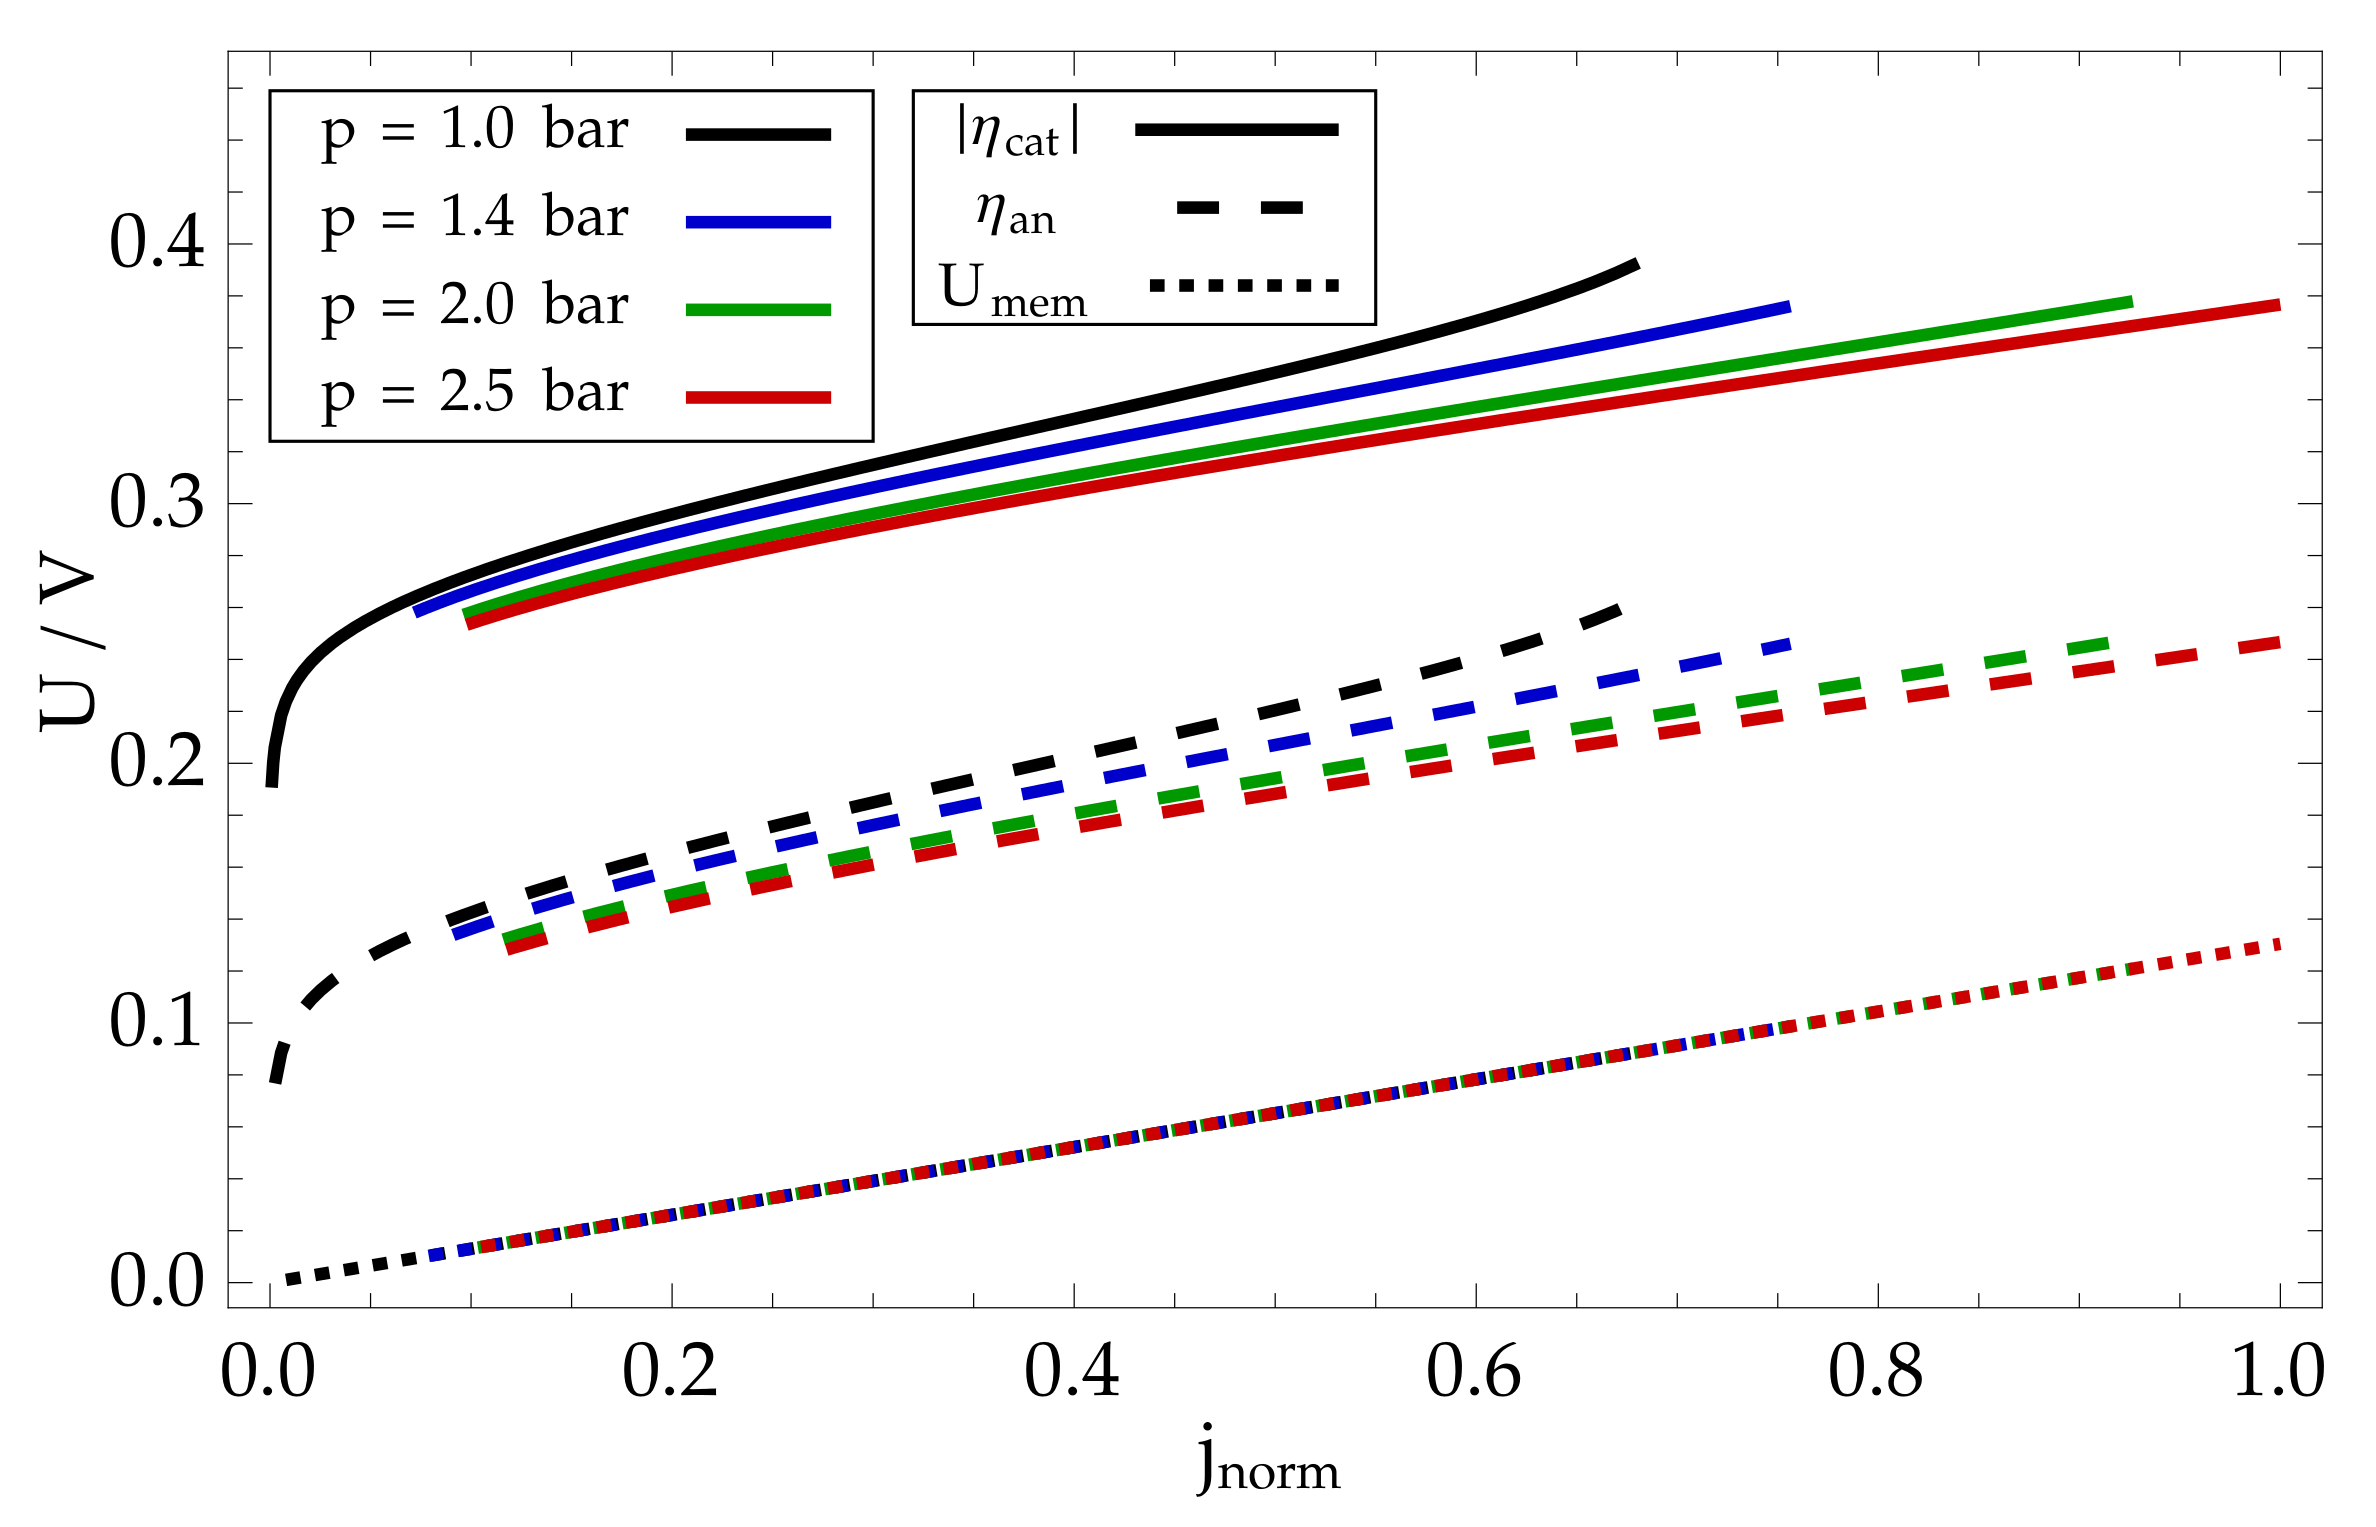
As explained by Equation (79), the drop of fuel cell voltage from its maximal theoretical value of 1.23 V can be attributed to three contributions: anode overpotential η a n , cathode overpotential η c a t , and membrane voltage drop U m e m . These contributions are shown for different polarisation curves in Figure 9.
The contribution of the cathode overpotential is much larger than that of the anode overpotential, which is due to the fact that the electrochemical reaction rate of the cathode is much lower than that of the anode. Both overpotentials depend to a significant extent on the gas inlet pressure: higher pressure leads to higher reactant concentrations, which require a lower overpotential for the reaction to proceed at a rate determined by the external current. Under stationary conditions in which the polarisation curve is measured, the electric current density through the fuel cell is linearly proportional to the proton flux through the membrane. The membrane voltage drop U m e m Equation (70), therefore, increases linearly with current density and is independent of the gas inlet pressure.
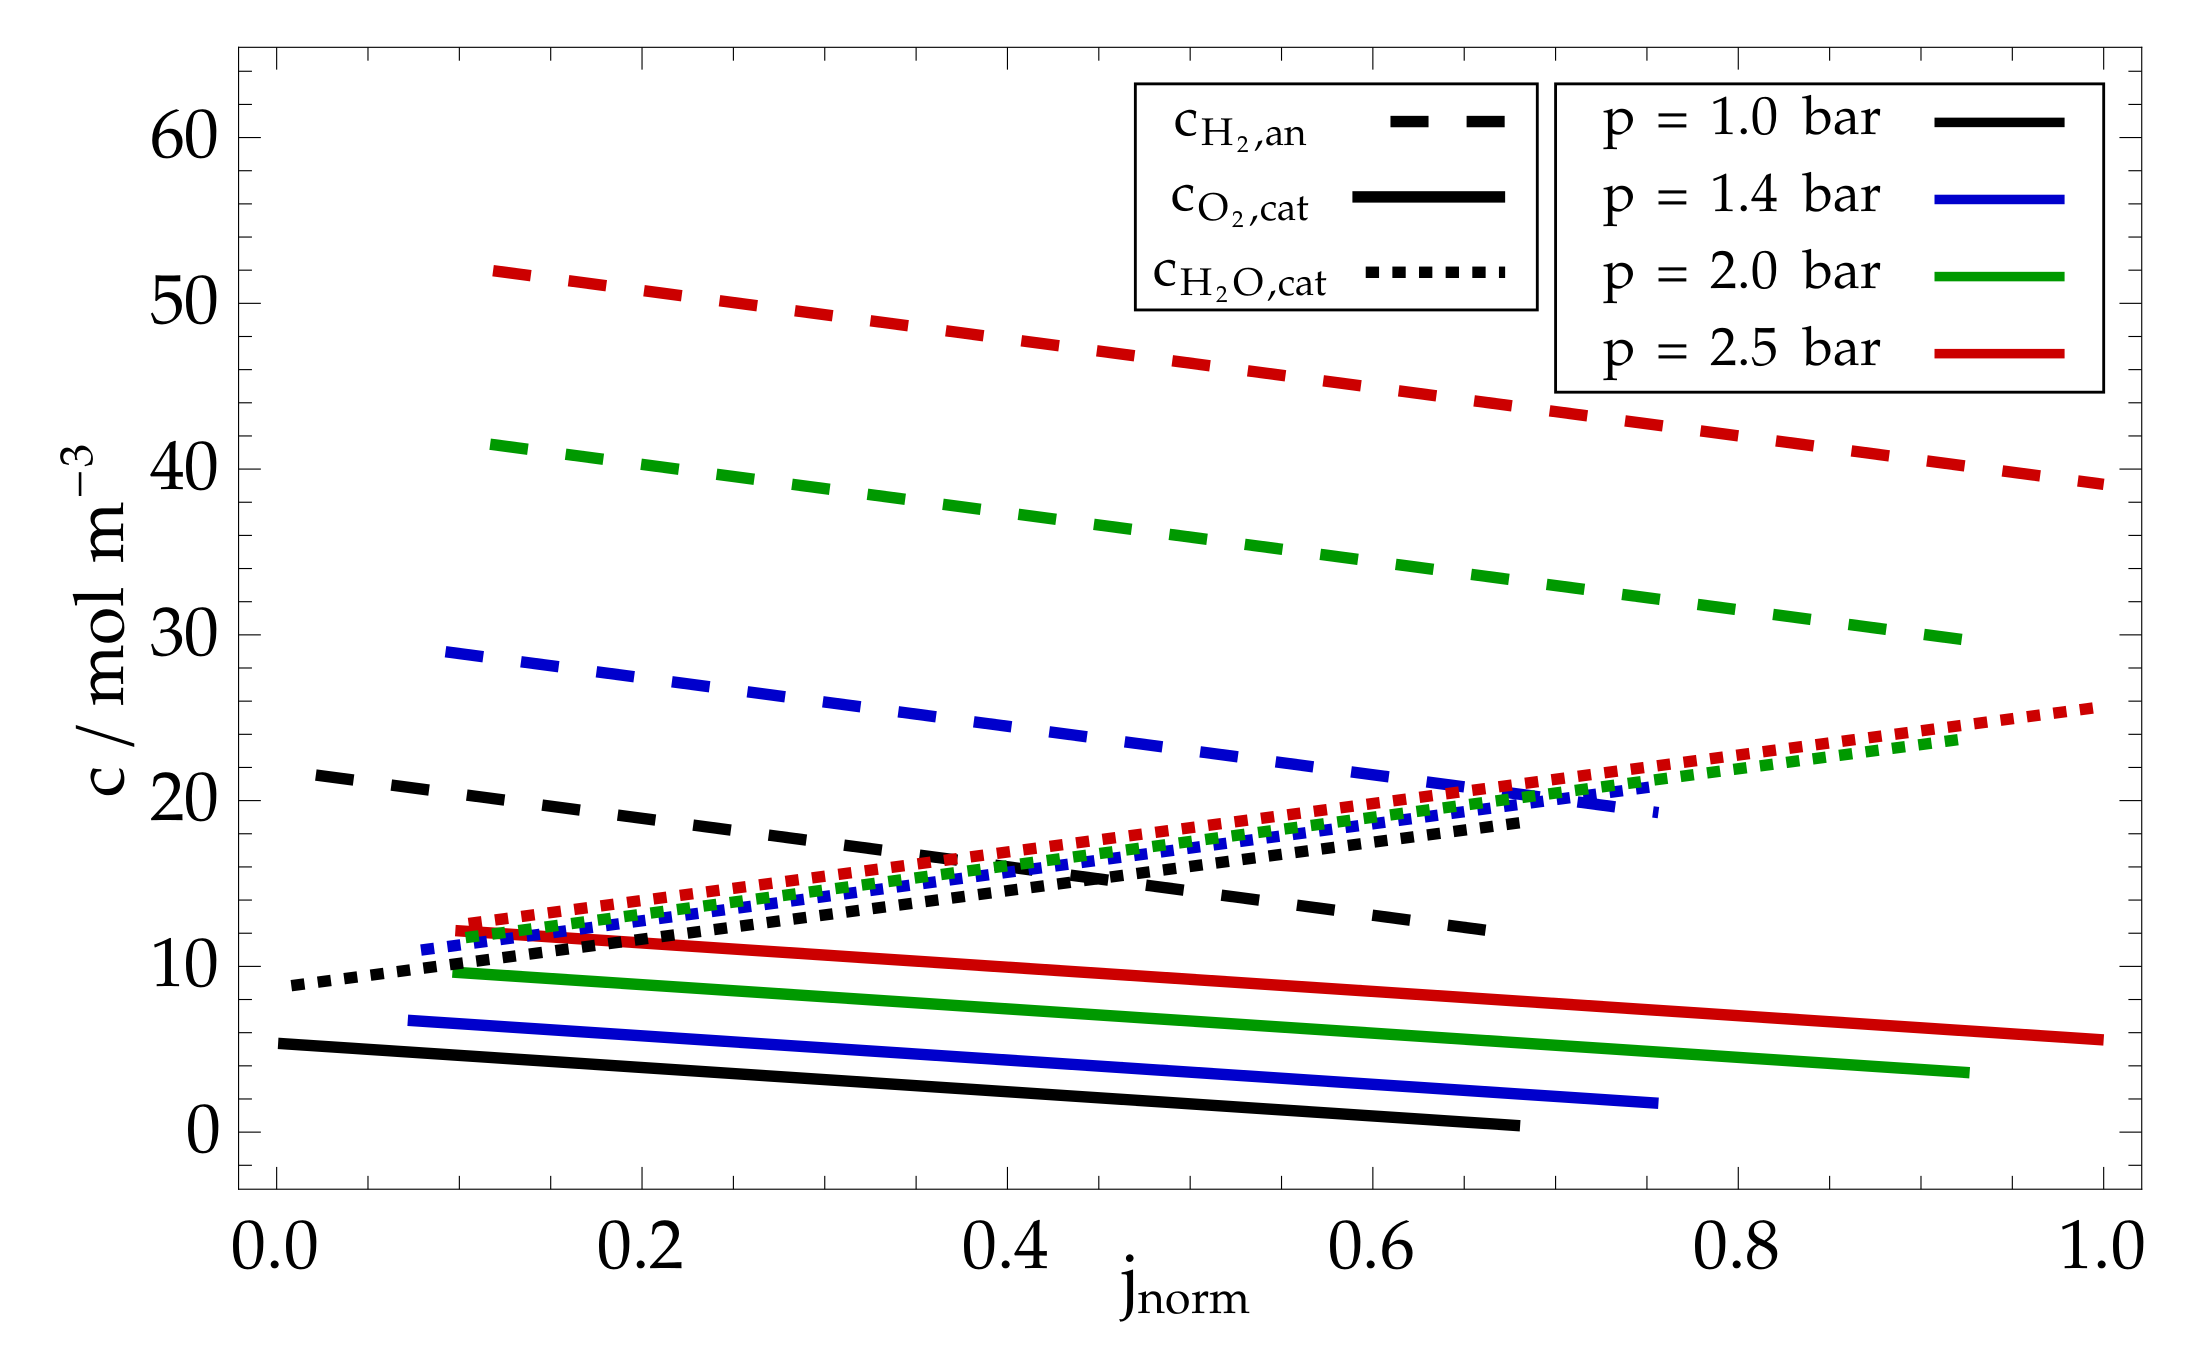
The model also provides insight into the concentration profiles of other chemical species, i.e., oxygen, hydrogen, and water, shown in Figure 10. As expected, the concentrations of the reactants decreased linearly with the current density, causing a linear increase in the reactant flux through the GDL at constant species concentrations in the gas channels. Note that at sufficiently high current densities, the oxygen concentration on the cathode surface was so low that it led to a substantial increase in the cathode overpotential, which is required to maintain a sufficient reaction rate at a reduced reactant concentration (see the black line in Figure 9). The water concentration (dotted line) increased steadily with increasing current density due to faster production.
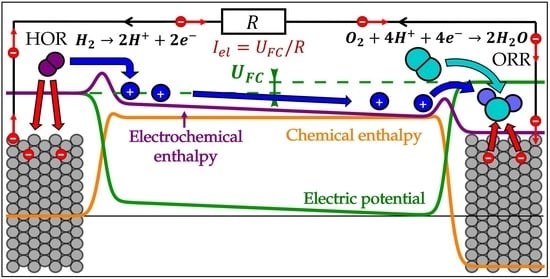
The explanation of the electrochemical reactions and transport processes given in Section 3, Section 4, and Section 6 and the results calculated using the model allow a schematic representation of the contributions to the proton energy as a function of their position in the membrane–electrode assembly in Figure 11. The total electrochemical energy of the proton (purple) can be divided into two contributions: the chemical enthalpy resulting from the reaction between species (orange) and the electric energy (green) due to the interaction of the proton with the electric field in the fuel cell.
In the anode, the protons are bound in hydrogen molecules with low chemical enthalpy. When the hydrogen molecule is split into protons (which enter the ionomer membrane), their chemical enthalpy increases, but this effect is compensated by the electric energy due to the proton transition through the EDL. Therefore, the overall change in enthalpy is quite small. When no current flows through the cell (case a) in Figure 11, the small differences in the enthalpy levels are the result of concentration contributions to the Nernst potential Equations (25) and (48). If an electric current flows through the cell (case b) in Figure 11, the enthalpy of the hydrogen in the anode is higher than the enthalpy of the protons in the membrane, forcing the hydrogen to split into protons.
The chemical part of the enthalpy of the protons in the membrane is constant, while the electric part is affected by the internal electric field Equation (68). The field is present only when electric current flows through the cell and is shown in Figure 11b as a linear change in the electric energy of the protons through the membrane.
The transition between the membrane and the cathode is characterised by a significant decrease in chemical enthalpy as protons from the ionomer are bound with oxygen to form water. The chemical contribution is again balanced by the increase in electric energy due to the EDL, so that the electrochemical enthalpy in the membrane and cathode is nearly equal when the electric current is zero (Figure 11a). When the electric current is not zero, the electric potential at the cathode decreases, resulting in a lower electrochemical enthalpy at the cathode, which forces a higher reaction rate.

9. Conclusions

The paper presents an educational-scale-bridging modelling approach, resulting in a simple mathematical model of the electrochemical reactions and species transport in the hydrogen fuel cell. The aim of the paper was to explain intuitively the physicochemical processes at different scales in the fuel cell, such as electrochemical reactions, species diffusion, and conduction, and to describe them in terms of a simple set of differential equations that provides a better understanding of the causal relationships between the relevant quantities.
The description of the electrochemical reactions was based on the intuitive description of molecular dynamics at charged electrodes. As explained in the paper, the charging of the electrode leads to the formation of an electric double layer in the electrolyte at the electrode surface, which affects the movement of the protons involved in the electrochemical reactions. The reaction rate is, therefore, determined by the species concentration and the interplay between the energy distribution of the species due to thermal excitations, the chemical enthalpy of the species, and the magnitude of the EDL energy barrier. We showed that, even for a hydrogen oxidation reaction with a standard potential of 0.0 V, the actual electric potential difference across the EDL must be large ( 4.4 V) to establish an equilibrium between the chemical and electrical contribution to the reaction enthalpy. The oxygen reduction reaction at the cathode results in an even larger EDL potential of ( 5.67 V). This understanding was used to provide a sound and intuitive mathematical derivation of the Butler–Volmer equation and apply it to the case of the hydrogen oxidation reaction at the anode and the oxygen reduction reaction at the cathode catalyst layer of the hydrogen fuel cell.
Furthermore, we used a simple model of a planar capacitor to explain how the electrochemical production and consumption of protons in the catalyst layers affect the electric field in the electrolyte and the electric potential difference across the membrane. This allows a simple description of proton transport in the membrane. Combined with the understanding of the EDL dynamics on the electrode surface, a clear picture of the electric potential profile across the membrane–electrode assembly was established: the electric potential drops significantly at the junction between the anode electrode, and the electrolyte ( 4.4 V) changes only slightly across the membrane and rises again significantly across the cathode surface EDL ( 5.6 V).
Finally, we explained how the electric potential of electrodes is affected by the production and consumption of electrons in electrochemical reactions and by transport through the external load. The time dynamics of the electric potential was described mathematically with a simple picture of the electrode surface as a planar capacitor, where the EDL potential difference is linearly related to the excess charge on the electrode. This provides a complete understanding of what happens in the fuel cell when an external load is connected between the anode and cathode. The electron current moves from the low electric potential of the anode to the high potential of the cathode, resulting in an increase in the electrical potential of the anode. This shifts the reaction equilibrium at the anode and promotes the oxidation of hydrogen into two protons, which are deposited in the electrolyte, and two electrons, which attempt to compensate for the increased anode potential by their negative electric charge. The electrons travelling to the cathode decrease its electric potential, thus shifting the reaction balance toward the direction of protons bonding with the oxygen and the excess electrons, resulting in an increase in the electric potential at the cathode. The imbalance between the proton concentrations in the catalyst layers of the anode and cathode results in the establishment of an electric field in the membrane, which forces the protons to travel between the anode and cathode, balancing the electrochemical production and consumption.
The mathematical descriptions of the electrochemical reactions and transport of protons, gaseous species, and electrons were coupled into a model of fuel cell operation described as a set of seven first-order differential equations for electric potentials and species concentrations in the anode and cathode catalyst layers. The electric potentials at the anode and cathode calculated with the proposed model agreed well with the experimental data, indicating that the model describes all relevant processes in the fuel cell in sufficient detail while providing a high degree of intuitive understanding of the underlying processes. Most importantly, the structure of the model provides an adequate understanding of the causal relations between the physical quantities describing the fuel cell operation. Because of its intuitiveness, we believe that the proposed model will be a great asset in educating and explaining the details of fuel cell operation to new generations of researchers.

Author Contributions

Conceptualization: A.K. (Ambrož Kregar), K.Z., A.K. (Andraž Kravos) and T.K.; Methodology: A.K. (Ambrož Kregar) and K.Z.; Software: A.K. (Ambrož Kregar); Validation: A.K. (Ambrož Kregar); Investigation: A.K. (Andraž Kravos); Writing—original draft: A.K. (Ambrož Kregar); Writing—review & editing: K.Z., A.K. (Andraž Kravos) and T.K.; Visualization: A.K. (Ambrož Kregar); Supervision: T.K.; Project administration: T.K.; Funding acquisition: T.K. All authors have read and agreed to the published version of the manuscript.

Funding

This research was funded by Slovenian Research Agency (ARRS, research core funding No. P2-0401 and project J2-2494). This work was partly conducted within the MORELife project and received funding from the Fuel Cells and Hydrogen 2 Joint Undertaking (JU) under Grant Agreement No 101007170. The work was also partially funded by the project ARRS-CEA NC-0025.

Data Availability Statement

The data presented in this study are available on request from the corresponding author.

Conflicts of Interest

There are no conflicts to declare.

Appendix A. Electrostatic Energy of Transition States

The electrostatic contribution to the energy of the transition state, which is composed of protons adsorbed on the electrode surface, can be estimated using a simple schematic picture of the electric charge distribution shown in Figure A1.
In the initial state (Figure A1a), the proton with charge + e 0 (blue circle) is at the negative potential U due to the EDL and the electron (red cloud) is at the potential 0, resulting in the electrostatic energy E e l = e 0 U . In the transition state (Figure A1b), the proton is adsorbed on the electrode surface and is at the negative potential β U , where 0 < β < 1 is defined by the slope of the EDL potential (i.e., the electric field of the surface) and the distance of the proton from the electrode surface. In addition, the proton charge can be partially shielded by an electron cloud with effective charge δ e 0 , 0 < δ < 1 , so that the effective charge of the adsorbed proton is e = + e 0 δ e 0 . Thus, the electrostatic energy of the adsorbed proton can be estimated as follows
E e l , H a d s + = β ( 1 δ ) e 0 U = α e 0 U ,
where we have reduced the number of parameters by defining charge transfer coefficient α = β ( 1 δ ) , 0 < α < 1 .
Figure A1. Schematic representation of the energy distribution function w ( E ) and the number of particles with sufficient energy for the reaction.
Catalysts 13 01131 g0a1

Appendix B. Boltzmann Distribution

For a macroscopic system at finite temperature, the energy of the system is distributed among the individual constituents according to the Boltzmann distribution [34], which describes the probability density w ( E ) of a single constituent with a given energy E:
w ( E ) = 1 Z e E k B T .
The probability density w ( E ) decreases exponentially with energy, where T is the temperature and k B is the Boltzmann constant. The normalisation factor Z = E 0 exp ( E / k B T ) d E is calculated by integrating from the lowest possible energy level E 0 to infinity. This means that at any finite temperature, the probability that the reactant has enough energy to overcome the potential barrier to the transition state Δ H is obtained by integrating the probability density:
p E > Δ H = Δ H w ( E ) d E = c H + e Δ H k B T .
The procedure is schematically presented in Figure A2.
Figure A2. Schematic representation of the energy distribution function w ( E ) (red line) and the probability that a particle has enough energy for a reaction (dashed red area).
Catalysts 13 01131 g0a2

Appendix C. Model Calibration

The model was calibrated on 4 measured polarisation curves ( i = 0 , . . . , 3 ) describing the relation between fuel cell electric current density j e l , i , j and voltage U F C , e x p , i , j , where j describes the measurement points on each curve. The polarisation curves differed in the inlet pressures in the gas feed channels p i = 1.0 , 1.4 , 2.0 , 2.5 bar, the stoichiometry on the anode side λ a n , i = 1.3 , 1.3 , 1.3 , 1.3 and cathode side λ c a t , i = 1.8 , 1.7 , 1.7 , 1.7 and the temperature determined by the cooling medium, T i = 70 , 73 , 74 , 76 ° C.
These data were used to determine the operating conditions of the model (listed in Section 2), which were assumed to be stationary. The average concentrations of reactants in the channels were set to constant values calculated from inlet pressure, temperature, and stoichiometry:
c H 2 , c h , i = p i R T i 1 1 2 λ a n , i ,
c O 2 , c h , i = p i R T i 1 1 2 λ c a t , i .
The average water concentration in the cathode channel was calculated from the humidity of the cathode inlet gas r h = 80 % and the temperature using the Antoine equation [44]:
c H 2 O , c h , i ( t ) = p 0 R T i 10 A B C + T i ,
with p 0 = 133.2 kPa, A = 8.07 , B = 1730.6 K, and C = 39.7 K. The external electrical load was determined for each measurement point from the measured fuel cell voltage U F C , e x p , i , j and current density j e l , i , j : R i , j = U F C , e x p , i , j S F C j e l , i , j .
Of the 18 model parameters, the values for 10 of them were set to characteristic values found in the literature. The values of the parameters are listed in the first three columns of Table A1.
Table A1. List of model parameters.
Fixed ParameterValueSourceFitted ParameterValueSource
S F C 25 cm 2 assumed j 0 , a n 3.5 × 10 5 1 ± 0.29 mol/m 2 sfitted
d c a t 1 μ massumed j 0 , c a t , F = j 0 , c a t , B 4.7 × 10 11 1 ± 0.40 mol/m 2 sfitted
d m e m 5 μ massumed α a n 0.65 1 ± 0.07 fitted
d G D L 30 μ massumed α c a t , F 0.74 1 ± 0.012 fitted
μ i o n 30%Ref. [45] α c a t , B 0.29 1 ± 1 fitted
μ V 50%Ref. [45] D G D L 1.75 × 10 6 1 ± 0.012 m 2 /sfitted
E S A 60 m 2 /gassumed σ H + 6.32 1 ± 0.047 S/mfitted
ρ P t L o a d 3 g/m 2 assumed
ε 20Ref. [42]
d E D L 0.122 nmCalc. from [46]
8 parameters from the last three columns of Table A1 were obtained by a fitting procedure aimed at minimising the value of the fitness function χ 2 , calculated by comparing the measured values of the fuel cell voltage U F C , e x p , i , j with the values of the fuel cell voltage U F C , m o d , i , j calculated from the model:
χ 2 = i , j U F C , e x p , i , j U F C , m o d , i , j 2 U F C , e x p , i , j .
Modelled values U F C , m o d , i , j were obtained by implementing the model Equation (1) in the Python programming language. The equations were integrated using the solve_ivp routine from the Scipy library [43], with the constant input values given above. The simulation time was set to t s i m = 7200 s to ensure convergence of all modelled variables. The modelled fuel cell voltage was calculated as U F C , m o d , i , j = U c a t , e l ( t s i m ) U c a t , e l ( t s i m ) i , j for each set of operating conditions i , j . The values of the fitted parameters were varied using the Nelder-Mead [47] routine from the Scipy library to minimise the value of χ 2 . The list of best-fit parameters is given in Table A1. Since the reverse direction of the reaction Equation (49) is strongly suppressed in the fuel cell, the value of the oxidation reaction rate constant was assumed to be equal to the reduction reaction rate constant j 0 , c a t , R e d = j 0 , c a t , O x .
The use of best-fit parameters in the model results in a relatively small value of χ 2 = 7.8 × 10 4 , indicating good agreement between model and experiment.

References

  1. Atkins, P.; de Paula, J. Physical Chemistry, 8th ed.; W. H. Freeman and Company: New York, NY, USA, 2006. [Google Scholar]
  2. Zaidi, S.M.J.; Rauf, M.A. Fuel Cell Fundamentals. In Polymer Membranes for Fuel Cells; Springer: Boston, MA, USA, 2008; pp. 1–6. [Google Scholar] [CrossRef]
  3. O’Hayre, R.; Cha, S.W.; Colella, W.; Prinz, F.B. Fuel Cell Fundamentals; John Wiley & Sons, Inc.: Hoboken, NJ, USA, 2016. [Google Scholar] [CrossRef]
  4. Lee, T.W.; Tseng, A.A.; Bae, K.S.; Do, Y.H. Simulation of the Proton-Exchange Membrane (PEM) Fuel Cell Life-Cycle Performance with Data-Driven Parameter Estimation. Energy Fuels 2010, 24, 1882–1888. [Google Scholar] [CrossRef]
  5. Javed, K.; Gouriveau, R.; Zerhouni, N.; Hissel, D. Prognostics of Proton Exchange Membrane Fuel Cells stack using an ensemble of constraints based connectionist networks. J. Power Sources 2016, 324, 745–757. [Google Scholar] [CrossRef]
  6. Ma, R.; Yang, T.; Breaz, E.; Li, Z.; Briois, P.; Gao, F. Data-driven proton exchange membrane fuel cell degradation predication through deep learning method. Appl. Energy 2018, 231, 102–115. [Google Scholar] [CrossRef]
  7. Silva, R.; Gouriveau, R.; Jemeï, S.; Hissel, D.; Boulon, L.; Agbossou, K.; Yousfi Steiner, N. Proton exchange membrane fuel cell degradation prediction based on Adaptive Neuro-Fuzzy Inference Systems. Int. J. Hydrogen Energy 2014, 39, 11128–11144. [Google Scholar] [CrossRef] [Green Version]
  8. Liu, H.; Chen, J.; Zhu, C.; Su, H.; Hou, M. Prognostics of Proton Exchange Membrane Fuel Cells Using A Model-based Method. IFAC-PapersOnLine 2017, 50, 4757–4762. [Google Scholar] [CrossRef]
  9. Pisani, L.; Murgia, G.; Valentini, M.; D’Aguanno, B. A new semi-empirical approach to performance curves of polymer electrolyte fuel cells. J. Power Sources 2002, 108, 192–203. [Google Scholar] [CrossRef]
  10. Haji, S. Analytical modeling of PEM fuel cell i–V curve. Renew. Energy 2011, 36, 451–458. [Google Scholar] [CrossRef]
  11. Hao, D.; Shen, J.; Hou, Y.; Zhou, Y.; Wang, H. An Improved Empirical Fuel Cell Polarization Curve Model Based on Review Analysis. Int. J. Chem. Eng. 2016, 2016, 4109204. [Google Scholar] [CrossRef] [Green Version]
  12. Youssef, M.; Al-Nadi, K.E.; Khalil, M.H. Lumped model for proton exchange membrane fuel cell (PEMFC). Int. J. Electrochem. Sci. 2010, 5, 267–277. [Google Scholar] [CrossRef]
  13. Larminie, J. Fuel Cell Systems Explained; Larminie, J., Dicks, A., Eds.; J. Wiley: Chichester, UK, 2003. [Google Scholar]
  14. Amphlett, J.C.; Baumert, R.M.; Mann, R.F.; Peppley, B.A.; Roberge, P.R.; Harris, T.J. Performance Modeling of the Ballard Mark IV Solid Polymer Electrolyte Fuel Cell: II. Empirical Model Development. J. Electrochem. Soc. 1995, 142, 9–15. [Google Scholar] [CrossRef]
  15. Mann, R.F.; Amphlett, J.C.; Hooper, M.A.; Jensen, H.M.; Peppley, B.A.; Roberge, P.R. Development and application of a generalised steady-state electrochemical model for a PEM fuel cell. J. Power Sources 2000, 86, 173–180. [Google Scholar] [CrossRef]
  16. Correa, J.M.; Farret, F.A.; Canha, L.N.; Simoes, M.G. An electrochemical-based fuel-cell model suitable for electrical engineering automation approach. IEEE Trans. Ind. Electron. 2004, 51, 1103–1112. [Google Scholar] [CrossRef]
  17. Robin, C.; Gerard, M.; Franco, A.A.; Schott, P. Multi-scale coupling between two dynamical models for PEMFC aging prediction. Int. J. Hydrogen Energy 2013, 38, 4675–4688. [Google Scholar] [CrossRef]
  18. Chandesris, M.; Vincent, R.; Guetaz, L.; Roch, J.S.; Thoby, D.; Quinaud, M. Membrane degradation in PEM fuel cells: From experimental results to semi-empirical degradation laws. Int. J. Hydrogen Energy 2017, 42, 8139–8149. [Google Scholar] [CrossRef]
  19. Weydahl, H.; Thomassen, M.S.; Børresen, B.T.; Møller-Holst, S. Response of a proton exchange membrane fuel cell to a sinusoidal current load. J. Appl. Electrochem. 2010, 40, 809–819. [Google Scholar] [CrossRef]
  20. Gu, W.; Baker, D.R.; Liu, Y.; Gasteiger, H.A. Proton exchange membrane fuel cell (PEMFC) down-the-channel performance model. In Handbook of Fuel Cells; John Wiley & Sons, Inc.: Hoboken, NJ, USA, 2010. [Google Scholar] [CrossRef]
  21. Chan, S.; Khor, K.; Xia, Z. Complete polarization model of a solid oxide fuel cell and its sensitivity to the change of cell component thickness. J. Power Sources 2001, 93, 130–140. [Google Scholar] [CrossRef]
  22. Laoun, B. Simulation of PEMFC performance. Rev. Energies Renouvelables 2011, 14, 441–448. [Google Scholar]
  23. Kulikovsky, A.A. A Physically–Based Analytical Polarization Curve of a PEM Fuel Cell. J. Electrochem. Soc. 2014, 161, F263–F270. [Google Scholar] [CrossRef]
  24. Kulikovsky, A. Analytical Modelling of Fuel Cells; Elsevier: Amsterdam, The Netherlands, 2010. [Google Scholar] [CrossRef]
  25. Kravos, A.; Ritzberger, D.; Tavčar, G.; Hametner, C.; Jakubek, S.; Katrašnik, T. Thermodynamically consistent reduced dimensionality electrochemical model for proton exchange membrane fuel cell performance modelling and control. J. Power Sources 2020, 454, 227930. [Google Scholar] [CrossRef]
  26. Kravos, A.; Kregar, A.; Penga, Ž.; Barbir, F.; Katrašnik, T. Real-time capable transient model of liquid water dynamics in proton exchange membrane Fuel Cells. J. Power Sources 2022, 541, 231598. [Google Scholar] [CrossRef]
  27. Eberle, D.; Horstmann, B. Oxygen Reduction on Pt(111) in Aqueous Electrolyte: Elementary Kinetic Modeling. Electrochim. Acta 2014, 137, 714–720. [Google Scholar] [CrossRef]
  28. Wang, J.X.; Zhang, J.; Adzic, R.R. Double-trap kinetic equation for the oxygen reduction reaction on pt(111) in acidic media. J. Phys. Chem. A 2007, 111, 12702–12710. [Google Scholar] [CrossRef] [PubMed]
  29. Song, C.; Zhang, J. Electrocatalytic Oxygen Reduction Reaction. In PEM Fuel Cell Electrocatalysts and Catalyst Layers: Fundamentals and Applications; Springer: London, UK, 2008; pp. 89–134. [Google Scholar] [CrossRef]
  30. Stamenkovic, V.; Mun, B.S.; Mayrhofer, K.J.; Ross, P.N.; Markovic, N.M.; Rossmeisl, J.; Greeley, J.; Nørskov, J.K. Changing the Activity of Electrocatalysts for Oxygen Reduction by Tuning the Surface Electronic Structure. Angew. Chem. Int. Ed. 2006, 45, 2897–2901. [Google Scholar] [CrossRef] [PubMed]
  31. Nørskov, J.K.; Rossmeisl, J.; Logadottir, A.; Lindqvist, L.; Kitchin, J.R.; Bligaard, T.; Jónsson, H. Origin of the Overpotential for Oxygen Reduction at a Fuel-Cell Cathode. J. Phys. Chem. B 2004, 108, 17886–17892. [Google Scholar] [CrossRef]
  32. Choi, P.; Jalani, N.H.; Datta, R. Thermodynamics and proton transport in Nafion II. Proton diffusion mechanisms and conductivity. J. Electrochem. Soc. 2005, 152, E123–E130. [Google Scholar] [CrossRef]
  33. Stoicheff, B. On the dissociation energy of molecular hydrogen. Can. J. Phys. 2001, 79, 165–172. [Google Scholar] [CrossRef]
  34. Boltzmann, L. Studien über das Gleichgewicht der lebendigen Kraft zwischen bewegten materiellen Punkten. Wien. Berichte 1868, 58, 517–560. [Google Scholar] [CrossRef]
  35. Skúlason, E.; Karlberg, G.S.; Rossmeisl, J.; Bligaard, T.; Greeley, J.; Jónsson, H.; Nørskov, J.K. Density functional theory calculations for the hydrogen evolution reaction in an electrochemical double layer on the Pt(111) electrode. Phys. Chem. Chem. Phys. 2007, 9, 3241–3250. [Google Scholar] [CrossRef] [Green Version]
  36. Trasatti, S. The absolute electrode potential: An explanatory note (Recommendations 1986). Pure Appl. Chem. 1986, 58, 955–966. [Google Scholar] [CrossRef]
  37. Ferreira, P.J.; la O’, G.J.; Shao-Horn, Y.; Morgan, D.; Makharia, R.; Kocha, S.; Gasteiger, H.A. Instability of Pt/C Electrocatalysts in Proton Exchange Membrane Fuel Cells. J. Electrochem. Soc. 2005, 152, A2256. [Google Scholar] [CrossRef] [Green Version]
  38. Anderson, A.B.; Albu, T.V. Catalytic Effect of Platinum on Oxygen Reduction An Ab Initio Model Including Electrode Potential Dependence. J. Electrochem. Soc. 2000, 147, 4229. [Google Scholar] [CrossRef] [Green Version]
  39. Athanasaki, G.; Jayakumar, A.; Kannan, A. Gas diffusion layers for PEM fuel cells: Materials, properties and manufacturing—A review. Int. J. Hydrogen Energy 2023, 48, 2294–2313. [Google Scholar] [CrossRef]
  40. Cussler, E. Diffusion: Mass Transfer in Fluid Systems; Cambridge Series in Chemical Engineering; Cambridge University Press: Cambridge, UK, 2009. [Google Scholar]
  41. Frühwirt, P.; Kregar, A.; Törring, J.T.; Katrašnik, T.; Gescheidt, G. Holistic approach to chemical degradation of Nafion membranes in fuel cells: Modelling and predictions. Phys. Chem. Chem. Phys. 2020, 22, 5647–5666. [Google Scholar] [CrossRef] [PubMed]
  42. Lu, Z.; Polizos, G.; Macdonald, D.D.; Manias, E. State of Water in Perfluorosulfonic Ionomer (Nafion 117) Proton Exchange Membranes. J. Electrochem. Soc. 2008, 155, B163. [Google Scholar] [CrossRef]
  43. Virtanen, P.; Gommers, R.; Oliphant, T.E.; Haberland, M.; Reddy, T.; Cournapeau, D.; Burovski, E.; Peterson, P.; Weckesser, W.; Bright, J.; et al. SciPy 1.0: Fundamental Algorithms for Scientific Computing in Python. Nat. Methods 2020, 17, 261–272. [Google Scholar] [CrossRef] [Green Version]
  44. Antoine, M.C. Nouvelle relation entre les tensions et les temperatures. C. R. Held Seanc. Acad. Sci. Paris 1888, 107, 681–684. [Google Scholar]
  45. Passalacqua, E.; Lufrano, F.; Squadrito, G.; Patti, A.; Giorgi, L. Nafion content in the catalyst layer of polymer electrolyte fuel cells: Effects on structure and performance. Electrochim. Acta 2001, 46, 799–805. [Google Scholar] [CrossRef]
  46. Smith, A.M.; Lee, A.A.; Perkin, S. The Electrostatic Screening Length in Concentrated Electrolytes Increases with Concentration. J. Phys. Chem. Lett. 2016, 7, 2157–2163. [Google Scholar] [CrossRef] [Green Version]
  47. Nelder, J.A.; Mead, R. A Simplex Method for Function Minimization. Comput. J. 1965, 7, 308–313. [Google Scholar] [CrossRef]
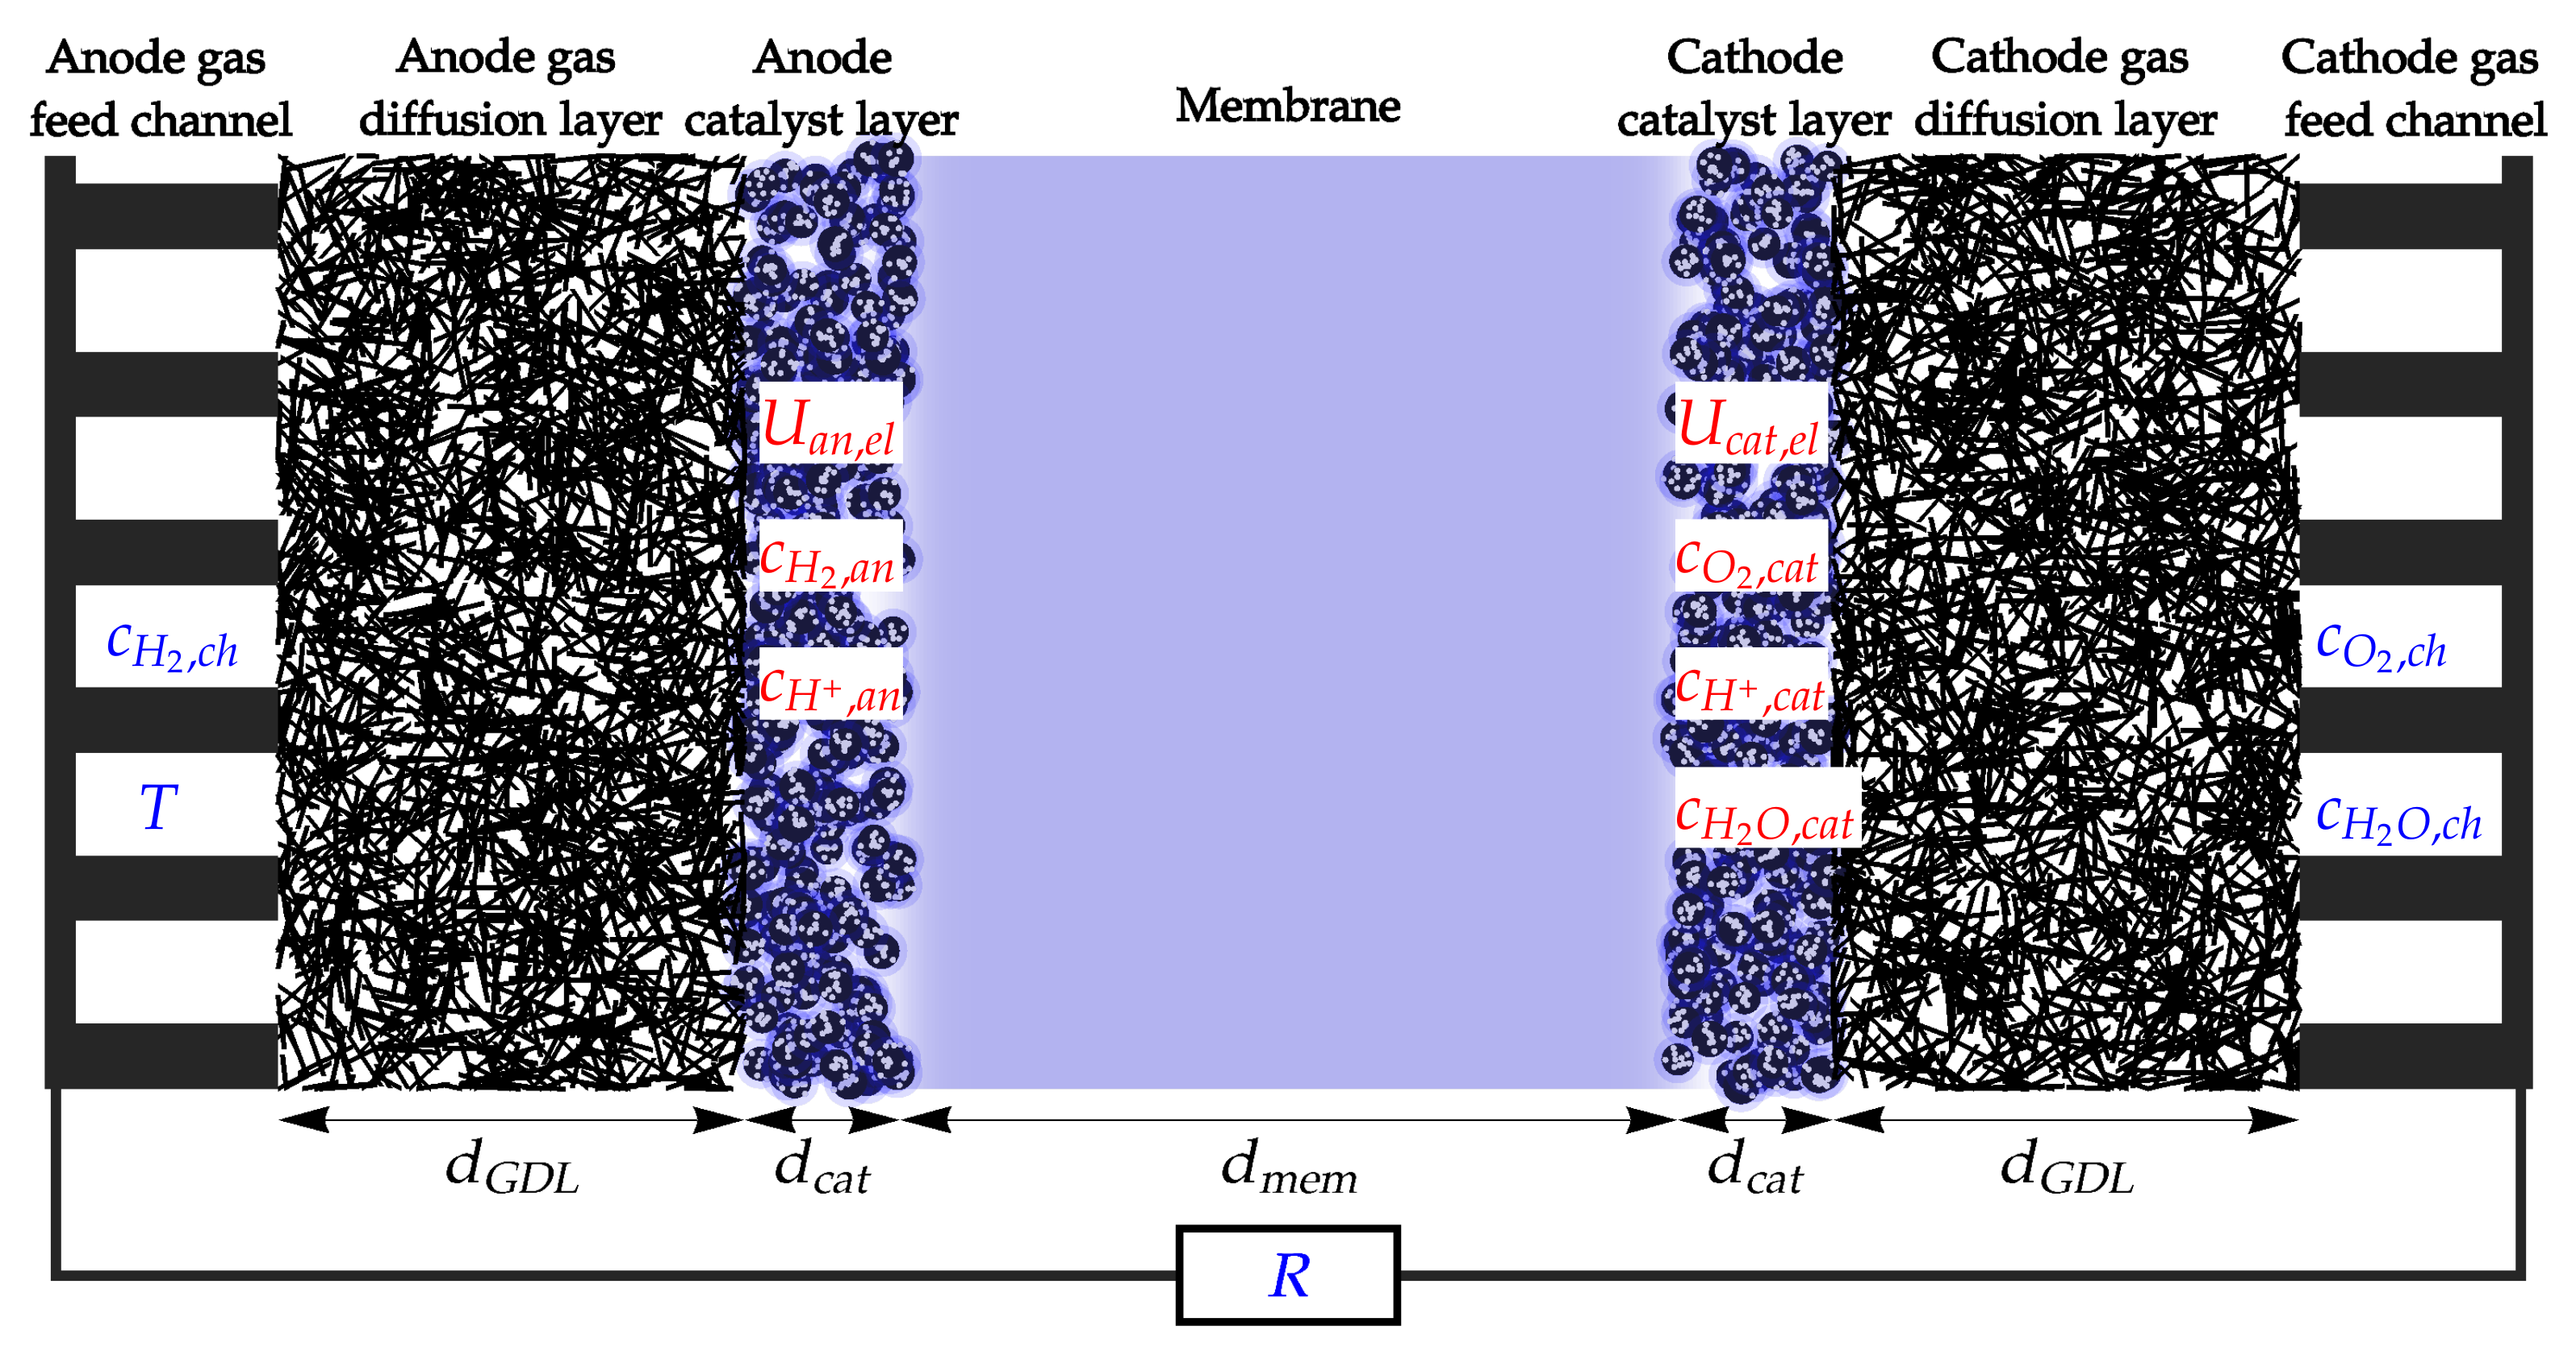
Figure 1. Schematic overview of the fuel cell cross-section with the description model variables (red) and boundary conditions (blue). The dimensions of the individual fuel cell components are not shown to scale.
Catalysts 13 01131 g001
Figure 2. Schematic representation of the configuration of the particles, involved in hydrogen reduction and oxidation. In initial State 1, both protons (blue circles) reside in the bulk electrolyte, screened from the electrode by the electric double layer (EDL). Proton reduction occurs as the protons are first adsorbed on the electrode surface (States 2 and 3). With sufficient energy, the protons can form a transition state (4), which chemically binds into a hydrogen molecule (State 5) and finally detaches from the electrode surface (State 6). When the hydrogen molecule is oxidised, the reaction proceeds in the opposite direction from State 6 to State 1.
Catalysts 13 01131 g002
Figure 3. Schematic representation of the energy levels of the states, involved in the hydrogen electrochemical reaction on a electrically neutral (a) and a charged (b) electrode. The numbering of the states relates to Figure 2: 1: 2 H + + 2 e , 2: H + + H a d s + + 2 e , 3: 2 H a d s + + 2 e , 4: H 2 , a d s + 2 + 2 e , 5: H 2 , a d s , 6: H 2 . On the neutral electrode (a), the electrochemical enthalpy levels (purple) are defined only by the chemical enthalpy (orange) with no electric contribution (green). In this case, the adsorption of protons to the electrode surface ( 1 2 3 ) does not affect the enthalpy, which is increased only when the transition state (4) is formed. The formation of a hydrogen molecule ( 4 5 ) results in a significant decrease in the chemical enthalpy. When the electrode is charged (b), proton adsorption requires their transition through the EDL, which increases the electric and electrochemical energy of the system. As a result, the electrochemical enthalpy of the initial state 0 decreases by 2 e 0 U and of the transition State 4 by 2 α e 0 U , where α is the charge transfer coefficient. The change in enthalpy levels affects the share of particles that have sufficient thermal energy to overcome the enthalpy barrier to the transition state (red dashed area) and, thus, affects the rates of the electrochemical reaction.
Catalysts 13 01131 g003
Figure 4. Electrochemical enthalpy landscape of the reaction Equation (2) with electric potential close to equilibrium. The electric charging results in the electrochemical enthalpy of the initial and the final states to be similar, which in turn leads to similar transition state barriers in both directions. Small deviations between enthalpy levels can be due to the different activities of the reactants and products, which can promote the reaction rate toward reduction or oxidation.
Catalysts 13 01131 g004
Figure 5. Schematic representation of the catalyst layer. Catalyst nanoparticles (white) are dispersed on the surface of the carbon support structure (black) with the volumetric ratio μ C . The catalyst and carbon support are covered with ionomer film (light blue) with the volumetric ratio μ i o n , which allows the protons to travel to the catalyst surface. The gaseous species (hydrogen, oxygen) reside in the void volume of the catalyst (white, volumetric ration μ 0 ).
Catalysts 13 01131 g005
Figure 6. Schematic representation of the enthalpy levels of the states involved in the electrochemical reaction in the fuel cell cathode. Reduction (solid line) and oxidation (dashed line) can proceed between the initial state (init) and the final state (fin) via different transition states (trans,Red and trans,Ox) with different chemical enthalpies (orange), which are affected differently by electric charging (green), resulting in different electrochemical enthalpy barriers (purple) for the reduction and oxidation reactions.
Catalysts 13 01131 g006
Figure 7. Schematic presentation of the electric field and potential in the fuel cell ionomer. The imbalance between the concentrations of protons (red) and sulphonic groups (dashed orange) in the anode and cathode layers results in a net positive charge density at the anode and a negative charge density at the cathode (blue). This creates an electric field within the membrane (purple) that forces the protons to move through the membrane and also leads to a difference in the ionomer electric potential (green) between the anode and cathode.
Catalysts 13 01131 g007
Figure 8. Comparison between measured polarisation curves and data produced by the model.
Catalysts 13 01131 g008
Figure 9. Comparison between the different contributions to the fuel cell voltage drop in Equation (79) at different gas pressures: 1 bar (black), 1.4 bar (blue), 2.0 bar (green), and 2.5 bar (red). The contributions are: anode overpotential η a n (dashed), cathode overpotential η c a t (solid), and membrane voltage drop U m e m (dotted). Note that the anode and cathode overpotentials depend strongly on the gas pressure, which changes the concentration of the reactants. Since the membrane conductivity is assumed to be constant, the membrane voltage drop is the same at all pressures.
Catalysts 13 01131 g009
Figure 10. Concentrations of reactants and products in the fuel cell catalyst layers at different current densities and gas inlet pressures: hydrogen in anode catalyst (dashed), oxygen in cathode catalyst (solid), and water in cathode catalyst (dotted linen). Increasing the current density results in a lower concentration of reactants (hydrogen and oxygen) due to electrochemical consumption and a higher concentration of product (water).
Catalysts 13 01131 g010
Figure 11. Schematic presentation of the proton enthalpy in the fuel cell electrode–membrane assembly during operation at two different current densities: (a) j e l = 0 and (b) j e l = j r e f . The total electrochemical enthalpy (purple) can be divided into chemical (orange) and electrical (green) contributions. Protons in the “Anode” are bound into a hydrogen molecule with low chemical enthalpy ( Δ H c h , H O R ) and large electric energy ( U a n ). The transition to the “Membrane” requires the splitting of the molecule into two protons and two electrons, which increases the chemical enthalpy, but reduces the electric energy due to electrode charging. The reaction with oxygen at the “Cathode” results in the binding of protons into a water molecule with a large decrease in chemical energy ( Δ H c h , O R R ) and an accompanying increase in electric energy ( U c a t ), which causes a net electric potential difference between the cathode and anode ( U F C ). Under OCV conditions without electric current (a), the electrode overpotentials η a n and η c a t are determined by the Nernst Equation (25), while the potential drop across the membrane is zero. When current flows through the cell (b), larger overpotentials η a n and η c a t are needed to provide a sufficient rate of electrochemical reactions. Transport through the membrane requires an electric potential difference U m e m across the membrane.
Catalysts 13 01131 g011
Disclaimer/Publisher’s Note: The statements, opinions and data contained in all publications are solely those of the individual author(s) and contributor(s) and not of MDPI and/or the editor(s). MDPI and/or the editor(s) disclaim responsibility for any injury to people or property resulting from any ideas, methods, instructions or products referred to in the content.