Article

Effect of Re Addition on the Water–Gas Shift Activity of Ni Catalyst Supported by Mixed Oxide Materials for H2 Production

by
Jessica Gina Lomonaco
1,
Thanathon Sesuk
2,
Sumittra Charojrochkul
2 and
Pannipa Tepamatr
1,*
1
Department of Chemistry, Faculty of Science and Technology, Thammasat University, Pathumthani 12120, Thailand
2
National Energy Technology Center, NSTDA, Pathumthani 12120, Thailand
*
Author to whom correspondence should be addressed.
Catalysts 2023, 13(6), 959; https://doi.org/10.3390/catal13060959
Submission received: 31 March 2023 / Revised: 22 May 2023 / Accepted: 29 May 2023 / Published: 1 June 2023
(This article belongs to the Special Issue Advanced Catalysis for Green Fuel Synthesis and Energy Conversion)

Abstract

:
Water–gas shift (WGS) reaction was performed over 5% Ni/CeO2, 5% Ni/Ce-5% Sm-O, 5% Ni/Ce-5% Gd-O, 1% Re 4% Ni/Ce-5% Sm-O and 1% Re 4% Ni/Ce-5% Gd-O catalysts to reduce CO concentration and produce extra hydrogen. CeO2 and M-doped ceria (M = Sm and Gd) were prepared using a combustion method, and then nickel and rhenium were added onto the mixed oxide supports using an impregnation method. The influence of rhenium, samarium and gadolinium on the structural and redox properties of materials that have an effect on their water–gas shift activities was investigated. It was found that the addition of samarium and gadolinium into Ni/CeO2 enhances the surface area, reduces the crystallite size of CeO2, increases oxygen vacancy concentration and improves Ni dispersion on the CeO2 surface. Moreover, the addition of rhenium leads to an increase in the WGS activity of Ni/CeMO (M = Sm and Gd) catalysts. The results indicate that 1% Re 4% Ni/Ce-5% Sm-O presents the greatest WGS activity, with the maximum of 97% carbon monoxide conversion at 350 °C. An increase in the dispersion and surface area of metallic nickel in this catalyst results in the facilitation of the reactant CO adsorption. The result of X-ray absorption near-edge structure (XANES) analysis suggests that Sm and Re in 1% Re 4% Ni/Ce-5% Sm-O catalyst donate some electrons to CeO2, resulting in a decrease in the oxidation state of cerium. The occurrence of more Ce3+ at the CeO2 surface leads to higher oxygen vacancy, which alerts the redox process at the surface, thereby increasing the efficiency of the WGS reaction.

1. Introduction

The water–gas shift reaction describes a well-established industrial process where water vapor reacts with CO to generate hydrogen and carbon dioxide. The WGS reaction is shown in Equation (1):
CO + H2O ⇆ H2 + CO2 ΔH298 = −41.2 kJ/mol
Recently, the water–gas shift reaction has received much attention due to the development of fuel-cell technology. The water–gas shift reaction is extensively used to enhance the hydrogen amount in the synthesis gas. The reforming of hydrocarbons from fossil fuels, coal and biomass can generate synthesis gas containing H2, CO, CO2 and H2O [1]. However, the existence of CO poisons the catalyst employed in a fuel cell. An advantage of using the water–gas shift reaction is that it can decrease the concentration of carbon monoxide while generating extra hydrogen as fuel for H2 fuel cells.
A WGS catalyst based on cerium oxide has become increasingly attractive due to its high oxygen mobility, reducibility and oxygen storage capacity. Pt/CeO2-based catalysts are the most active in the water–gas shift reaction, but their high price prompts the search to find cheaper and more abundant materials. Many studies have reported good performance of transition metals, such as nickel, copper, cobalt, iron and manganese, on many supports for the WGS reaction [2]. Among these metals, Ni is quite interesting as it is used as a promoter for many reactions, such as reforming, hydrogenation or hydrocracking processes [3,4,5,6]. For example, Ni-SBA-15 catalysts were investigated for catalytic activity of CH4 dry reforming. The results showed that catalytic performance and stability were increased because of Sm promotion in the interaction of nickel, with the support and the dispersion of Ni [6].
The dopant incorporation promotes the oxygen storage capacity of CeO2 [7,8,9,10]. Ce4+ can be replaced by lower-valence rare-earth elements, e.g., Sm3+ or Gd3+, leading to the creation of oxygen vacancy by charge compensation [8]. The effect of Zr- and Sm-doped ceria on the Ni/ceria catalyst during dry reforming of the methane reaction was investigated by Luisetto and co-workers [7]. They investigated the number of defects of ceria-based materials by Raman spectroscopy. They found that Sm-doped ceria showed a higher number of defects than Zr-doped ceria. A direct correlation between water–gas shift activity and oxygen storage capacity (OSC) was found by Luo and co-workers. Metal-doped CeO2 had higher OSC and reducibility than pure CeO2, resulting in the enhancement of redox activity [11]. In addition, Re is a good choice to replace the Pt group metal catalyst due to its excellent electrochemical properties, lower cost compared to Pt metal and sustainable sources. Recently, water–gas shift activity in Re-based catalysts was studied, and the results showed that Re supported on an alumina catalyst promoted by K and Co exhibited an excellent performance for the WGS reaction [12]. In addition, the water–gas shift activity of Pt-Re bimetallic and Pt alone supported on a zirconia-doped ceria has been evaluated [13]. Pt-Re/CeZrO illustrated higher water–gas shift activity than Pt/CeZrO because Pt dispersed better on bimetallic Pt-Re than on the monometallic Pt. Many studies have reported that Re promotes the water–gas shift activity of Pt as it enhances Pt dispersion on the support surface and inhibits Pt sintering [14,15].
The aim of this work was to compare the performance of Ni/CeO2 and Ni/CeMO (M = Sm and Gd) catalysts for the WGS reaction. In addition, the influence of Re impregnation on the WGS activity of Ni/CeO2-based catalysts was investigated. Effects of rhenium addition and different dopant materials on the WGS performance were determined using BET surface area, X-ray diffraction, H2 temperature-programmed reduction, O2 temperature-programmed desorption, CO temperature-programmed desorption and chemisorption techniques to explain the key factors in improving catalytic activity.

2. Results and Discussion

2.1. Catalysts Characterization

Figure 1 presents the X-ray diffraction profiles of the supported Ni catalysts. It indicates that ceria phases were found in all supported Ni catalysts, in which the diffraction peaks marked in Figure 1 correspond well to JCPDS No. 43-1002 of standard ceria with a cubic structure. Additionally, the diffraction peaks at around 2θ = 37.2°, 43.3° and 63.1 correspond to the NiO phase in the supported Ni catalysts, which is identical to JCPDS No. 75-0197 [16,17]. The NiO peaks of supported Ni catalysts were very weak, indicating that there was only a small proportion of NiO. The crystallite size of ceria in the Ni/CeO2-based catalysts were considered by the Debye Scherrer equation, and the results are listed in Table 1. Ni addition onto ceria support by an impregnation method resulted in a growth in crystallite size and a decrease in surface area (Table 2) because the calcination at a high temperature (650 °C) after impregnation of Ni leads to the agglomeration of CeO2 crystallites. However, it was found that the CeO2 crystallite size decreases when Sm and Gd are loaded into 5% Ni/CeO2, which is related to an increase in the suitable dispersion of NiO. The lattice parameter of CeO2 was calculated from 111 diffraction peaks broadening. The CeO2 lattice constant of pure ceria and supported Ni catalysts were found in the range of 0.5407–0.5435 nm. Ni ion could not be inserted into the ceria lattice due to the nature of impregnation synthesis. The lattice contraction after the impregnation of Ni was a result of calcination at a high temperature during the impregnation step (650 °C), which can further decompose surface hydroxyls to reduce the cell dimension. The diffraction peaks of Ni/Ce-5% Sm-O and Ni/Ce-5% Gd-O appeared at slightly lower diffraction angles compared with the diffraction peaks of Ni/CeO2. The lower displacement indicates unit cell enlargement. An increase in CeO2 lattice parameters of Ni/Ce-5% Sm-O and Ni/Ce-5% Gd-O when compared with Ni/CeO2 because of Ce4+ ions were replaced by larger cations (Sm3+ or Gd3+). Comparison of ionic radii of Ce4+ (0.097 nm), Sm3+ (0.108 nm) and Gd3+ (0.105 nm) suggested that the dopant ions presented in the ceria lattice should be M3+. Moreover, under calcination temperature, M should take the higher oxidation state, M3+ (M = Sm and Gd). It can be concluded that Sm3+ or Gd3+ incorporation in the ceria lattice generates unbalanced charges and strain; thus, oxygen vacancy is expected to be generated [18,19,20].
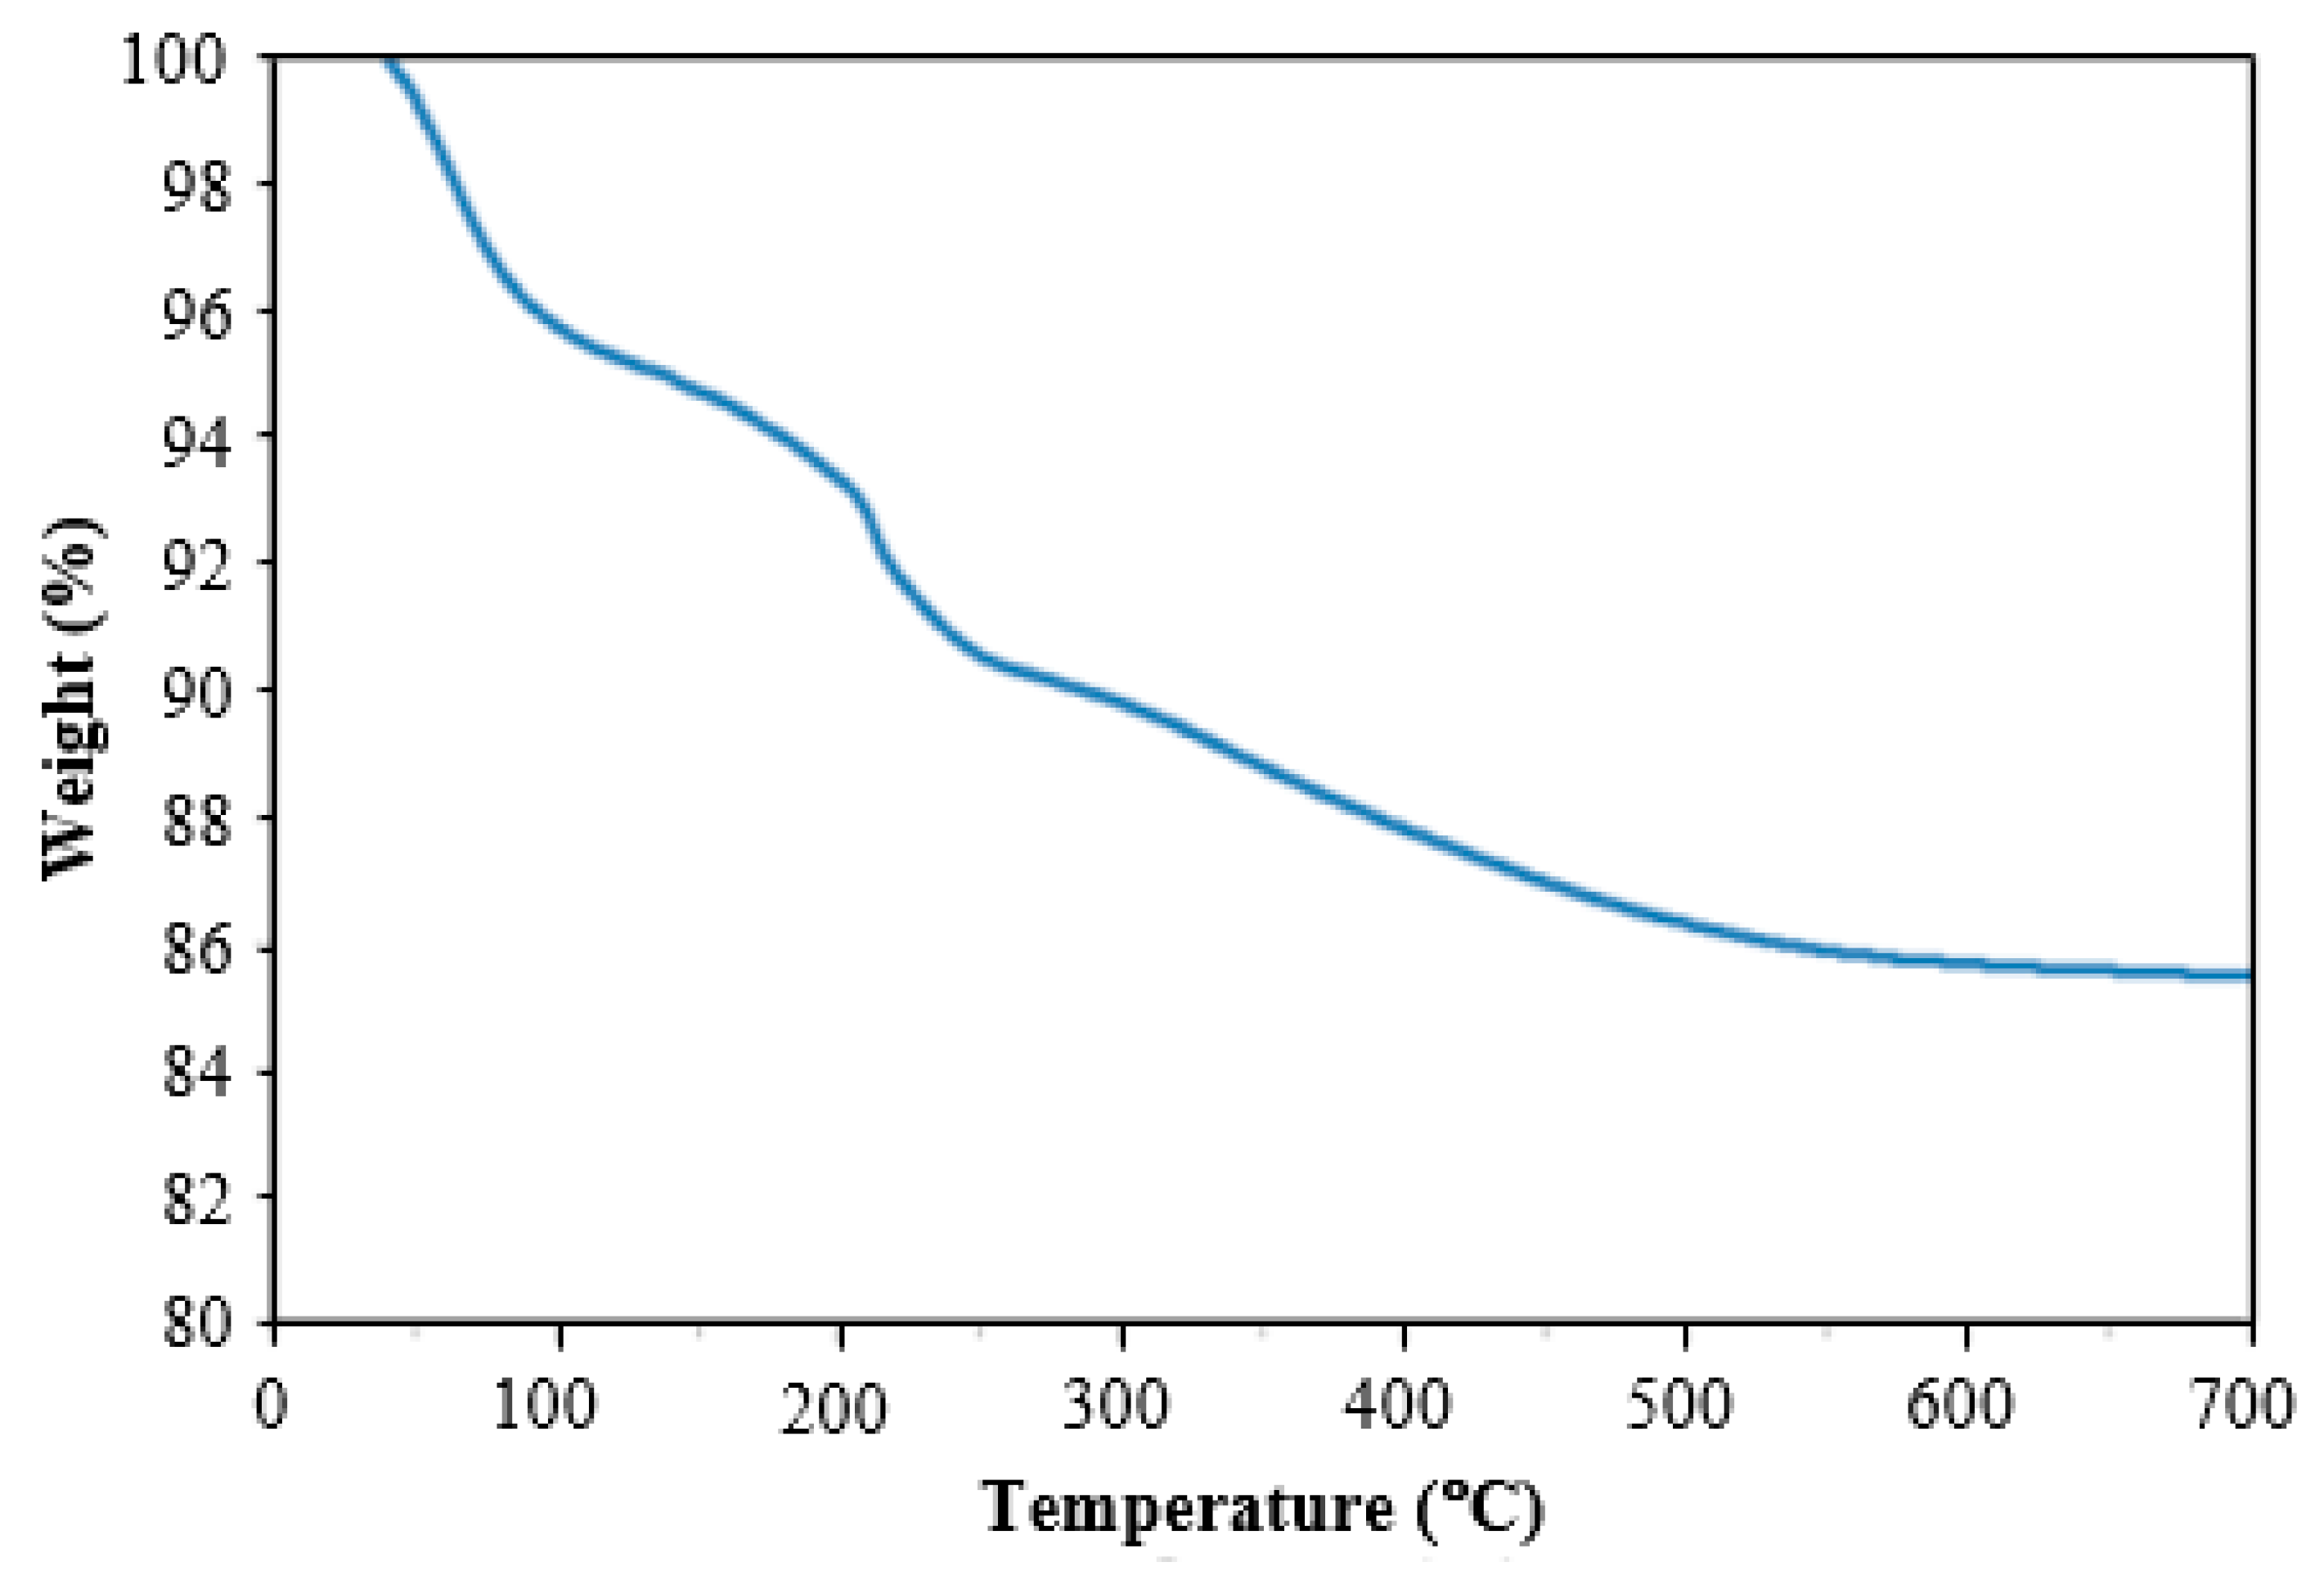
TGA analysis was used to investigate the thermal decomposition of 1% Re 4% Ni/Ce-5% Sm-O (Figure 2). Figure 2 presents the three steps of thermal decomposition in air atmosphere. The slight weight loss of 6 wt.% was found in the first step at a temperature below 200 °C, which is related to the loss of moisture. In the next step, a minor weight loss of 5 wt.% was observed in a temperature range from 200 to 300 °C. This result is due to the exothermic decarboxylation process. The final weight-loss stage is observed in the temperature range of 300–600 °C with 4 wt.% weight loss, which is attributed to exothermic combustion. The absence of any weight loss at temperatures above 650 °C suggest that metal oxide is completely formed. This result confirms that the optimum temperature for the calcination of the samples is 650 °C.
Surface area, pore diameter and pore volume of Ni catalysts are summarized in Table 2. The specific surface area was obtained using the multipoint BET method. The Barrett–Joyner–Halenda (BJH) method was applied to determine the pore volume and pore diameter. Doping ceria with Sm and Gd resulted in a decrease in crystallite size. Smaller crystallite size was associated with an increase in a specific surface area. The average pore diameters decreased with the addition of Sm and Gd into the Ni/CeO2-based catalysts. An increase in surface area with a reduction in pore diameter size suggested that the materials were more porous with smaller pores and a greater surface area. As observed, the pore volume remained almost constant. Hence, an addition of Sm and Gd in Ni/CeO2-based catalysts does not cause any pore blockage.
Ni dispersion over monometallic Ni and bimetallic NiRe supported on ceria and mixed oxide supports was investigated using H2 chemisorption analysis (Table 2). The results showed that an addition of Sm or Gd to Ni/CeO2 enhances nickel metal dispersion on the catalyst surface. Moreover, an impregnation of Re onto Ni/CeMO (M = Sm and Gd) greatly increased the dispersion and surface area of metallic Ni. This result is likely due to the electron movement between rhenium, nickel and ceria, which leads to the presence of a strong metal–support interaction. The strong metal–support interaction can improve the metal dispersion of certain oxides, which leads to the enhancement of metal surface coverage or reduces particle size [21]. In addition, nickel metal was believed to be an active site for the WGS reaction. Among all the catalysts used, 1% Re 4% Ni/Ce-5% Sm-O exhibited the greatest surface area and dispersion of metallic Ni. Typically, a higher surface area of metal provides an enhancement of water–gas shift activity because more surface-active sites are exposed to reactants [22].
The water–gas shift reaction is recognized as a redox mechanism (Equations (2)–(4)) at high temperatures, where carbon monoxide molecules adsorb on the surface of the catalyst and extract one oxygen from the metal oxide support to produce CO2. The loss of oxygen from metal oxides generates oxygen vacancies, which are fulfilled by separating H2O molecules to create H and O atoms. H atoms combine and desorb into H2 gas, while O atoms are captured by oxygen-depleted metal oxides [23].
CO + σ → COad (CO adsorbs on the active metal sites (σ))
COad + 2CeO2 → CO2 + Ce2O3 + σ
H2O + Ce2O3 → 2CeO2 + H2
As is well known, oxygen vacancies are major defects on the ceria surface. Oxygen vacancy plays a beneficial role in the charge transfer and dissociation of H2O molecules, which promotes the catalytic activity of the water–gas shift catalyst [24]. The availability of oxygen vacancies, the optimal strength for carbon monoxide adsorption and H2O dissociation activity play an important role in improving the performance of the water–gas shift reaction [25]. In this work, we try to quantify oxygen vacancies in ceria-based catalysts using Raman spectroscopy to understand the properties of the WGS catalysts.
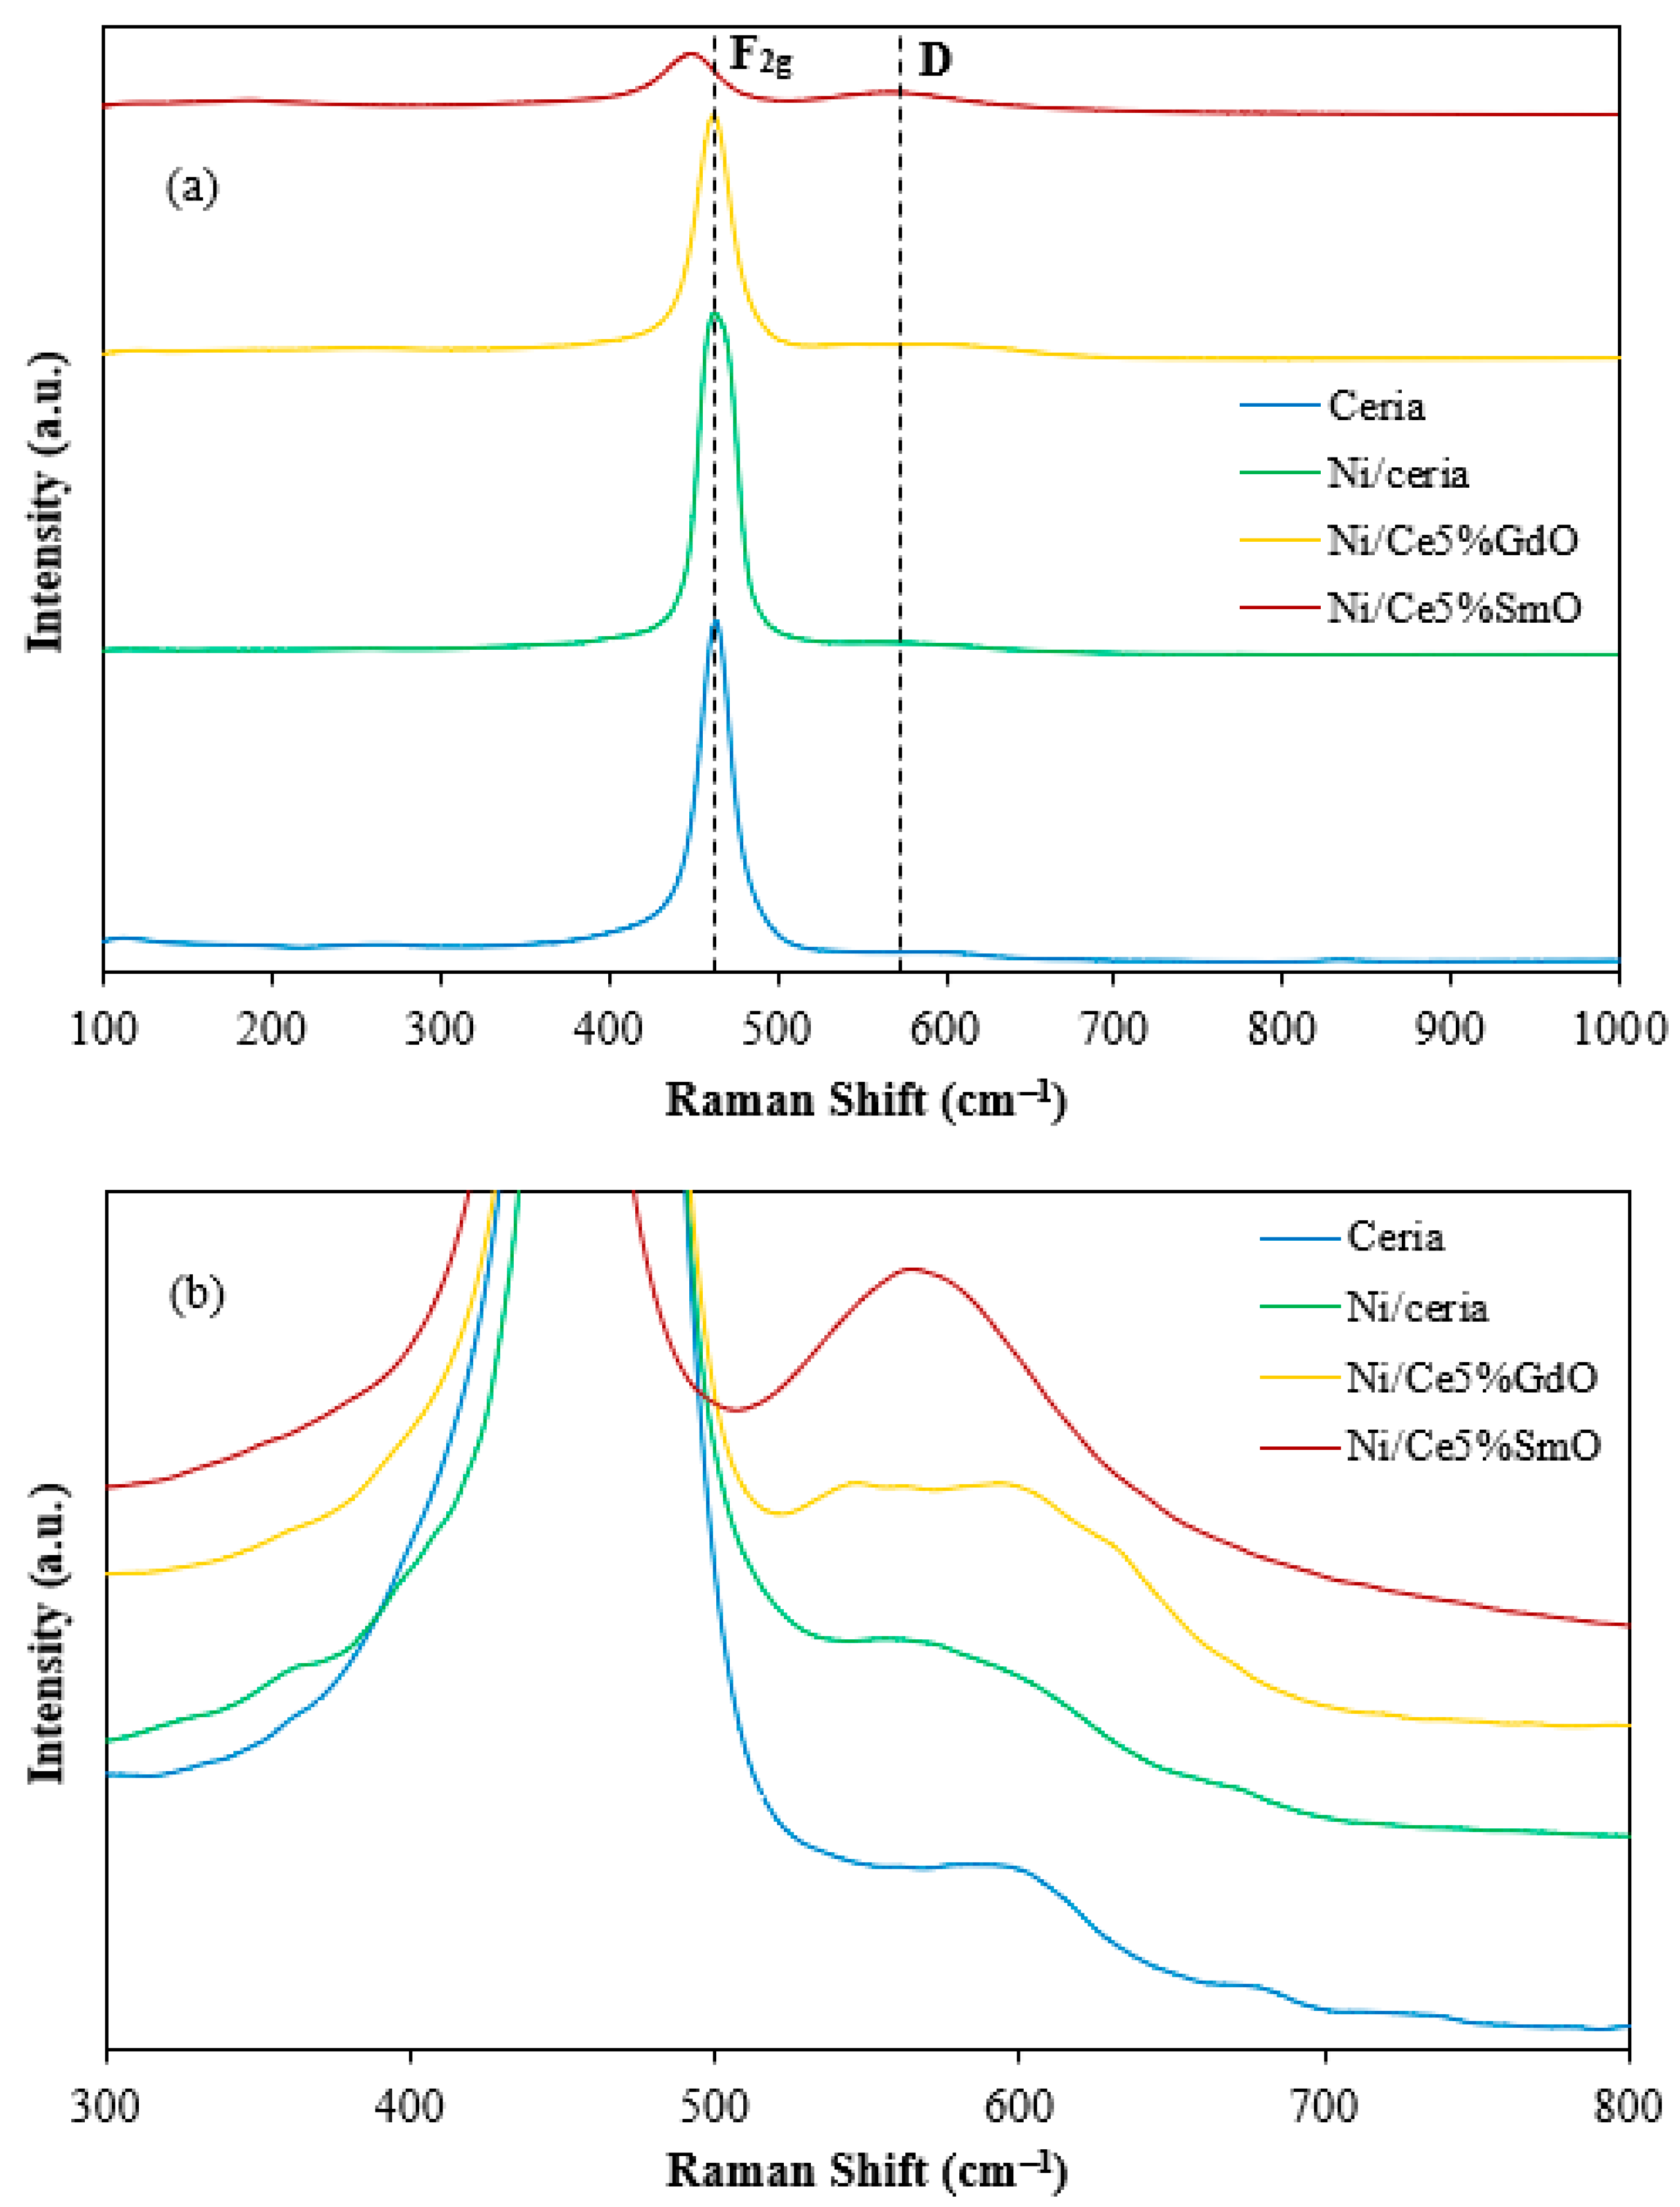
Raman spectroscopy analysis was performed to reveal the defect structure of supported Ni catalysts (Figure 3). In the Raman spectra, a Raman peak at 464 cm−1 is assigned to a triple degeneracy active mode, which is called F2g mode. This represents the symmetrical stretching vibration formed by eight oxygen atoms bound to one cerium atom. In addition, there is another broad peak at around 570 cm−1 in the 5% Ni/Ce-5% Sm-O catalyst, which is called the D band. The D band is a defect-induced mode due to the presence of a different charge state of doping cations or surface defects that are related to the oxygen vacancies’ evolution [26,27]. The ratio of ID/IF2g represents the oxygen vacancies’ concentration [28]. The intensity of the D peak and the ratio of ID/IF2g in the 5% Ni/Ce-5% Sm-O catalyst are higher than that of other catalysts, indicating that the 5% Ni/Ce-5% Sm-O catalyst has the highest oxygen vacancy concentration. Moreover, the F2g peak of 5% Ni/Ce-5% Sm-O shifted to 455 cm−1 due to the enhancement of Ce3+ cations and oxygen vacancies. The presence of Ce3+ in the ceria support leads to an increase in the unit cell parameter and decrease in the bonds’ force constants, resulting in a red shift of the F2g band. High oxygen vacancy concentration in the 5% Ni/Ce-5% Sm-O catalyst alerts the interaction between nickel and ceria to drive metal dispersion [29], hindering nickel particle sintering, which is expected to increase stability.
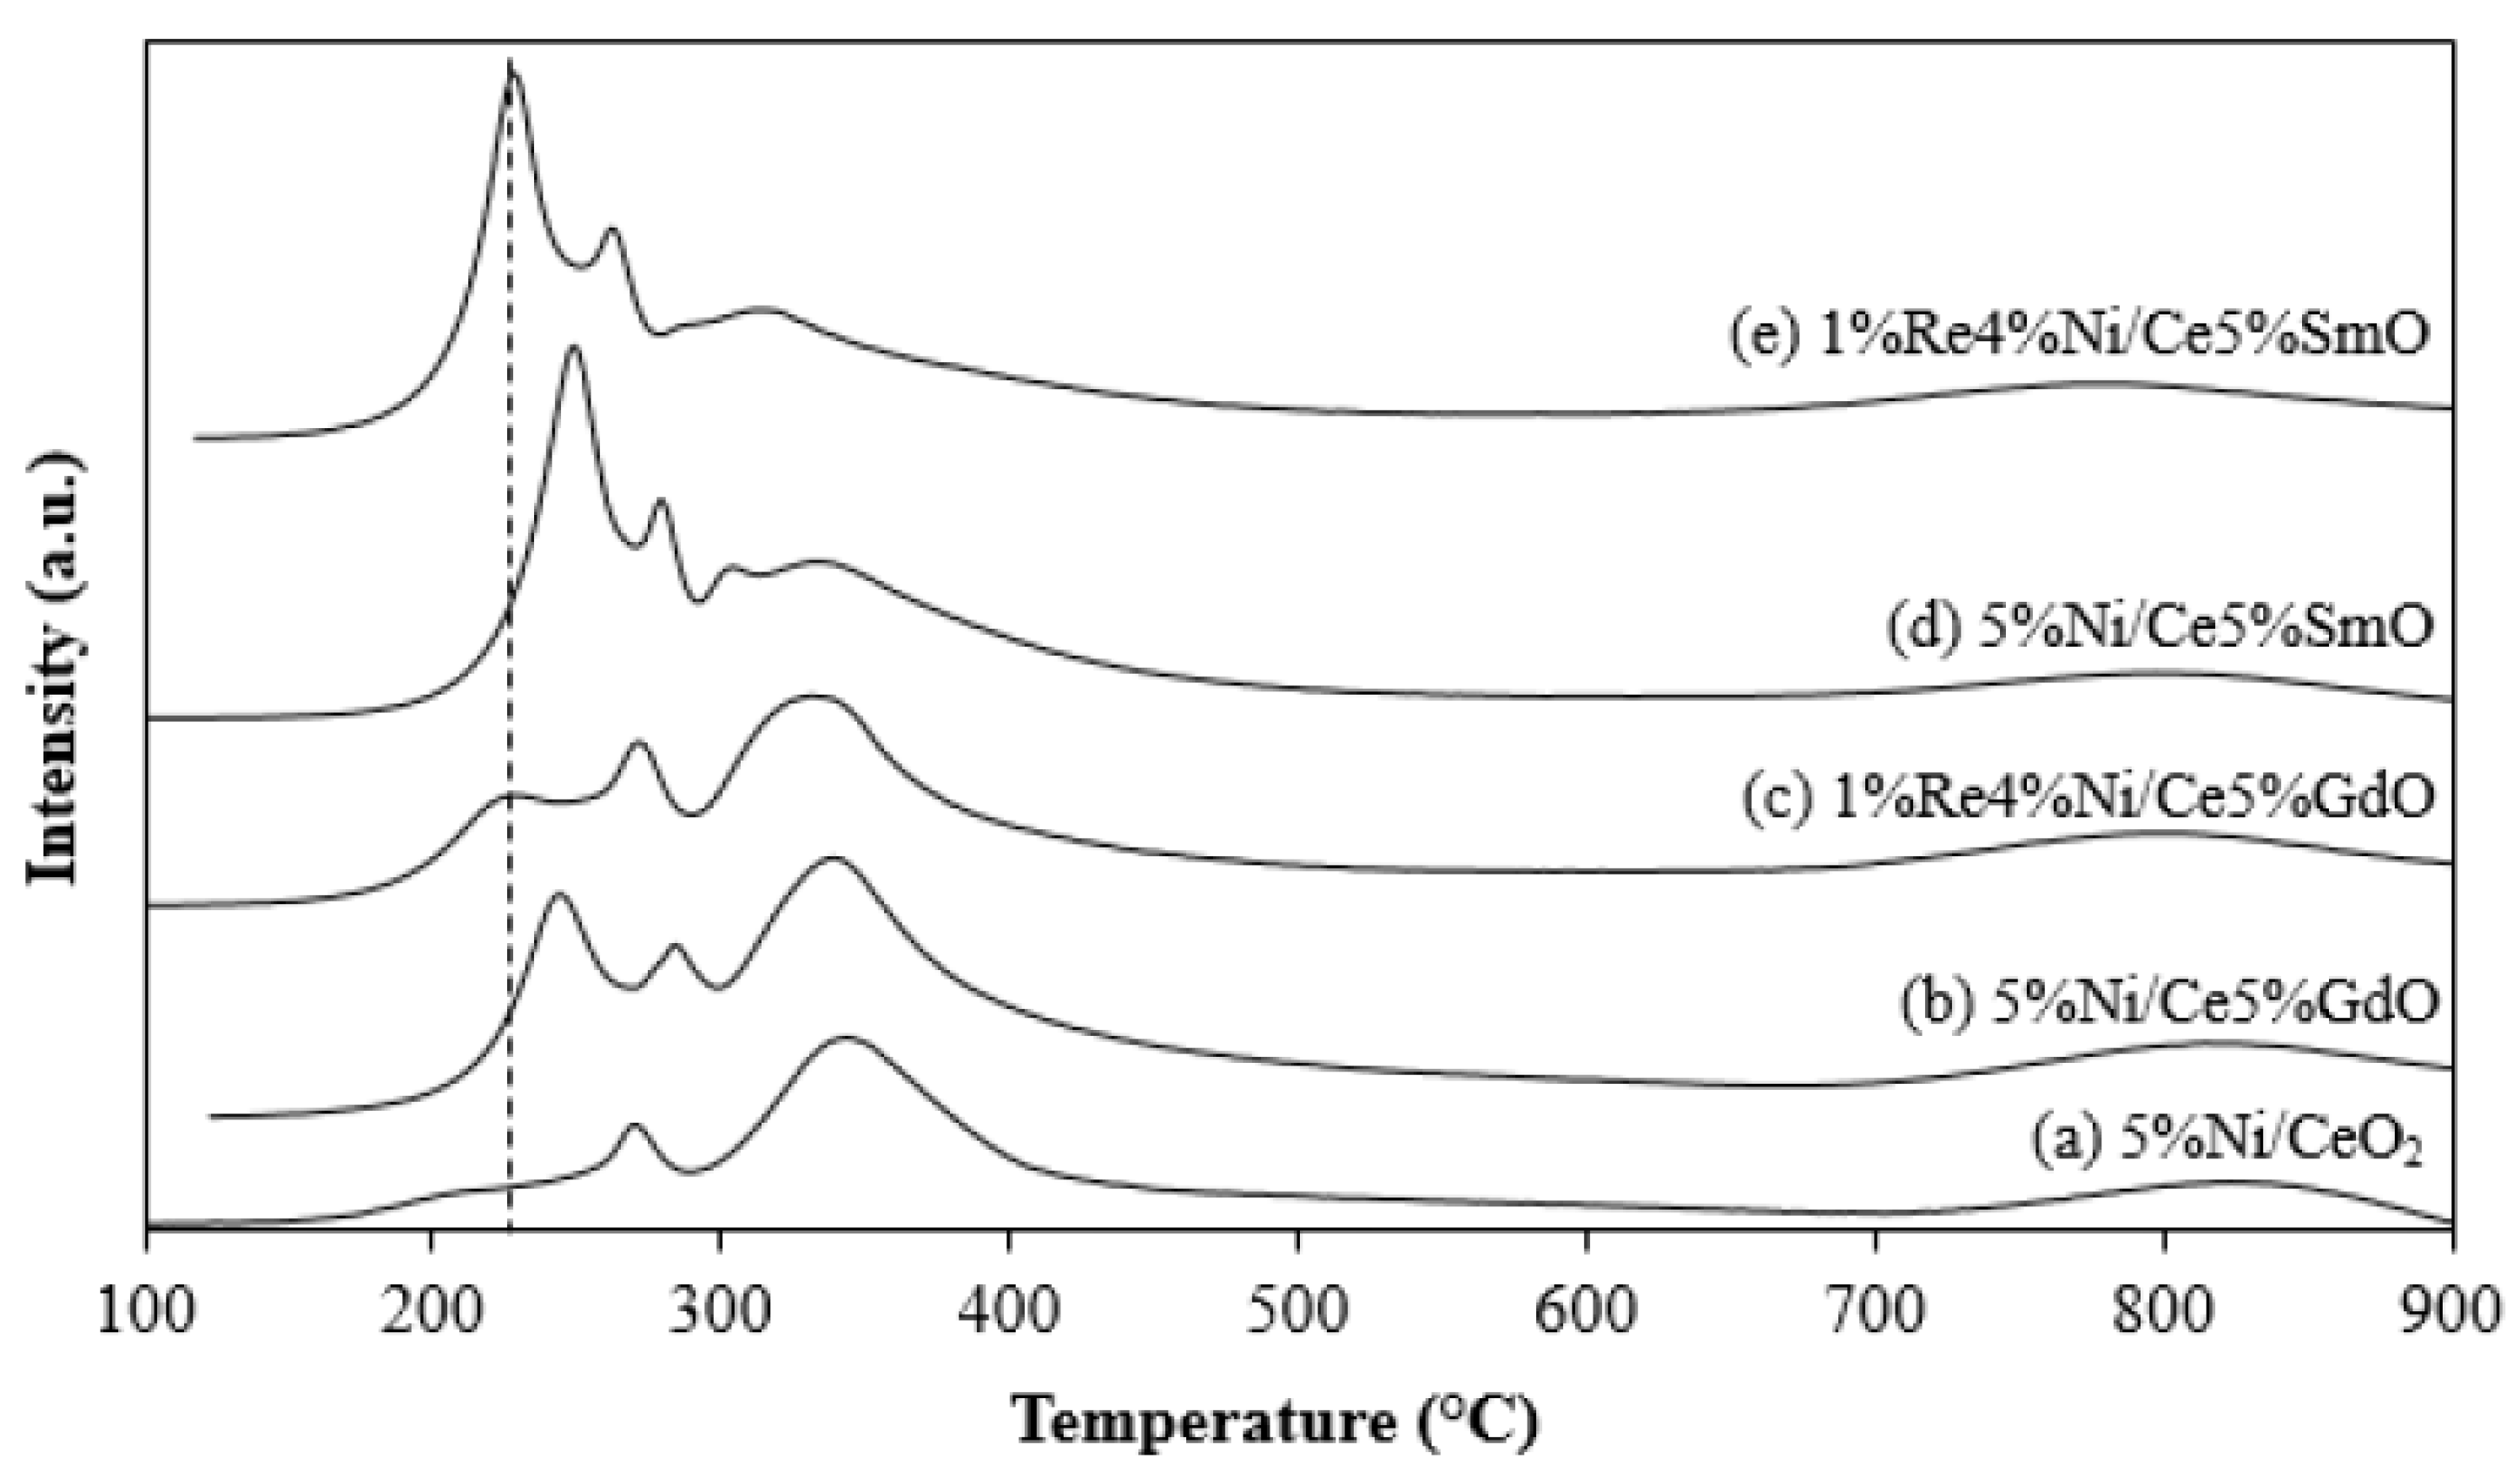
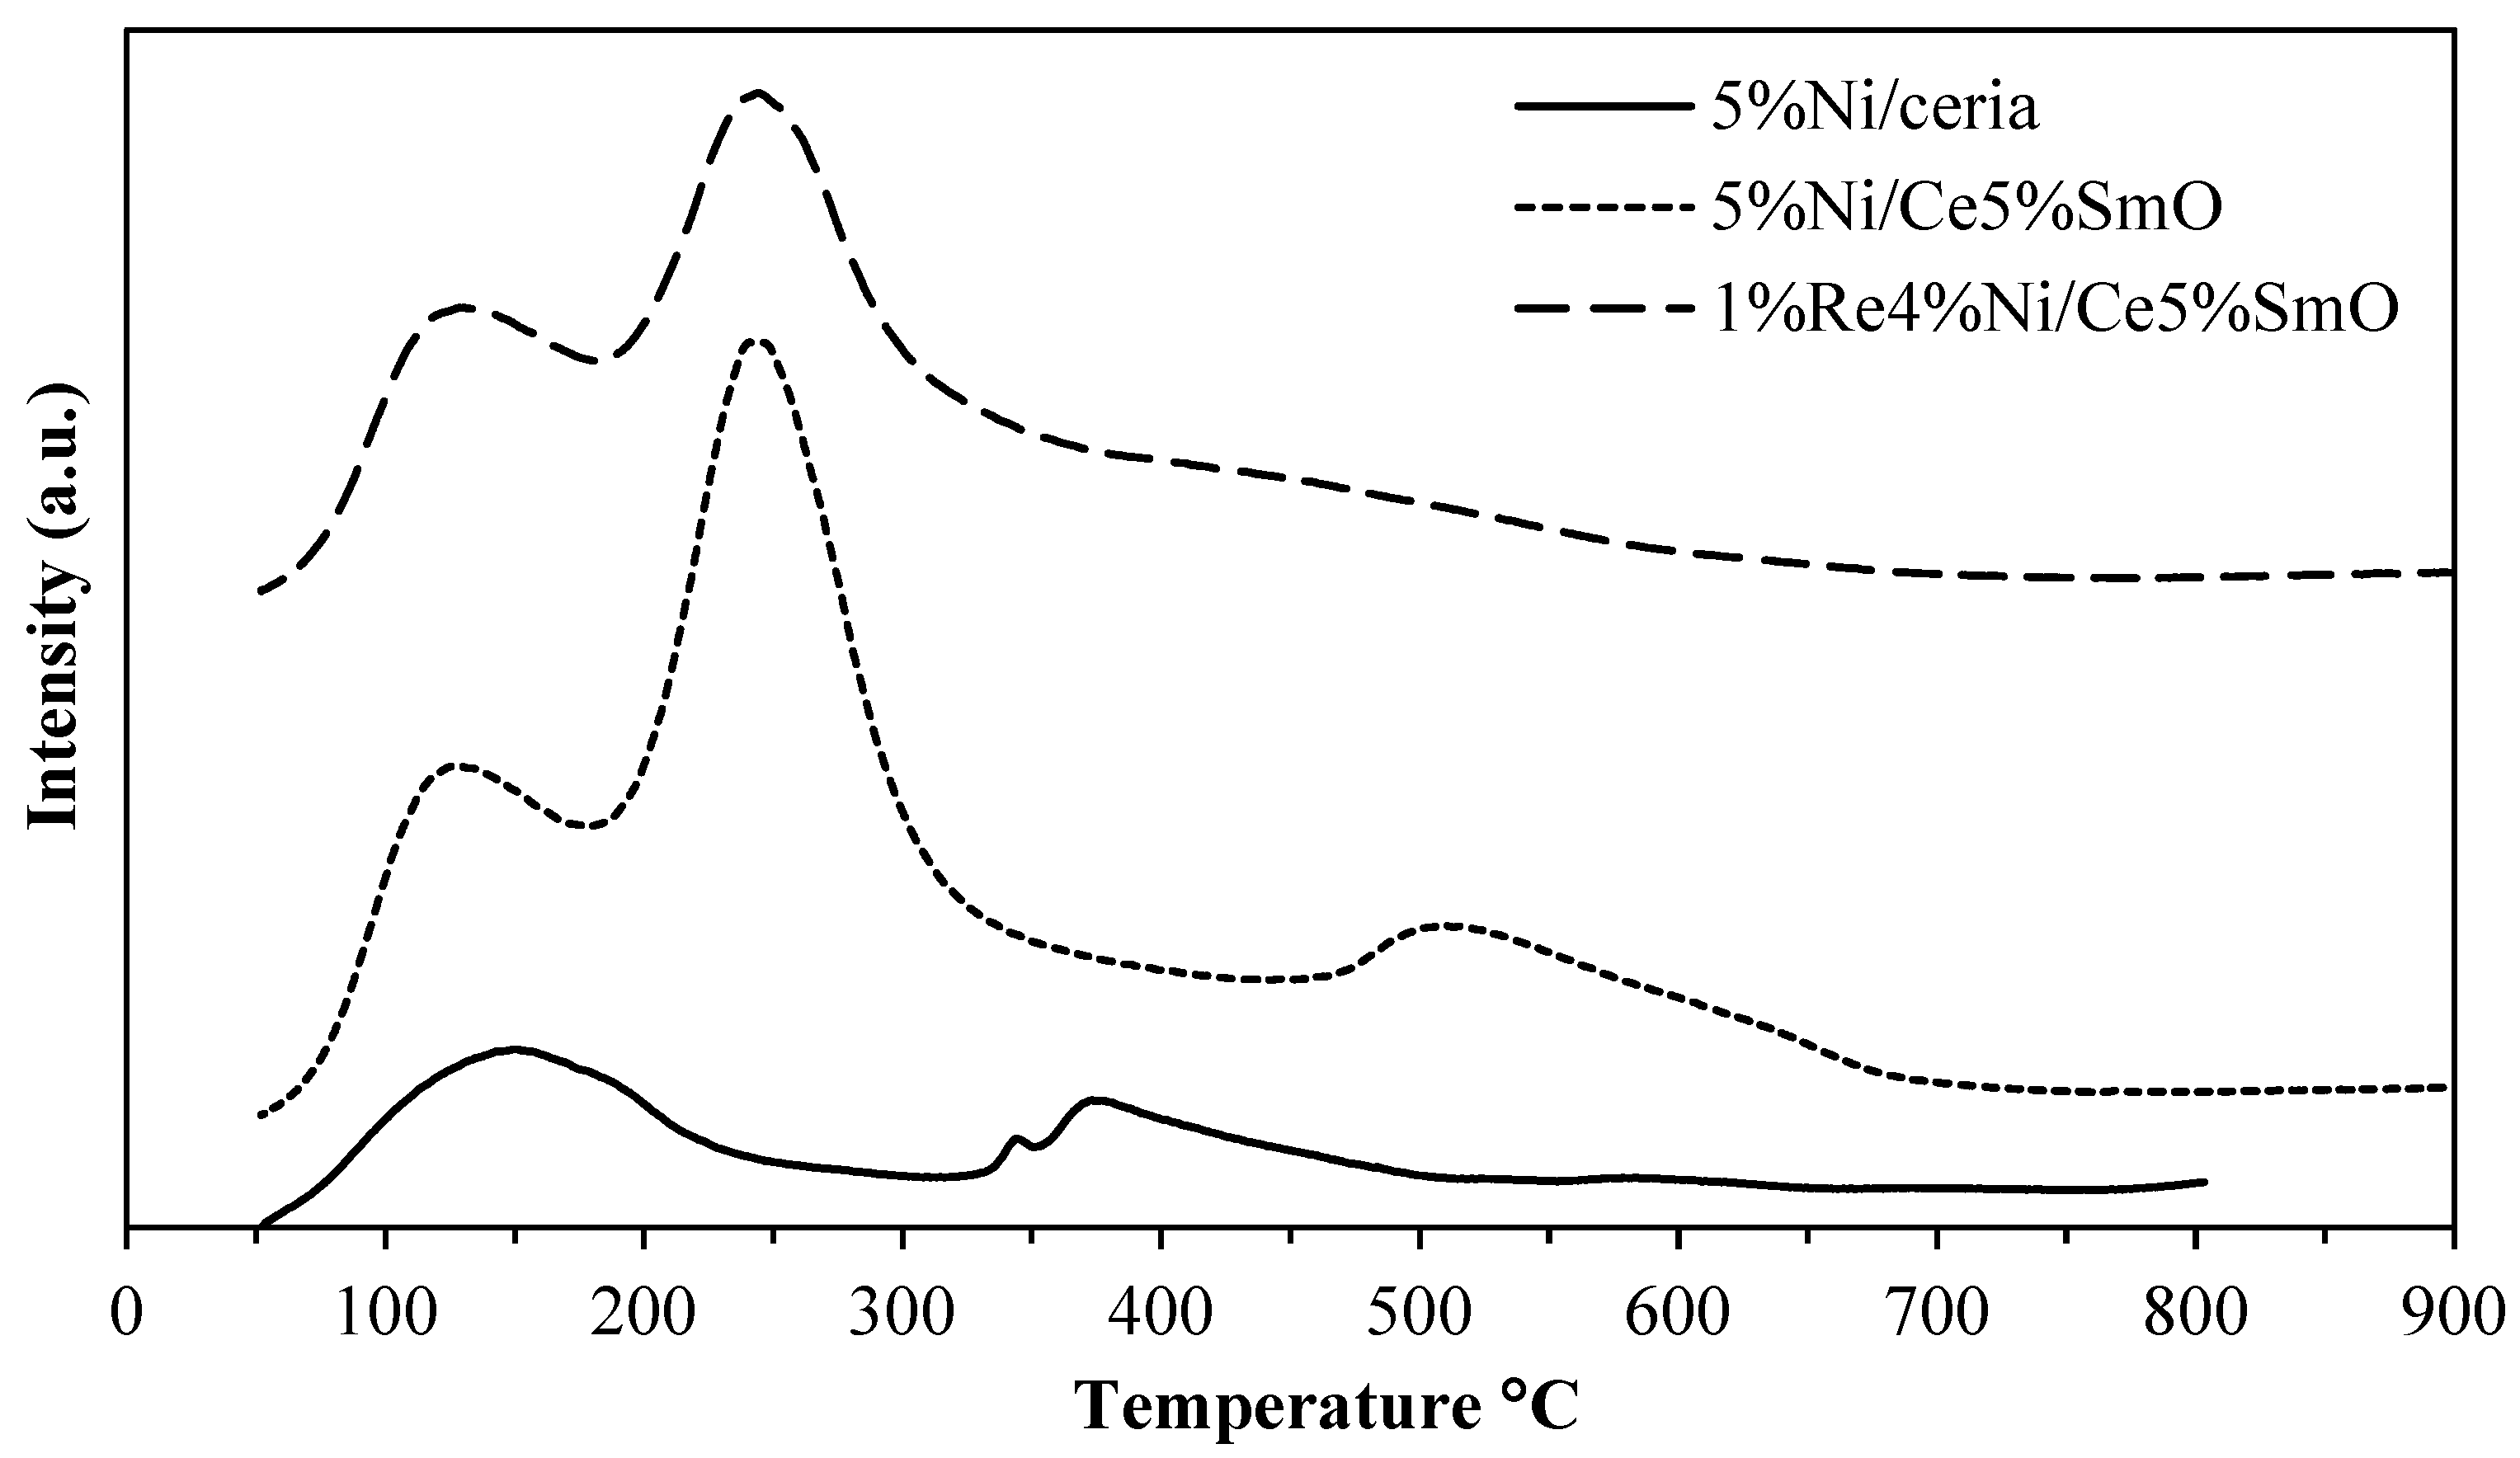
The TPR profiles of 5% Ni/CeO2-based catalysts and 1% Re 4% Ni/CeO2-based catalysts are exhibited in Figure 4. There were three main reduction peaks at the low temperature range of 230–280 °C, medium temperature range of 320–350 °C and high temperature range (850 °C), which was attributed to the bulk reduction. For lower temperatures, H2 consumption is due to the reduction in NiO species, whereas the nickel-catalyzed reduction in the CeO2 surface shell occurs at a medium temperature [19]. Two NiO reduction peaks of 5% Ni/Ce-5% Sm-O suggested a different environment of nickel. Ni was located at 250 °C and 280 °C, which suggested a different environment of Ni. The consumption peak at 250 °C was due to the nickel reduction in the vicinity of CeO2, while the reduction peak at 280 °C was due to the presence of samarium. The reduction in bimetallic NiRe is compared with monometallic Ni supported on M-doped ceria (M = Sm and Gd). It was found that the reduction peaks of the NiO and CeO2 surface of bimetallic 1% Re 4% Ni/Ce-5% Sm-O appeared at the lowest temperature. It is interesting to note that an incorporation of samarium and rhenium shifts the consumption peaks of NiO species and the ceria surface to the lowest temperature when compared to other catalysts. The results imply that the bimetallic 1% Re 4% Ni/Ce-5% Sm-O catalyst is more active than other catalysts. Typically, the generation of oxygen vacancies results in easy oxygen exchange; thus, reactive oxygen can be easily reduced by H2 at low temperatures. As a result of Raman spectroscopy, it is indicated that the formation of the oxygen vacancy enhances the ability of the catalyst reduction.
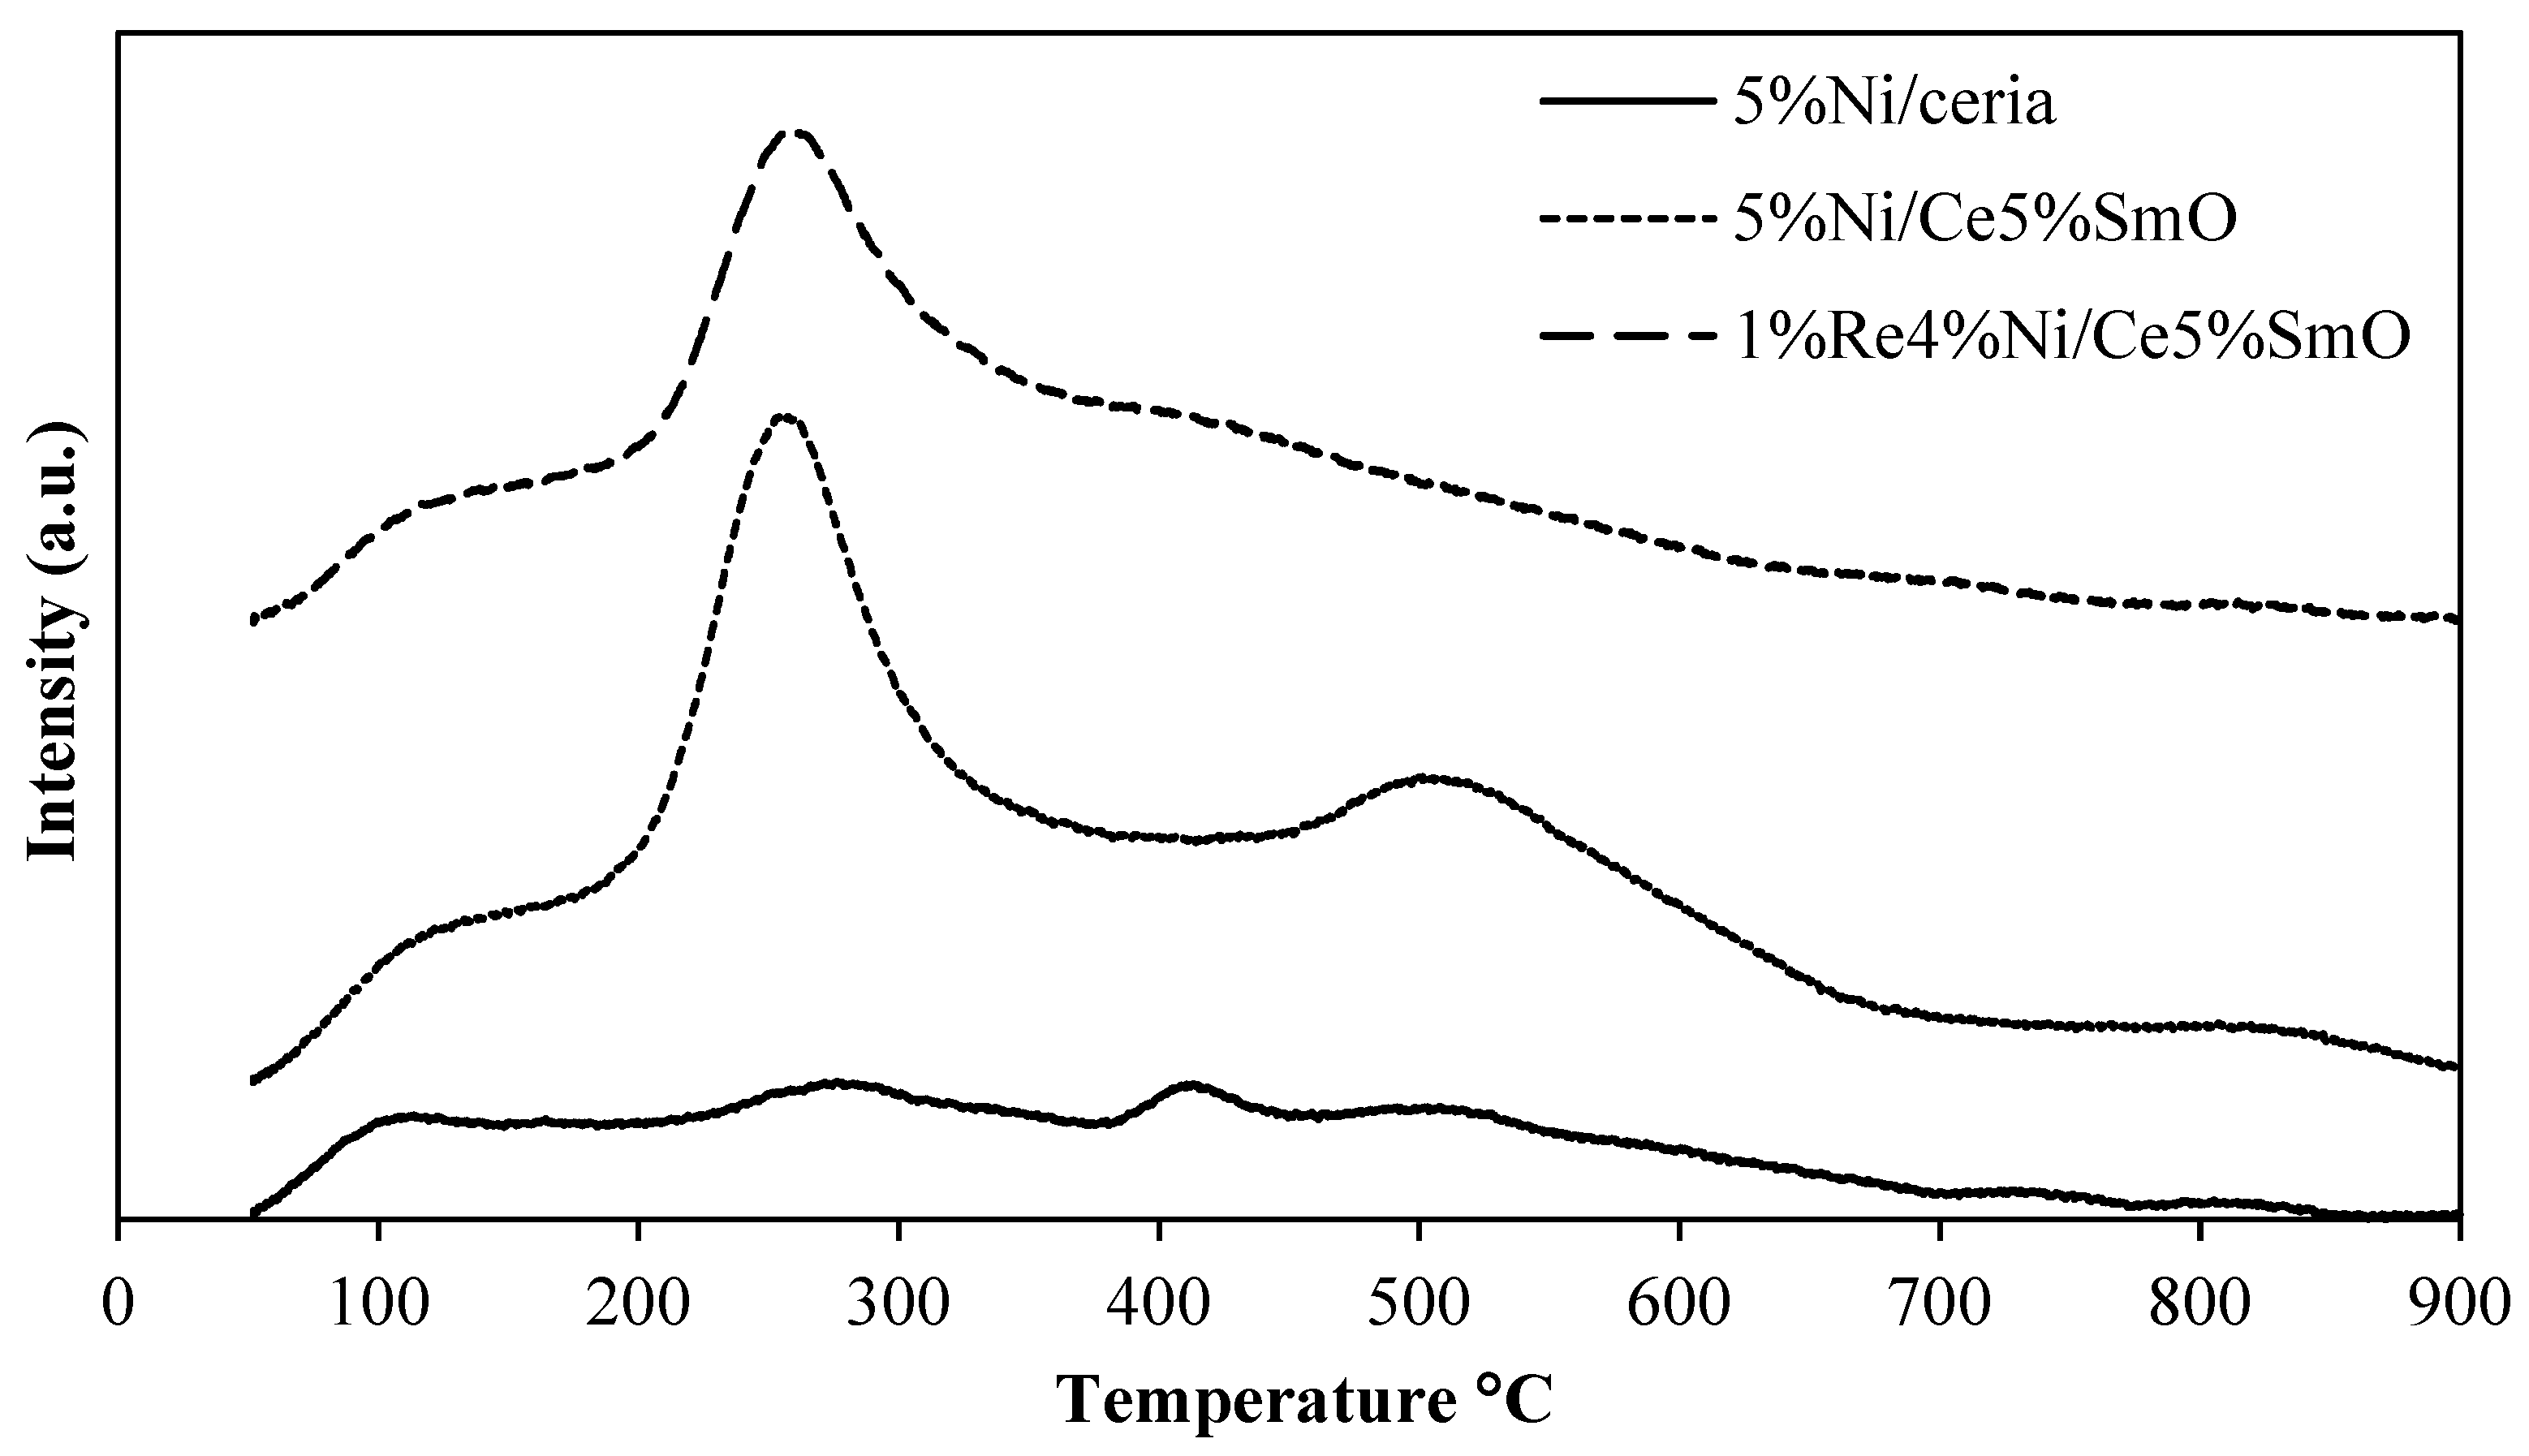
O2-TPD and CO-TPD were used to investigate the availability of reactive oxygen species in Ni/ceria-based catalysts. Figure 5 exhibits the O2-TPD of Ni/CeO2, Ni/Ce-5% Sm-O and NiRe/Ce-5% Sm-O. The low-temperature peak (below 200 °C) can be attributed to adsorbed O2 on O vacancies. The absence of high-temperature O2 desorption peaks in the bimetallic NiRe/Ce-5% Sm-O suggests the easy release of lattice O. From the study by Dutta and co-workers [30], it was proposed that by replacing cerium with titanium ion, disorder can be generated, leading to asymmetry in the crystal structure with weak M-O bonds. Similarly, the distorted O lattice in 1% Re 4% Ni/Ce-5% Sm-O may lead to the generation of weak bonds in the oxide, which explains the simple release of oxygen.
The CO-TPD in Figure 6 illustrates that the CO2 desorption peak of 1% Re 4% Ni/Ce-5% Sm-O appeared at a lower temperature than that of other catalysts, which suggests that the adsorbed carbon monoxide can easily react with surface O, generating carbon dioxide (mass 44 was monitored using mass spectroscopy after CO exposure in CO-TPD analysis). As a result of H2-TPR, H2 consumption at below 300 °C corresponds to the reduction 9j nickel ion and weak Ce-O and Sm-O bonds adjacent to Ni [31]. The reduction peak at low temperatures on 1% Re 4% Ni/Ce-5% Sm-O is much more intense than those for 1% Re 4% Ni/Ce-5% Gd-O, 5% Ni/Ce-5% Gd-O and 5% Ni/ceria, suggesting a high proportion of weakly bound surface O on 1% Re 4% Ni/Ce-5% Sm-O, which can be easily eliminated by hydrogen. The results agree well with O2-TPD that 1% Re 4% Ni/Ce-5% Sm-O has more active O, which can be adsorbed in asymmetrical oxygen vacancies. Hence, it can easily be released and subsequently reveal active oxygen vacancy sites.
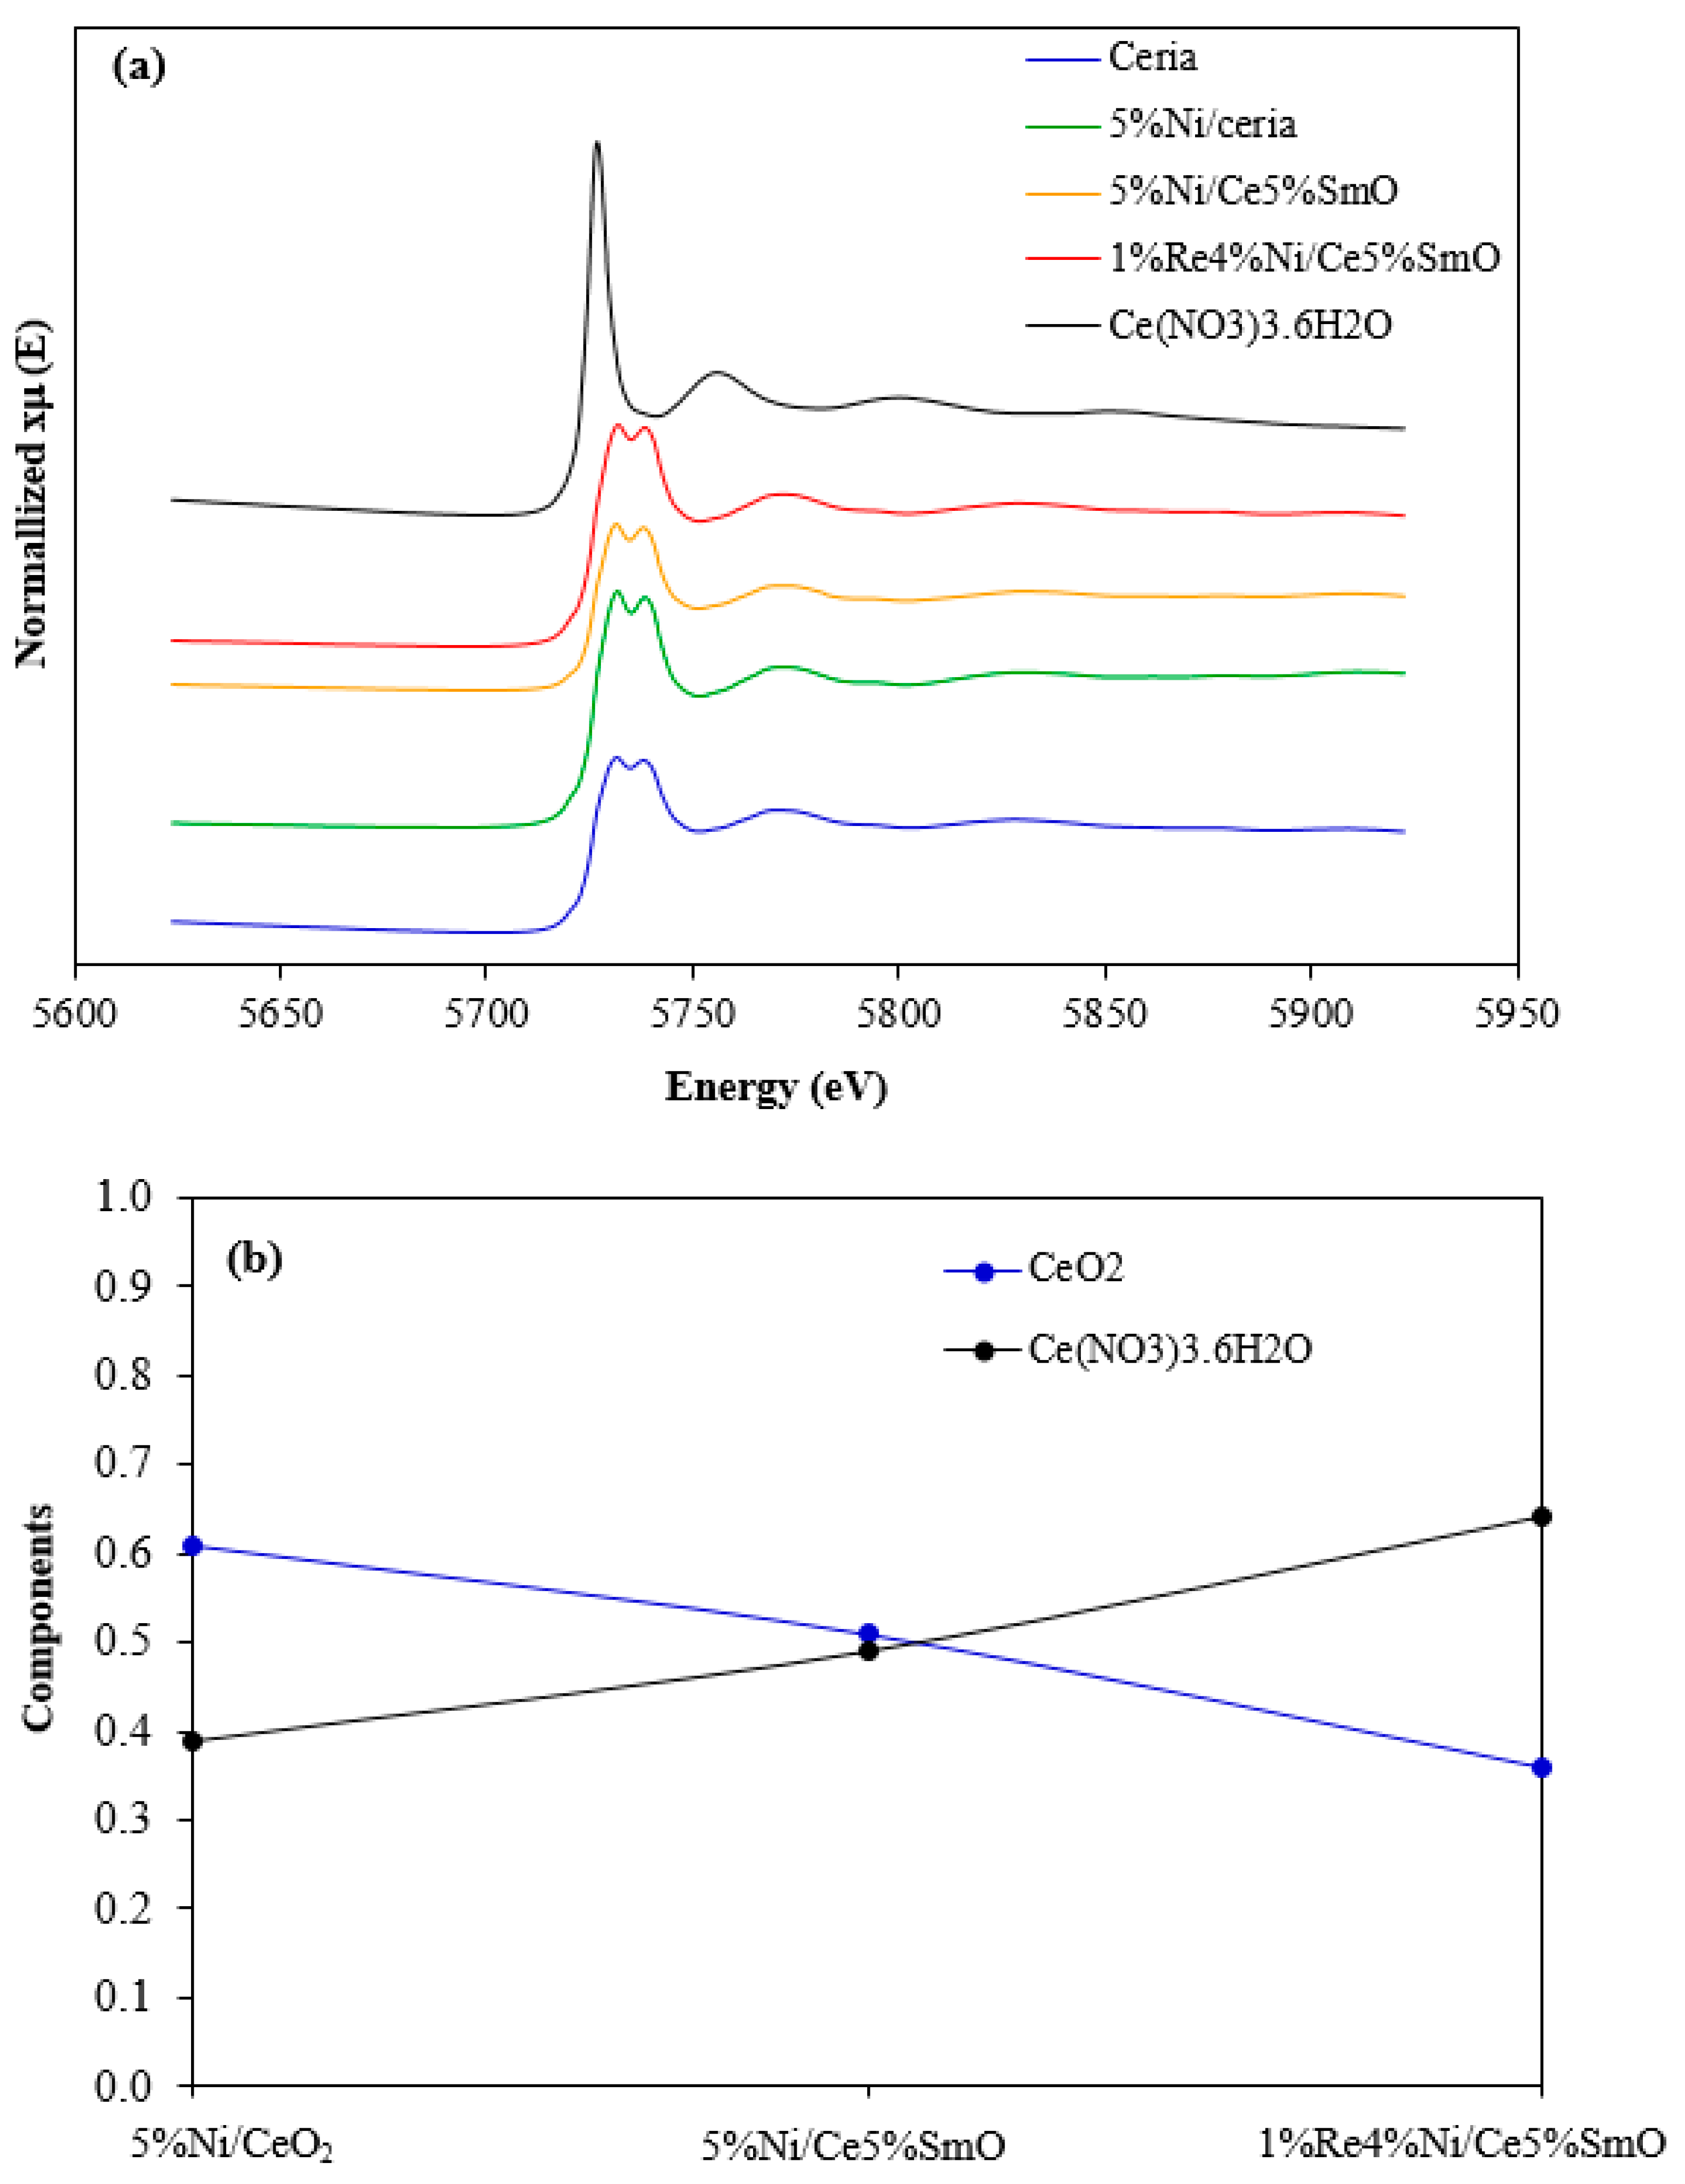
Figure 7a exhibits the X-ray absorption near-edge structure spectra of Ce L3 absorption edges for 5% Ni/CeO2, 5% Ni/Ce-5% Sm-O and 1% Re 4% Ni/Ce-5% Sm-O compared with ceria and Ce(NO3)3·6H2O. The XANES of ceria presents a double white line, which was assigned to the transition of Ce 2p to the mixed valence state of ground-state-electron configuration Ce 4f0, as well as one with 4f1. A single white line was found for Ce(NO3)3·6H2O at 5725.1 eV, which was ascribed to cerium in the trivalent state [32]. Figure 7b shows the linear combination fit result of 5% Ni/CeO2, 5% Ni/Ce-5% Sm-O and 1% Re 4% Ni/Ce-5% Sm-O. Elemental species in the unknown sample can be quantified using a linear combination fit, clarifying that a linear sum of mass absorptions of standards is the total mass absorption of an edge element in the unknown sample. CeO2 and Ce(NO3)3·6H2O are standards for the plot of linear combination fit. This plot suggests that the Ce oxidation states in the 5% Ni/Ce-5% Sm-O compound are lower than the Ce oxidation states in 5% Ni/CeO2. Sm donates some electrons to CeO2, resulting in an enhancement of the Sm oxidation state and a lowering of the Ce oxidation state. Moreover, the Ce oxidation state in 1% Re 4% Ni/Ce-5% Sm-O was the lowest when compared with other catalysts. The results indicate that both Re and Sm donate their electrons to ceria, resulting in a further decrease in the Ce oxidation state. Increasing the concentration of Ce3+ produces greater oxygen vacancies, which facilitates the movement of electrons at the surface, thus leading to an enhancement of WGS rate.
The XANES results indicate that the addition of Re helps to increase the concentration of Ce3+ because Re donates its electrons to ceria, resulting in an increase in the Re oxidation state and a decrease in the Ce oxidation state. It has been previously reported that the Ce3+ ratio represents the oxygen vacancies that drive the redox reactions [33]. In addition, experimental and theoretical studies have verified that the enhanced content of Ce3+ leads to the generation of more oxygen vacancies on the ceria surface [34,35]. Oxygen vacancies play a crucial role in the WGS catalyst because H2O dissociation involved in the WGS mechanism occurs at oxygen vacancy sites [36,37]. The conversion from Ce4+ to Ce3+ driven by oxygen vacancies may be the key factor to enhancing the catalytic activity of the catalyst.

2.2. WGS Activity and Stability of Ni Catalysts

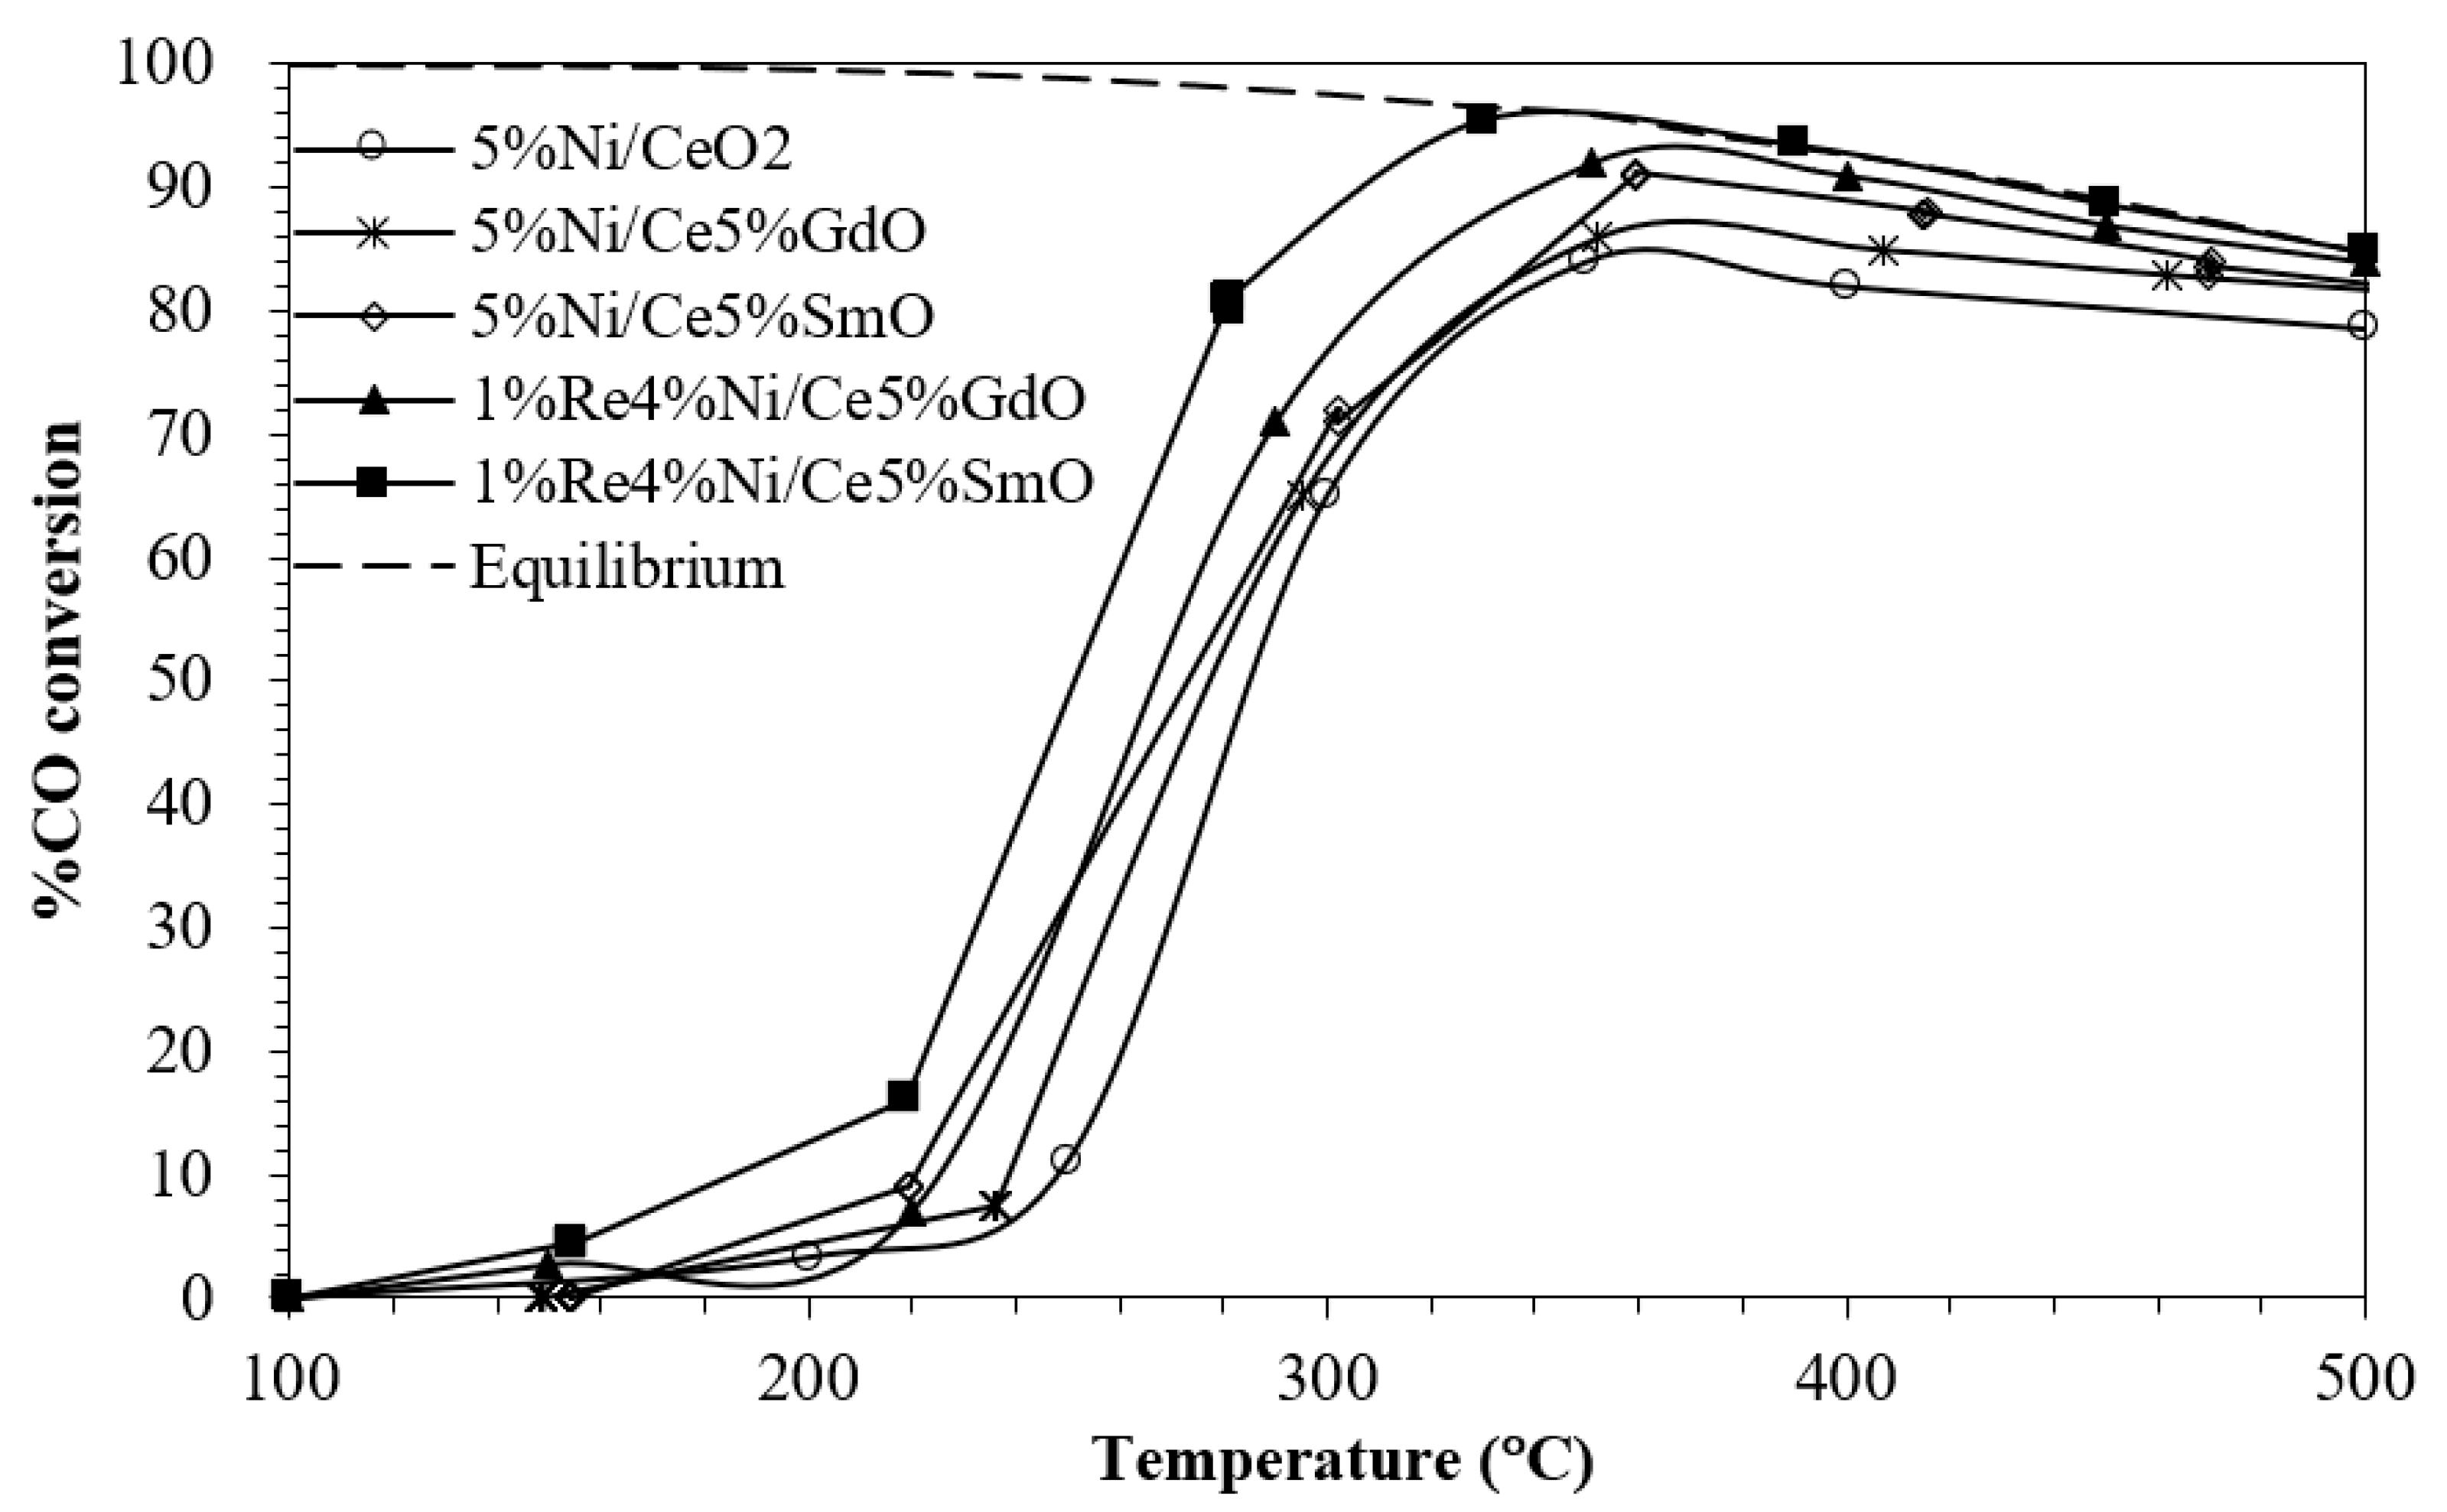
Figure 8 presents the %CO conversion of monometallic Ni and bimetallic NiRe supported by pure ceria and mixed oxide materials. For Ni/ceria, the conversion started at about 200 °C and ascended slowly to reach the highest CO conversion of 84% at 350 °C. As observed, the bimetallic NiRe/CeMO (M = Sm and Gd) catalyst illustrated higher carbon monoxide conversion than monometallic Ni/CeMO (M–Sm and Gd). This result may be due to the addition of Re, which leads to a stronger interaction between metal–support and is a consequence of increasing Ni metal dispersion and Ni surface area, hence more exposing surface-active sites. Among all the catalysts, 1% Re 4% Ni/Ce-5% Sm-O had excellent WGS performance with the maximum CO conversion close to 100% at 350 °C. The WGS activity enhancement of bimetallic 1% Re 4% Ni/Ce-5% Sm-O was due to its high concentration of oxygen vacancies. Therefore, it is easily reduced, and more active oxygen vacancy sites are exposed to reactants.
Figure 9 exhibits the effect of Sm and Re on the catalyst activity and CH4 selectivity over supported Ni catalysts at 350 °C. 1% Re 4% Ni/Ce-5% Sm-O was shown to be the excellent catalyst in terms of activity, H2 yield and CH4 selectivity. This catalyst was able to convert 97% carbon monoxide with 52% H2 yield. CH4 is an undesired product because it competes against hydrogen production and is a precursor for coke generation. The highest methane formation occurred in 5% Ni/CeO2. Therefore, the addition of Sm and Re onto Ni/CeO2 resulted in an enhancement of the hydrogen yield at the same time it suppressed methane generation.
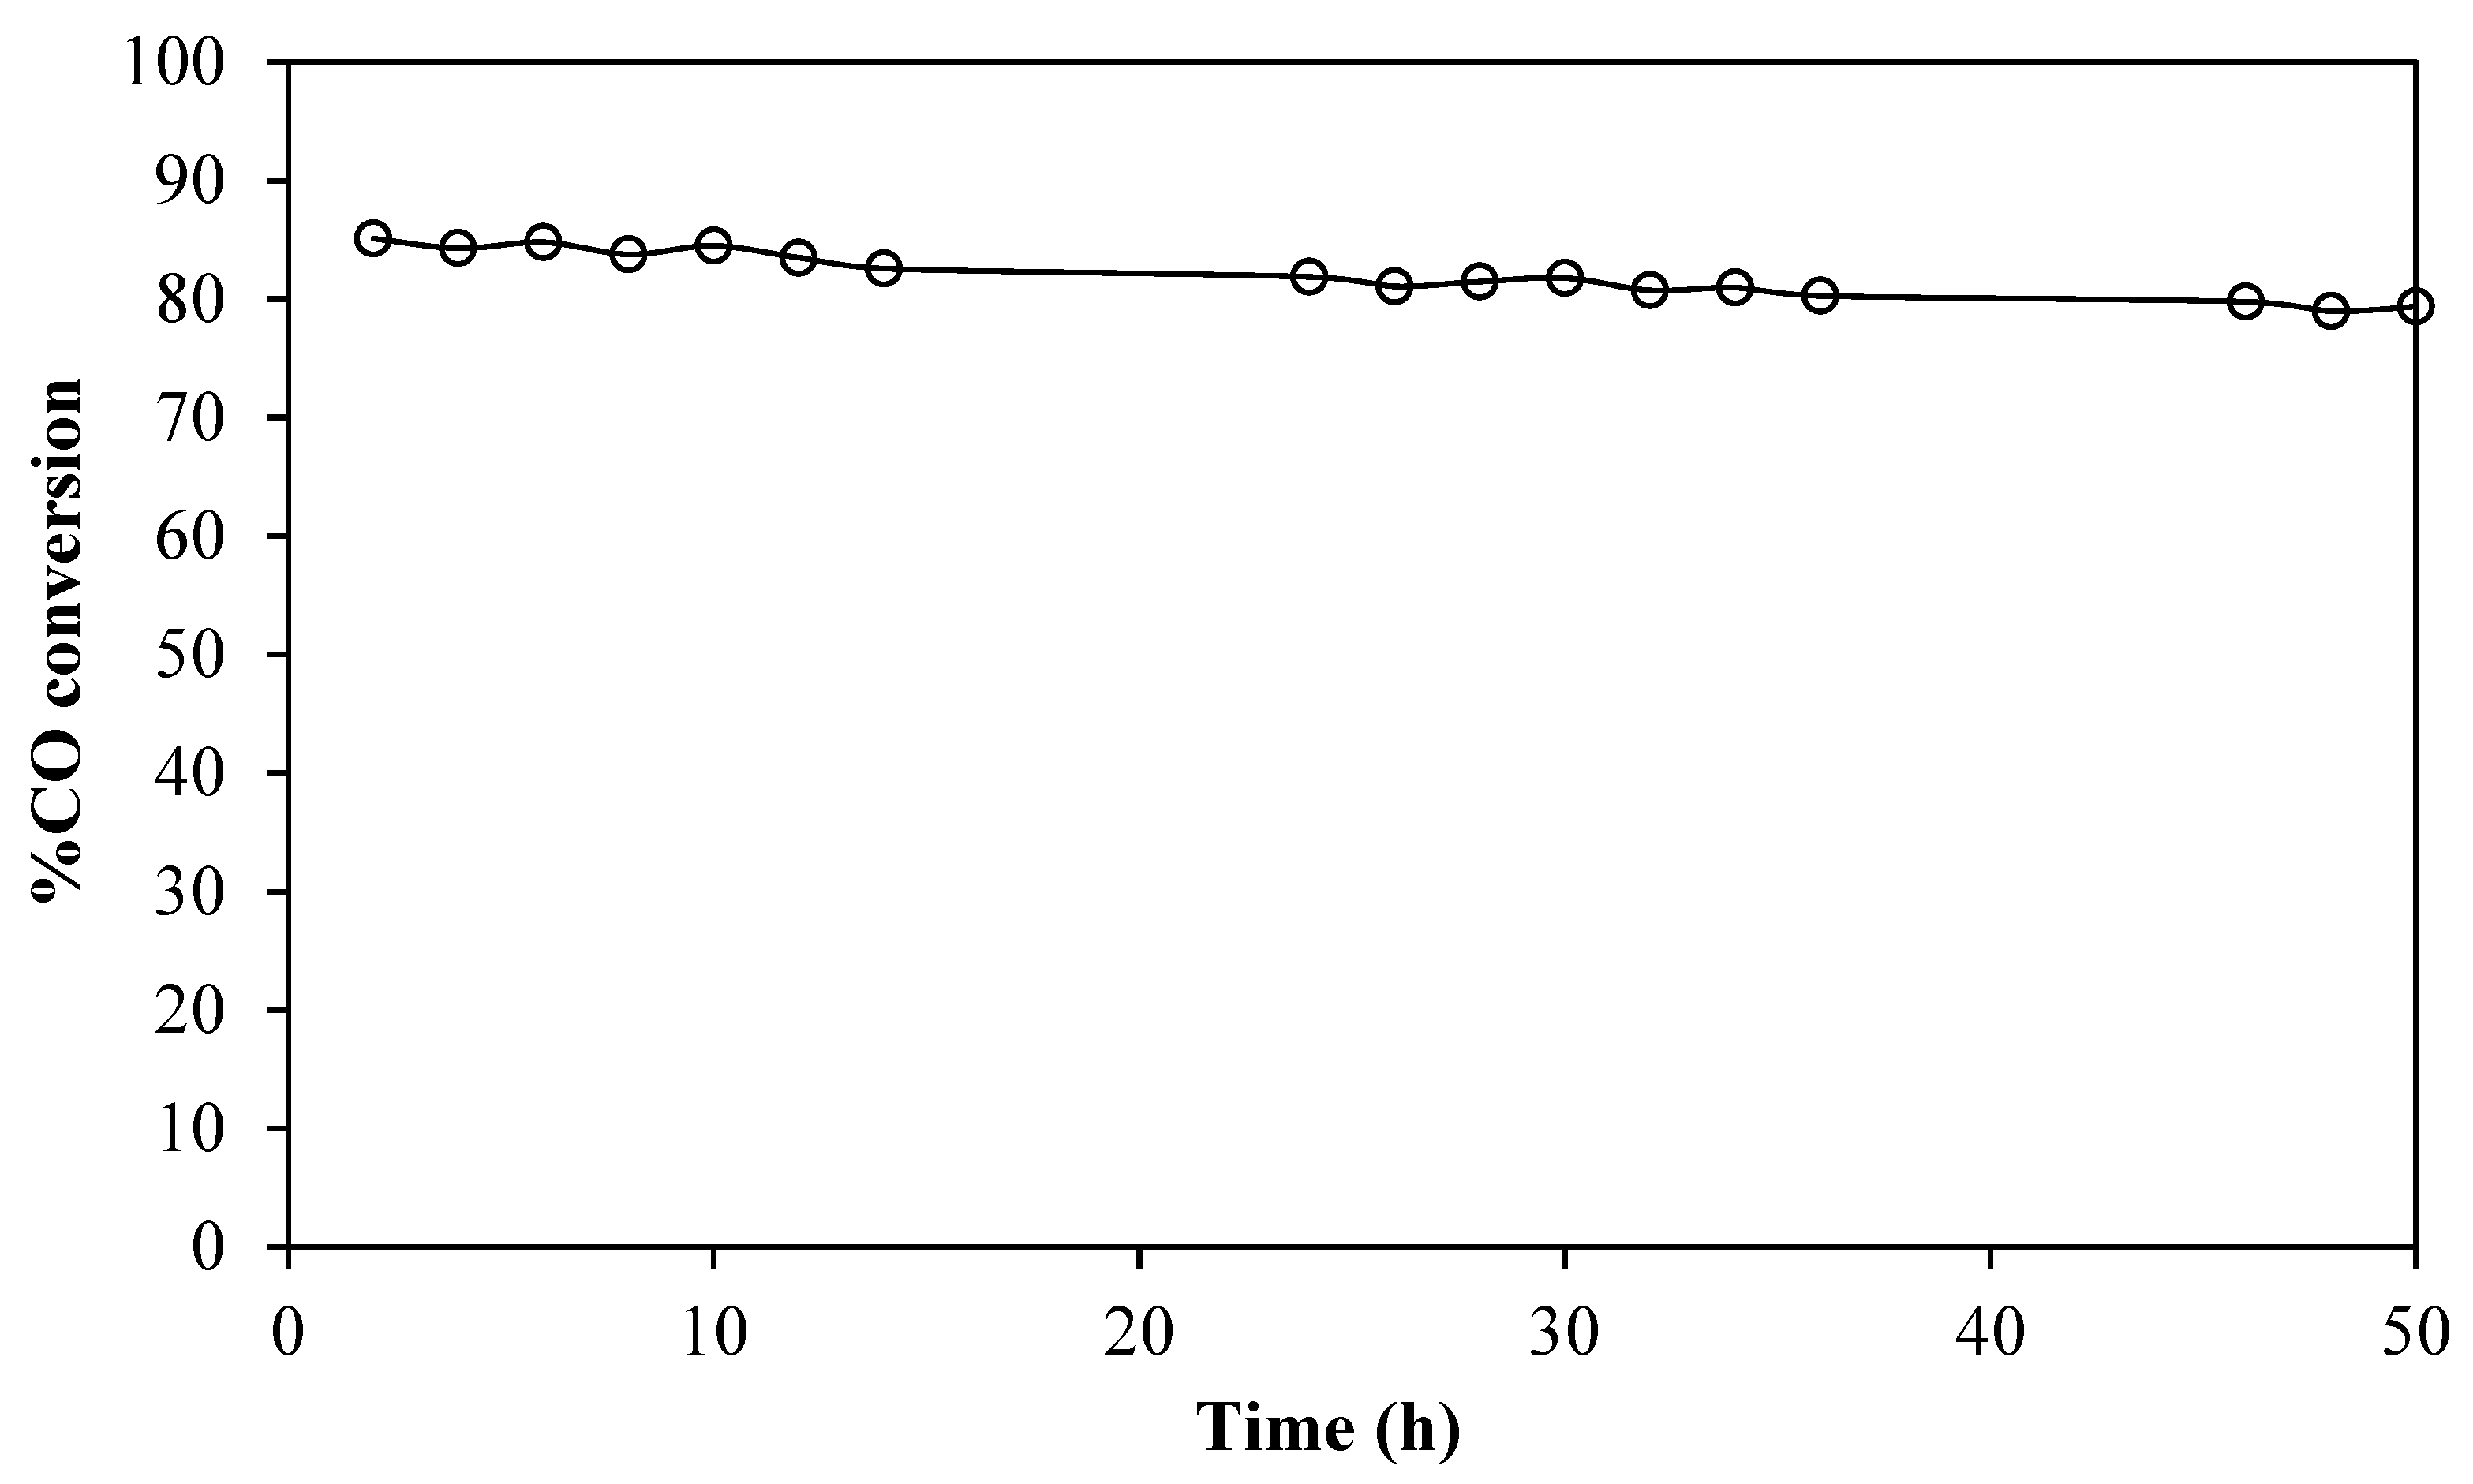
The WGS reaction stability of 1% Re 4% Ni/Ce-5% Sm-O operated at 300 °C under the mixture of 5% CO, 10% H2O and balance N2. As shown in Figure 10, the 1% Re 4% Ni/Ce-5% Sm-O catalyst retained high WGS stability for the whole period of 50 h. Thus, this catalyst is highly resistant towards deactivation during a WGS reaction.
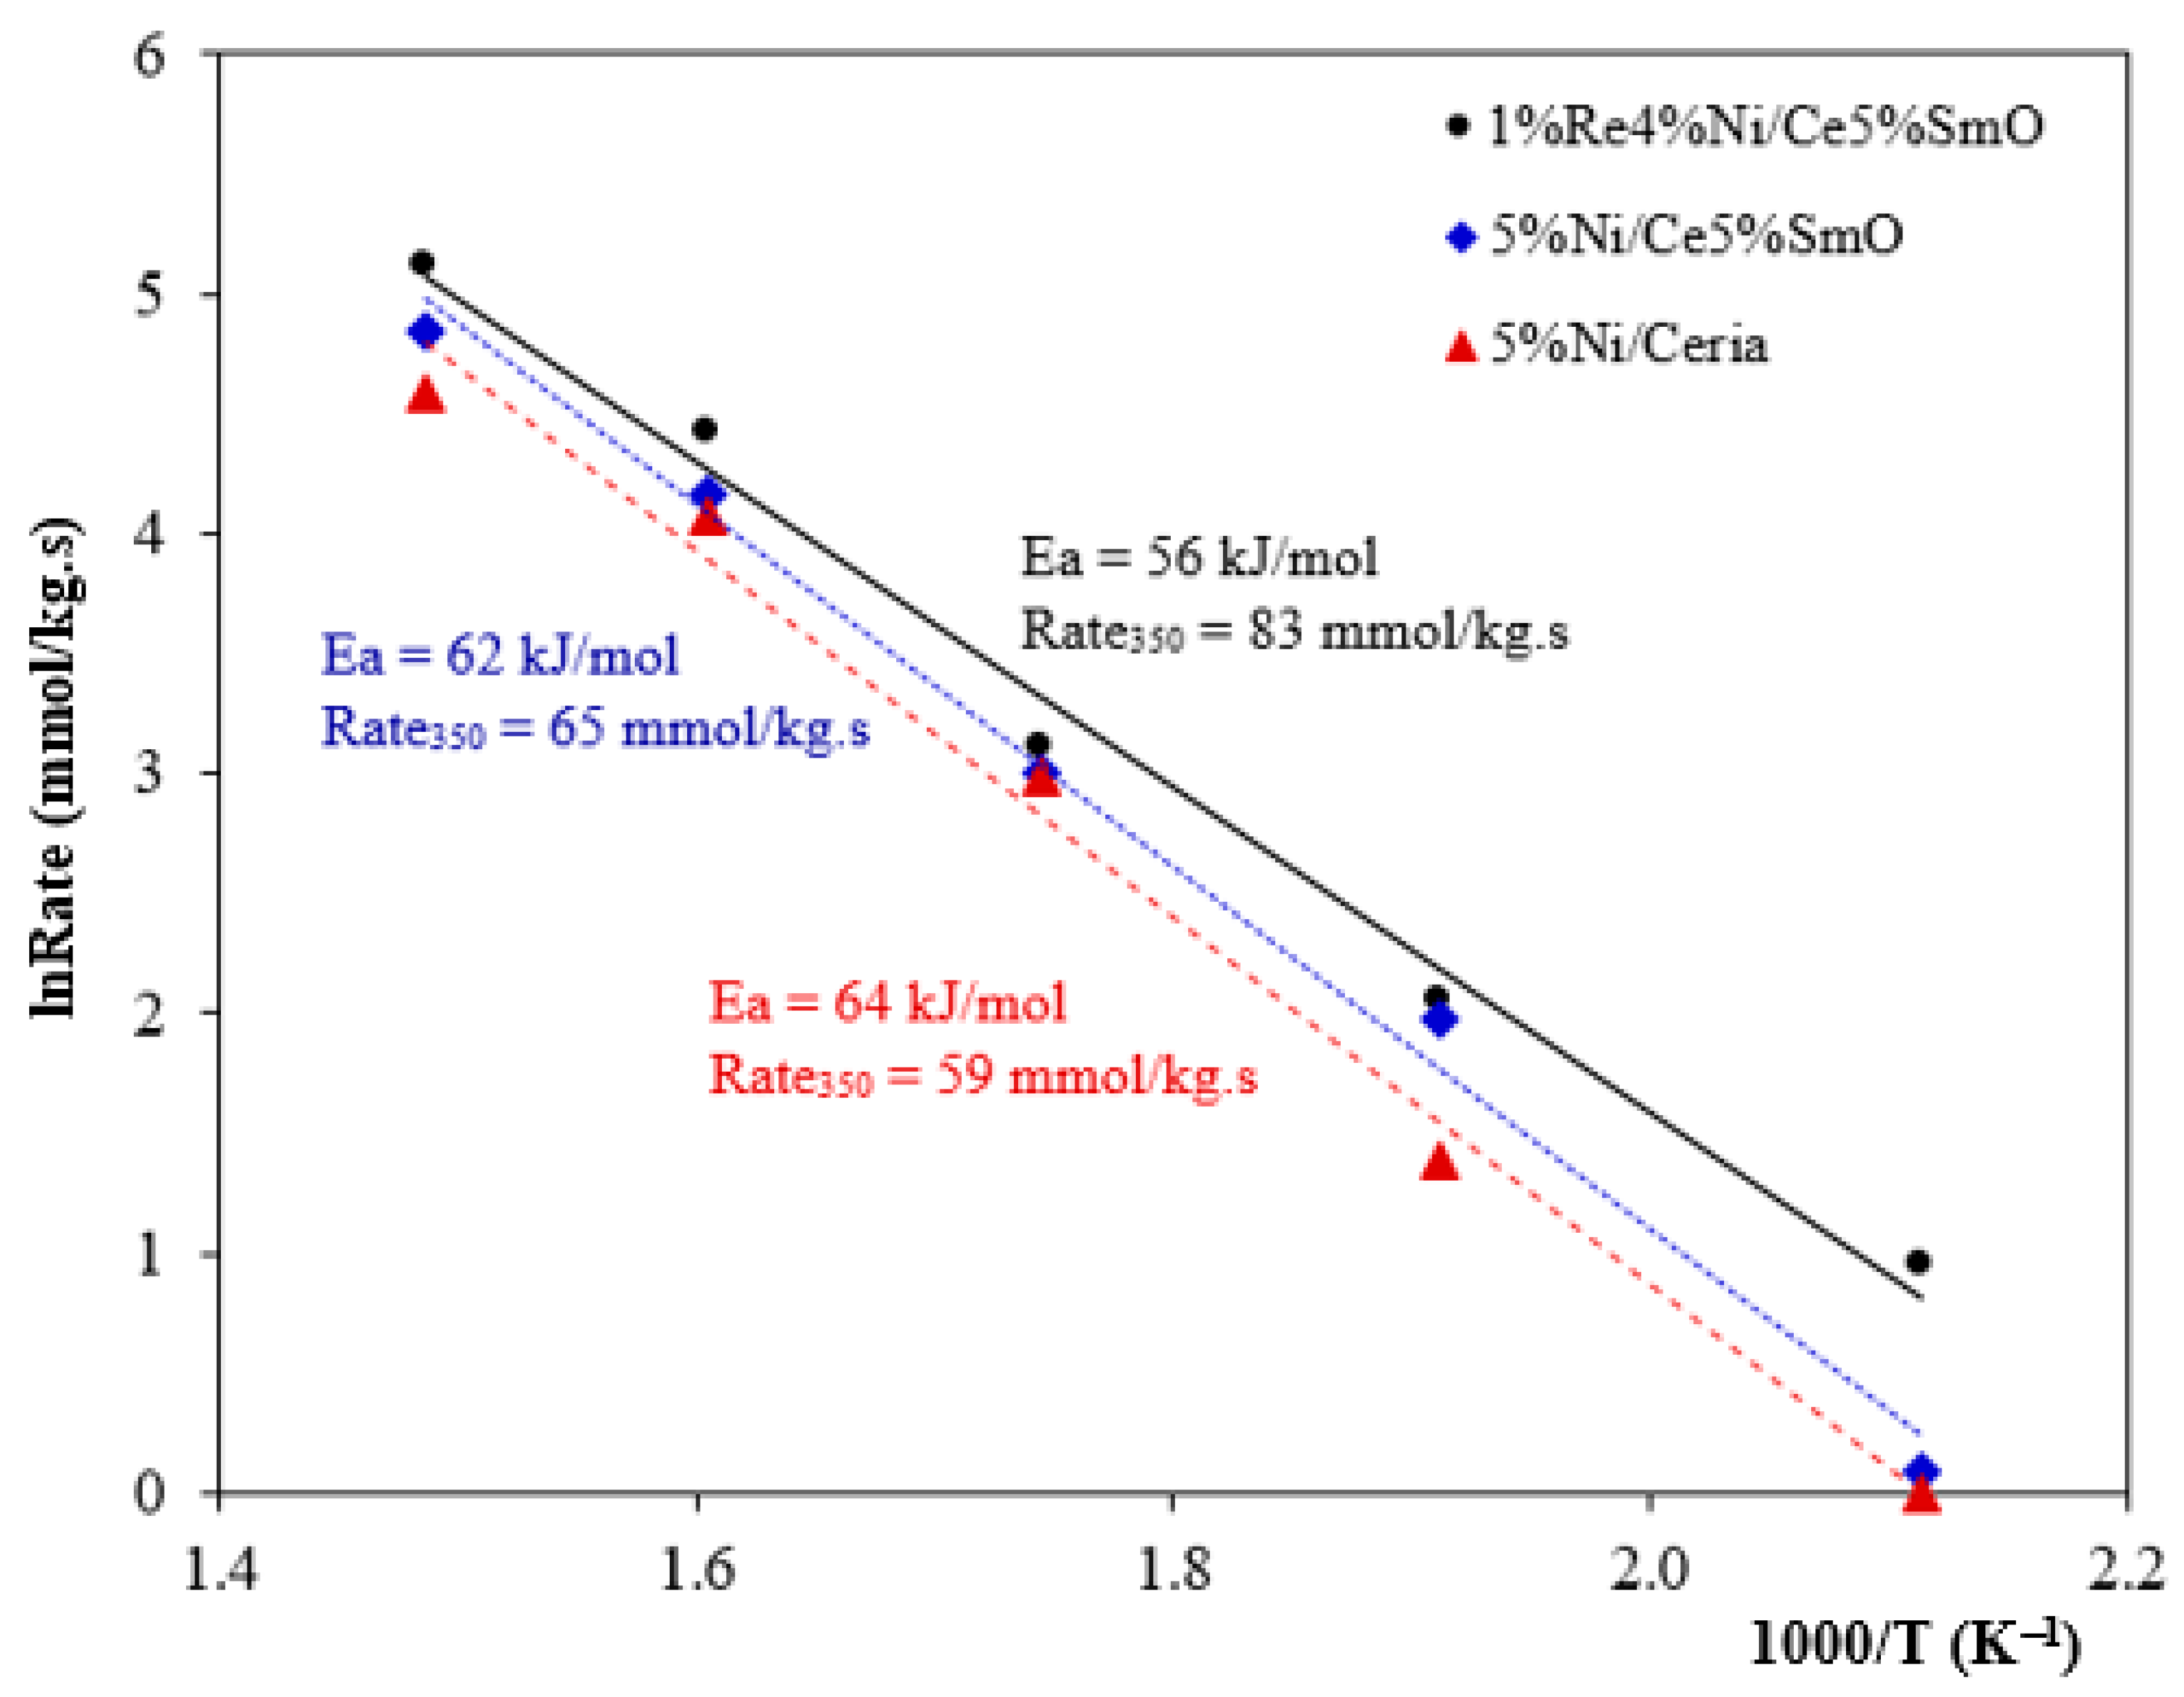
The Arrhenius plot and the apparent activation energy (Ea) over supported nickel catalysts are exhibited in Figure 11. The results illustrate that the WGS rate of bimetallic ReNi supported on Sm-doped ceria was higher than that of other catalysts. The Ea values can be calculated from the slope of the Arrhenius plot. Typically, activation energy for transition metal supported on ceria-based materials is in the range of 60–80 kJ/mol [38], which agrees well with the activation energy obtained from this work (Ea = 64 kJ/mol for 5% Ni/CeO2, Ea = 62 kJ/mol for 5% Ni/Ce-5% Sm-O and Ea = 56 kJ/mol for 1% Re 4% Ni/Ce-5% Sm-O). The bimetallic NiRe catalyst supported on Ce-5% Sm-O provided the highest CO conversion rate and the lowest of the Ea values.

3. Experimental Procedure

3.1. Catalysts Preparation

Ceria and M-doped ceria (M = Sm and Gd) supports were synthesized using a combustion method [39,40]. The redox reactions between fuels and oxidants (metal nitrates) provided the exothermicity essential for the nucleation and growth of metal oxide powders [41]. NH2CONH2 was used as a fuel to ignite the reaction. Ce(NO3)3.6H2O (Sigma-Aldrich, Pte. Ltd., Singapore) and M(NO3)3.6H2O (Sigma-Aldrich Pte. Ltd., Singapore) were used as starting materials for the preparation of pure ceria and M-doped ceria (M = Sm and Gd) supports. NH2CONH2 was mixed with metal nitrate using stoichiometry between oxidant and fuel in a ratio of 2.5:1. The mixed reactant was crushed to obtain a homogeneous solution and then heated using a Bunsen burner until auto-ignition occurred; therefore, nitrate and other organic compounds decomposed when they were heated to form metal oxides. The final products were ceria and M-doped ceria (M = Sm and Gd). Sm and Gd with 5 wt.% were loaded in the ceria support, which were denoted as Ce-5% Sm-O and Ce-5% Gd-O, respectively.
Monometallic Ni and bimetallic NiRe were prepared by the impregnation and co-impregnation method, respectively. Ni(NO₃)₂·6H₂O (Alfa Aesar, Thermo Fisher Scientific Inc, Seoul, Republic of Korea) and NH4ReO4 (Sigma-Aldrich Pte. Ltd., Singapore) were dissolved with deionized water. The salt solutions of Ni and Re were added to CeO2 and M-doped ceria (M = Sm and Gd) supports. All samples were dried overnight at 100 °C and calcined at 650 °C for 8 h.

3.2. Catalyst Characterization

The specific surface areas and pore size of all samples were analyzed using N2 adsorption–desorption isotherms at 77 K with a BELSORP-MAX instrument (Osaka, Japan). Prior to the measurements, the sample was degassed at 300 °C for 3 h. The specific surface area was calculated using the Brunauer–Emmett–Teller method.
X-ray powder diffraction patterns were obtained on a PANalytical X’Pert Pro diffractometer (Malvern Panalytical Ltd, Malvern, UK) using nickel-filtered Cu Kα radiation. The X-ray diffractograms were collected at 0.02° per step and 0.5 s per step with a current of 40 mA and 40 kV in a 2θ range from 20–80°. The CeO2 crystallite sizes were calculated from the full width at half maximum of the strongest (111) reflection using Scherrer’s equation.
A Perkin-Elmer TGA/DTA 6300 instrument (Perkin Elmer, Rodgau Germany) was used for thermogravimetric analysis (TGA). The analysis was performed under an air flow rate of 100 mL/min to measure the mass change of a sample as a function of temperatures up to 700 °C with a heating rate of 20 °C min−1.
The Raman spectra were operated on Perkin Elmer System 2000 FTIR/FT-Raman (Perkin Elmer, Germany) using argon ion laser irradiation from 200 to 1000 cm−1 with an output power of 10 mW and a wavelength of 532 nm.
The pulsed CO chemisorption, O2-TPD, C-TPD and H2-TPR were operated on a catalyst analyzer BELCAT-B (Osaka, Japan). The catalysts’ reduction behavior was studied by H2-TPR. Before a TPR measurement, the catalyst was pretreated under He flow at 120 °C for 30 min. The analysis was carried out in a mixture of 5%H2 and Ar in a temperature range of 50 °C–1000 °C with a heating rate of 10 °C min−1. For O2-TPD, the catalyst was first purged under He flow at 200 °C for an hour and then cooled to 50 °C and treated in 10% O2/He for an hour. O2-TPD analysis operated under helium flow by increasing the temperature from 50 to 900 °C at a rate of 10 °C min−1. For CO-TPD, the sample was purged under He flow and then exposed to 10%CO/He at 50 °C for an hour. After that, the sample was cleaned with He for 40 min. The analysis was performed under He flow in a temperature range of 50–900 °C at a rate of 10 °C/min, and the masses of 44 and 28 were monitored using mass spectrometry. The surface area and dispersion of metallic Ni were obtained from H2 chemisorption. Before measurement, 200 mg of catalyst was evacuated in helium at 40 °C and subsequently reduced in the flow of hydrogen at a rate of 30 mL/min at 300 °C for 1 h. The reduced catalyst was then cooled to 40 °C under He flow, followed by volumetric hydrogen chemisorption with pure H2. The surface area of metallic Ni was calculated from chemisorbed H2 on the assumption that one H atom is adsorbed on one surface Ni atom, and the metal dispersion was calculated using the following equation:
Metal dispersion (%) = 1.17 XH2/W·F
where XH2 is chemisorbed hydrogen (μmol/gram of catalyst), W is % wt. of Ni, and F is the fraction of nickel reduced to metal.
The oxidation states of metal in each catalyst were investigated using an X-ray absorption near-edge structure (XANES). Ce L3 absorption edge was determined using the transmission mode with a Lytle detector. The Kapton window, which put on the sample frame, was used to place the sample. Ion chambers filled with a mixture of Ar and He were installed in front of and behind the sample to continuously detect the incident and transmitted X-ray.

3.3. Water–Gas Shift Activity

The WGS activity was investigated at temperatures from 100 to 500 °C. About 0.15 g of the catalyst was placed between two layers of quartz wool inside a stainless-steel fixed-bed flow reactor. Before WGS activity testing, the synthesized catalyst was exposed to 5% H2/N2 gas from room temperature to 300 °C and kept constant at 300 °C for an hour. The reaction temperature in the reactor was controlled using the tube furnace. For WGS activity measurement, H2O was fed through a pre-heater using a syringe pump and then mixed with the flow of CO and N2, in which the flow rate was controlled using a mass flow controller before feeding into the reactor. The feed gas was composed of 5% CO, 10% H2O and 85% N2, and the total flow rate was maintained at 100 mL/min in all testing conditions. Reaction products were investigated using an online gas chromatographer (Shimadzu GC-14B, Shimadzu Singapore Pte Ltd., Singapore), equipped with a thermal conductivity detector and a Unibeads C column. Helium served as the eluent for a Unibeads C column, which was used to detect H2 and CO at a rate of 50 mL/min, and the temperature was set at 60 °C. The content of carbon monoxide and conversion at the outlet was repeated at least five times for each experiment. The WGS activities can be calculated using the following equation:
%CO conversion = (COin − COout)/COin × 100
The water–gas shift rates were carried out in separate experiments using 0.02 g of samples, and the feed gas contained 5% CO, 10% H2O and balance N2 where the carbon monoxide conversion was less than 30%.
Rate = (F × X)/m
where COin and COout are the molar flow in the inlet and outlet feed gas, respectively, Rate refers to the WGS rate (mol/g·s), F is the CO molar flow rate (mol/s), m is the catalyst weight (g) and X is the CO conversion.

4. Conclusions

The effect of Sm and Gd on the water–gas shift performance of Ni/CeO2 was investigated. An addition of Sm and Gd into Ni/CeO2 slightly enhanced WGS activity when compared with Ni/CeO2. An addition of Sm to Ni/CeO2 enhanced the BET surface area, decreased crystallite size, enhanced oxygen vacancy concentration and promoted better dispersion of Ni on the CeO2 surface. In addition, the effect of Re on the WGS activity of Ni/CeMO (M = Sm and Gd) was also investigated. It was found that 1% Re 4% Ni/Ce-5% Sm-O gives excellent WGS activity with the highest CO conversion of 97% at 350 °C. In addition, the addition of Sm and Re onto Ni/CeO2 resulted in an enhancement of the hydrogen yield at the same time it suppressed methane generation. The role of Re in improving the water–gas shift performance of Ni/CeSmO is due to the easier reducibility of Ni and the CeO2 surface. Furthermore, an increase in Ni dispersion and Ni surface area facilitated carbon monoxide adsorption. The result of an electron transfer reaction between rhenium, samarium, nickel and cerium allows the reduction in the 1% Re 4% Ni/Ce-5% Sm-O catalyst to become easier. The electron movement within the catalysts can be explained using XANES analysis. This result implies that Sm and Re assist in reducing ceria, causing an increase in Ce3+ at the CeO2 surface. Therefore, increasing the concentration of Ce3+ in the 1% Re 4% Ni/Ce-5% Sm-O catalyst gives rise to oxygen vacancy, which accelerates the surface redox processes. These effects contribute to improving the rate of water–gas shift.

Author Contributions

Conceptualization, S.C. and P.T.; methodology, J.G.L., T.S., S.C. and P.T.; validation, T.S., S.C. and P.T.; formal analysis, S.C. and P.T., investigation, J.G.L., T.S. and P.T.; resources, T.S., S.C. and P.T.; data curation, J.G.L. and P.T.; writing—original draft preparation, P.T.; writing—review and editing, S.C. and P.T.; supervision, S.C. and P.T.; funding acquisition, P.T. All authors have read and agreed to the published version of the manuscript.

Funding

This research was funded by Faculty of Science and Technology, Thammasat University, Contract No. SciGR11/2565, the Thammasat University Research Unit in smart materials from biomass and Thailand Graduate Institute of Science and Technology (TGIST), Contract No. SCA-CO-2021-14622-TH from National Science and Technology Development Agency.

Data Availability Statement

Data will be made available on request.

Conflicts of Interest

The authors declare no conflict of interest.

References

  1. Rhodes, C.; Peter Williams, B.; King, F.; Hutchings, G.J. Promotion of Fe3O4/Cr2O3 high temperature water gas shift catalyst. Catal. Commun. 2002, 3, 381–384. [Google Scholar] [CrossRef]
  2. Ebrahimi, P.; Kumar, A.; Khraisheh, M. A review of recent advances in water-gas shift catalysis for hydrogen production. Emergent Mater. 2020, 3, 881–917. [Google Scholar] [CrossRef]
  3. Velasco-Plascencia, M.; Vázquez-Gómez, O.; Olmos, L.; Reyes-Calderón, F.; Vergara-Hernández, H.J.; Villalobos, J.C. Determination of Activation Energy on Hydrogen Evolution Reaction for Nickel-Based Porous Electrodes during Alkaline Electrolysis. Catalysts 2023, 13, 517. [Google Scholar] [CrossRef]
  4. Stepanova, L.N.; Kobzar, E.O.; Trenikhin, M.V.; Leont’eva, N.N.; Serkova, A.N.; Salanov, A.N.; Lavrenov, A.V. Catalysts Based on Ni(Mg)Al-Layered Hydroxides Prepared by Mechanical Activation for Furfural Hydrogenation. Catalysts 2023, 13, 497. [Google Scholar] [CrossRef]
  5. Du, Z.; Pan, F.; Yang, X.; Fang, L.; Gang, Y.; Fang, S.; Li, T.; Hu, Y.H.; Li, Y. Efficient photothermochemical dry reforming of methane over Ni supported on ZrO2 with CeO2 incorporation. Catal. Today 2023, 409, 31–41. [Google Scholar] [CrossRef]
  6. Taherian, Z.; Yousefpour, M.; Tajally, M.; Khoshandam, B. Catalytic performance of Samaria-promoted Ni and Co/SBA-15 catalysts for dry reforming of methane. Int. J. Hydrogen Energy 2017, 42, 24811–24822. [Google Scholar] [CrossRef]
  7. Luisetto, I.; Tuti, S.; Romano, C.; Boaro, M.; Di Bartolomeo, E.; Kesavan, J.K.; Kumar, S.S.; Selvakumar, K. Dry reforming of methane over Ni supported on doped CeO2: New insight on the role of dopants for CO2 activation. J. CO2 Util. 2019, 30, 63–78. [Google Scholar] [CrossRef]
  8. Mogensen, M.; Sammes, N.M.; Tompsett, G.A. Physical, Chemical and Electrochemical Properties of Pure and Doped Ceria. Solid State Ion. 2000, 129, 63–94. [Google Scholar] [CrossRef]
  9. Fu, Y.P.; Chen, S.H.; Huang, J.J. Preparation and characterization of Ce0.8M0.2O2-δ (M=Y, Gd, Sm, Nd, La) solid electrolyte materials for solid oxide fuel cells. Int. J. Hydrogen Energy 2010, 35, 745–752. [Google Scholar] [CrossRef]
  10. da Silva, A.A.A.; Bion, N.; Epron, F.; Baraka, S.; Fonseca, F.C.; Rabelo-Neto, R.C.; Mattos, L.V.; Noronha, F.B. Effect of the type of ceria dopant on the performance of Ni/CeO2 SOFC anode for ethanol internal reforming. Appl. Catal. B Environ. 2017, 206, 626–641. [Google Scholar] [CrossRef]
  11. Luo, T.; Vohs, J.M.; Gorte, R.J. An Examination of Sulfur Poisoning on Pd/Ceria Catalysts. J. Catal. 2002, 210, 397–404. [Google Scholar] [CrossRef]
  12. Nikolova, D.; Kardjieva, R.; Grozeva, T. Water-gas shift activity of K-promoted (Ni)Mo/γ-Al2O3 systems in sulfur-containing feed. React. Kinet. Mech. Catal. 2011, 103, 71–86. [Google Scholar] [CrossRef]
  13. Choung, S.Y.; Ferrandon, M.; Krause, T. Pt-Re bimetallic supported on CeO2-ZrO2 mixed oxides as water–gas shift catalysts. Catal. Today 2005, 99, 257–262. [Google Scholar] [CrossRef]
  14. Iida, H.; Igarashi, A. Structure characterization of Pt-Re/TiO2 (rutile) and Pt-Re/ZrO2 catalysts for water gas shift reaction at low-temperature. Appl. Catal. A Gen. 2006, 303, 192–198. [Google Scholar] [CrossRef]
  15. Pieck, C.L.; González, M.B.; Parera, J.M. Total metallic dispersion of sulfided Pt-Re/Al2O3 naphtha reforming catalysts. Appl. Catal. A Gen. 2001, 205, 305–312. [Google Scholar] [CrossRef]
  16. Di Michele, A.; Dell’Angelo, A.; Tripodi, A.; Bahadori, E.; Sànchez, F.; Motta, D.; Dimitratos, N.; Rossetti, I.; Ramis, G. Steam reforming of ethanol over Ni/MgAl2O4 catalysts. Int. J. Hydrogen Energy 2019, 44, 952–964. [Google Scholar] [CrossRef]
  17. Osorio-Vargas, P.; Flores-González, N.A.; Navarro, R.M.; Fierro, J.L.; Campos, C.H.; Reyes, P. Improved stability of Ni/Al2O3 catalysts by effect of promoters (La2O3, CeO2) for ethanol steam-reforming reaction. Catal. Today 2016, 259, 27–38. [Google Scholar] [CrossRef]
  18. Lomonaco, J.G.; Tojira, O.; Charojrochkul, S.; Tepamatr, P. Structure-activity relationship of ceria based catalyst for hydrogen production. Chiang Mai J. Sci. 2022, 49, 1129–1134. [Google Scholar] [CrossRef]
  19. Tojira, O.; Tepamatr, P. Catalytic Activity of Ni Based Materials Prepared by Different Methods for Hydrogen Production via the Water Gas Shift Reaction. Catalysts 2023, 13, 176. [Google Scholar] [CrossRef]
  20. Tojira, O.; Lomonaco, J.G.; Sesuk, T.; Charojrochkul, S.; Tepamatr, P. Enhancement of hydrogen production using Ni catalysts supported by Gd-doped ceria. Heliyon 2021, 7, e08202. [Google Scholar] [CrossRef]
  21. Liu, J.J. Advanced Electron Microscopy of Metal–Support Interactions in Supported Metal Catalysts. ChemCatChem 2011, 3, 934–948. [Google Scholar] [CrossRef]
  22. Lee, Y.-L.; Jha, A.; Jang, W.-J.; Shim, J.-O.; Jeon, K.-W.; Na, H.-S.; Kim, H.-M.; Lee, D.-W.; Yoo, S.-Y.; Jeon, B.-H.; et al. Optimization of cobalt loading in Co–CeO2 catalyst for the high temperature water–gas shift reaction. Top. Catal. 2017, 60, 721–726. [Google Scholar] [CrossRef]
  23. Kim, K.-J.; Lee, Y.-L.; Na, H.-S.; Ahn, S.-Y.; Shim, J.-O.; Jeon, B.-H.; Roh, H.-S. Efficient waste to energy conversion based on Co-CeO2 catalyzed water-gas shift reaction. Catalysts 2020, 10, 420. [Google Scholar] [CrossRef]
  24. Liu, S.; Zhu, J.; Sun, M.; Ma, Z.; Hu, K.; Nakajima, T.; Liu, X.; Schmuki, P.; Wang, L. Promoting hydrogen evolution reaction through oxygen vacancies and phase transformation engineering on layered double hydroxide nanosheets. J. Mater. Chem. A 2020, 8, 2490–2497. [Google Scholar] [CrossRef]
  25. Ammal, S.C.; Heyden, A. Origin of the unique activity of Pt/TiO2 catalysts for the water–gas shift reaction. J. Catal. 2013, 306, 78–90. [Google Scholar] [CrossRef]
  26. Taniguchi, T.; Watanabe, T.; Sugiyama, N.; Subramani, A.K.; Wagata, H.; Matsushita, N.; Yoshimura, M. Identifying defects in ceria-based nanocrystals by UV resonance Raman spectroscopy. J. Phys. Chem. C 2009, 113, 19789–19793. [Google Scholar] [CrossRef]
  27. Lee, Y.; He, G.; Akey, A.J.; Si, R.; Flytzani-Stephanopoulos, M.; Herman, I.P. Raman analysis of mode softening in nanoparticle CeO2-δ and Au-CeO2-δ during CO oxidation. J. Am. Chem. Soc. 2011, 133, 12952–12955. [Google Scholar] [CrossRef]
  28. Guo, M.; Lu, J.; Wu, Y.; Wang, Y.; Luo, M. UV and Visible Raman Studies of Oxygen Vacancies in Rare-Earth-Doped Ceria. Langmuir 2011, 27, 3872–3877. [Google Scholar] [CrossRef]
  29. Xiao, Z.; Li, Y.; Hou, F.; Wu, C.; Pan, L.; Zou, J.; Wang, L.; Zhang, X.; Liu, G.; Li, G. Engineering oxygen vacancies and nickel dispersion on CeO2 by Pr doping for highly stable ethanol steam reforming. Appl. Catal. B Environ. 2019, 258, 117940. [Google Scholar] [CrossRef]
  30. Dutta, G.; Waghmare, U.V.; Baidya, T.; Hegde, M.S.; Priolkar, K.R.; Sarode, P.R. Origin of enhanced reducibility/oxygen storage capacity of Ce1-xTixO2 compared to CeO2 or TiO2. Chem. Mater. 2006, 18, 3249–3256. [Google Scholar] [CrossRef]
  31. Si, R.; Flytzani-Stephanopoulos, M. Shape and crystal-plane effects of nanoscale ceria on the activity of Au-CeO2 catalysts for the water-gas shift reaction. Angew. Chem. Int. Ed. Engl. 2008, 47, 2884–2887. [Google Scholar] [CrossRef] [PubMed]
  32. Shahin, A.M.; Grandjean, F.; Long, G.J.; Schuman, T.P. Cerium LIII-edge XAS investigation of the structure of crystalline and amorphous cerium oxides. Chem. Mater. 2005, 17, 315–321. [Google Scholar] [CrossRef]
  33. Dutta, P.; Pal, S.; Seehra, M.; Shi, Y. Concentration of Ce3+ and Oxygen Vacancies in Cerium Oxide Nanoparticles. Chem. Mater. 2006, 18, 5144–5146. [Google Scholar] [CrossRef]
  34. Huang, B.; Gillen, R.; Robertson, J. Study of CeO2 and its native defects by density functional theory with repulsive potential. J. Phys. Chem. C 2014, 118, 24248–24256. [Google Scholar] [CrossRef]
  35. Corkhill, C.L.; Bailey, D.J.; Tocino, F.Y.; Stennett, M.C.; Miller, J.A.; Provis, J.L.; Travis, K.P.; Hyatt, N.C. Role of microstructure and surface defects on the dissolution kinetics of CeO2, a UO2 fuel analogue. ACS Appl. Mater. Interfaces 2016, 8, 10562–10571. [Google Scholar] [CrossRef]
  36. Vecchietti, J.; Bonivardi, A.; Xu, W.; Stacchiola, D.; Delgado, J.J.; Calatayud, M.; Collins, S.E. Understanding the role of oxygen vacancies in the water gas shift reaction on ceria-supported platinum catalysts. ACS Catal. 2014, 4, 2088–2096. [Google Scholar] [CrossRef]
  37. Rodriguez, J.A.; Ma, S.; Liu, P.; Hrbek, J.; Evans, J.; Pérez, M. Activity of CeO2 and TiO2 nanoparticles grown on Au(111) in the water-gas shift reaction. Science 2007, 318, 1757–1760. [Google Scholar] [CrossRef]
  38. Liu, L.; Wang, Q.; Song, J.; Ahmad, S.; Yang, X.; Sun, Y. Plasma-assisted catalytic reforming of toluene to hydrogen rich syngas. Catal. Sci. Technol. 2017, 7, 4216–4231. [Google Scholar] [CrossRef]
  39. Tepamatr, P.; Laosiripojana, N.; Sesuk, T.; Charojrochkul, S. Effect of samarium and praseodymium addition on water gas shift performance of Co/CeO2 catalysts. J. Rare Earths 2020, 38, 1201–1206. [Google Scholar] [CrossRef]
  40. Tepamatr, P.; Laosiripojana, N.; Charojrochkul, S. Water gas shift reaction over monometallic and bimetallic catalysts supported by mixed oxide materials. Appl. Catal. A Gen. 2016, 523, 255–262. [Google Scholar] [CrossRef]
  41. Tokeda, T.; Kato, K.; Kikkawa, S. Gel combustion synthesis of rare earth aluminate using glycine or urea. J. Ceram. Soc. Jpn. 2007, 115, 588–591. [Google Scholar] [CrossRef]
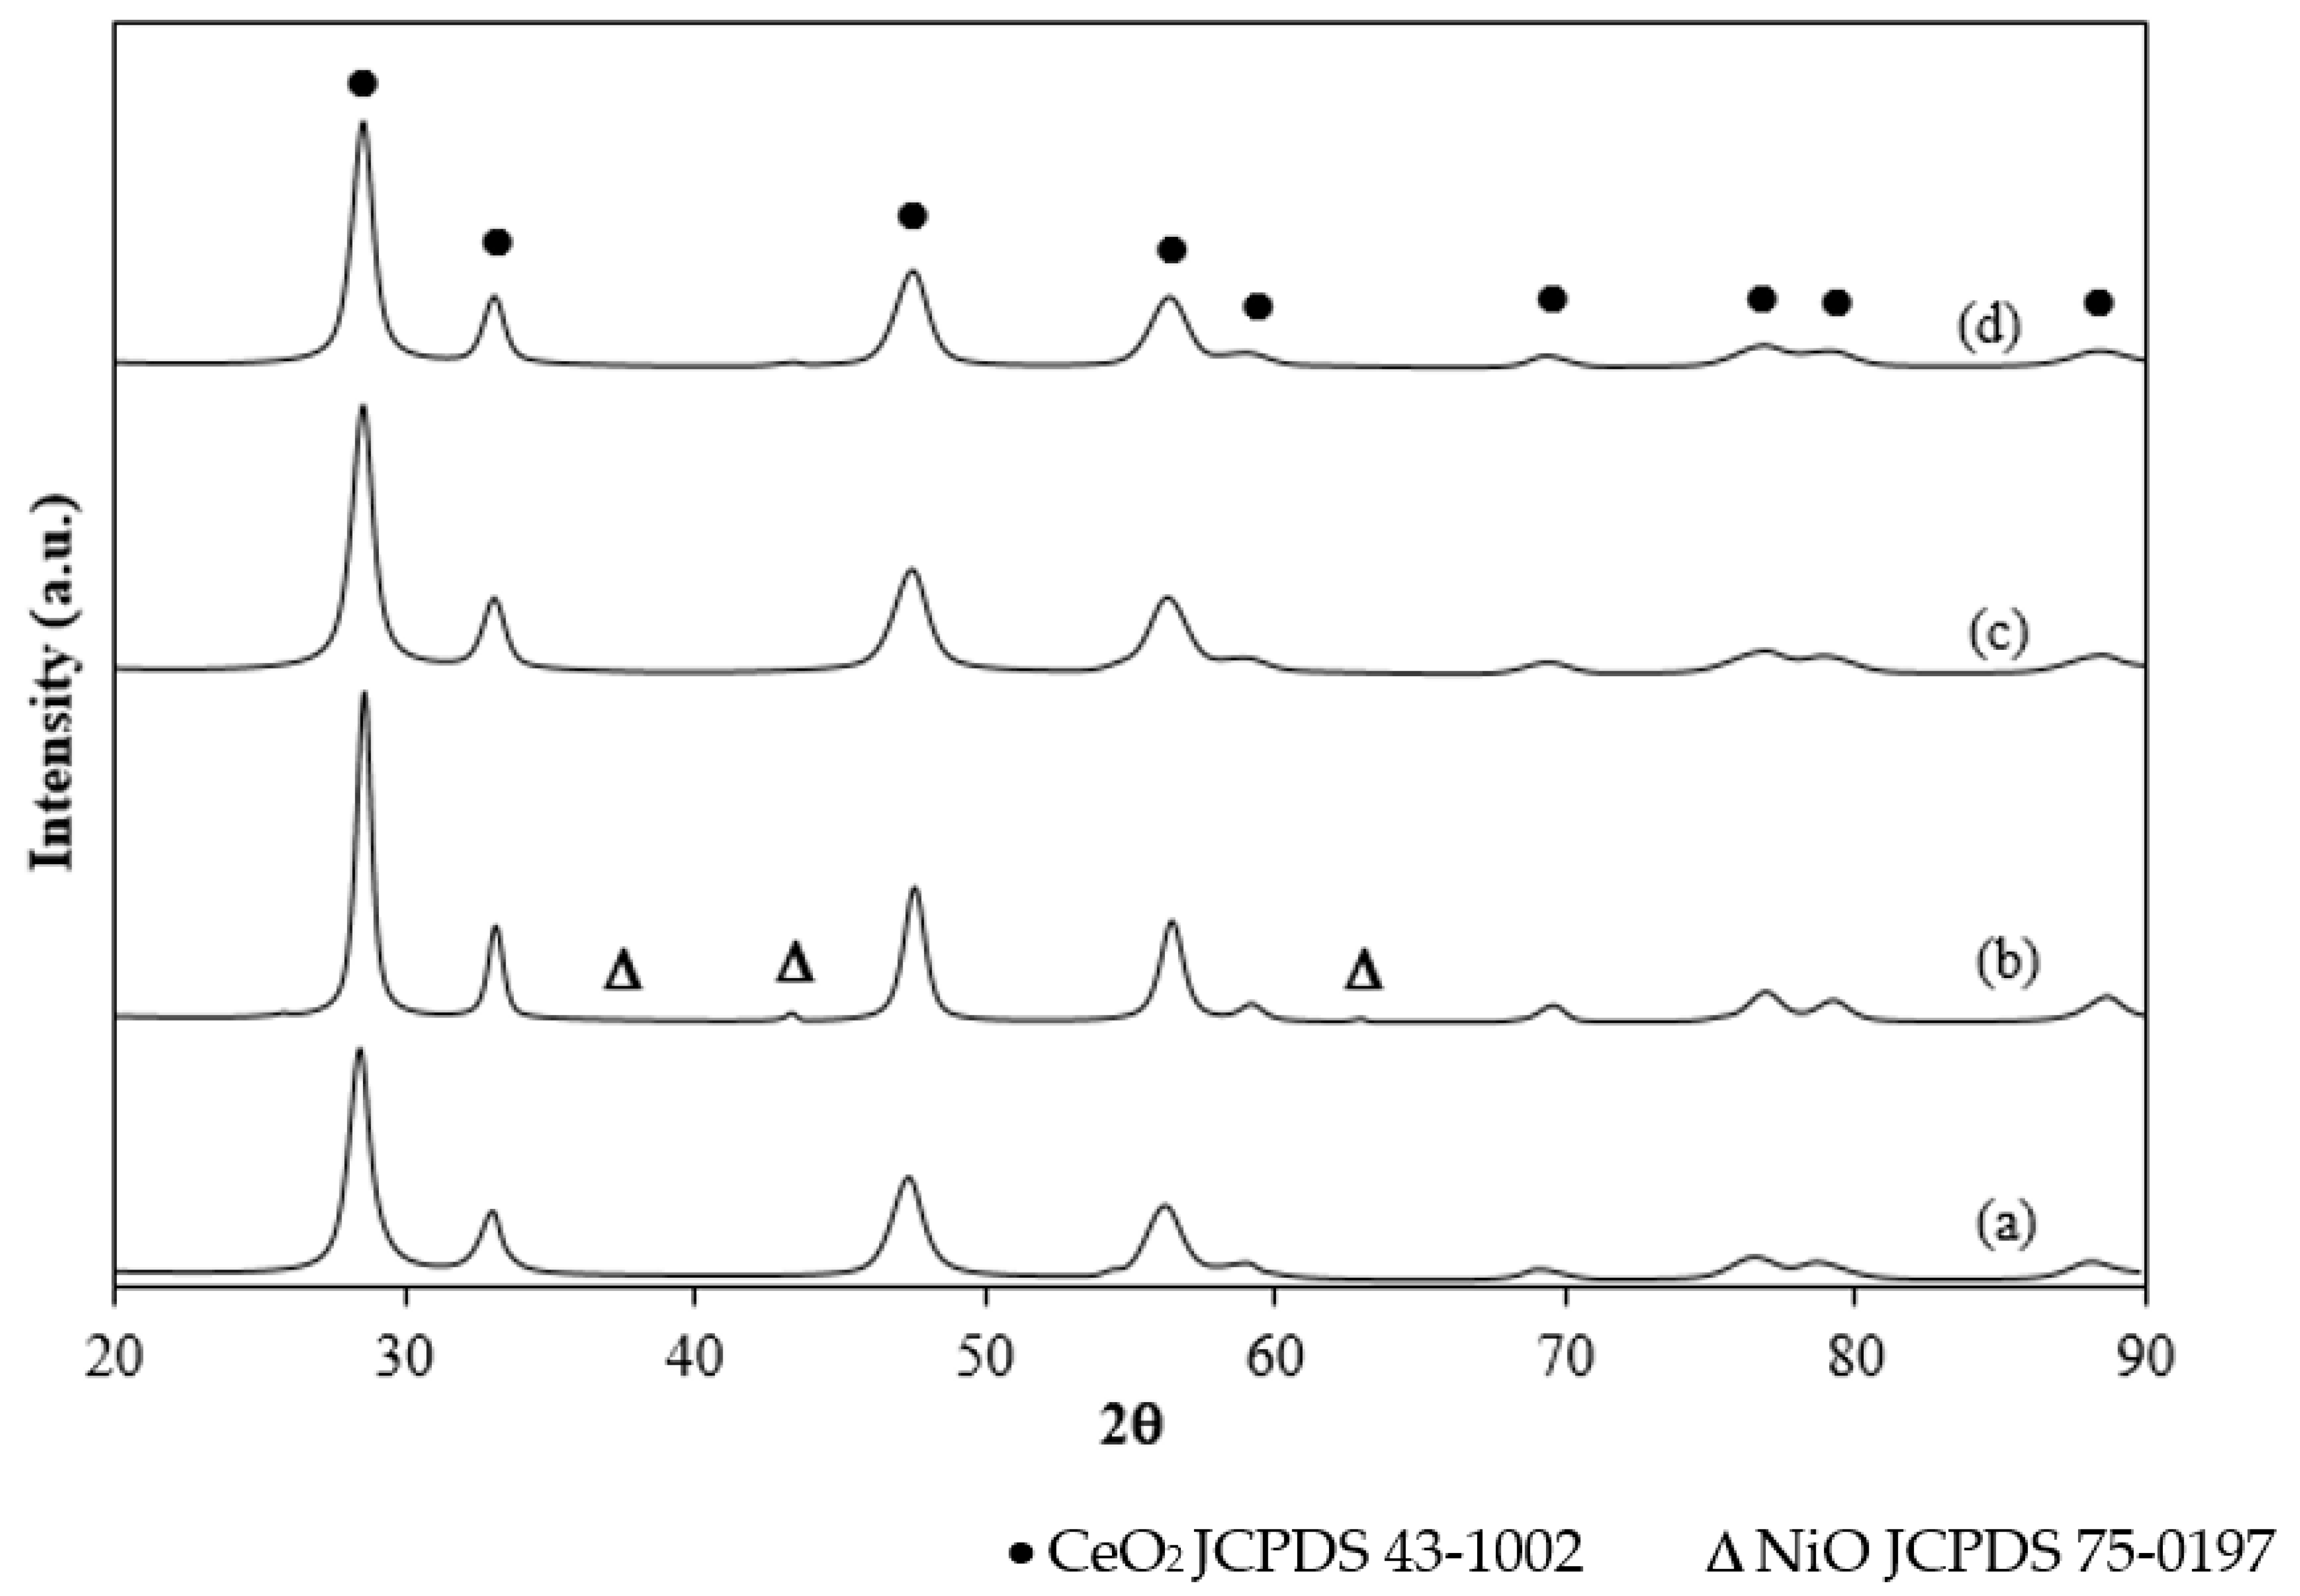
Figure 1. XRD patterns of Ni catalysts, (a) CeO2, (b) 5% Ni/CeO2, (c) 5% Ni/Ce-5% Sm-O, (d) 5% Ni/Ce-5% Gd-O.
Catalysts 13 00959 g001
Figure 2. TGA analysis of 1% Re 4% Ni/Ce-5% Sm-O.
Catalysts 13 00959 g002
Figure 3. Raman spectra of wide range (a) and narrow range (b) of supported Ni catalysts.
Catalysts 13 00959 g003
Figure 4. H2-TPR profiles of monometallic Ni and bimetallic NiRe supported by pure ceria and M-doped ceria (M = Sm and Gd).
Catalysts 13 00959 g004
Figure 5. O2-TPD of monometallic Ni and bimetallic NiRe supported by pure ceria and Sm-doped ceria.
Catalysts 13 00959 g005
Figure 6. CO-TPD of Ni/CeO2, Ni/Ce-5% Sm-O and ReNi/Ce-5% Sm-O.
Catalysts 13 00959 g006
Figure 7. XANES spectra of Ce L3 absorption edge (a) and linear combination fit results of Ce compound (b).
Catalysts 13 00959 g007
Figure 8. %CO conversion of supported Ni catalysts (using 0.15 g of catalysts, the feed gas contained 5% CO, 10% H2O and balance N2, and the total flow rate was 100 mL/min).
Catalysts 13 00959 g008
Figure 9. Average performance of supported Ni catalysts for the water–gas shift reaction at 350 °C (using 0.15 g of catalysts, the feed gas contained 5% CO, 10% H2O and balance N2, and the total flow rate was 100 mL/min). Note that the H2 yield is expressed in vol/vol.
Catalysts 13 00959 g009
Figure 10. Long-term stability test at 300 °C of 1% Re 4% Ni/Ce-5% Sm-O (using 0.15 g of catalysts, the feed gas contained 5% CO, 10% H2O and balance N2 and the total flow rate was 100 mL/min).
Catalysts 13 00959 g010
Figure 11. Arrhenius plots of reaction rate over Ni catalysts at 350 °C (using 0.02 g of catalysts, the feed gas contained 5% CO, 10% H2O and balance N2, and the total flow rate was 100 mL/min).
Catalysts 13 00959 g011
Table 1. Crystallite size and lattice parameter of Ni-based catalysts.
CatalystsCrystallite Size a (nm)Lattice Parameter a (nm)
CeO29.410.5435
5% Ni/CeO213.350.5407
5% Ni/Ce-5% Sm-O9.010.5417
5% Ni/Ce-5% Gd-O9.640.5414
a Calculated from the 111 diffraction peaks broadening.
Table 2. BET surface area, average pore diameter, total pore volume, Ni dispersion and Ni surface area of Ni-based catalysts.
CatalystsBET Surface Area b
(m2/g)
Total Pore Volume b (cm3/g)Average Pore Diameter b
(nm)
Ni Dispersion c (%)Ni Surface Area c
(m2/g)
5% Ni/CeO2290.0618.350.170.95
5% Ni/Ce-5% Sm-O 540.0795.880.251.55
1% Re 4% Ni/Ce-5% Sm-O 500.0766.140.985.07
5% Ni/Ce-5% Gd-O 510.0675.300.221.28
1% Re 4% Ni/Ce-5% Gd-O480.0645.120.764.11
b Estimated from N2 adsorption at −196 °C. c Estimated from H2 chemisorption.
Disclaimer/Publisher’s Note: The statements, opinions and data contained in all publications are solely those of the individual author(s) and contributor(s) and not of MDPI and/or the editor(s). MDPI and/or the editor(s) disclaim responsibility for any injury to people or property resulting from any ideas, methods, instructions or products referred to in the content.