Article

Two-in-One Electrons Trapped Fe-BiOCl-Vo Nanosheets for Promoting Photocatalytic-Fenton Degradation Performances of Phenol

Hunan Key Laboratory of Applied Environmental Photocatalysis, Changsha University, Changsha 410022, China
*
Author to whom correspondence should be addressed.
Catalysts 2023, 13(6), 947; https://doi.org/10.3390/catal13060947
Submission received: 31 March 2023 / Revised: 17 May 2023 / Accepted: 24 May 2023 / Published: 29 May 2023

Abstract

:
Fe-BiOCl-Vo nanosheets with electron-capture centers of doped Fe and surface oxygen vacancies (Vo) for enhanced photocatalytic-Fenton performances were conducted. Compared with pristine BiOCl nanosheets, the band gap of the resulting Fe-BiOCl-Vo nanosheets was narrowed, and defective bands were introduced due to the Fe doping and Vo. Furthermore, the integrated electron trapping effect of Vo and doped Fe can efficiently drive charge transfer and separation. As a result, the photocatalytic-Fenton performances of phenol over Fe-BiOCl-Vo nanosheets were enhanced. The photocatalytic-Fenton performances of Fe-BiOCl-Vo nanosheets were enhanced two-fold and four-fold, respectively, as compared with the photocatalytic performances of Fe-BiOCl-Vo and pristine BiOCl nanosheets. During the photocatalytic-Fenton process, the multiple reactive species referring holes (h+), superoxide radicals (●O2), and hydroxyl radicals (●OH) induced by the efficiently separated charge carriers and Fenton reaction played synergetic roles in phenol degradation and mineralization. This work provides a sophisticated structure design of catalysts for efficient charge transfer and separation, promoting photocatalytic-Fenton performance.

1. Introduction

Increasing water contaminants provoke a serious health hazard to humans and significant security issues to environments, and phenolic compounds are the widespread pollutants. It is necessary to explore efficient techniques for the elimination of contaminants [1,2,3]. Photocatalysis is an appealing technique for contaminants removal efficiently due to the strongly oxidizing reactive species. Bismuth oxychloride (BiOCl) is a prominent semiconductor with a unique sandwich-layered structure containing alternated [Bi2O2]2+ and double chlorine layers, which has garnered considerable attention as a promising candidate for photocatalysis of contaminants removal. However, its broader band gap (Eg = 3.2–3.5 eV), limited ultra-violet light response, and rapid recombination of charge carriers restrict the photodegradation efficiency of contaminants [4,5].
Hence, many strategies have been exploited to broaden the light response region and promote the separation of charge carriers for the enhanced photocatalytic performances of BiOCl. Efficient strategies referring to elements doping, surface oxygen vacancies, and forming heterostructure were frequently employed to improve photocatalytic performances [6,7,8,9,10,11]. Particularly, the surface oxygen vacancy (Vo) was considered an appealing route to promote the separation of charge carriers, contributing to the enhancement of photocatalytic activity. Because the Vo could trap the photoexcited electrons, then the photogenerated holes can be driven to the surface of BiOCl, promoting the oxidation and mineralization of contaminants [12]. For instance, square-sharped BiOCl nanosheets with oxygen vacancies (BiOCl-Vo) were produced. The produced BiOCl-Vo nanosheets exhibited excellent photocatalytic activity of rhodamine B (RhB) removal under visible light irradiation due to the efficient separation of charge carriers. Furthermore, the predominant reactive species were the photogenerated holes (h+) and superoxide radicals (●O2) [9]. Additionally, metal doping also was frequently used to broaden the light response and charge separation of BiOCl. Furthermore, different metals can act as electron-poor centers and electron-rich centers, contributing to the electrons and holes capture, respectively. For instance, the density functional theory (DFT) + U calculation results of BiOCl doped with 3d transition metals (TMs = Sc-, V-, Cr-, Mn-, Fe-, Co-, Ni-, Cu-, and Zn-) shown that the Cr-, Mn-, Fe-, Co-, Ni-, Cu-, and Zn-doped BiOCl systems exhibited the thermodynamic structure stability, while the others were hard to substitute Bi. Furthermore, compared with pristine BiOCl, the V-, Ti-, Fe-, Cr-, and Co-doped BiOCl could rise the valance band maximum (VBM) toward more positive levels, endowing with the enhancement of redox potentials [13]. Furthermore, the doped Fe also can use in the photocatalytic-Fenton system, boosting the degradation activity of pollutants. For instance, the Fe-doped (~1 wt%) BiOCl hierarchical nanostructures were prepared via a facile one-step room temperature method. The Fe-doped BiOCl could drive the conversion of H2O2 to hydroxyl radicals (●OH) through the electron flowing in the photo-Fenton process, resulting in the enhanced photodegradation of methyl blue (MB) under visible light illumination [14]. Furthermore, our previous study also confirmed that the doped Fe also acted as an electron capture center, promoting the directional transfer and efficient separation of charge carriers [15].
However, ●O2 possesses a longer lifetime, but its inactive feature cause the lower mineralization of phenolic contaminants. h+ provides higher mineralization but with lower transfer kinetics. Although h+ could transit into hydroxyl radicals (●OH), which possess rapid reactions and higher oxidative ability, the lower lifetime restricts the mineralization of contaminants. Therefore, it is necessary to introduce more reactive species into the photocatalytic system. Fenton reaction could produce massive ●OH in the presence of hydrogen peroxide (H2O2) and Fe2+, providing superior degradation efficiency. But numerous H2O2 and Fe2+ are consumed during the Fenton process, causing the accumulation of iron sludges numerously and narrower application pH region [16,17]. Combining the photocatalysts with the heterogenous Fenton catalysts or doping iron into photocatalysts to form photocatalytic-Fenton catalysts could play an integrated electron trapping effect on the degradation of phenolic contaminants. Many studies have demonstrated that synergetic photocatalysis and the Fenton process could enhance the degradation activity and mineralization of phenolic compounds [18,19,20]. For instance, in our previous study, electron self-sufficient core-shell BiOCl@Fe-BiOCl nanosheets were constructed as an efficient catalyst for the enhanced photocatalytic-Fenton degradation of phenol. During the photocatalytic-Fenton process, the directional transfer and efficient separation of charge carriers can be enhanced, then the electron-capture center of doped Fe can boost the Fenton reaction, promoting the recycling of Fe(III)/Fe(II) and photocatalytic-Fenton performances of phenol [15]. However, inducing the Vo of photocatalytic-Fenton catalysts to promote charge transfer and degradation activity is still scarcely studied.
Herein, we introduced Vo on the surface of Fe-doped BiOCl (Fe-BiOCl-Vo) nanosheets to promote the separation of charge carriers and enhance the degradation of phenol in the photocatalytic-Fenton system. The band structure evolution and degradation activity of resulting products were examined. This work provides a sophisticated structure design for catalysts for efficient charge transfer and separation, which promote photocatalytic-Fenton performance.

2. Results and Discussion

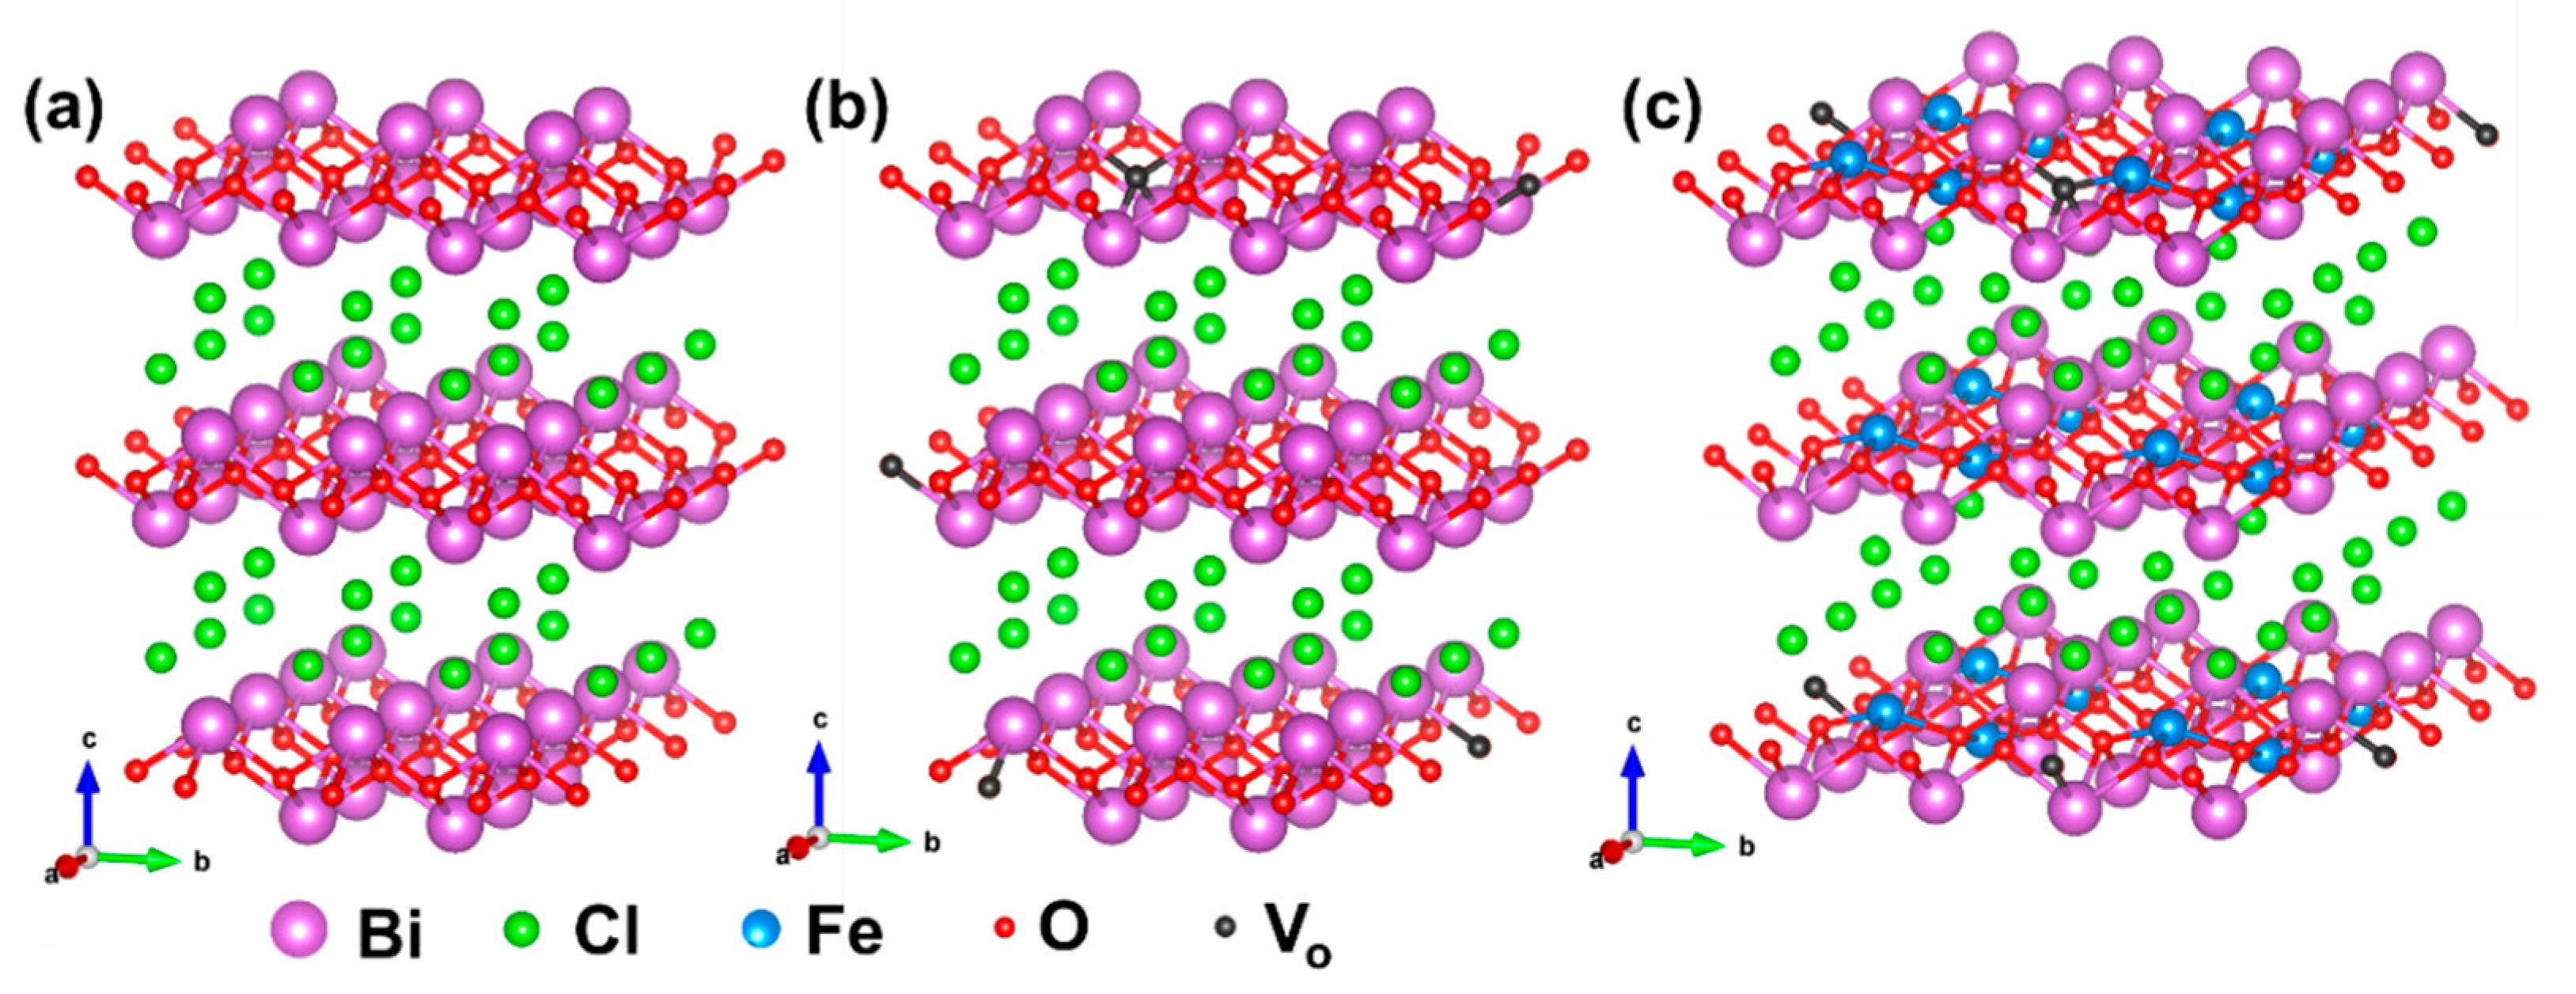
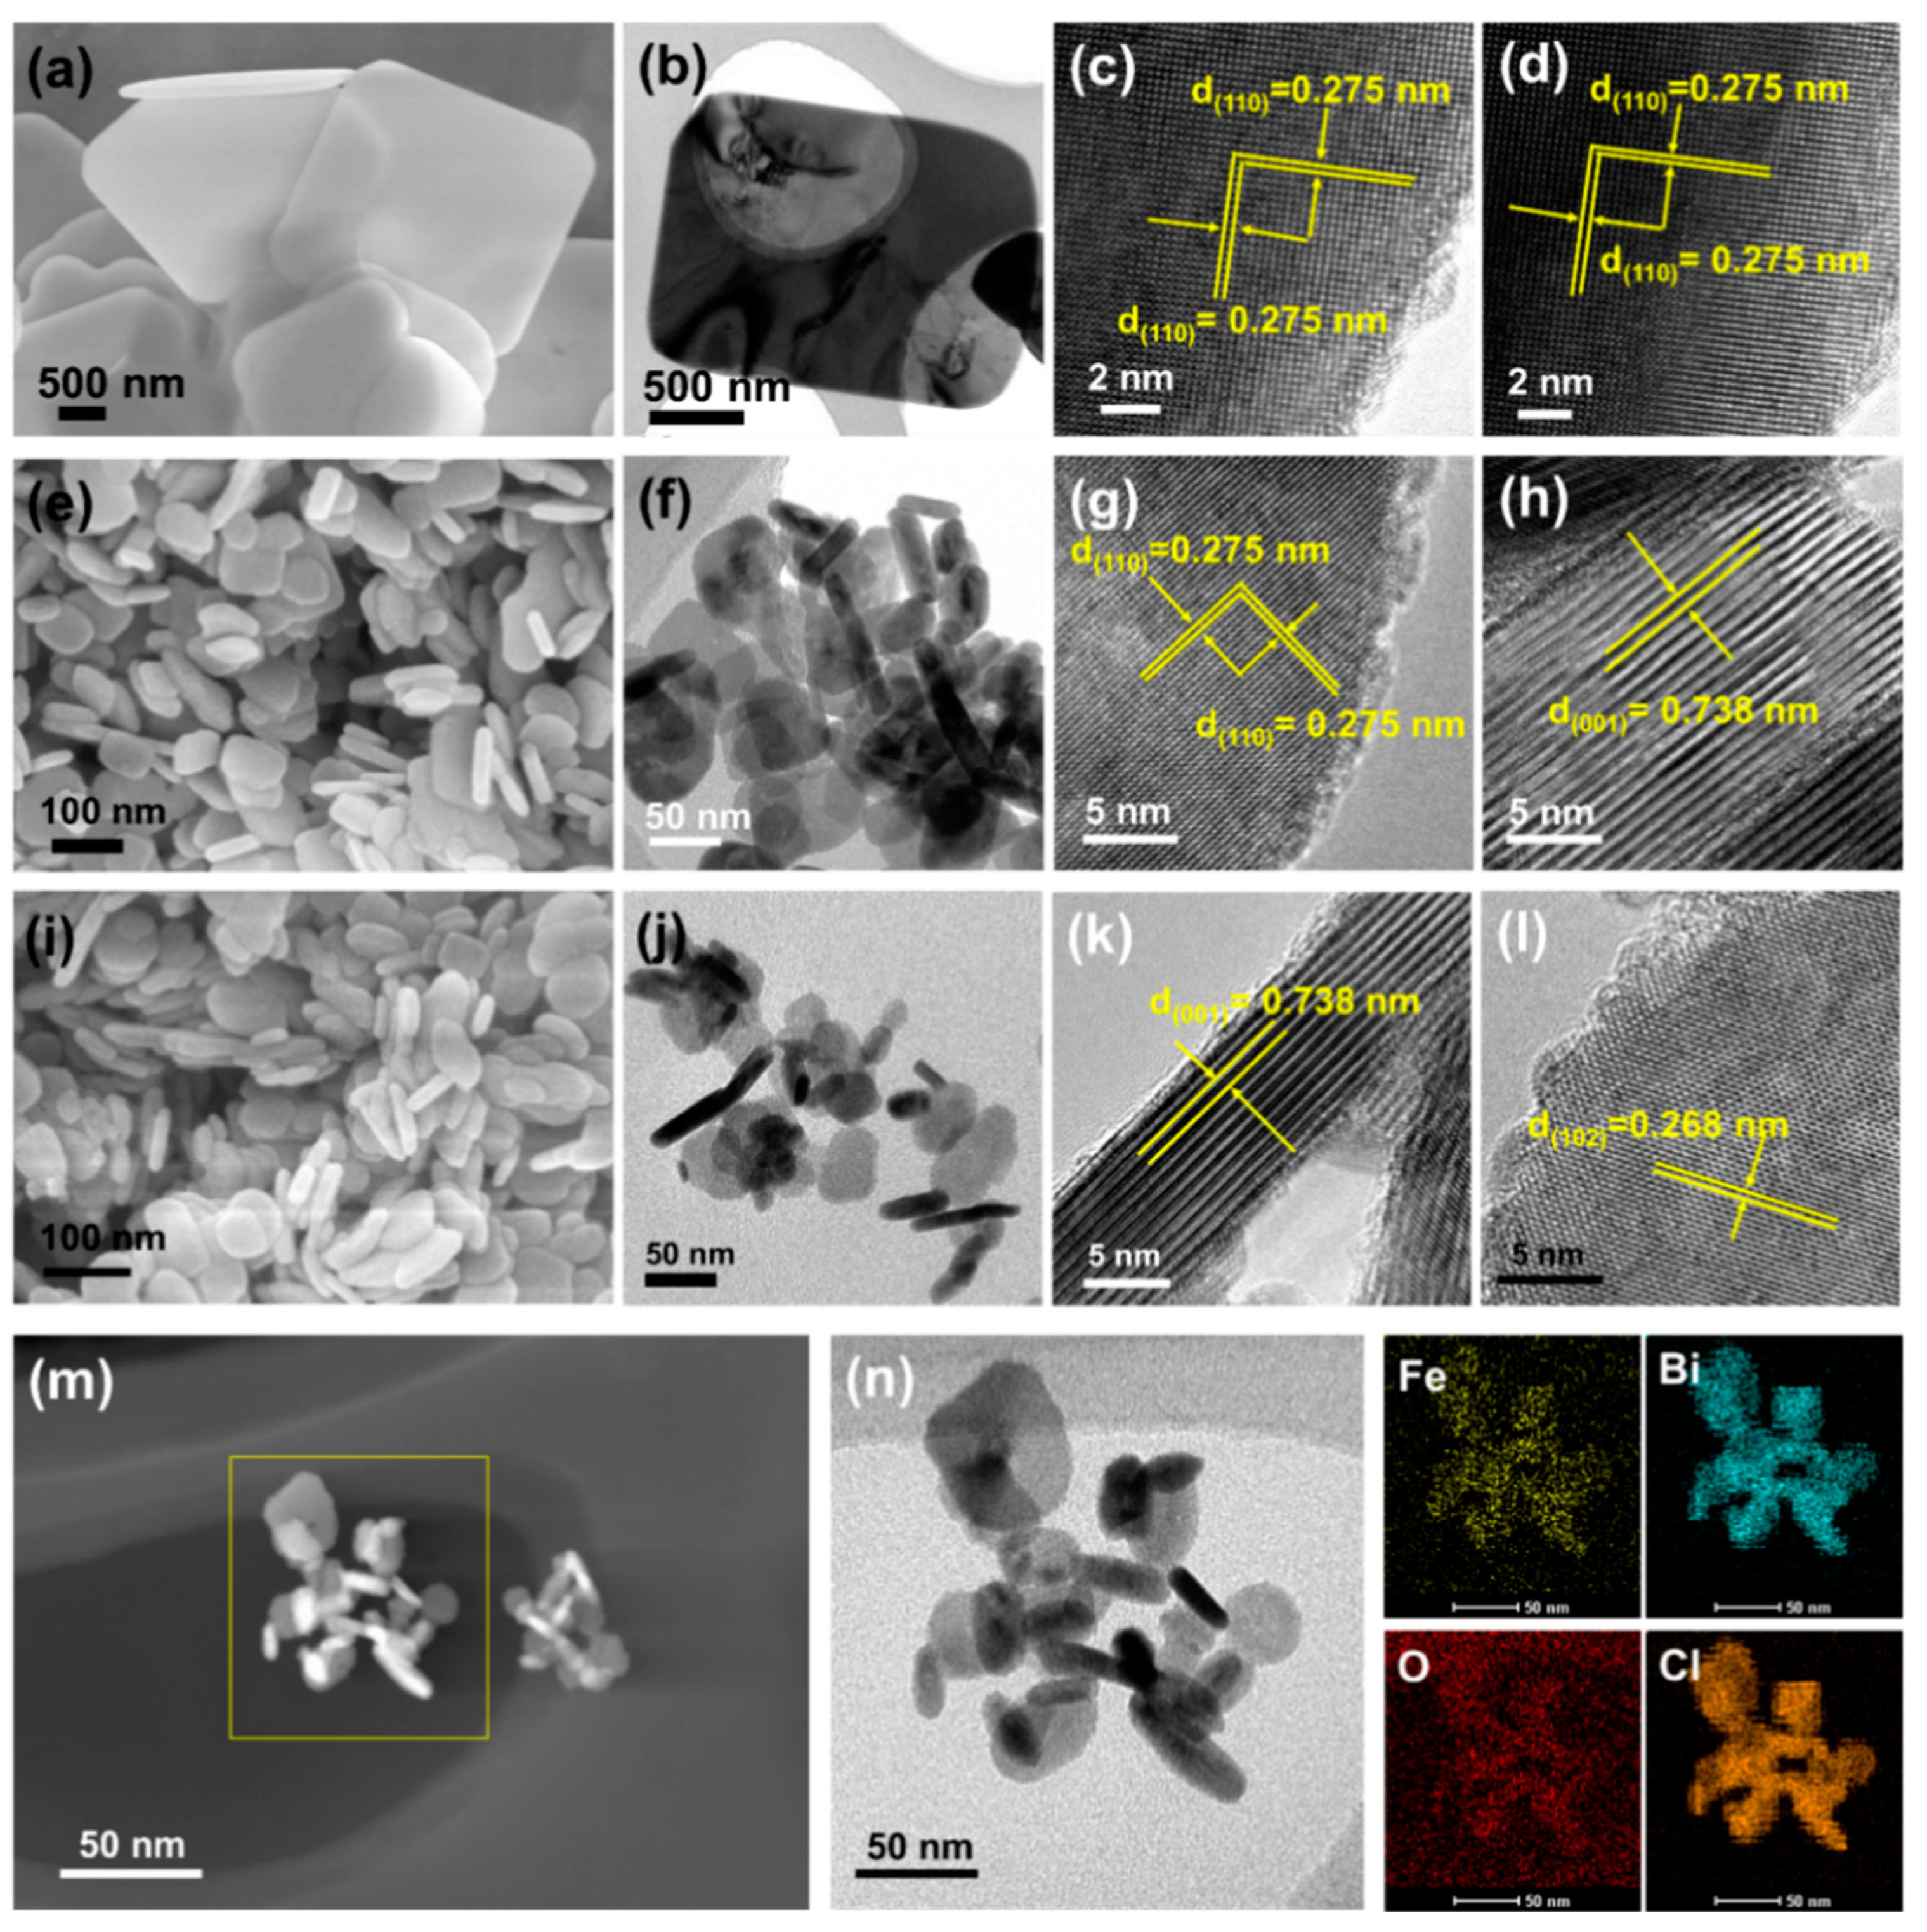
2.1. Structure Differential of Fe-BiOCl-Vo Nanosheets

The crystal structures of BiOCl, BiOCl-Vo, and Fe-BiOCl-Vo are illustrated in Figure 1. The [Bi2O2]2+ layers and chlorine layers are alternating arranged along the c axis in BiOCl, BiOCl-Vo, and Fe-BiOCl-Vo (Figure 1a–c). The Vo generate on the surface of BiOCl-Vo, and Fe-BiOCl-Vo (Figure 1b,c). The Fe ions substitute the Bi in the Fe-BiOCl-Vo (Figure 1c). In the structure of this Fe-BiOCl-Vo, the doped Fe(III) acts as an electron capture center, as we confirmed in the previous study [15]. Then, the electron-captured Fe(III) can transit to Fe(II) (Fe(III) + e → Fe(II)), which could further become the prime reaction center of the Fenton reaction, promoting the activation of H2O2.
The phases of all the products were examined by the XRD, and all the characteristic peaks of the XRD patterns were well-indexed to the tetragonal BiOCl (JCPDS No. 06-2049). For the BiOCl produced in an aqueous solution, the intensity of the characteristic peak located at 2θ = 11.9° ((001) atomic planes) was much more distinctive than the others. Comparatively, the intensity of this characteristic peak in the BiOCl-Vo and Fe-BiOCl-Vo were weakened, suggesting that the developed crystal facets of BiOCl-Vo and Fe-BiOCl-Vo may be different from BiOCl (Figure 2a). When further magnified partial XRD patterns, the shift of characteristic peaks can be identified (Figure 2b,c). As magnified in the region of 11.5–13.0°, the (001) plane of all the samples exhibited no shifting, indicating that the distances between [Bi2O2]2+ layers and chlorine layers of BiOCl-Vo and Fe-BiOCl-Vo were maintained as same as the pristine BiOCl. Whereas the characteristic peaks of (110) and (102) of Fe-BiOCl-Vo were shifted toward the larger 2θ, implying that the crystal lattices shrank slightly (Figure 2c) [15].
In the Bi 4f of BiOCl nanosheets, the binding energies located at 164.9 and 159.6 eV ascribed to Bi 4f5/2 and Bi 4f7/2, respectively. These binding energies of Bi 4f were respectively downshifted by 0.3 eV to 164.6 and 159.3 eV for the BiOCl-Vo nanosheets due to the electron trapping of Vo increasing the charge density [15]. In comparison with the BiOCl nanosheets, the binding energies of Bi 4f in the Fe-BiOCl-Vo continuously shifted to more negative owing to the synergetic effect of Vo and doped Fe for electron-trapping (Figure 2d). In addition, the binding energies at 531.6 and 530.4 eV, respectively assigned to surface-adsorbed oxygen species and lattice oxygen atoms of BiOCl nanosheets were presented. Comparatively, the binding energies of the BiOCl-Vo and Fe-BiOCl-Vo nanosheets also gradually shifted to more negative, which was consistent with the Bi 4f spectra (Figure 2e), further confirming the electron capture feature of Vo and doped Fe. The two peaks located at 710.1 and 724.0 eV, respectively ascribed to the Fe 2p3/2 and Fe 2p1/2, were observed, implying the Fe3+ state of doped Fe in the Fe-BiOCl-Vo nanosheets (Figure 2f). However, the concentration of the doped Fe was lower, and the intensities of the resulting Fe 2p3/2 and Fe 2p1/2 binding energy were lower, which also can be confirmed by the EDS mapping (Figure S1). Additionally, the EPR spectra were employed to detect the Vo concentration of different samples (Figure 2g). The EPR signal of BiOCl nanosheets was barely observed, indicating only a few Vo. In contrast with this EPR signal, the EPR signal of BiOCl-Vo nanosheets was the highest, suggesting the highest concentration of Vo. Comparatively, the Vo concentration of the Fe-BiOCl-Vo nanosheets was lower than that of BiOCl-Vo nanosheets based on the lower EPR signal.
All the shapes of the resulting products were examined through SEM and TEM images. According to Figure 3a,b,e,f,i,j, the BiOCl, BiOCl-Vo, and Fe-BiOCl-Vo exhibited sheet-like morphologies. Furthermore, the sizes of BiOCl, BiOCl-Vo, and Fe-BiOCl-Vo nanosheets were gradually decreased from ~3 μm to ~100 nm to ~50 nm. The corresponding thickness of the resulting nanosheets also progressively decreased from ~200 nm to ~19.2 nm and to ~12.5 nm. In the HRTEM image of BiOCl nanosheets, clear and continuous perpendicularly interplanar lattice fringes spacing of 0.275 nm assigned to (110) planes of tetragonal BiOCl were observed (Figure 3c,d). Similarly, the lattice spacing of 0.275 nm and lateral lattice spacing of 0.738 nm, respectively assigned to (110) and (001) atomic planes of BiOCl were also observed, implying that the generated BiOCl-Vo nanosheets were enclosed with (001) facet predominantly (Figure 3g,h). The lateral lattice spacing of 0.738 nm assigned to (001) planes and lattice of 0.268 nm ascribed to (102) atomic planes were also observed in the HRTEM images of Fe-BiOCl-Vo nanosheets (Figure 3k,l), demonstrating that the Fe-BiOCl-Vo nanosheets also were enclosed by the (001) exposure facets. Furthermore, the bright-field TEM and corresponding elemental mapping images of Fe-BiOCl-Vo nanosheets also confirmed the presence of Fe (Figure 3m,n and Figure S1), which was consistent with the XPS result (Figure 2f).

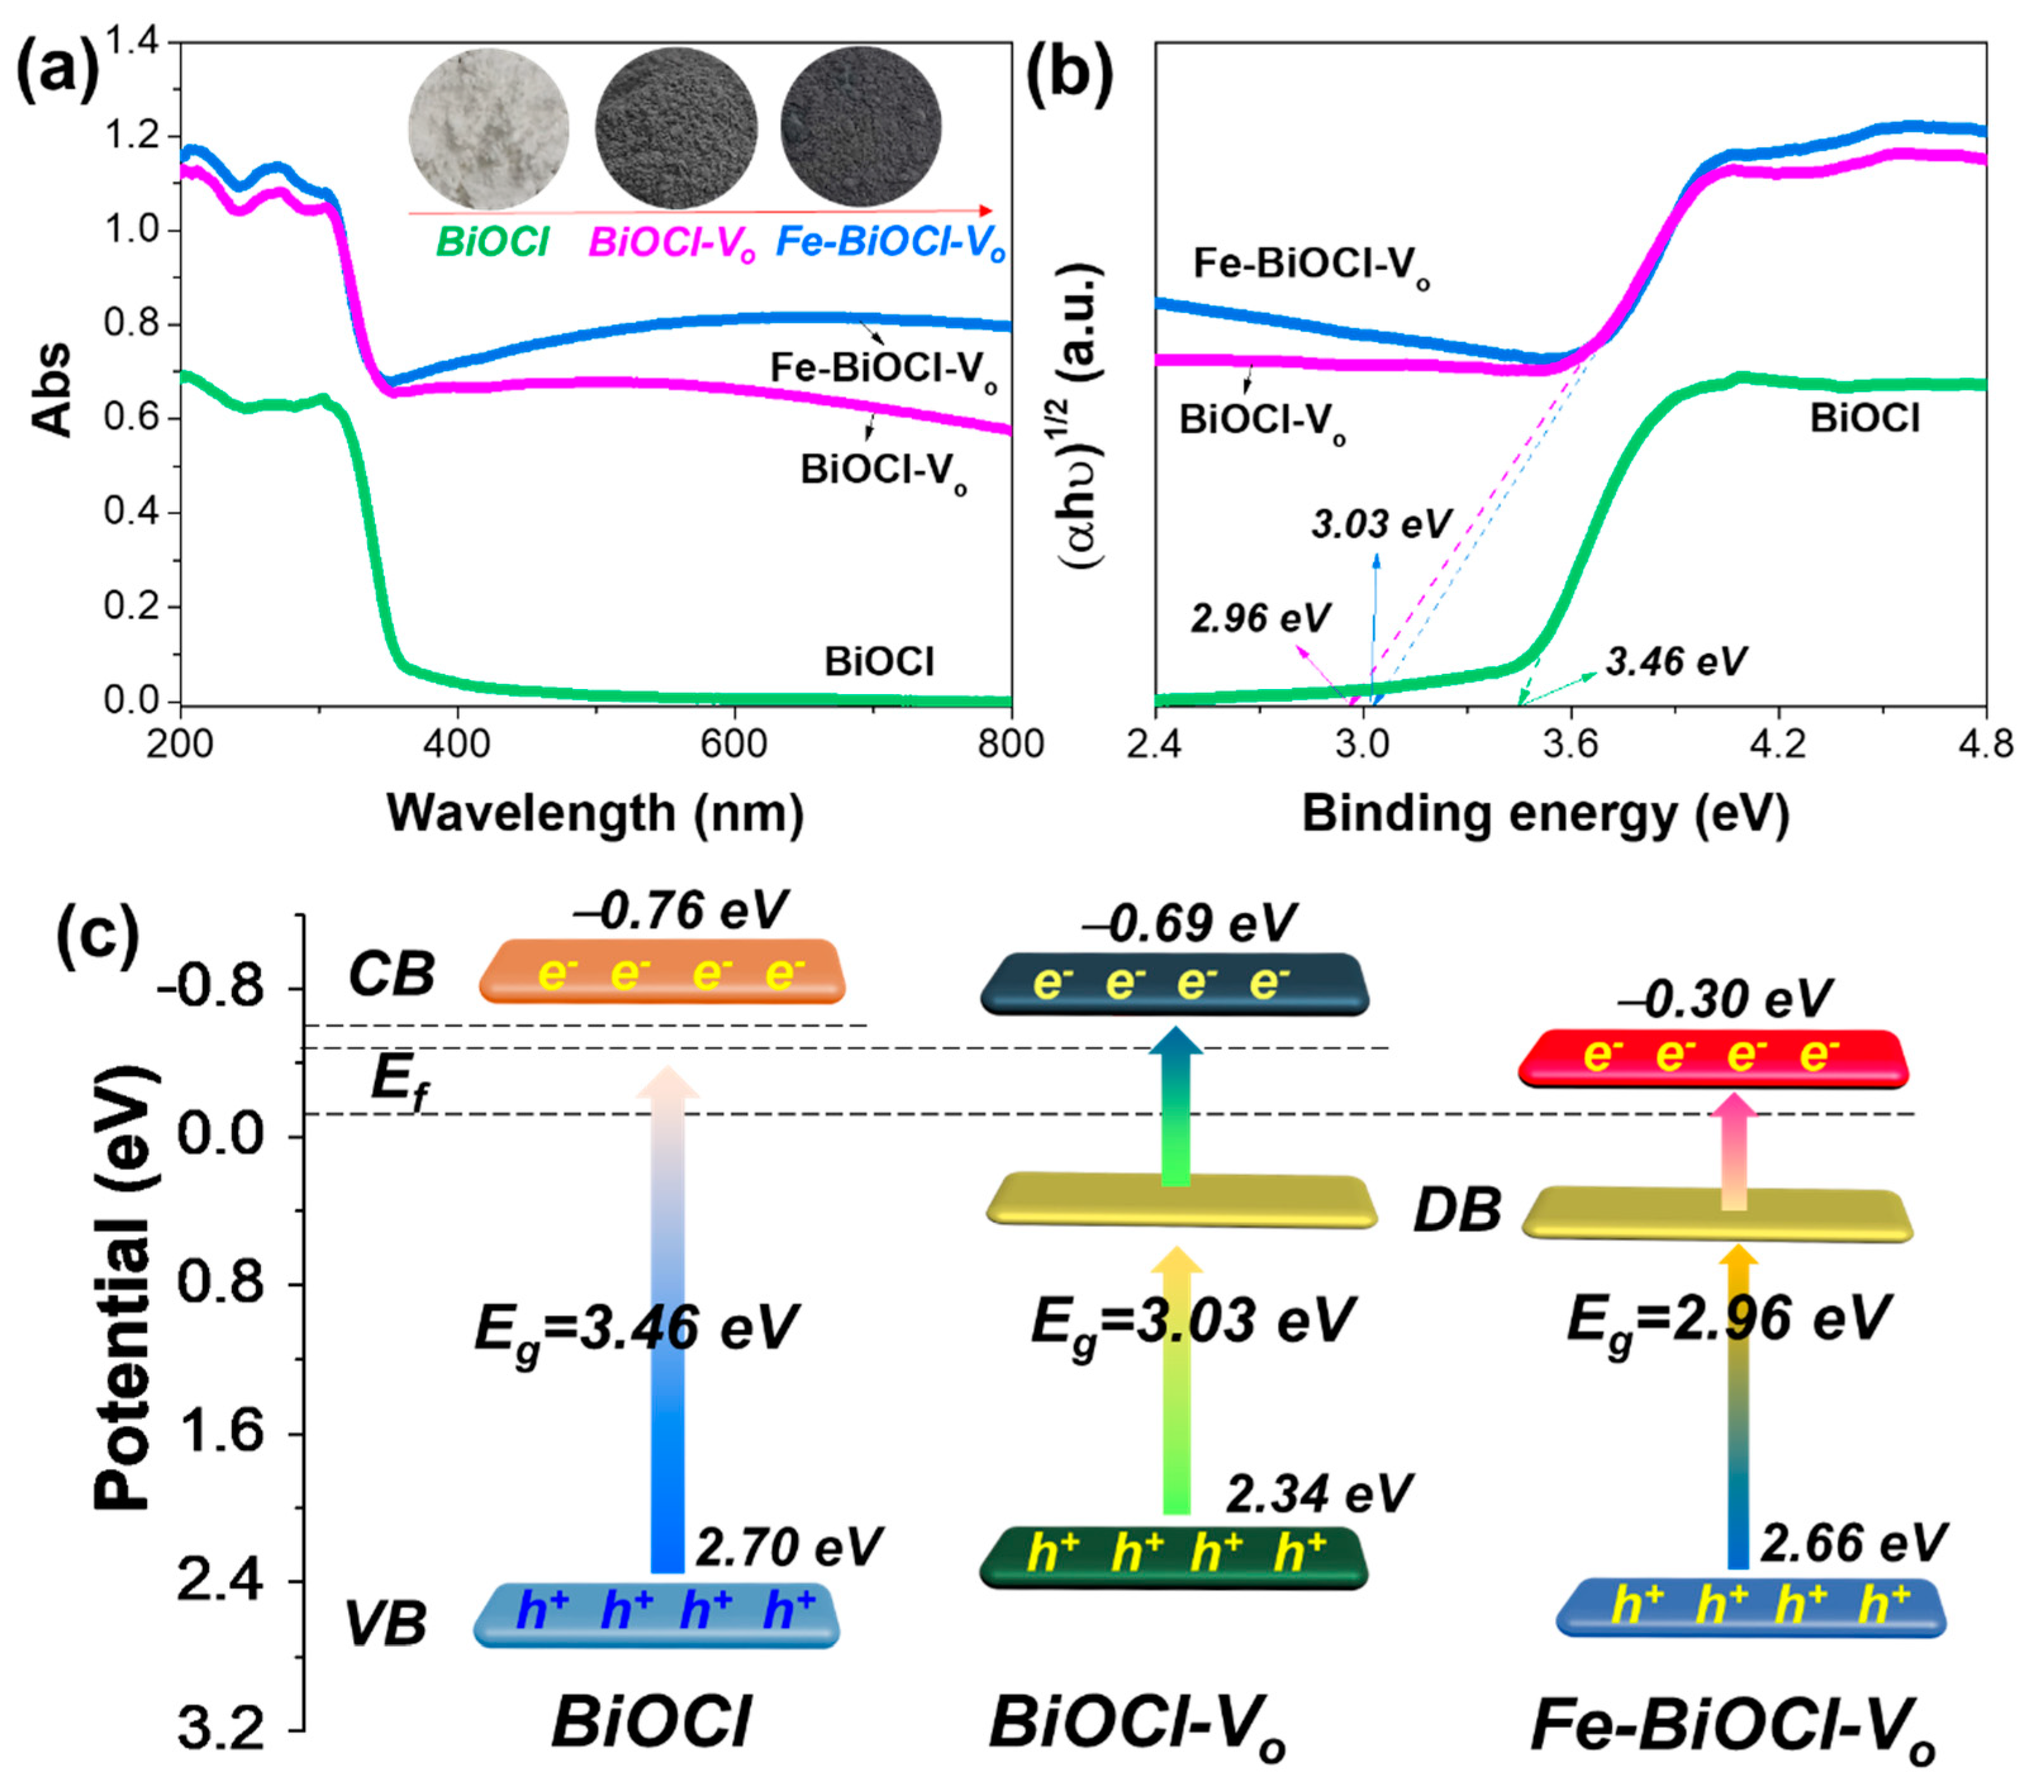
2.2. Band Structure Evolution Fe-BiOCl-Vo Nanosheets

The light responses of different samples were examined through the DRS spectra (Figure 4a). The pristine BiOCl nanosheets only exhibited light response in the ultra-violet region, and its absorption band edge was limited to 358 nm. Compared with the BiOCl nanosheets, the absorption band edges of the BiOCl-Vo and Fe-BiOCl-Vo nanosheets were broadened to 409 and 418 nm, respectively (Figure 4a). Furthermore, both BiOCl-Vo and Fe-BiOCl-Vo nanosheets also exhibited intense light response within the visible light region due to the massive Vo. The visible light response of Fe-BiOCl-Vo nanosheets was enhanced by the integrated effect of Vo and doped Fe. Accordingly, the band gaps of BiOCl, BiOCl-Vo, and Fe-BiOCl-Vo nanosheets were estimated to be 3.46, 3.03, and 2.96 eV, respectively (Figure 4b).
Then, according to the MS plots presented in Figure S2, the flat band potentials of BiOCl, BiOCl-Vo, and Fe-BiOCl-Vo nanosheets were estimated to be −1.26, −1.19, and −0.80 eV (versus Ag/AgCl at pH = 7), respectively. These values were −0.66, −0.59, and −0.20 eV (versus the normal hydrogen electrode (NHE), pH = 0) accordingly, which were considered as the Fermi level (Ef) for the n-type semiconductor of BiOCl. Then, the conduction band (CB) minimums of BiOCl, BiOCl-Vo, and Fe-BiOCl-Vo nanosheets were respectively estimated to be −0.76, −0.69, and −0.30 eV. Correspondingly, the valence band (VB) maximums of BiOCl, BiOCl-Vo, and Fe-BiOCl-Vo nanosheets were 2.70, 2.34, and 2.66 eV (based on the equation ECB = EVB − EG). All the band structure evolutions of BiOCl, BiOCl-Vo, and Fe-BiOCl-Vo nanosheets were illustrated in Figure 4c. Apparently, the Vo and Fe-doping could narrow the band gap and simultaneously downshift the CB minimum. Generally, the Vo and Fe-doping of semiconductors could introduce intermediated defective band (DB) closer to the CB minimum, which could promote the transfer and separation of charge carriers [6,12,21,22,23]. Furthermore, our previous study also confirmed that the Fe-doped BiOCl could drive the CB potential to the less negative [15]. Compared to pristine BiOCl, the narrowed band gap and generated DB of BiOCl-Vo and Fe-BiOCl-Vo nanosheets could promote efficient charge transfer and separation.
Furthermore, the charge transfer directions of pristine BiOCl and Fe-BiOCl have been confirmed by the photo-deposition experiments in our previous work [15]. As verified, the photogenerated electrons of BiOCl were directed to the predominant (001) exposure facet, while the photogenerated holes moved to the lateral (010) facet. For the Fe-BiOCl, the doped Fe acts as an electron capture center, contributing to the transfer and accumulation of photogenerated holes to the surface. Thus, the surface of BiOCl nanosheets was enriched electrons, and the surface of Fe-BiOCl was accumulated holes.
The charge transfer and separation efficiency of all the samples were investigated. The smallest radius of Fe-BiOCl-Vo nanosheets in EIS plots was observed, suggesting the fastest separation of charge carriers and the lowest interfacial transfer resistance (Figure 5a). Additionally, the strongest photocurrent signals of Fe-BiOCl-Vo nanosheets also validated the highest separation efficiency of charge carriers (Figure 5b). All those results show that the Fe-BiOCl-Vo nanosheets presented superior transfer and separation of charge carriers, which may enhance their photocatalytic and photocatalytic-Fenton performances.

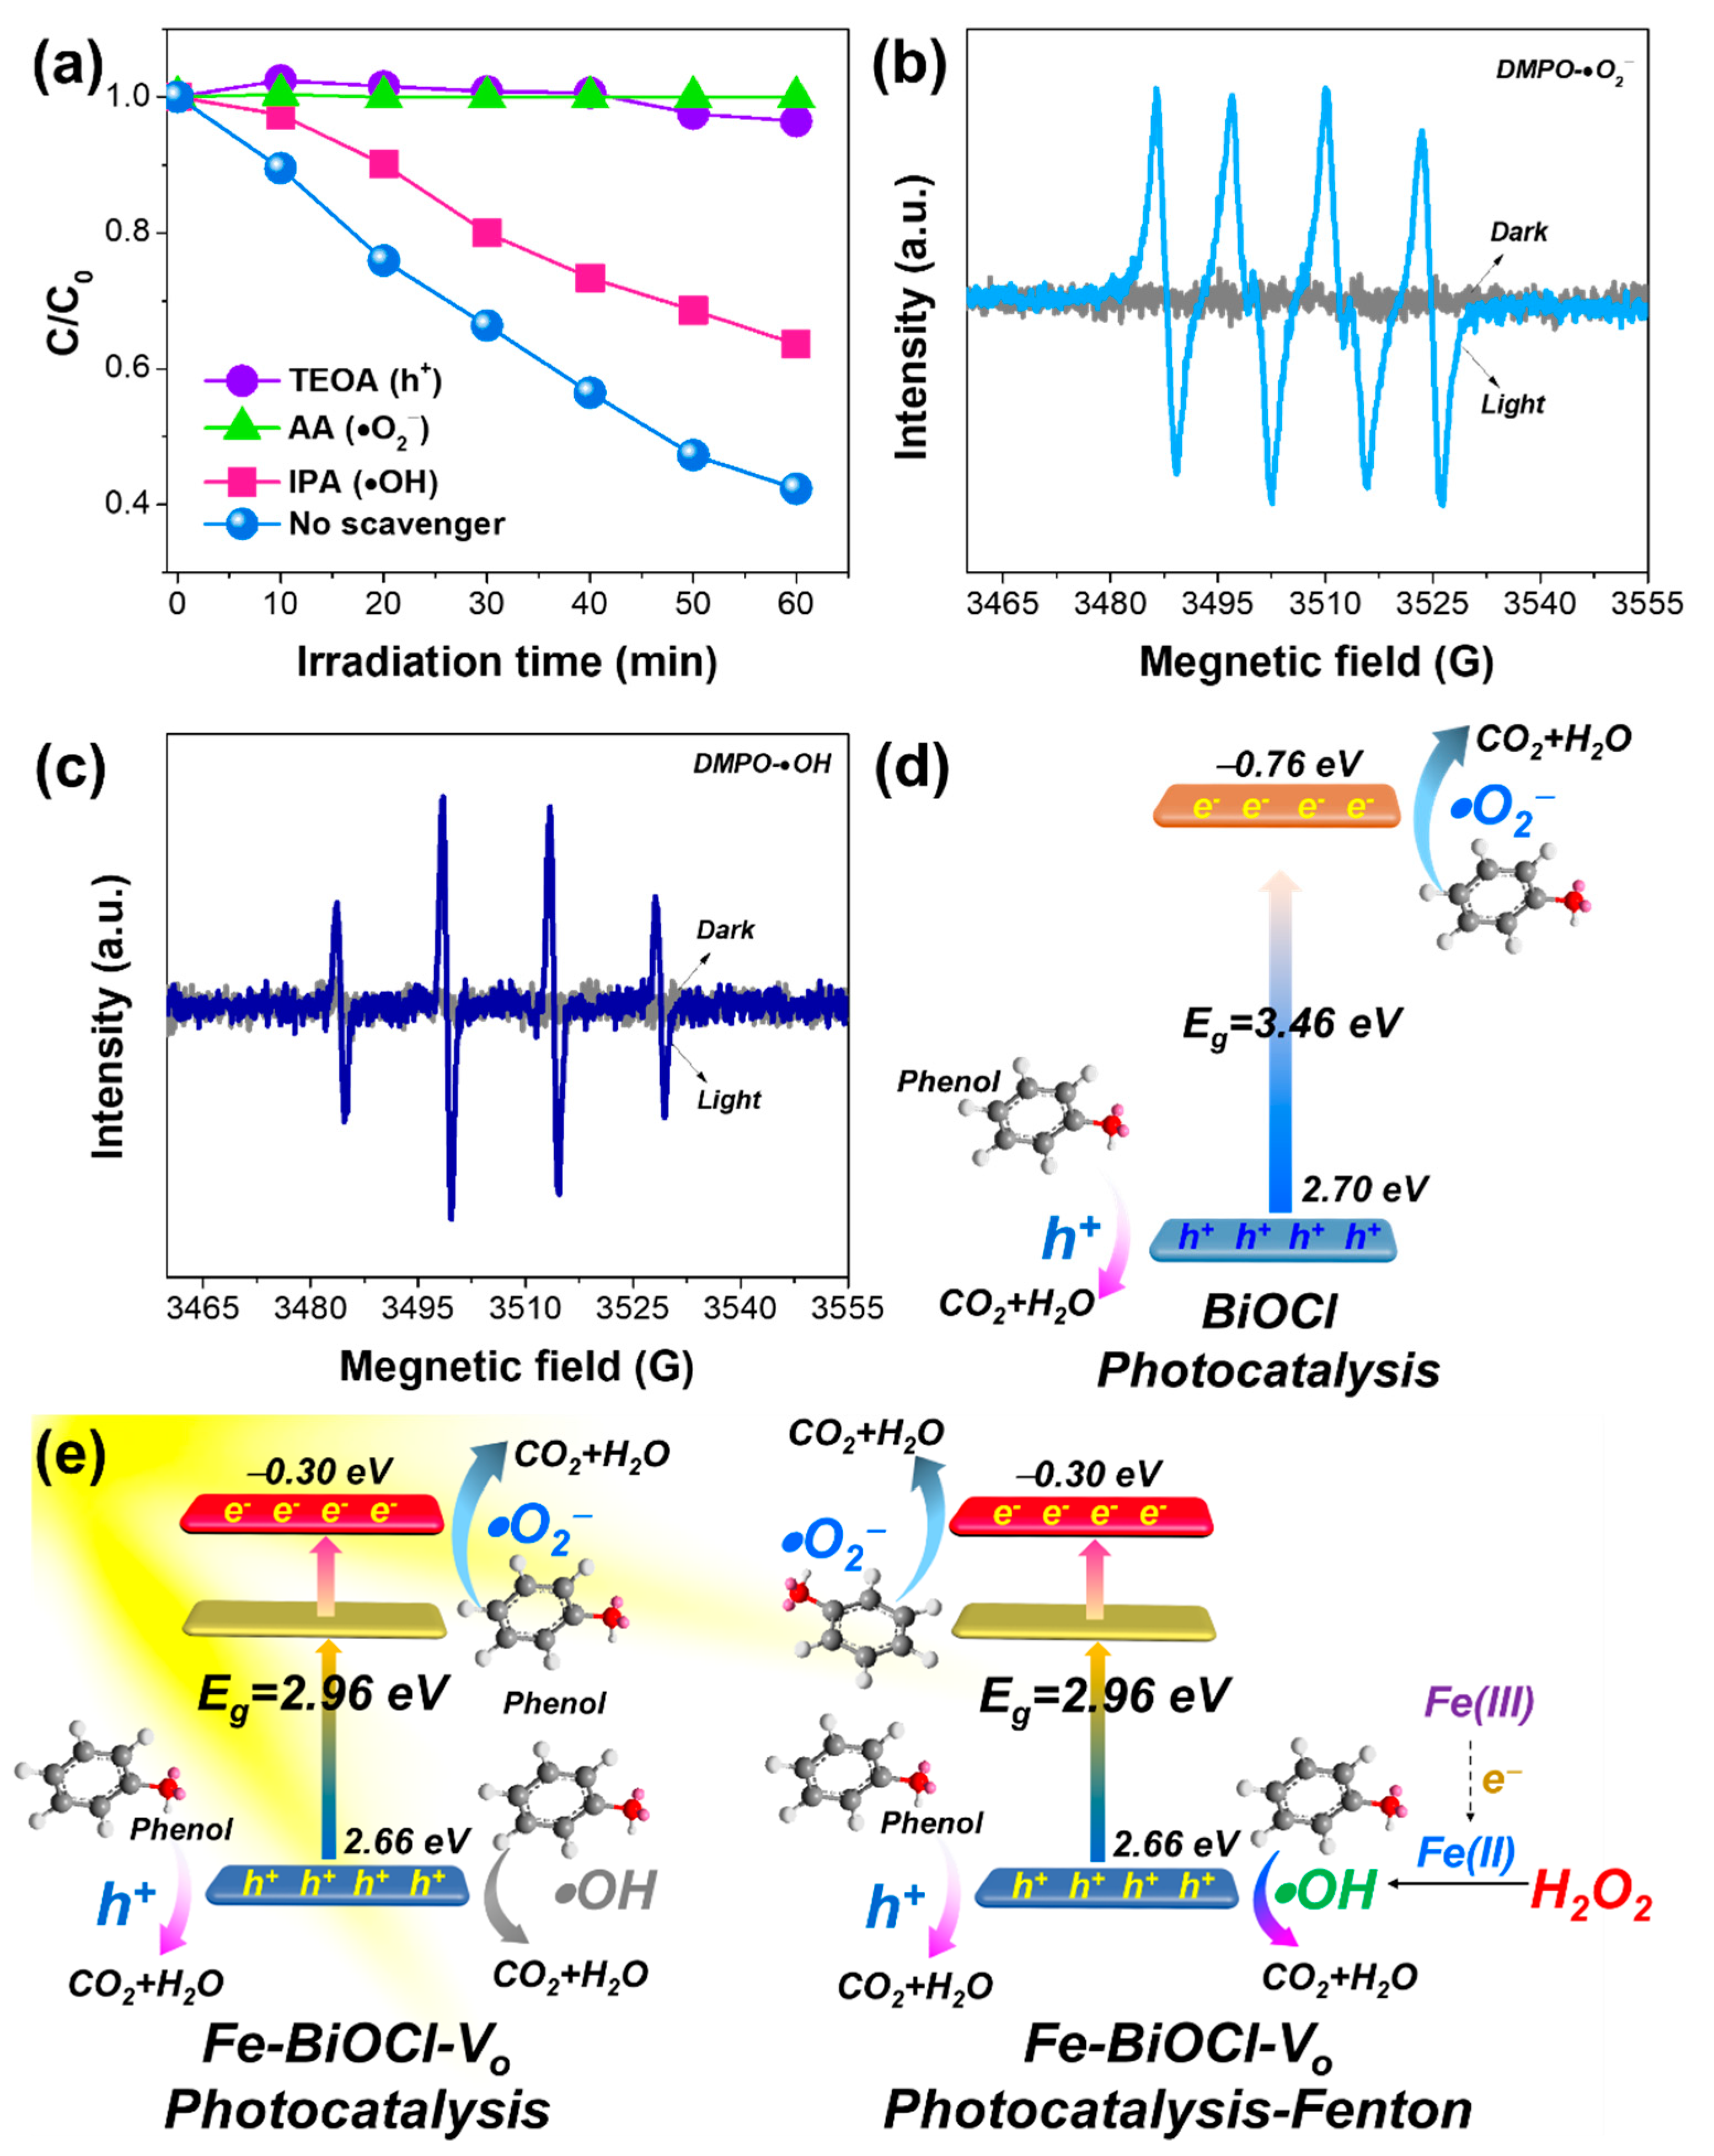
2.3. Enhanced Photocatalytic-Fenton Performances of Fe-BiOCl-Vo Nanosheets

The photocatalytic and photocatalytic-Fenton performances of Fe-BiOCl-Vo nanosheets were investigated. Under full spectra irradiation, the pristine BiOCl Compared with BiOCl nanosheets, both Fe-BiOCl-Vo nanosheets and BiOCl-Vo nanosheets showed excellent photocatalytic performances under full spectra irradiation. The photocatalytic reactivity of phenol over the Fe-BiOCl-Vo nanosheets was almost twice that of BiOCl nanosheets, and almost 50% of phenol was removed within 60 min (Figure 6a). Under visible light irradiation, the phenol was barely removed by employing BiOCl nanosheets as catalysts. Also, the photocatalytic performances of Fe-BiOCl-Vo nanosheets and BiOCl-Vo nanosheets were only slightly enhanced under visible light irradiation (Figure 6b); that is, only ~15% of phenol was removed. Apparently, the Fe-BiOCl-Vo nanosheets can enhance photocatalytic performance under full spectra and visible light irradiation, but the enhancements of degradation were still limited [24,25].
Then the photocatalytic-Fenton performances of Fe-BiOCl-Vo nanosheets were examined under full spectra illumination. Firstly, different concentration of H2O2 referring from 1.29 to 5.16 mmol/L was added into the photocatalytic-Fenton system (pH = 6.6). Obviously, the photocatalytic-Fenton performances of the Fe-BiOCl-Vo nanosheets can be enhanced regardless of the concentration of H2O2 that phenol was almost completely removed within 60 min (Figure 6c). Thus, 2.58 mmol/L of H2O2 was added into the photocatalytic-Fenton system, and the pH value was altered from 3.0 to 6.6. Generally, the optimum pH value of the Fenton reaction was around 3 [2,26]. In contrast to this pH condition, the Fe-BiOCl-Vo nanosheets exhibited superior photocatalytic-Fenton performances in the pH range from 3.0 to 6.6, suggesting that the resulting Fe-BiOCl-Vo nanosheets could broaden the application pH range in the photocatalytic-Fenton system (Figure 6d). Furthermore, the accumulation of iron sludge is another issue for the traditional Fenton or the heterogeneous Fenton process due to the isolated or the leached ferrous ions. But the leached ferrous ions were unable to detect in this study or previous study (Figure S3), demonstrating the stability of Fe-BiOCl-Vo nanosheets. Then, the photocatalytic-Fenton activity at different concentrations of phenol and different dosage of catalysts were also investigated at pH = 6.6 and in the presence of 2.58 mmol/L of H2O2. Apparently, the 20 mg of Fe-BiOCl-Vo nanosheets can remove phenol when its concentration was lower than 10 mg/L (Figure 6e), and 20 mg of Fe-BiOCl-Vo nanosheets showed superior degradation performances at a fixed pH value and concentrations of phenol and H2O2 (Figure 6f). Thus, under above-optimum conditions, the photocatalytic-Fenton performance of Fe-BiOCl-Vo nanosheets was almost two-fold higher than its photocatalytic performances because of the integrated effect of Vo and Fe doping (Figure 6g). Furthermore, compared with the Fenton process (Figure S4), the photocatalytic-Fenton performance of Fe-BiOCl-Vo nanosheets can be enhanced significantly. Accordingly, the total organic carbon (TOC) removal efficiency of phenol over Fe-BiOCl-Vo nanosheets through the photocatalytic-Fenton process was higher than its photocatalytic process (Figure 6h), suggesting the enhancement of the Fenton reaction for the degradation of phenol. Furthermore, the photocatalytic-Fenton performance of Fe-BiOCl-Vo nanosheets can be maintained even after three recycling, further verifying the stability of Fe-BiOCl-Vo nanosheets (Figure 6i). The resulting crystal phase and morphology of the used Fe-BiOCl-Vo nanosheets were consistent with the fresh Fe-BiOCl-Vo nanosheets, also confirming the stability of Fe-BiOCl-Vo nanosheets (Figure S5).
During the photocatalytic and photocatalytic-Fenton processes, the reactive species were examined by scavenger tests and EPR spectra (Figure 7). Based on the results of scavenger tests, the photocatalytic performances of Fe-BiOCl-Vo nanosheets were completely inhibited by employing AA and TEOA as scavengers, suggesting that the ●O2 and h+ were the predominant reactive species during the photocatalytic process. Meanwhile, the photocatalytic performance of Fe-BiOCl-Vo nanosheets was slightly declined by introducing IPA, indicating that ●OH was the secondary reactive species (Figure 7a). Furthermore, the distinctive DMPO-●O2 and DMPO-●OH EPR signals of Fe-BiOCl-Vo nanosheets also confirmed the reactive roles of ●O2 and ●OH during the photocatalytic process (Figure 7b,c). The reactive species of Fe-BiOCl-Vo nanosheets were multiple, which is different from BiOCl nanosheets. According to our previous study, the ●O2 (O2 + e → ●O2) and h+ were the predominant reactive species for the BiOCl nanosheets because the e were primarily directed to the exposed (001) facet, as driven by the internal electric field. Then, the photocatalytic mechanisms of the BiOCl and Fe-BiOCl-Vo nanosheets were presented in Figure 7d. During the photocatalytic process, the ●O2 and h+ were the predominant reactive species for phenol degradation over a BiOCl nanosheet. While the primary reactive species were ●O2 and h+ for the Fe-BiOCl-Vo nanosheets, ●OH also played a minor role during the photocatalytic process (Figure 7e).
During the photocatalytic-Fenton process of Fe-BiOCl-Vo nanosheets, the electron-capture center of Fe(III) trapped the photogenerated electrons and transited to Fe(II), and Vo also simultaneously captured the photogenerated electrons, contributing to the efficient charge transfer and separation, accumulating holes on the surface of Fe-BiOCl-Vo nanosheets. The photogenerated electrons captured by Vo were further transited to ●O2 (O2 + e → ●O2). Then, the transited Fe(II) can act as reaction centers of the Fenton reaction (Fe(II) + H2O2 → ●OH + Fe(III)), producing massive ●OH and facilitating the Fe(III)/Fe(II) recycling [15]. Therefore, in the photocatalytic-Fenton system, the synergistic effect of the multiple reactive species could enhance the degradation and ring-open of phenol. Thus, the mechanism of phenol degradation over Fe-BiOCl-Vo nanosheets through the photocatalytic-Fenton process was illustrated based on the above discussions (Figure 7e). Briefly, the Fe-BiOCl-Vo nanosheets with modulated band structure could promote charge transfer and separation due to the integrated electron trapping effects of Vo and doped Fe. Then, during the photocatalytic-Fenton process, the ●O2 from the photogenerated electrons (O2 + e → ●O2), ●OH from photogenerated holes (O2 + e → ●O2) and Fenton reaction (Fe(II) + H2O2 → ●OH + Fe(III)), and photogenerated holes were acted as reactive species for phenol removal efficiently. During the photocatalytic-Fenton process, the Fe(III)/Fe(II) recycling, charge transfer and separation, and enhanced photocatalytic performances of Fe-BiOCl-Vo nanosheets can be achieved successfully.

3. Experimental

3.1. Preparation of Fe-BiOCl-Vo, BiOCl-Vo, and BiOCl Nanosheets

All the products were prepared using the hydrothermal or solvothermal methods. 2 mmol of Bi(NO3)3●5H2O was ultrasonically dissolved into 20 mL of mannitol (0.1 M). Simultaneously, FeCl3 (0.333 mmol) was dissolved into mannitol (0.1 M, 20 mL), which was further dropped into the above Bi(NO3)3 solution to form a white suspension. Then, the suspension was transferred into a Teflon-lined autoclave reactor (TLAR, 100 mL) after stirring for 30 min at room temperature. The TLAR was maintained at 180 °C for 12 h and cooled down naturally. Finally, the resultants were washed, dried, collected, and labeled as Fe-BiOCl-Vo. Similarly, the BiOCl-Vo was prepared through the above procedures but only employing 2 mmol of KCl as substituted chloride sources. While the BiOCl was also produced through the above procedures in the presence of 2 mmol of KCl and by replacing mannitol with water.

3.2. Characterization

The powder X-ray diffraction (XRD) patterns of all the samples were recorded on the X-ray diffractometer (Bruker D8, Saarbrucken, Germany). Scanning electron microscopy (SEM, Hitachi SU-8010, Hitachi, Tokyo, Japan) equipped with elemental mapping and energy dispersive spectroscopy (EDS), and transmission electron microscopy (TEM, JEM-2100, JEOL, Tokyo, Japan) with elemental mapping was used to characterize the morphology of all the products. Simultaneously, the high-resolution TEM (HRTEM, JEOL, Tokyo, Japan) images were also recorded through the TEM. UV-vis diffuse reflectance spectra (DRS) of the resulting products were performed on a UV-vis spectrophotometer (UV-2600, Shimadzu, Shimodogata, Japan). Thermo Fisher Spectroscope (Thermo Scientific K-Alpha, Thermo Fisher Scientific, Waltham, MA, USA) was used to record the X-ray photoelectron spectroscopy (XPS) of some samples. The reactive oxygen species of ●O2 and ●OH and surface oxygen vacancies of different samples were detected by electron paramagnetic resonance (EPR, JNM-ECZ600R, JEOL, Tokyo, Japan) technique. For the detection of reactive oxygen species, 5,5-dimethyl-1-dimethy-N-oxide (DMPO) was used. Isopropanol (IPA), ascorbic acid (AA), and triethanolamine (TEOA) were used as scavengers for ●OH, ●O2, and h+, respectively. Electrochemical characterizations of the resultants, including electrochemical impedance spectroscopy (EIS), Mott-Schottky (MS) plots, and photocurrent measurement, were performed on the electrochemical workstation (CHI 760E, Shanghai, China) in a 0.5 M Na2SO4 solution.

3.3. Photocatalytic and Photocatalytic-Fenton Activity

The photocatalytic and photocatalytic-Fenton performances of different samples were evaluated by photodegrading the phenol solution (10 mg/L). During the photocatalytic process, a Xenon lamp (300 W) was selected as a light source, particularly as full-spectra light. The visible light was harvested by introducing a 420 nm cut-off filter in the front of the Xenon lamp. 25 mg of prepared photocatalysts were re-dispersed into 50 mL of a phenol solution, which was persistently stirred in the dark for 1 h to reach the equilibrium of adsorption-desorption. Then, the light was turned on to carry out photocatalysis. During the photocatalytic process, 2 mL of aliquots were withdrawn from the reaction system intermittently. This withdrawn aliquot was filtered by 0.22 μm Millipore filters to maintain the transparent solution, in which the concentration of phenol was further analyzed through the optical absorption method on the UV-vis spectrophotometer (UVmini-1280, Shimadzu, Shimodogata, Japan). Similarly, the photocatalytic-Fenton process was also carried out by following the above procedure, but just adding 10 μL of H2O2 (30%, 2.58 mmol/L) before turning the light on.

4. Conclusions

In this study, the band structure of Fe-BiOCl-Vo nanosheets was regulated by the integrated electron trapping effect of Vo and doped Fe. Then, the integrated electron trapping effect promoted the charge transfer and separation of Fe-BiOCl-Vo nanosheets effectively. The efficiently transferred and separated charge carriers and corresponding radicals, including ●O2, h+, and ●OH, and the massive ●OH from the Fenton reaction played synergetic roles in the degradation of phenol over Fe-BiOCl-Vo nanosheets. With the synergetic effects of multiple radicals and charge carriers, the photocatalytic-Fenton performances of phenol over Fe-BiOCl-Vo nanosheets were enhanced so that phenol could be removed completely from the solution within 60 min, which was ~two-fold higher than its photocatalytic performances. This work provides a sophisticated structure design for catalysts for outstanding photocatalytic-Fenton performances.

Supplementary Materials

The following supporting information can be downloaded at: https://www.mdpi.com/article/10.3390/catal13060947/s1, Figure S1. Elemental mapping and EDS spectrum, Figure S2. MS plots of different samples, Figure S3. Concentration of Fe2+, Figure S4. Comparison of the Fenton, photocatalytic, and photocatalytic-Fenton performances, Figure S5. Comparison of XRD patterns and SEM images of Fe-BiOCl-Vo nanosheets before and after the reaction.

Author Contributions

Methodology, investigation, J.L., S.Z., D.X. and Q.W.; data curation, writing—original draft, Y.W., M.N. and J.L.; writing—review and editing, Z.W.; editing and polishing, Z.W. All authors have read and agreed to the published version of the manuscript.

Funding

This work was supported by the Scientific Research Fund of Hunan Provincial Education Department (20B055), Natural Science Foundation of Hunan Province (2023JJ30074), NSFC (52174238), Changsha University.

Data Availability Statement

The data is contained within the article.

Acknowledgments

The authors also would like to acknowledge the TEM support from Ning Yan from Modern Analysis and Test Center, Central South University.

Conflicts of Interest

The authors declare no conflict of interest.

References

  1. Sunidhi, B.; Subhankar, C. Fluoroquinolone antibiotics: Occurrence, mode of action, resistance, environmental detection, and remediation—A comprehensive review. Environ. Pollut. 2022, 315, 120440. [Google Scholar]
  2. Olivier, L.; René, M. Treatment of organic pollution in industrial saline wastewater: A literature review. Water Res. 2006, 40, 3671–3682. [Google Scholar]
  3. Imran, A.; Mohd, A.; Tabrez, A.K. Low cost adsorbents for the removal of organic pollutants from wastewater. J. Environ. Manag. 2012, 113, 170–183. [Google Scholar]
  4. Zhang, K.; Liang, J.; Wang, S.; Liu, J.; Ren, K.; Zheng, X.; Luo, H.; Peng, Y.; Zou, X.; Bo, X.; et al. BiOCl Sub-microcrystals induced by citric acid and their high photocatalytic activities. Cryst. Growth Des. 2012, 12, 793–803. [Google Scholar] [CrossRef]
  5. Wang, Y.; Shi, Z.Q.; Fan, C.M.; Hao, X.G.; Ding, G.Y.; Wang, Y.F. Synthesis of BiOCl photocatalyst by a low-cost, simple hydrolytic technique and its excellent photocatalytic activity. Int. J. Min. Met. Mater. 2012, 19, 467–472. [Google Scholar] [CrossRef]
  6. Wei, Z.; Li, W.L.; Hu, J.S.; Ma, X.G.; Zhu, Y.F. Interfacial internal electric field and oxygen vacancies synergistically enhance photocatalytic performance of bismuth oxychloride. J. Hazard. Mater. 2021, 402, 123470. [Google Scholar] [CrossRef]
  7. Deng, F.; Zhang, Q.; Yang, L.; Luo, X.; Wang, A.; Luo, S.; Dionysiou, D.D. Visible-light-responsive graphene-functionalized Bi-bridge Z-scheme black BiOCl/Bi2O3 heterojunction with oxygen vacancy and multiple charge transfer channels for efficient photocatalytic degradation of 2-nitrophenol and industrial wastewater treatment. Appl. Catal. B Environ. 2018, 238, 61–69. [Google Scholar] [CrossRef]
  8. Li, H.; Li, J.; Ai, Z.H.; Jia, F.L.; Zhang, L.Z. Oxygen Vacancy-Mediated Photocatalysis of BiOCl: Reactivity, Selectivity, and Perspectives. Angew. Chem. Int. Ed. 2018, 57, 122–138. [Google Scholar] [CrossRef]
  9. Cai, Y.J.; Li, D.Y.; Sun, J.Y.; Chen, M.D.; Li, Y.R.; Zou, Z.W.; Zhang, H.; Xu, H.M.; Xia, D.S. Synthesis of BiOCl nanosheets with oxygen vacancies for the improved photocatalytic properties. Appl. Surf. Sci. 2018, 439, 697–704. [Google Scholar] [CrossRef]
  10. Wu, Z.H.; Li, Z.F.; Tian, Q.Y.; Liu, J.; Zhang, S.M.; Xu, K.Q.; Shen, J.; Zhang, S.Y.; Wu, W. Protonated branched polyethyleneimine induces the shape evolution of BiOCl and exposed {010} facet of BiOCl nanosheets. Cryst. Growth Des. 2018, 18, 5479–5491. [Google Scholar] [CrossRef]
  11. Zeng, X.X.; Gong, X.F.; Wan, Y.Q.; He, R.Y.; Xu, Z.D. Formation of oxygen vacancies on the {010} Facets of BiOCl and visible light activity for degradation of ciprofloxacin. Chem. Res. Chin. Univ. 2018, 34, 711–718. [Google Scholar] [CrossRef]
  12. Wang, L.; Lv, D.D.; Dong, F.; Wu, X.L.; Cheng, N.Y.; Scott, J.; Xu, X.; Hao, W.C.; Du, Y. Boosting visible-light-driven photo-oxidation of BiOCl by promoted charge separation via vacancy engineering. ACS Sustain. Chem. Eng. 2019, 7, 3010–3017. [Google Scholar] [CrossRef]
  13. Zhang, X.; Wei, J.; Li, R.; Zhang, C.; Zhang, H.; Han, P.; Fan, C. DFT + U predictions: Structural stability, electronic and optical properties, oxidation activity of BiOCl photocatalysts with 3D transition metals doping. J. Mater. Sci. 2018, 53, 4494. [Google Scholar] [CrossRef]
  14. Tian, F.; Li, G.F.; Zhao, H.P.; Chen, F.X.; Li, M.; Liu, Y.L.; Chen, R. Residual Fe enhances the activity of BiOCl hierarchical nanostructure for hydrogen peroxide activation. J. Catal. 2019, 370, 265–273. [Google Scholar] [CrossRef]
  15. Wu, Z.; Shen, J.; Li, W.; Li, J.; Xia, D.; Xu, D.; Zhang, S.; Zhu, Y. Electron self-sufficient core-shell BiOCl@Fe-BiOCl nanosheets boosting Fe(III)/Fe(II) recycling and synergetic photocatalysis-Fenton for enhanced degradation of phenol. Appl. Catal. B Environ. 2023, 330, 122642. [Google Scholar] [CrossRef]
  16. Vorontsov, A.V. Advancing Fenton and photo-Fenton water treatment through the catalyst design. J. Hazard. Mater. 2019, 372, 103–112. [Google Scholar] [CrossRef]
  17. Liu, T.; Qu, H.; Tian, J.X.; He, S.H.; Su, Y.; Su, H.Q. Preparation of organic-free two-dimensional kaolinite nanosheets by in situ interlayer Fenton reaction. Chemistryselect 2019, 4, 11604–11608. [Google Scholar] [CrossRef]
  18. Cheng, M.; Liu, Y.; Huang, D.L.; Lai, C.; Zeng, G.M.; Huang, J.H.; Liu, Z.F.; Zhang, C.; Zhou, C.Y.; Qin, L.; et al. Prussian blue analogue derived magnetic Cu-Fe oxide as a recyclable photo-Fenton catalyst for the efficient removal of sulfamethazine at near neutral pH values. Chem. Eng. J. 2019, 362, 865–876. [Google Scholar] [CrossRef]
  19. Xiong, Z.W.; Wang, Z.; Murugananthan, M.; Zhang, Y.R. Construction of an in-situ Fenton-like system based on a g-C3N4 composite photocatalyst. J. Hazard. Mater. 2019, 373, 565–571. [Google Scholar] [CrossRef]
  20. Li, W.T.; Geng, X.; Xiao, F.; An, G.Y.; Wang, D.S. Fe-II/Fe-III doped Bi/BiOBr hierarchical microspheres as a highly efficient catalyst for degradation of organic contaminants at neutral pH: The role of visible light and H2O2. Chemcatchem 2017, 9, 3762–3771. [Google Scholar] [CrossRef]
  21. Chen, Y.; Wang, F.; Cao, Y.H.; Zhang, F.Y.; Zou, Y.Z.; Huang, Z.A.; Ye, L.Q.; Zhou, Y. Interfacial oxygen vacancy engineered two-dimensional g-C3N4/BiOCl heterostructures with boosted photocatalytic conversion of CO2. ACS Appl. Energ. Mater. 2020, 3, 4610–4618. [Google Scholar] [CrossRef]
  22. Zhang, G.Q.; Cai, L.; Zhang, Y.F.; Wei, Y. Bi5+, Bi(3-x)+, and oxygen vacancy induced BiOClxI1-x solid solution toward promoting visible-light driven photocatalytic activity. Chem. Eur. J. 2018, 24, 7434–7444. [Google Scholar] [CrossRef]
  23. Li, H.; Shang, H.; Cao, X.M.; Yang, Z.P.; Ai, Z.H.; Zhang, L. Oxygen vacancies mediated complete visible light NO oxidation via side-on bridging superoxide radicals. Environ. Sci. Technol. 2018, 52, 8659–8665. [Google Scholar] [CrossRef]
  24. Xiao, X.; Tu, S.H.; Lu, M.L.; Zhong, H.; Zheng, C.X.; Zuo, X.X.; Nan, J.M. Discussion on the reaction mechanism of the photocatalytic degradation of organic contaminants from a viewpoint of semiconductor photo-induced electrocatalysis. Appl. Catal. B Environ. 2016, 198, 124–132. [Google Scholar] [CrossRef]
  25. Guo, Y.; Shi, W.X.; Zhu, Y.F.; Xu, Y.P.; Cui, F.Y. Enhanced photoactivity and oxidizing ability simultaneously via internal electric field and valence band position by crystal structure of bismuth oxyiodide. Appl. Catal. B Environ. 2020, 262, 118262. [Google Scholar] [CrossRef]
  26. Zhu, Y.; Zhu, R.; Xi, Y.; Zhu, J.; Zhu, G.; He, H. Strategies for enhancing the heterogeneous Fenton catalytic reactivity: A review. Appl. Catal. B Environ. 2019, 255, 117739. [Google Scholar] [CrossRef]
Figure 1. Crystal structures of (a) BiOCl, (b) BiOCl-Vo, and (c) Fe-BiOCl-Vo.
Catalysts 13 00947 g001
Figure 2. (a) XRD patterns of different samples and a partially enlarged region of (b) 10.5–13°, and (c) 32–35°. High-resolution XPS spectra of (d) Bi 4f, (e) O 1s of different samples, and (f) Fe 2p of Fe-BiOCl-Vo. (g) EPR spectra comparison of different samples.
Catalysts 13 00947 g002
Figure 3. (a) SEM, (b) TEM, (c) and (d) HRTEM images of BiOCl nanosheets. (e) SEM, (f) TEM, (g) HRTEM, and (h) lateral HRTEM images of BiOCl-Vo nanosheets. (i) SEM, (j) TEM, (k) lateral HRTEM, (l) HRTEM, (m) bright-field TEM, (n) corresponding enlarged TEM and elemental mapping images of Fe-BiOCl-Vo.
Catalysts 13 00947 g003
Figure 4. (a) UV–vis DRS spectra, (b) plots of (αhν)1/2 versus photon energy of different samples, and (c) band structure illustration of different samples.
Catalysts 13 00947 g004
Figure 5. (a) EIS spectra, and (b) photocurrent signals of different samples.
Catalysts 13 00947 g005
Figure 6. Photocatalytic performances of phenol over different samples under (a) full spectra and (b) visible light. Photocatalytic-Fenton performances of Fe-BiOCl-Vo nanosheets (c) by adding different concentrations of H2O2 (pH = 6.6, 20 mg of photocatalysts, 10 mg/L of phenol solution), (d) at different pH value (2.58 mmol/L of H2O2, 20 mg of photocatalysts, 10 mg/L of phenol solution), (e) at different concentration of phenol solution (pH = 6.6, 2.58 mmol/L of H2O2, 20 mg of photocatalysts), (f) at different amount of Fe-BiOCl-Vo nanosheets (pH = 6.6, 2.58 mmol/L of H2O2, 10 mg/L of phenol solution). (g) Comparison of Fe-BiOCl-Vo nanosheets under different processes, (h) comparison of TOC removal over Fe-BiOCl-Vo nanosheets under photocatalysis and photocatalysis-Fenton, (i) Photocatalytic-Fenton recycling of Fe-BiOCl-Vo nanosheets.
Catalysts 13 00947 g006
Figure 7. (a) Scavenger tests, (b) DMPO-●O2, (c) DMPO-●OH EPR spectra of Fe-BiOCl-Vo nanosheets. Schematic illustration of phenol degradation over (d) BiOCl nanosheets through the photocatalytic process, (e) Fe-BiOCl-Vo nanosheets through photocatalytic and photocatalytic-Fenton process.
Catalysts 13 00947 g007
Disclaimer/Publisher’s Note: The statements, opinions and data contained in all publications are solely those of the individual author(s) and contributor(s) and not of MDPI and/or the editor(s). MDPI and/or the editor(s) disclaim responsibility for any injury to people or property resulting from any ideas, methods, instructions or products referred to in the content.

