Abstract
The synthesis of CaCO3/Cu2O/GO nanocomposites was developed by sol-gel auto-combustion method. The analysis of structure was completed on X-ray diffraction (XRD), Fourier transform infrared spectroscopy (FTIR), Raman spectroscopy, and environmental scanning electron microscopy (ESEM). The XRD spectra of the nanocomposites matched the crystal structure of CaCO3/Cu2O. The average crystal size was 20 nm for Cu2O and 25 nm for CaCO3 nanoparticles. FTIR data showed the absorption bands of Cu2O and GO. Raman spectroscopy data confirmed the formation of GO sheets. ESEM micrographs displayed spherical nanoparticles dispersed in GO sheets. X-ray photoelectron spectroscopy showed the peaks of Cu 2p, O 1s, C 1s, Cu 3s, and Ca 2p. The spectra of optical absorption revealed an absorption band of around 450 nm. The calcium content increase led to a decrease in the optical energy gap from 2.14 to 1.5 eV. The production of hydrogen from NaBH4 across the methanolysis reaction was accelerated by the CaCO3/Cu2O/GO nanocomposites. Therefore, these nanocomposites are superior in catalytic hydrogen production systems.
1. Introduction
Hydrogen has been recognized as a promising energy carrier due to its high energy content, renewability, and zero emission of pollutants when used [1]. Hydrogen can be produced from various sources such as water, natural gas, coal, and biomass, and the production technology is becoming increasingly mature and diverse. Among these sources, water is considered to be the most promising because it is abundant and carbon-free. The electrolysis of water is one of the most common methods for the production of hydrogen, and it involves the use of electricity to split water into hydrogen and oxygen [2]. However, the traditional electrolysis process suffers from low energy efficiency and high production costs, which limit its large-scale application. Therefore, there is still a great need to develop new and efficient methods for hydrogen production to meet the increasing energy demand and promote sustainable development [3]. Catalytic hydrogen production is a key area of research in the utilization of renewable energy sources. This process involves the use of a catalyst to facilitate the production of hydrogen gas through the splitting of water molecules into hydrogen and oxygen. Hydrogen is an important fuel source due to its abundance and potential as a clean energy carrier. However, current methods of hydrogen production rely heavily on non-renewable sources such as fossil fuels or inefficient electrolysis processes [4]. The development of efficient and inexpensive catalysts for hydrogen production is therefore critical to realizing a sustainable, low-carbon future. In recent years, significant progress has been made in the development of novel catalysts for hydrogen production, and this research continues to be an important topic of investigation for scientists and engineers alike [5].
Nanometal oxides are a class of materials that have received considerable attention in recent years due to their unique physicochemical properties and potential applications [6,7,8]. These materials consist of metal cations such as iron, zinc, and titanium, which are bonded to oxygen anions in a crystalline lattice structure. The small size of these particles, typically in the range of 1–100 nanometers, results in a high surface area-to-volume ratio, which enhances their reactivity and alters their electronic and magnetic properties [9]. Nanometal oxides have been found to exhibit improved catalytic activity [10], increased adsorption and magnetic properties [11], and enhanced electrical conductivity compared to their bulk counterparts [12]. These properties make them attractive for various applications, including catalysis, energy storage [13], sensors [11], biomedical imaging, and environmental remediation [14]. However, research on the synthesis, characterization, and application of nanometal oxides is still in its early stages, and much work remains to be performed to fully understand their behavior and potential.
Copper oxides (Cu2O) are semiconductor nanomaterials with a cubic crystal structure that exhibit unique electrical, optical, and catalytic properties [15]. The synthesis of nano-Cu2O has become increasingly important due to its potential applications in energy conversion, environmental remediation, and sensing technologies [16]. Moreover, Cu2O has a bandgap energy of 2.17 eV, which makes it an ideal material for optoelectronics, including photovoltaic and catalytic applications [17]. Its unique electrical properties, such as the ability to transport both electrons and holes [18], provide a basis for using it in various sensing and catalytic processes. In addition, Cu2O also exhibits excellent thermal stability, chemical resistance, and mechanical robustness, making it suitable for use in harsh or corrosive environments [19]. Cu2O has a wide range of potential applications in the fields of energy, environment, and biotechnology. These applications include the development of solar cells, catalysts, sensors, and catalytic materials for pollutant removal and hydrogen production. Additionally, Cu2O has shown promising results in the field of biomedical technology, particularly for use in drug delivery and imaging. Cu2O is a promising nanomaterial with unique electrical, optical, and catalytic properties that have attracted much attention in recent years. Its potential applications in various fields make it a promising candidate for future research and development. Understanding its properties, structure, and synthesis is critical in advancing the field of nanomaterials and unlocking its full potential [20].
Catalytic hydrogenation is an essential reaction in many chemical and industrial processes such as fuel production, pharmaceutical synthesis, and fine chemical manufacturing [21]. There are several benefits to producing H2 catalytically from NaBH4 solutions: H2 can be produced even at low temperatures, NaBH4 solutions are nonflammable, the reaction products are ecologically benign, and the rate of H2 production is readily regulated. Moreover, the dehydrogenation of sodium borohydride (NaBH4) specifically has become a popular method for hydrogen generation in fuel cells, as it is a safe, stable, and volumetrically promising storage medium for hydrogen [22]. Lower catalytic activity is resulted from the heterogeneous catalysts’ small surface areas since the surface area of a catalyst directly affects its activity. In order to boost the catalytic activity, metal nanoparticles with a large surface area are therefore promising. Metal oxides have emerged as excellent catalysts for NaBH4 hydrolysis, and their effectiveness depends on their structure and composition, crystallinity, and surface area. Indeed, these catalysts are less expensive than transition metal catalysts and can provide high catalytic activity. The reaction is usually carried out at higher temperatures to maximize the yield of hydrogen gas [23].
There are several catalysts that can be used to enhance the rate of hydrogen release from sodium borohydride, including metal oxide catalysts such as Fe2O3 [24], NiO [25], and Co3O4 [26]. These studies suggest that high surface area and small particle size of the metal oxides can enhance the reaction rate and hydrogen production yield. Moreover, Komal N. et al. [27] have reported the hydrogen production efficiency of NaBH4 reduction in FeCuCo oxide catalyst, created through a combustion synthesis method. Their studies demonstrated that a high activity toward hydrogen generation, which had the best performance, generated hydrogen at a rate of 1380 mL/min/g.
Physical vapor deposition, ball milling, laser ablation, and electron beam evaporation are examples of physical synthesis techniques for nanomaterials, although these techniques need expensive infrastructure and equipment [28]. One of the oldest ways of crystal formation, the sol-gel process, is characterized as a wet-chemical approach that is widely employed in the domains of materials science and engineering. The sol-gel technique is a low-cost technology with strong control over the chemical composition of the products due to the low reaction temperature. It is a common and practical way for creating nanoparticles with various chemical compositions. The excellent product purity, narrow particle size distribution, and creation of homogeneous nanostructure at low temperatures are the key benefits of the sol-gel technique [29]. The concepts of employing the sol-gel process succeeded in producing highly dispersed powders of oxide nanomaterials. During the combustion process, the organic materials in the gel burn and generate heat, which causes the metal ions to reduce to their metallic form and nucleate to form nanoparticles. This method is highly versatile and can be used to prepare a wide range of nanomaterials, including metal oxides, ceramics, and composites. The gel’s drying conditions may be controlled to provide nanosized porosity and a large surface area [30]. Industrial catalysts of all kinds are inserted into the pores of nanoporous materials, and as a result of these materials’ extremely highly active surface areas, the catalytic efficiency of these materials rises, and the price of the end product reduces [31]. To the best of our knowledge, no research work was detected for the preparation and application of CaCO3/Cu2O/GO nanocomposites for catalytic hydrogen evolution.
Based on the above, the present work considers the synthesis of CaCO3/Cu2O/GO nanocomposites by sol-gel auto-combustion method. The microstructure analysis of the synthesized samples was investigated on XRD, FTIR, and ESEM techniques. The surface area BET of the nanocomposites was acquired on a surface area and pore size analyzer. The optical absorption spectroscopy was studied in the UV–Vis wavelength range. Finally, the role of nanocomposites as a catalyst for hydrogen evolution from the reaction of methanol–NaBH4 was developed at 293 K.
2. Results and Discussion
X-ray diffraction was carried out after sample preparation to gain proof that the nanoparticles generated are originally combined of CaCO3/Cu2O/GO nanoparticles with different doping ratios (0.0, 15.0, and 30.0% of calcium carbonate). XRD patterns of Cu2O sample with and without loaded Ca are presented in Figure 1. In Figure 1, for Cu2O, the obtained diffraction pattern clearly matches the copper oxide (Cu2O) characteristic. The peaks appear at 2θ = 29.6°, 36.4°, 43.2°, 50.3°, 61.4°, and 74°, representing Cu2O (JCPDS 78-2076), and its planes are corresponding to (110), (111), (200), (211), (220), and (311), respectively [32].
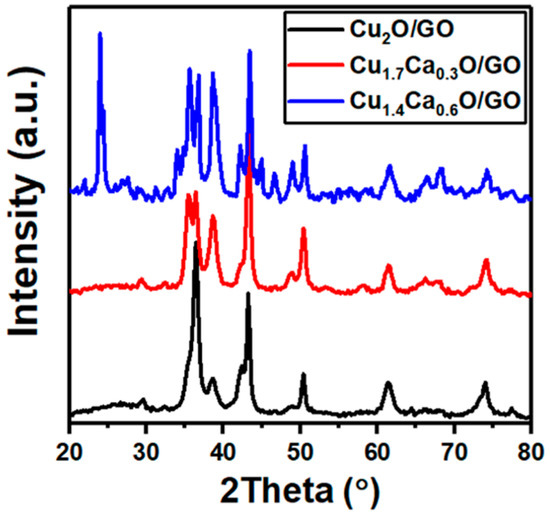
Figure 1.
XRD pattern of Cu2O/GO and a different concentration of Cu2CaO/GO.
In addition, the samples Cu1.7Ca0.3O and Cu1.4Ca0.6O had additional peaks observed at 2θ = 35.6°, 46.6°, and 48.8°, corresponding to (110), (202), and (018) crystallographic planes of CaCO3, respectively [33]. Only one additional peak was detected in a sample containing a higher Ca concentration at 2θ = 23.9°, which corresponded to (012) and was assigned to crystallographic planes of rhombohedral calcite, CaCO3 [30]. From these outcomes, it can be inferred that the CaCO3 nanoparticles coated the surface of Cu2O and were supported on a GO nanosheet.
The Debye–Scherrer equation was used to determine the crystallite size diameter (D) for all samples [34,35,36]:
where FWHM (full-width at half-maximum or half-width) is expressed in radians, is the X-ray wavelength (1.5406 Å), is the location of the diffraction peak at maximum, and is referred to as the shape factor, and it typically takes a value of 0.9. All Cu2O samples were found to have an average crystallite size of about 20 nm, while the crystal size of CaCO3 was 25 nm. This confirms the formation of a CaCO3 layer on the surface of Cu2O nanoparticles.
Fourier transform infrared spectroscopy (FTIR) was used to characterize the functional composition of all samples. Figure 2 shows the FTIR spectra of the pure Cu2O and different concentrations of Cu2CaO in the range of 500 cm−1 to 4000 cm−1. All the samples displayed similar peaks in the range 500 cm−1 to 1000 cm−1, namely 486 cm−1 and 611 cm−1. These two bands are attributed to the stretching vibration between copper and oxygen in the Cu2O phase, and similar results were reported in ref. [37,38,39].
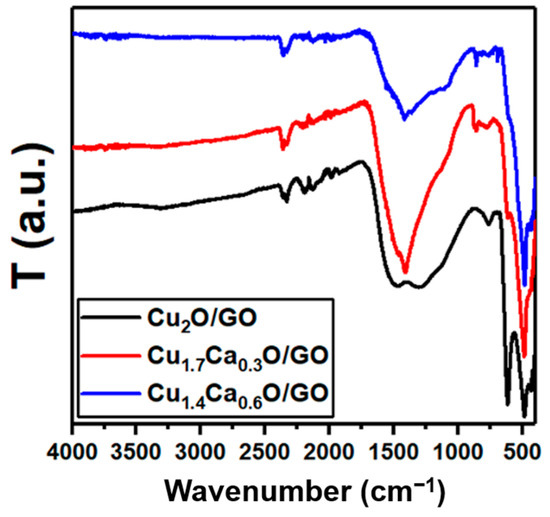
Figure 2.
FTIR spectra of Cu2O/GO and different concentrations of Cu2CaO/GO.
Moreover, intense bands were detected in all samples in the range between 1000 cm−1 and 1600 cm−1, in particular, at 1292, 1467 cm−1 for Cu2O and ~1415 cm−1 for samples containing Ca. These bands were not reported previously in the standard FTIR spectrum of Cu2O. Therefore, these peaks might originate from the formation of graphite oxides that were produced from gelatin combustion during the chemical processing—similar results were reported by Chao Xu et al. [40]. The vibration bands of carbonate anions were depicted by the stretching vibration of C–O at 1361 cm−1 [41]. As can be seen, the peaks’ intensities reduced in a composite material containing Ca, as compared to the Cu2O sample. This can be explained by the fact that the concentration of the components of composite was lower than the pure samples. Another possible reason for the significant reduction in the intensity is that the graphene oxides converted to a reduced graphene oxide (RGO) [42].
Raman spectroscopy is a non-destructive analytical technique used to identify and characterize materials based on their molecular vibrations. Figure 3 shows the results from the Raman spectra of the Cu2−xCaxO/GO nanostructures. The infrared allowed mode Γ(2)15− (TO) for Cu2O belonged to the band seen at 622 cm−1 [43]. At 1300 cm−1, the D band of the GO was identified [44]. A shift to the lower wavenumber of 960 cm−1 was caused by the rise in calcium concentration (0.3–0.6). The GO sheets were therefore reduced, as described in the literature [45]. Carbonyl and carboxylic groups exhibit a C=O stretching vibration, which caused the strong band at 2030 cm−1 [46]. These results all support the reduction in GO, following the addition of calcium. Furthermore, the band detected at 2805 cm−1 belonged to the 2D band of the GO [47]. At 30% of calcium, the position of this band shifted to 2431 cm−1.
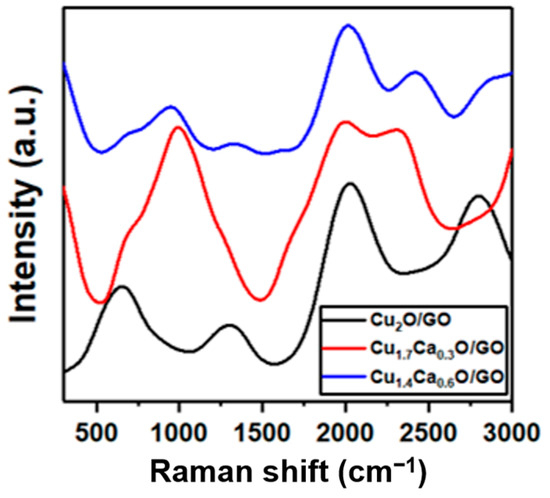
Figure 3.
Raman spectra analysis of the Cu2−xCaxO/GO nanostructures.
Figure 4a–c displays the ESEM micrographs of the CaCO3/Cu2O/GO nanocomposites. From these micrographs, nanosphere forms were dispersed into GO sheets for each sample. The GO sheets were reduced to thick layers as the ratio of Ca increased. The EDX data reported in Figure 4d reveal the compositional ratios of Cu, Ca, O, and C. The ratios of these elements agree with the nominal compositions.
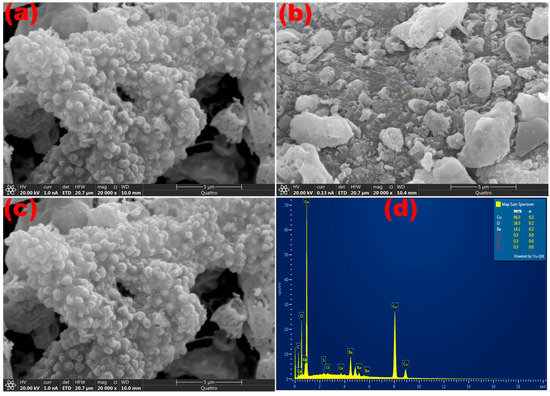
Figure 4.
Micrographs of ESEM for (a) Cu2O/GO, (b) Cu1.7Ca0.3O/GO, (c) Cu1.4Ca0.6O/GO, and (d) EDX scan of Cu1.7Ca0.3O/GO nanocomposites.
The TEM micrographs of Cu2O/GO, Cu1.7Ca0.3O/GO, and Cu1.4Ca0.6O/GO nanocomposites are displayed in Figure 5a–c. The nanoparticles of Cu2−xCaxO were supported on GO nanosheets. These results match well with the ESEM micrographs shown in Figure 4.
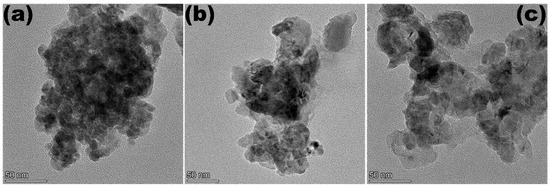
Figure 5.
TEM micrographs for (a) Cu2O/GO, (b) Cu1.7Ca0.3O/GO, and (c) Cu1.4Ca0.6O/GO nanocomposites.
XPS is widely used in various fields such as materials science, nanotechnology, and surface chemistry for the analysis of nanomaterials. The Cu2O/GO, Cu1.7Ca0.3O/GO, and Cu1.4Ca0.6O/GO samples’ wide-range XPS spectra are shown in Figure 6a and show Cu 2p, O 1s, C 1s, Cu 3s, and Ca 2p. The peak of C 1s at 287.08 eV is attributed to C=O, confirming the presence of GO in all samples. The fact that this peak moved to 289.08 at 30% of calcium shows that graphene oxide was converted to rGO [48]. The Auger Cu LMM triplet of Cu2O was detected at binding energies between 570 and 721 eV [49]. The presence of Ca 2p was confirmed by the peak at 548.08 eV for the samples Cu1.7Ca0.3O/GO and Cu1.4Ca0.6O/GO [50]. b depicts the high-resolution Cu 2p spectra for all samples. The graph of the Cu2O/GO sample shows two peaks at 935.78 and 955.48 eV, which correspond to Cu 2p3/2 and Cu 2p1/2 of CuO [51]. Moreover, the position of these peaks shifted to lower binding energies with the increase in calcium ratios. The satellite peaks located at 943.88 and 968.32 eV correspond to Cu(II) species at the Cu2O surface [52]. Figure 6c shows the peaks of O 1s, which have binding energies of 532.08 and 535.08 eV. These peaks are assigned to dissociated oxygen species and OH groups [53].
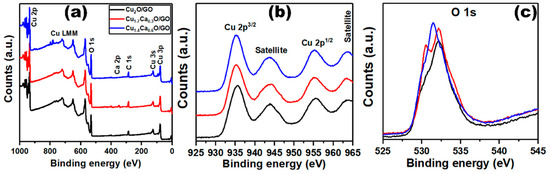
Figure 6.
Plots of (a) XPS survey spectra, (b) Cu 2p, and (c) O 1s for the Cu2−xCaxO/GO nanostructures.
The nitrogen isotherms completed at 77 K for CaCO3/Cu2O/GO nanocomposites were plotted in Figure 7. The nanocomposites that were synthesized exhibit a distinctive hysteresis loop of a type-IV isotherm. BET surface area values for Cu2O/GO, Cu1.7Ca0.3O/GO, and Cu1.4Ca0.6O/GO nanocomposites were 122, 162, and 180 m2/g, respectively. The surface area of the samples showed a large increase with the addition of calcium. Moreover, the nanocomposites of Cu2O/GO, Cu1.7Ca0.3O/GO, and Cu1.4Ca0.6O/GO had an average BJH pore size of 2.32, 2.32 and 2.15 nm. These pore sizes confirm the mesoporous structure of the samples that appear because of gaseous release during the combustion process.
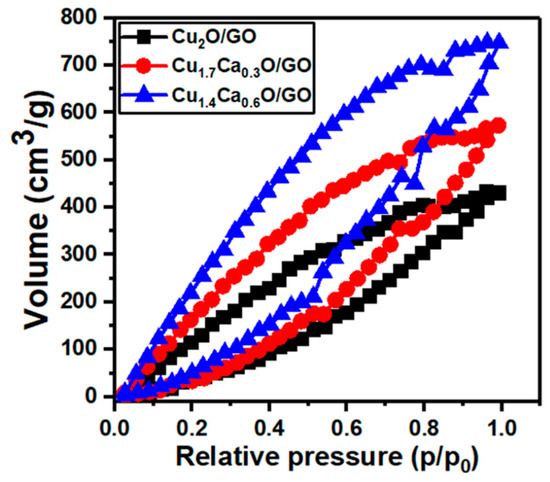
Figure 7.
Nitrogen isotherms of CaCO3/Cu2O/GO.
The absorption spectrum was used to examine the optical characteristics of Cu2−xCaxO/GO nanocomposites. The UV-Vis absorption spectra of Cu2−xCaxO/GO nanocomposites are represented in Figure 8a. The spectra of all samples displayed an absorption band of around 450 nm that is characteristic of Cu2O [38]. The broadening of this absorption band increases with the increase in calcium content.
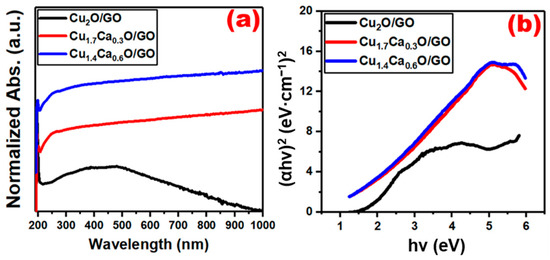
Figure 8.
Graphs of (a) normalized absorbance vs. wavelength and (b) (αhv)2 against hv for nanocomposites of Cu2O/GO, Cu1.7Ca0.3O/GO, and Cu1.4Ca0.6O/GO.
One of the most important elements of the electron structure of materials is the energy gap, which expresses the inter-band transitions [54]. We can consider the relationship between the absorption coefficient (αhv) and the photon energy (hv), which was formulated by Tauc [55,56,57], in the case of direct transitions to determine the optical energy gap (Eopt):
where B is a constant. Absorption coefficient calculations were performed and (αhv)2 vs. hv data were plotted in Figure 8b. To calculate the optical energy gap, the intersection of the straight lines with the x-axis was set at zero photon energy. The calculations presented different values for the energy gap for the samples Cu2O/GO, Cu1.7Ca0.3O/GO, and Cu1.4Ca0.6O/GO, which are 2.14, 1.81 and 1.50 eV. We can discern that increasing the rate of calcium in the composites led to a decrease in the energy gap, and this is related to defects in the structure and the formation of new levels in the forbidden band gap [58].
The composites of graphene and metal oxide provide distinctive surface and electronic properties that qualify them for use as a catalyst to activate hydrogen production. Meanwhile, the self-dissociation of sodium borohydride in methanol is a good mechanism for producing hydrogen. Therefore, NaBH4 spontaneously decomposes into Na+ and BH4− groups. This spontaneous dissociation was characterized by a low reaction temperature and high stability when compared to the dissociation of NaBH4 in water. Based on all the above, nanomaterials that have distinctive surface properties are expected to contribute to the acceleration of hydrogen production [59,60]. Therefore, the prepared Cu2−xCaxO/GO nanocomposites were employed to catalyze hydrogen production from the methanolysis reaction of NaBH4. In this context, 0.02 g of Cu2−xCaxO/GO powder was mixed with 0.25 g of NaBH4 and 10 mm of methanol was quickly added. The hydrogen volumes were recorded against time and the data are presented in Figure 9. The results indicate that the nanocomposites participated effectively in accelerating the production of hydrogen by achieving short times.
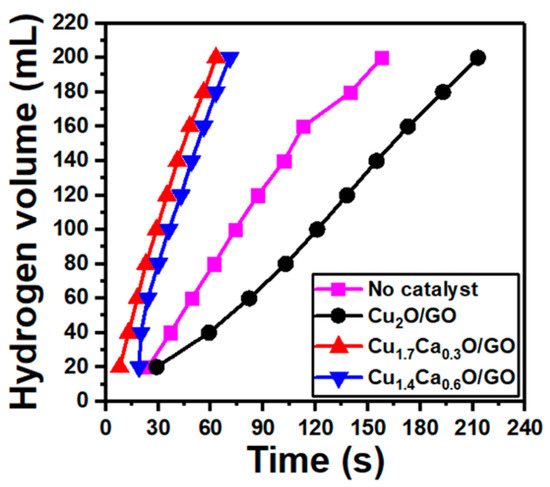
Figure 9.
Hydrogen volume vs. time of Cu2O/GO, Cu1.7Ca0.3O/GO, and Cu1.4Ca0.6O/GO nanocomposites.
The explanation for the activation of hydrogen production is based on the decomposition of sodium borohydride into Na+ and BH4−, followed by the adsorption of BH4− on the surface of the nanocomposites [61]. It is expected that nanocomposites with large surface areas and high porosity will adsorb more BH4− ions. Moreover, electrostatic contact between the positively charged functional groups on the hybrid catalyst surface and the negatively charged species in solution might increase the catalytic activity of the methanolysis process [62,63]. The current study supported this interpretation, as the increase in calcium increased the surface area and contributed to the activation of hydrogen production.
To expand on understanding the behavior of the catalyst in the production of hydrogen, we will address the production rate (r). The production rate varies according to the volume of hydrogen (V), the mass of the catalyst (mcat), and the time (t), as shown in the following equation [64,65,66]:
Production rate calculations were carried out according to the slope of the hydrogen volume–time relationship curves presented in Figure 6. The calculations showed that the rate of calcium increase in the nanocomposites contributed to the increase in the hydrogen production rate from 3055 to 9809 mL/g·min. Figure 10 shows the corresponding production rate values for the different samples. It is evident that increasing the calcium content to 0.6 wt% led to doubling the production by about three times.
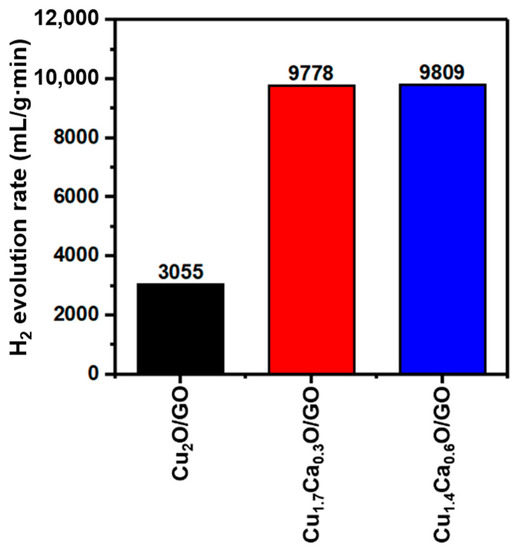
Figure 10.
H2 evolution rates for Cu2O/GO and different concentrations of Cu2CaO/GO.
Figure 10 shows that sample Cu1.4Ca0.6O/GO is the best in hydrogen production rate and sample Cu1.7Ca0.3O/GO approaches this value. The reasons that explain this increase in production rates are the large surface area that allows the adsorption of large amounts of BH4− and thus the doubling of the amount of hydrogen. Previously, several studies were conducted to test the efficiency of different catalysts for producing hydrogen from NaBH4. However, the research is still ongoing for catalysts that are characterized by cheap costs and an ease of preparation that contribute to enhancing hydrogen production. Our current study provides a good alternative to these catalysts because it succeeded in preparing distinctive Cu2−xCaxO/GO nanocomposites. Moreover, the prepared Cu1.7Ca0.3O/GO sample achieved production rates of 9809 mL/g·min, which is higher than that of Ru5Co/C (9360 mL/g·min) [67], Ru/NiO-Ni foam (6000 mL/g·min) [68], Ni2P (3700 mL/g·min) [69], CuO/Co3O4/Cu (6162 mL/g·min) [70], Co-Cu-Ni (5100 mL/g·min) [71] Co-W-P-Cu (5000 mL/g·min) [72], CuCo2O (1370 mL/g·min) [73], CuO@C (7240 mL/g·min) [74], and rGO-IL-CuO (150 mL/g·min) [75], as listed in Table 1. As a result, we aspire that the nanocomposites prepared in the current study will play a great role as catalysts in hydrogen production systems.

Table 1.
A comparison of catalysts for hydrogen evolution through dehydrogenation of NaBH4.
The Cu2−xCaxO/GO recyclability was tested in order to determine whether these materials could be reused. Figure 11 shows the reusability data measured at four cycles. Accordingly, Cu2−xCaxO/GO catalytic performance is nearly steady after four cycles.
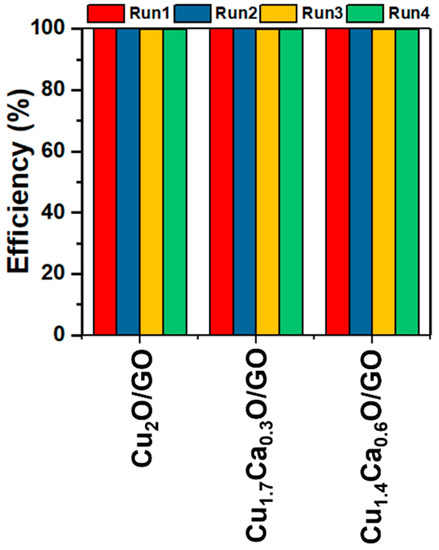
Figure 11.
The recyclability test for the Cu2−xCaxO/GO nanostructures.
3. Experimental Procedure
The chemicals employed in this research were all of analytical grades. Cu(NO3)3·3H2O (99%), Ca(NO3)·4H2O (99%), and gelatin were obtained from LOBA CHEMI, Mumbai, India.
The sol-gel procedure was employed to prepare CaCO3/Cu2O/GO nanocomposites. Metal nitrates were considered in stoichiometric ratios and were dissolved in distilled water. The mass of gelatin is equal to 50% of the total mass of metal nitrates. The solution of gelatin was mixed with metal nitrate solutions at 80 °C for 2 h. The samples were transferred into a pre-operated electric oven at 250 °C. This procedure continued for 4 h. The combustion process was initiated with an evaporation of water contents and then gases were released. Finally, the product was ground and stored for experimental measurements.
Phase analysis, which identifies the phase type, phase composition, crystallite size, and orientation, were among the data collected for qualitative analysis. To examine a crystal structure in the material, X-ray diffraction (XRD) was established. The patterns of XRD for powder samples were collected form Shimadzu XRD 700 (Kyoto, Tapan) with Cukα wavelength. Diffraction patterns that were recorded include the additive contributions of several sample macro- and microstructural characteristics. PCXRD software was used to evaluate X-ray diffraction measurements. FTIR analysis was performed using an infrared spectrophotometer in the 400–4000 cm−1 range. A Shimadzu 100-FTIR tracer (Kyoto, Tapan) was used to conduct the ATR measurements. Attenuated total reflection (ATR)-FTIR spectroscopy was used to determine the structure of adsorbed/deposited molecular species at solid/air or solid/liquid interfaces. Moreover, this method facilitates sample characterization at the IR mode of transmission. A SENTERRA II Bruker compact Raman microscope (Billerica, MA, USA) was used for collecting the data of the Raman spectra for the produced nanostructures at a laser wavelength of 532 nm. With imaging and analysis capabilities equivalent to those of a standard high-vacuum SEM, the environmental scanning electron microscope (ESEM) offers electron imaging at a relatively high sample pressure. Under the pressure-limiting aperture, in the region bounded by the sample, the detector, the aperture grid, and backscattered and multiple-backscattered electrons were detected. Therefore, hydrated, insulating materials can be identified with ESEM technique. Quatro environmental scanning electron microscope (ESEM, Waltham, MA, USA) was used to conduct a microstructural analysis of nanocomposites. The prepared samples were coated with a layer of gold with a thickness of 5 nm. The produced nanocomposites were characterized using a Thermo Fisher Talos F200i TEM/STEM electron microscope (Waltham, MA, USA). Thermo Scientific K-alpha XPS spectrometer, Thermo Fisher Scientific (Waltham, MA, USA) was used to analyze the X-ray photoelectron spectroscopy (XPS) data of the catalysts. The characterization of micro-, meso-, and macroporous materials is important for optimization and quality control of porous substrates used in many technological areas. Nitrogen isotherm loops were collected using the NOVA 4200e surface area and pore size analyzer, Quantachrome (Boynton Beach, FL, USA). The samples were degassed at 150 °C and retained a pressure of 10−3 mm Hg within 24 h prior to measuring the adsorption isotherms. UV-visible absorption spectra of CaCO3/Cu2O/GO samples were recorded using Thermo Scientific Evo 201 spectrophotometer (Waltham, MA, USA). This spectrophotometer operated with a xenon flash lamp that requires no warm-up time, allowing instant measurements. The samples were dispersed in ethanol to form suspension. Moreover, all the measurements of UV-Vis spectroscopy were conducted at room temperature.
In the current work, experimental laboratory tests were used to investigate the hydrogen generation from the sodium borohydride (NaBH4). Catalytic activity of CaCO3/Cu2O/GO was evaluated in terms of hydrogen evolution from methanolysis of NaBH4. An amount of 20 mg of catalyst powder was mixed with 25 mg of NaBH4 powder. The mixture was inserted into a glass reactor and 10 mL of methanol was added immediately. The hydrogen volume was determined by a water displacement procedure. All the catalytic tests were completed at 293 K. The experimental error was estimated to be ±0.01%. Finally, the Cu2−xCaxO/GO recyclability was tested for 4.0 cycles. After each cycle, the sample was washed many times with methanol and dried in an electric oven at 50 °C. In this context, the mass of the catalyst was optimized every cycle.
4. Conclusions
The method of sol-gel auto-combustion successfully led to the development of high quality CaCO3/Cu2O/GO nanocomposites. The obtained XRD diffraction pattern clearly matches the copper oxide (Cu2O) crystal structure. The spectra of FTIR showed the vibrational modes of Cu2O and GO sheets. Raman spectroscopy analysis confirmed the formation of CaCO3/Cu2O/GO nanocomposites. ESEM and TEM micrographs of the CaCO3/Cu2O/GO nanocomposites revealed that nanoparticles were dispersed into GO sheets for each sample. XPS analysis revealed the peaks of Cu 2p, Ca 2p, C 1s, and O 1s. BET surface area values for Cu2O/GO, Cu1.7Ca0.3O/GO, and Cu1.4Ca0.6O/GO nanocomposites were 122, 162, and 180 m2/g, respectively. The energy gap for the samples Cu2O/GO, Cu1.7Ca0.3O/GO, and Cu1.4Ca0.6O/GO were 2.14, 1.81, and 1.50 eV, respectively. The production rate of hydrogen from the catalyst Cu1.4Ca0.6O/GO was 9809 mL/g·min. All the data obtained via analysis showed that at 0.6 wt% of calcium, the nanocomposite has the highest surface area and thus possesses a high evolution rate of hydrogen. According to these findings, we believe that the prepared nanocomposites are superior as hydrogen catalysts in the methanolysis of NaBH4.
Author Contributions
M.A.: Experimental work, funding acquisition and formal analysis; S.A.: Writing the original draft; K.A.: Experimental work and investigation; T.A.: Writing the original draft; T.A.: Experimental work; T.A.M.T.: Supervisions, experimental work, investigation, reviewing and editing the original draft; A.H.A.: Supervisions; A.I.: Supervisions. All authors have read and agreed to the published version of the manuscript.
Funding
The authors extend their appreciation to the Deputyship for Research and Innovation, Ministry of Education in Saudi Arabia for funding this research work through the project number 223202.
Data Availability Statement
Data will be made available upon reasonable request.
Acknowledgments
The authors are grateful to the central laboratory at Jouf University for the advanced characterization techniques that were used in this study.
Conflicts of Interest
The authors declare that they have no known competing financial interests or personal relationships that could have influenced the work reported in this paper.
References
- Hosseini, S.E.; Wahid, M.A. Hydrogen production from renewable and sustainable energy resources: Promising green energy carrier for clean development. Renew. Sustain. Energy Rev. 2016, 57, 850–866. [Google Scholar] [CrossRef]
- Xia, C.; Joo, S.-W.; Hojjati-Najafabadi, A.; Xie, H.; Wu, Y.; Mashifana, T.; Vasseghian, Y. Latest advances in layered covalent organic frameworks for water and wastewater treatment. Chemosphere 2023, 329, 138580. [Google Scholar] [CrossRef] [PubMed]
- Barreto, L.; Makihira, A.; Riahi, K. The hydrogen economy in the 21st century: A sustainable development scenario. Int. J. Hydrog. Energy 2003, 28, 267–284. [Google Scholar] [CrossRef]
- Armaroli, N.; Balzani, V. The hydrogen issue. ChemSusChem 2011, 4, 21–36. [Google Scholar] [CrossRef] [PubMed]
- Jing, D.; Guo, L.; Zhao, L.; Zhang, X.; Liu, H.; Li, M.; Shen, S.; Liu, G.; Hu, X.; Zhang, X. Efficient solar hydrogen production by photocatalytic water splitting: From fundamental study to pilot demonstration. Int. J. Hydrog. Energy 2010, 35, 7087–7097. [Google Scholar] [CrossRef]
- Navya, P.N.; Daima, H.K. Rational engineering of physicochemical properties of nanomaterials for biomedical applications with nanotoxicological perspectives. Nano Converg. 2016, 3, 1. [Google Scholar] [CrossRef]
- Baladi, E.; Davar, F.; Hojjati-Najafabadi, A. Synthesis and characterization of g-C3N4-CoFe2O4-ZnO magnetic nanocomposites for enhancing photocatalytic activity with visible light for degradation of penicillin G antibiotic. Environ. Res. 2022, 215, 114270. [Google Scholar] [CrossRef]
- Mansoorianfar, M.; Nabipour, H.; Pahlevani, F.; Zhao, Y.; Hussain, Z.; Hojjati-Najafabadi, A.; Hoang, H.Y.; Pei, R. Recent progress on adsorption of cadmium ions from water systems using metal-organic frameworks (MOFs) as an efficient class of porous materials. Environ. Res. 2022, 214, 114113. [Google Scholar] [CrossRef]
- Asha, A.B.; Narain, R. Nanomaterials properties. In Polymer Science and Nanotechnology; Elsevier: Amsterdam, The Netherlands, 2020; pp. 343–359. [Google Scholar]
- Haridas, D.; Gupta, V.; Sreenivas, K. Enhanced catalytic activity of nanoscale platinum islands loaded onto SnO2 thin film for sensitive LPG gas sensors. Bull. Mater. Sci. 2008, 31, 397–400. [Google Scholar] [CrossRef]
- Chavali, M.S.; Nikolova, M.P. Metal oxide nanoparticles and their applications in nanotechnology. SN Appl. Sci. 2019, 1, 607. [Google Scholar] [CrossRef]
- Comini, E. Metal oxide nano-crystals for gas sensing. Anal. Chim. Acta 2006, 568, 28–40. [Google Scholar] [CrossRef]
- Wu, Z.-S.; Zhou, G.; Yin, L.-C.; Ren, W.; Li, F.; Cheng, H.-M. Graphene/metal oxide composite electrode materials for energy storage. Nano Energy 2011, 1, 107–131. [Google Scholar] [CrossRef]
- Mondal, K.; Sharma, A. Recent advances in the synthesis and application of photocatalytic metal–metal oxide core–shell nanoparticles for environmental remediation and their recycling process. RSC Adv. 2016, 6, 83589–83612. [Google Scholar] [CrossRef]
- Singh, J.; Kaur, G.; Rawat, M. A brief review on synthesis and characterization of copper oxide nanoparticles and its applications. J. Bioelectron. Nanotechnol. 2016, 1, 9. [Google Scholar]
- Danish, M.S.S.; Estrella, L.L.; Alemaida, I.M.A.; Lisin, A.; Moiseev, N.; Ahmadi, M.; Nazari, M.; Wali, M.; Zaheb, H.; Senjyu, T. Photocatalytic Applications of Metal Oxides for Sustainable Environmental Remediation. Metals 2021, 11, 80. [Google Scholar] [CrossRef]
- Lu, C.; Qi, L.; Yang, J.; Wang, X.; Zhang, D.; Xie, J.; Ma, J. One-Pot Synthesis of Octahedral Cu2O Nanocages via a Catalytic Solution Route. Adv. Mater. 2005, 17, 2562–2567. [Google Scholar] [CrossRef]
- Kale, A.J.; Chaurasiya, R.; Dixit, A. Inorganic lead-Free Cs2AuBiCl6 perovskite absorber and Cu2O hole transport material based single-junction solar cells with 22.18% power conversion efficiency. Adv. Theory Simul. 2021, 4, 2000224. [Google Scholar] [CrossRef]
- Luo, Z.; Fu, L.; Zhu, J.; Yang, W.; Li, D.; Zhou, L. Cu2O as a promising cathode with high specific capacity for thermal battery. J. Power Sources 2019, 448, 227569. [Google Scholar] [CrossRef]
- Rai, B. Cu2O solar cells: A review. Sol. Cells 1988, 25, 265–272. [Google Scholar] [CrossRef]
- Wang, W.; Wang, S.; Ma, X.; Gong, J. Recent advances in catalytic hydrogenation of carbon dioxide. Chem. Soc. Rev. 2011, 40, 3703–3727. [Google Scholar] [CrossRef] [PubMed]
- Hojjati-Najafabadi, A.; Aygun, A.; Tiri, R.N.E.; Gulbagca, F.; Lounissaa, M.I.; Feng, P.; Karimi, F.; Sen, F. Bacillus thuringiensis Based Ruthenium/Nickel Co-Doped Zinc as a Green Nanocatalyst: Enhanced Photocatalytic Activity, Mechanism, and Efficient H2 Production from Sodium Borohydride Methanolysis. Ind. Eng. Chem. Res. 2023, 62, 4655–4664. [Google Scholar] [CrossRef]
- Chen, W.; Ouyang, L.; Liu, J.; Yao, X.; Wang, H.; Liu, Z.; Zhu, M. Hydrolysis and regeneration of sodium borohydride (NaBH4)—A combination of hydrogen production and storage. J. Power Sources 2017, 359, 400–407. [Google Scholar] [CrossRef]
- Nabid, M.R.; Bide, Y.; Kamali, B. Hydrogen release from sodium borohydride by Fe2O3@nitrogen-doped carbon core-shell nanosheets as reasonable heterogeneous catalyst. Int. J. Hydrog. Energy 2019, 44, 25662–25670. [Google Scholar] [CrossRef]
- Tamboli, A.H.; Chaugule, A.A.; Sheikh, F.A.; Chung, W.-J.; Kim, H. Synthesis and application of CeO2-NiO loaded TiO2 nanofiber as novel catalyst for hydrogen production from sodium borohydride hydrolysis. Energy 2015, 89, 568–575. [Google Scholar] [CrossRef]
- Ugale, A.D.; Ghodke, N.P.; Kang, G.-S.; Nam, K.-B.; Bhoraskar, S.V.; Mathe, V.L.; Yoo, J.B. Cost-effective synthesis of carbon loaded Co3O4 for controlled hydrogen generation via NaBH4 hydrolysis. Int. J. Hydrog. Energy 2021, 47, 16–29. [Google Scholar] [CrossRef]
- Patil, K.N.; Prasad, D.; Bhagyashree; Manoorkar, V.K.; Nabgan, W.; Nagaraja, B.M.; Jadhav, A.H. Engineered nano-foam of tri-metallic (FeCuCo) oxide catalyst for enhanced hydrogen generation via NaBH4 hydrolysis. Chemosphere 2021, 281, 130988. [Google Scholar] [CrossRef]
- Jamkhande, P.G.; Ghule, N.W.; Bamer, A.H.; Kalaskar, M.G. Metal nanoparticles synthesis: An overview on methods of preparation, advantages and disadvantages, and applications. J. Drug Deliv. Sci. Technol. 2019, 53, 101174. [Google Scholar] [CrossRef]
- Kamanina, O.A.; Saverina, E.A.; Rybochkin, P.V.; Arlyapov, V.A.; Vereshchagin, A.N.; Ananikov, V.P. Preparation of Hybrid Sol-Gel Materials Based on Living Cells of Microorganisms and Their Application in Nanotechnology. Nanomaterials 2022, 12, 1086. [Google Scholar] [CrossRef] [PubMed]
- Vincze, T.; Micjan, M.; Pavuk, M.; Weis, M. Fabrication of cupric oxide-based transistors by a sol–gel technique using a binary solvent mixture. J. Mater. Sci. Mater. Electron. 2022, 33, 7701–7707. [Google Scholar] [CrossRef]
- Rahman, M.A.; Islam, M.T.; Singh, M.J.; Hossain, I.; Rmili, H.; Samsuzzaman, M. Magnetic, dielectric and structural properties of CoxZn(0.90−x)Al0.10Fe2O4 synthesized by sol–gel method with application as flexible microwave substrates for microstrip patch antenna. J. Mater. Res. Technol. 2022, 16, 934–943. [Google Scholar] [CrossRef]
- Salavati-Niasari, M.; Davar, F. Synthesis of copper and copper(I) oxide nanoparticles by thermal decomposition of a new precursor. Mater. Lett. 2009, 63, 441–443. [Google Scholar] [CrossRef]
- Galván-Ruiz, M.; Hernández, J.; Baños, L.; Noriega-Montes, J.; Rodríguez-García, M.E. Characterization of Calcium Carbonate, Calcium Oxide, and Calcium Hydroxide as Starting Point to the Improvement of Lime for Their Use in Construction. J. Mater. Civ. Eng. 2009, 21, 694–698. [Google Scholar] [CrossRef]
- El-Sheikh, S.; El-Sherbiny, S.; Barhoum, A.; Deng, Y. Effects of cationic surfactant during the precipitation of calcium carbonate nano-particles on their size, morphology, and other characteristics. Colloids Surfaces A Physicochem. Eng. Asp. 2013, 422, 44–49. [Google Scholar] [CrossRef]
- Alshammari, A.H.; Alshammari, M.; Alhassan, S.; Alshammari, K.; Alotaibi, T.; Taha, T.A.M. MoO3/S@g-C3N4 Nanocomposite Structures: Synthesis, Characterization, and Hydrogen Catalytic Performance. Nanomaterials 2023, 13, 820. [Google Scholar] [CrossRef]
- Abdullah, M.; Ansari, M.Z.; Ahamd, Z.; John, P.; Manzoor, S.; Shawky, A.M.; Hegazy, H.; Chughtai, A.H.; Ashiq, M.N.; Taha, T. Ag2Se/SnTe nanorod as potential candidate for energy conversion system developed via hydrothermal route. Ceram. Int. 2023, 49, 6780–6789. [Google Scholar] [CrossRef]
- Alshammari, A.H.; Alshammari, M.; Ibrahim, M.; Alshammari, K.; Taha, T.A.M. New Hybrid PVC/PVP Polymer Blend Modified with Er2O3 Nanoparticles for Optoelectronic Applications. Polymers 2023, 15, 684. [Google Scholar] [CrossRef] [PubMed]
- Fujimoto, K. FTIR spectroscopic study of CO2 adsorption/desorption on MgO/CaO catalysts. J. Phys. Chem. 1992, 9038, 9035–9038. [Google Scholar]
- Draou, K.; Bellakhal, N.; Chéron, B.; Brisset, J. Heat transfer to metals in low pressure oxygen plasma: Application to oxidation of the 90Cu–10Zn alloy. Mater. Chem. Phys. 1999, 58, 212–220. [Google Scholar] [CrossRef]
- Li, B.; Li, Y.; Zhao, Y.; Sun, L. Shape-controlled synthesis of Cu2O nano/microcrystals and their antibacterial activity. J. Phys. Chem. Solids 2013, 74, 1842–1847. [Google Scholar] [CrossRef]
- Sahoo, P.; Ishihara, S.; Yamada, K.; Deguchi, K.; Ohki, S.; Tansho, M.; Shimizu, T.; Eisaku, N.; Sasai, R.; Labuta, J.; et al. Rapid Exchange between Atmospheric CO2 and Carbonate Anion Intercalated within Magnesium Rich Layered Double Hydroxide. ACS Appl. Mater. Interfaces 2014, 6, 18352–18359. [Google Scholar] [CrossRef]
- Xu, C.; Wang, X.; Yang, L.; Wu, Y. Fabrication of a graphene–cuprous oxide composite. J. Solid State Chem. 2009, 182, 2486–2490. [Google Scholar] [CrossRef]
- Powell, D.; Compaan, A.; Macdonald, J.R.; Forman, R.A. Raman-scattering study of ion-implantation-produced damage in Cu2O. Phys. Rev. B 1975, 12, 20. [Google Scholar] [CrossRef]
- Claramunt, S.; Varea, A.; López-Díaz, D.; Velázquez, M.M.; Cornet, A.; Cirera, A. The Importance of Interbands on the Interpretation of the Raman Spectrum of Graphene Oxide. J. Phys. Chem. C 2015, 119, 10123–10129. [Google Scholar] [CrossRef]
- Muzyka, R.; Drewniak, S.; Pustelny, T.; Chrubasik, M.; Gryglewicz, G. Characterization of Graphite Oxide and Reduced Graphene Oxide Obtained from Different Graphite Precursors and Oxidized by Different Methods Using Raman Spectroscopy. Materials 2018, 11, 1050. [Google Scholar] [CrossRef] [PubMed]
- Rajasekar, P.; Rao, G.; Kumar, A.S.; Prakash, J.; Rathinasabapathi, P.; Venkatasubbu, G.D. Interaction of BSA with graphene oxide: Influence on the bioactivity of graphene oxide. Diam. Relat. Mater. 2023, 132, 109629. [Google Scholar] [CrossRef]
- López-Díaz, D.; Delgado-Notario, J.A.; Clericò, V.; Diez, E.; Merchán, M.D.; Velázquez, M.M. Towards Understanding the Raman Spectrum of Graphene Oxide: The Effect of the Chemical Composition. Coatings 2020, 10, 524. [Google Scholar] [CrossRef]
- Kasturi, S.; Torati, S.R.; Eom, Y.J.; Ahmad, S.; Lee, B.J.; Yu, J.S.; Kim, C. Real-time monitored photocatalytic activity and electrochemical performance of an rGO/Pt nanocomposite synthesized via a green approach. RSC Adv. 2020, 10, 13722–13731. [Google Scholar] [CrossRef]
- Platzman, I.; Brener, R.; Haick, H.; Tannenbaum, R. Oxidation of Polycrystalline Copper Thin Films at Ambient Conditions. J. Phys. Chem. C 2008, 112, 1101–1108. [Google Scholar] [CrossRef]
- Ni, M.; Ratner, B.D. Differentiating calcium carbonate polymorphs by surface analysis techniques—An XPS and TOF-SIMS study. Surf. Interface Anal. 2008, 40, 1356–1361. [Google Scholar] [CrossRef]
- Bayat, F.; Sheibani, S. Enhancement of photocatalytic activity of CuO-Cu2O heterostructures through the controlled content of Cu2O. Mater. Res. Bull. 2022, 145, 111561. [Google Scholar] [CrossRef]
- Aguirre, M.E.; Zhou, R.; Eugene, A.J.; Guzman, M.I.; Grela, M.A. Cu2O/TiO2 heterostructures for CO2 reduction through a direct Z-scheme: Protecting Cu2O from photocorrosion. Appl. Catal. B Environ. 2017, 217, 485–493. [Google Scholar] [CrossRef]
- Saeed, H.; Ikram, M.; Haider, A.; Naz, S.; Ul-Hamid, A.; Nabgan, W.; Haider, J.; Ibrahim, S.; Ullah, H.; Khan, S. Efficient dye degradation in the presence of reducing agent and bactericidal behavior with in silico molecular docking of z-scheme P3HT/g-C3N4 doped CuO heterojunction. Surf. Interfaces 2023, 38, 102804. [Google Scholar] [CrossRef]
- Ma, T.; Chang, P.R.; Zheng, P.; Ma, X. The composites based on plasticized starch and graphene oxide/reduced graphene oxide. Carbohydr. Polym. 2013, 94, 63–70. [Google Scholar] [CrossRef]
- Yu, Y.; Zhang, L.; Wang, J.; Yang, Z.; Long, M.; Hu, N.; Zhang, Y. Preparation of hollow porous Cu2O microspheres and photocatalytic activity under visible light irradiation. Nanoscale Res. Lett. 2012, 7, 347. [Google Scholar] [CrossRef] [PubMed]
- Dar, S.A.; Sharma, R.; Srivastava, V.; Sakalle, U.K. Investigation on the electronic structure, optical, elastic, mechanical, thermodynamic and thermoelectric properties of wide band gap semiconductor double perovskite Ba2InTaO6. RSC Adv. 2019, 9, 9522–9532. [Google Scholar] [CrossRef] [PubMed]
- Alshammari, A.H.; Alshammari, K.; Alshammari, M.; Taha, T.A.M. Structural and Optical Characterization of g-C3N4 Nanosheet Integrated PVC/PVP Polymer Nanocomposites. Polymers 2023, 15, 871. [Google Scholar] [CrossRef] [PubMed]
- Ahmed, R.M.; Taha, T.A.; Ezz-Eldin, F.M. Investigation of Sm2O3 effect on opto-electrical parameters and dielectric properties of some fluorophosphate glasses. J. Mater. Sci. Mater. Electron. 2021, 32, 28919–28934. [Google Scholar] [CrossRef]
- Ahmed, R.M.; Atta, M.M.; Taha, E.O. Optical spectroscopy, thermal analysis, and dynamic mechanical properties of graphene nano-platelets reinforced polyvinylchloride. J. Mater. Sci. Mater. Electron. 2021, 32, 22699–22717. [Google Scholar] [CrossRef]
- Wang, X.; Gong, J.; Dong, Y.; An, S.; Zhang, X.; Tian, J. Energy band engineering of hydroxyethyl group grafted on the edge of 3D g-C3N4 nanotubes for enhanced photocatalytic H2 production. Mater. Today Phys. 2022, 27, 100806. [Google Scholar] [CrossRef]
- Cafer, S.A.K.A. Highly active hydrogen generation from sodium borohydride methanolysis and ethylene glycolysis reactions using protonated chitosan-zeolite hybrid metal-free particles. Appl. Catal. B Environ. 2023, 325, 122335. [Google Scholar]
- Saka, C. Metal-free hybrid composite particles with phosphorus and oxygen-doped graphitic carbon nitride dispersed on kaolin for catalytic activity toward efficient hydrogen release. Int. J. Hydrog. Energy 2023, 48, 13864–13876. [Google Scholar] [CrossRef]
- Saka, C.; Kaya, M.; Bekiroğullari, M. Spirulina Platensis microalgae strain modified with phosphoric acid as a novel support material for Co-B catalysts: Its application to hydrogen production. Int. J. Hydrog. Energy 2019, 45, 2872–2883. [Google Scholar] [CrossRef]
- Fernandes, V.; Pinto, A.; Rangel, C. Hydrogen production from sodium borohydride in methanol–water mixtures. Int. J. Hydrog. Energy 2010, 35, 9862–9868. [Google Scholar] [CrossRef]
- Alshammari, A.H.; Alshammari, K.; Alotaibi, T.; Alshammari, M.; Alhassan, S.; Taha, T.A.M. In Situ Polycondensation Synthesis of NiS-g-C3N4 Nanocomposites for Catalytic Hydrogen Generation from NaBH4. Nanomaterials 2023, 13, 938. [Google Scholar] [CrossRef]
- Saka, C. g-C3N4 particles with boron and oxygen dopants/carbon vacancies for efficient dehydrogenation in sodium borohydride methanolysis. Int. J. Hydrog. Energy 2022, 47, 19016–19026. [Google Scholar] [CrossRef]
- Wang, F.; Wang, Y.; Zhang, Y.; Luo, Y.; Zhu, H. Highly dispersed RuCo bimetallic nanoparticles supported on carbon black: Enhanced catalytic activity for hydrogen generation from NaBH4 methanolysis. J. Mater. Sci. 2018, 53, 6831–6841. [Google Scholar] [CrossRef]
- Wang, F.; Luo, Y.; Zhang, Y.; Wang, Y.; Zhu, H. Preparation of bush-like Ru/NiO-Ni foam catalyst and its performance in hydrogen production from sodium borohydride alcoholysis. Energy Fuels 2020, 34, 11365–11372. [Google Scholar] [CrossRef]
- Yan, K.; Li, Y.; Zhang, X.; Yang, X.; Zhang, N.; Zheng, J.; Chen, B.; Smith, K.J. Effect of preparation method on Ni2P/SiO2 catalytic activity for NaBH4 methanolysis and phenol hydrodeoxygenation. Int. J. Hydrog. Energy 2015, 40, 16137–16146. [Google Scholar] [CrossRef]
- Xie, L.; Wang, K.; Du, G.; Asiri, A.M.; Sun, X. 3D hierarchical CuO/Co3O4 core–shell nanowire array on copper foam for on-demand hydrogen generation from alkaline NaBH4 solution. RSC Adv. 2016, 6, 88846–88850. [Google Scholar] [CrossRef]
- Wang, X.; Zhao, Y.; Peng, X.; Jing, C.; Hu, W.; Tian, S.; Tian, J. In situ synthesis of cobalt-based tri-metallic nanosheets as highly efficient catalysts for sodium borohydride hydrolysis. Int. J. Hydrog. Energy 2016, 41, 219–226. [Google Scholar] [CrossRef]
- Guo, Y.; Dong, Z.; Cui, Z.; Zhang, X.; Ma, J. Promoting effect of W doped in electrodeposited Co-P catalysts for hydrogen generation from alkaline NaBH4 solution. Int. J. Hydrog. Energy 2012, 37, 1577–1583. [Google Scholar] [CrossRef]
- Patil, K.N.; Prasad, D.; Bhanushali, J.T.; Kim, H.; Atar, A.B.; Nagaraja, B.M.; Jadhav, A.H. Sustainable Hydrogen Generation by Catalytic Hydrolysis of NaBH4 Using Tailored Nanostructured Urchin-like CuCo2O4 Spinel Catalyst. Catal. Lett. 2019, 150, 586–604. [Google Scholar] [CrossRef]
- Kassem, A.A.; Abdelhamid, H.N.; Fouad, D.M.; Ibrahim, S.A. Metal-organic frameworks (MOFs) and MOFs-derived CuO@C for hydrogen generation from sodium borohydride. Int. J. Hydrog. Energy 2019, 44, 31230–31238. [Google Scholar] [CrossRef]
- Chinnappan, A.; Appiah-Ntiamoah, R.; Chung, W.-J.; Kim, H. Ionic liquid functionalized graphene oxide decorated with copper oxide nanostructures towards H2 generation from sodium borohydride. Int. J. Hydrog. Energy 2016, 41, 14491–14497. [Google Scholar] [CrossRef]


Disclaimer/Publisher’s Note: The statements, opinions and data contained in all publications are solely those of the individual author(s) and contributor(s) and not of MDPI and/or the editor(s). MDPI and/or the editor(s) disclaim responsibility for any injury to people or property resulting from any ideas, methods, instructions or products referred to in the content. |
© 2023 by the authors. Licensee MDPI, Basel, Switzerland. This article is an open access article distributed under the terms and conditions of the Creative Commons Attribution (CC BY) license (https://creativecommons.org/licenses/by/4.0/).