Abstract
The aim of this study was to synthesize chemically activated carbons from different agricultural residues, i.e., pistachio shell (PS), bitter orange peel (OP), and saffron petal (SP), and subsequently to use them as supports for loading a Ni catalyst. Supercritical water gasification of bio-oil was applied to investigate the catalytic performance of the resulting catalysts. The physicochemical properties of the activated carbon (ACs) and the catalysts (Ni/ACs) were characterized with BET, XRD, XPS, TEM, and TPD. The adsorption results showed that the ACs developed considerable pore structures, containing both micro- and mesopores, which was validated by the well-distributed active phases on the supports in the TEM images. Furthermore, it was found that the BET of AC(PS) was 1410 m2/g, which was higher than that of AC(OP) (1085 m2/g) and AC(SP) (900 m2/g). The results obtained from XRD mainly indicated the presence of the nickel phosphides phases, which was confirmed with the XPS and TPD analyses. The catalytic tests showed that by raising the process temperature, the total amount of gas and hydrogen increased. Furthermore, Ni/AC(PS) showed a superior catalytic activity. The highest total gas amount (i.e., 7.87 mmol/g bio-oil), together with 37.2 vol.% H2, was achieved using Ni/AC(PS) with a 1:10:100 catalyst:bio-oil weight ratio and a mass ratio of 1:10 (bio-oil/water) at T = 550 °C.
1. Introduction
The increasing world population not only leads to overconsuming nonrenewable fossil resources, which increases their cost and generates geopolitical problems, but exploiting these fossil fuels also emits greenhouse and harmful gases (COx, NOx, SOx). Hence, implementing new practices as a replacement for fossil fuels and that utilize alternative renewable energy sources in the near future is urgent. In this line, worldwide industrial hydrogen demand reached 95 Mts/year in 2021, being satisfied by steam reforming of natural gas or steam cracking of naphtha, and this is expected to increase to 115 Mts/year by 2030. Apart from its use as an industrial feedstock, hydrogen is also regarded as a clean energy carrier (since it only releases H2O during its combustion) that has the potential to replace traditional fossil fuels in stationery and heavy transportation (mass transport, aviation, and naval sectors) applications. Governments around the world are implementing policies and measures for greening hydrogen production [1]. Clean hydrogen can be generated from fossil fuels with carbon capture, biomass, or water, through thermal, electrolytic, or photolytic processes [2,3,4]. Biomass can be used to produce hydrogen through industrial processes that have already been commercially deployed for fossil feedstocks, and can be a complementary and reliable backup source of renewable hydrogen for the hydrogen produced by electrolysis using solar or wind energies [5].
In comparison with the conventional thermochemical techniques such as pyrolysis and steam reforming, supercritical water gasification (SCWG), (Tc = 373.95 °C and Pc = 22.06 MPa) has the potential to yield a higher conversion efficiency and produce hydrogen-rich gas from biomass with lower energy demands. SCWG can be applied directly to biomass to produce hydrogen, or through first conducting fast pyrolysis to obtain bio-oil and then performing SCWG on the respective bio-oil [6,7]. The main advantage of the second process is that the bio-oil obtained from pyrolysis can be easily stored and transported to a bio refinery at much lower cost than the biomass, to use for fuel and chemical production.
Heterogeneous catalysts, due to their high conversion efficiency, have been used in many chemical processing industries, such as hydrogen production [5]. In this sense, noble metals, including Pt, Rh, and Ru, have superior activity and stability for obtaining hydrogen. However, their usage has been limited due to a high cost [5]. Nickel-based catalysts with distinct features such as a high activity in the decomposition of oxygenated compounds, low cost, and easy regeneration are the most widespread group VIII metal used in H2 production [8,9,10].
Catalytic supports have a key role in providing a structural framework for catalysts, through stabilizing the active metal species, modulating the activity between the interaction of the active phase and the surface of the support, and increasing the mechanical and chemical resistance of the catalysts. Furthermore, since the main objective of a catalyst is to achieve a good catalytic activity and to reduce the deactivation of the catalyst, the choice of a support with a highly developed surface area to promote dispersion of active metal and reduce the coke deposition, or suppress its formation, is considered of crucial importance [11,12,13].
In recent years, activated carbon (AC) has attracted much more attention for use as a support for Ni catalysts. Catalysts based in ACs show the advantages of a high surface area, low cost, high stability in both acidic and basic media, tunable surface chemistry, and easy recovery of active metals by burning the carbonaceous supports [14,15,16]. Activated carbon can be prepared from a large number of materials. The most commonly used raw materials in commercial practice are peat, lignite, wood, and agricultural by-products. There are two general activation methods for preparing activated carbon: physical and chemical activation. In the former, the development of porosity is based on the controlled gasification of char (i.e., solid obtained during the pyrolysis of biomass and low range coals), using oxidizing agents such as CO2, H2O, or O2. In chemical activation, a raw material is impregnated with an activating reagent (e.g., ZnCl2, H3PO4, etc.), and the impregnated material is heat-treated under an inert atmosphere. The chemical agent is responsible of the development of porosity. Important advantages of chemical activation compared to physical activation are lower treatment temperatures, higher preparation yields, and shorter treatment time. Additionally, activated carbons obtained by chemical activation with H3PO4 possess a large surface area and well-developed microporous and mesoporous structures, which can be controlled and maintained within narrow ranges, as well as highly stable phosphorus groups, which confer an acid character and oxidation resistance to the resulting ACs [17,18,19].
Regarding the previous research on the catalytic activities of Ni on ACs during SCWG, Lee and Ihm studied the supercritical water gasification of glucose using a Ni/AC catalyst over a temperature range of 575 to 725 °C at 28 MPa. It was reported that the Ni/AC catalyst was relatively stable in supercritical water conditions. The AC showed some catalytic activity for a methanation reaction at temperatures over 650 °C [20].
Lee also investigated the effect of metal addition to a Ni/activated charcoal catalyst for the gasification of glucose in supercritical water at 650 °C and 28 MPa. They reported that adding small amounts of Y to the Ni/AC catalyst led to an increase in both the extent of gasification and hydrogen yield, while loading of Fe or Co metal into the Ni/AC catalyst did not result in any positive impact on the gasification results [21]. Remón et al. analyzed sub- and supercritical water gasification for upgrading bio-oil and found that a balance between the yield and the properties of the upgraded bio-oil was achieved when Ni-Co supported on a CNF was used as catalyst [22].
Another research work dealing with lignocellulosic bio-oil in supercritical water was carried out by Penninger and Rep. They analyzed supercritical water reforming of bio-oil for H2 production [23]. Remón et al. examined the use of water in sub- and supercritical states for bio-oil valorization with a Ni catalyst supported on alumina, prepared by coprecipitation (Ni-Co/Al-Mg) [24].
The objective of this work was first to perform a full characterization of the Ni catalysts supported on the different activated carbons obtained by chemical activation of lignocellulosic waste with H3PO4, and then to investigate these catalysts and their behavior in the supercritical water gasification of real bio-oil, which was obtained from pistachio shell through fast pyrolysis. Specifically, we chose pistachio shell, bitter orange peel, and saffron petal as feedstocks for conducting the process, all of which are highly available, renewable, and non-expensive precursors that are found as agricultural waste commonly produced in Iran. The novelty of the article is based on the use of novel carbon catalysts and supports obtained through chemical activation with H3PO4. To our knowledge, the use of AC obtained via activation with H3PO4 for the preparation of Ni catalysts for the SCWG process is reported for the first time. The high surface area and the development of mesoporosity of H3PO4-ACs can improve the performance of the Ni-AC catalysts previously used in this process. Moreover, this process worked in a closed loop; catalysts were prepared from the same biomass being used as the feedstock to produce bio-oil for the supercritical water gasification process.
2. Results and Discussion
2.1. Textural Properties
Figure 1 represents the N2 adsorption–desorption isotherms at −196 °C for three activated carbons (solid lines) and their respective catalysts (dashed lines). As can be seen, all the activated carbons presented modified type I + type IV isotherms, corresponding to a well-developed microporous structure with a significant contribution from mesoporosity [25]. The presence of an open knee, which continually increases to higher relative pressures, was noticeable and is indicative of a wide microporosity and mesoporosity. An H2-type hysteresis loop (i.e., steeper slope of desorption with respect to the adsorption isotherms) was observed for the AC(OP) and AC(SP) samples, which revealed the presence of a broad mesopore size distribution with various shapes. In the case of AC(PS), H1-type hysteresis with certain contribution of H4 was observed, representative of narrow mesopores [25,26,27].
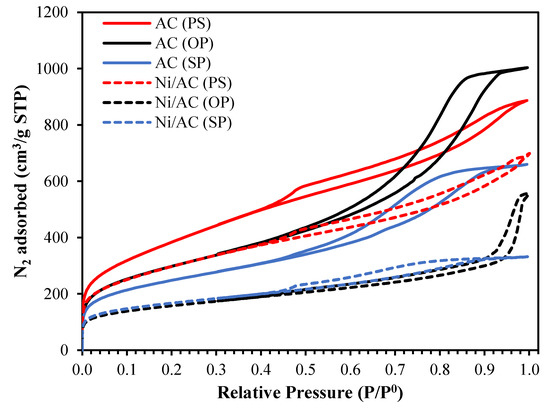
Figure 1.
Nitrogen adsorption–desorption isotherms at −196 °C of the activated carbon obtained from different precursors before (solid lines) and after Ni loading (dashed lines).
The porosity of the ACs was highly affected by the Ni loading. As is shown in Figure 1, all the catalysts experienced a decrease at low and medium–high relative pressures. These observations indicated a reduction in both microporosity and mesoporosity regions. It is also interesting to note that the shrinkage of the hysteresis loops for Ni/AC (OP) and Ni/AC (SP) was noticeable, which means that the active phase (Ni) in these samples preferentially settled in mesopores.
The NLDFT pore size distribution of the activated carbons (ACs) and catalysts (Ni/ACs) are plotted in Figure 2a,b. Two common features were found in the PSDs of all the activated carbons (ACs); namely, 1. a narrow distribution of micropores (20 < Å) with the maximum at 12.1, 13.1, and 9.2 Å for AC (PS), AC(OP), and AC(SP), respectively; 2. a wide distribution of mesopores from 20 to 300 Å. The amount and extension of the PSDs in the mesopore region were different for each AC. Specifically, AC(PS) developed narrow mesopores (maximum of the distribution at 22 Å), while AC(SP) and AC(OP) showed the presence of wider mesopores, having a broader mesopore distribution, which were centered at 40 and 66 Å, respectively. The difference between the micropores and mesopores on the surface of the ACs was related to the structure of the biopolymers; an amorphous structure, i.e., lignin, mostly leads to micropores, while the presence of cellulose, i.e., a crystalline structure, produces a mixture of pore sizes [28,29]. Crystalline cellulose shows a much higher potential for structural expansion, which is attributed to the presence of hydroxyls, which allow a higher degree of combination with phosphoric acid through condensation reactions [30]. After the loading of Ni into the AC samples, the density of mesoporosity declined to a greater extent than the microporosity, which indicates that Ni nanoparticles were likely loaded in the wider mesoporosity of the ACs.
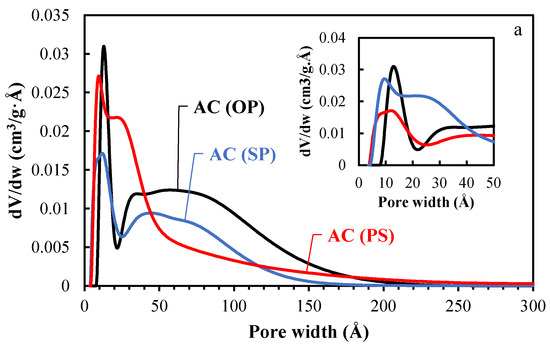
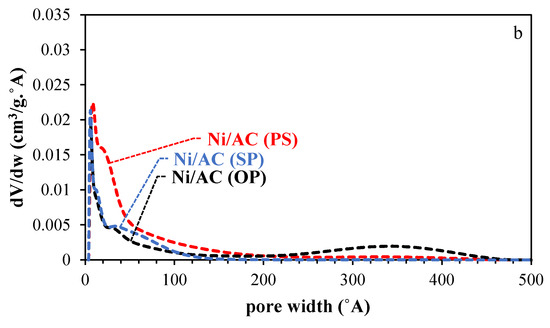
Figure 2.
Pore size distribution (PSD) of the activated carbons before (a) and after Ni loading (b).
The characteristic parameters of the porous structure of the ACs and the catalysts (Ni/ACs), extracted from the isotherms of N2 and CO2, are summarized in Table 1. The micropore volume values obtained from N2 were higher than those of the CO2 adsorption isotherms (VDRN2 > VDRCO2), signifying the presence of wide microporosity in the activated carbon (sizes larger than 0.7 nm) [30]. Regarding the apparent surface area (ABET), the maximum value (1410 m2/g) was obtained for AC(PS), probably due to the presence of a higher cellulose content in PS [31]. However, the total pore volume of the AC(OP) was the highest, equal to 1.20 cm3/g. Additionally, the Vmeso/V0.99 ratios of AC(OP), AC(SP), and AC(PS) were 0.78, 0.70, and 0.65, indicating that the use of orange peel as a raw material brought about a wider mean porosity. This concept was proven by the average pore volume, as estimated by 4·V0.99/ABET, being 5.6 nm for AC(OP) vs. 4.4 and 3.7 nm for AC(SP) and AC(PS), respectively. Table 1 also shows that, after Ni loading, AC-based catalysts with large surface areas (as high as 985 m2/g) and pore volumes (up to 1.17 cm3/g) were obtained. Nevertheless, all the samples experience a reduction in their structural parameters when compared to the parent ACs. A sharp decrease in Vmeso for Ni/AC(OP) and Ni/AC(SP) was noticeable, while the VDRCO2 of the samples was only slightly affected, which again confirmed the preferential deposition of Ni on the surface of the wider micropores.

Table 1.
Characteristic parameters of the porous texture for the prepared activated carbons and the catalysts.
The production of porosity originated from the chemical reactions between H3PO4 and raw materials. It was reported that phosphoric acid not only can operate as an acid catalyst to increase bond cleavage reactions and the formation of crosslinks through processes such as cyclization and condensation, but it can also react with organic species to produce phosphate and polyphosphate bonds that connect and crosslink biopolymer fragments. These phosphate groups induce a process of dilation that, after removing the acid, leaves the matrix in an expanded state with an accessible pore structure [28,32].
2.2. XRD Analysis
The XRD patterns of the three catalysts (Ni/ACs) are shown in Figure 3a–c. Compared to Ni/AC(OP) and Ni/AC(SP), the XRD profile of the Ni/AC(PS) catalyst contains very weak peaks. This result highlights the good dispersion of the active phase on the support Ni/AC(PS), being in agreement with the higher surface area shown by PS. In addition, nickel phosphides (Ni12P5 and Ni3P) are the main crystalline phases on the OP and SP-derived catalysts. This finding is probably connected to the formation of stable phosphorus groups during the activation of these biomass wastes. The Ni12P5 appears at 2θ = 32.85, 38.44, 41.7, and 48.9. The peak at 2θ = 46.9 corresponds to Ni3P, and the peaks at 2θ = 43.2 are related to NiO. The Ni phase appears at 2θ = 44.4. The main peak of Ni12P5 is narrower in the Ni/AC(SP) catalyst, indicating larger crystalline sizes in this material, likely due to the lower surface area of the support.
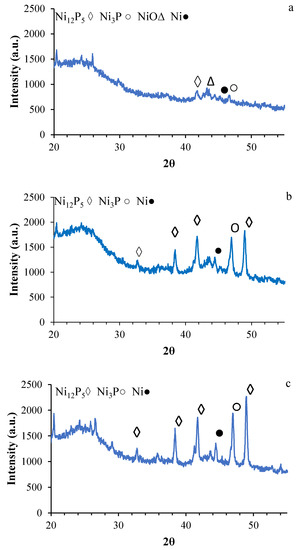
Figure 3.
XRD pattern for the catalysts (a) Ni/AC(PS), (b) Ni/AC(OP), and (c) Ni/AC(SP).
2.3. Surface Chemistry
2.3.1. XPS Analysis
X-ray photoelectron spectroscopy (XPS) was applied to study the surface chemistry of the ACs and Ni/ACs through the determination of their elemental composition and oxidation state. Table 2 shows a summary of the mass concentrations of the surface elements, obtained through peak quantitative analysis. The main elements existing on the surface of the activated carbon samples (ACs) and the catalysts (Ni/ACs) were carbon and oxygen, due to carbonaceous supports, with lower amounts of phosphorus and nickel. The presence of phosphorus on the surface of activated carbon has been attributed to the activation step [33]. As previously mentioned, phosphate and polyphosphate bridges connecting and crosslinking biopolymer fragments are generated during chemical activation with phosphoric acid [34]. As a result, part of these phosphorus complexes remains chemically stable and bonded to the carbon surface, even after the washing step.

Table 2.
Weight surface concentration (w/w %) and Ni/P ratio determined by XPS for ACs and catalysts.
After nickel loading, a decrease in the oxygen content, as a result of the Ni incorporation and surface gasification during the thermal stabilization process (heat treatment), was observed for the three catalysts (Ni/ACs). The Ni surface concentration measured with XPS (that of the external surface) was quite low for the catalysts, suggesting that Ni was very well dispersed over the entire particle surface (internal and external).
XPS spectra were analyzed, in order to evaluate the chemical environment of the elements present on the samples surface. Figure 4a–c shows normalized high-resolution XPS spectra for phosphorus. The P2p spectrum of the chemically activated carbon supports shows a main band at binding energies between 132.9 and 133.5 eV. The peaks around these bonding energies are characteristic of C–P bonding, as in the C–PO3 and C2PO2 groups [28,35]. After Ni loading, the P2p spectrum for the AC catalysts shifted to higher binding energies with lower intensities, indicating oxidation of the surface phosphorus groups (CO)3PO, C-O-PO [28,34,35,36]. The presence of oxygen in the nickel salt used as precursor, which could potentially be transferred to phosphorus groups during the heat treatment, likely explains this phenomenon. There was an additional peak at 129.9 eV in the Ni/AC(PS), which corresponds to the presence of nickel phosphides [37].
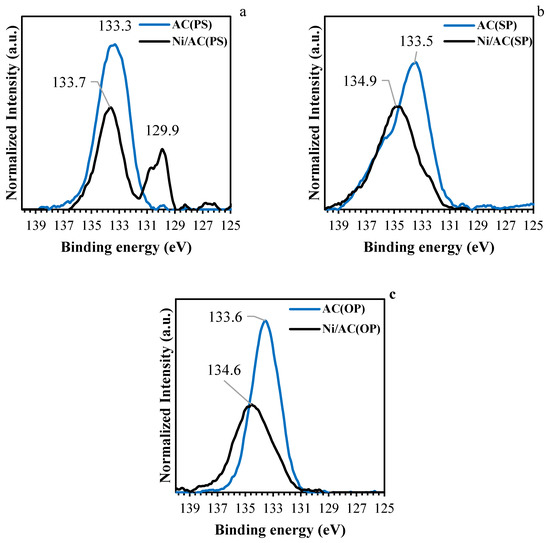
Figure 4.
XPS of P 2p region for activated carbon (blue lines) and catalysts (black lines). (a) Ni/AC(PS), (b) Ni/AC(SP), and (c) Ni/AC(OP).
The Ni2p spectra for the catalysts are shown in Figure 5. As can be seen for all samples, there are two clear peaks in the Ni 2p3/2 spectrum. The peaks between 852.9 and 853.1 eV are higher than the binding energies of Ni metal (852.5–852.9 eV) and lower than those of Ni in NiO (853.5–854.1 eV). This indicates that the Ni in the samples contained a partial positive charge (Niδ+), which can be related to Ni12P5 [38]. The peaks between 856.6 and 857.6 eV were related to the oxidized Ni species (Ni2+) for each catalyst. According to previous research, possible reasons including a strong metal–support interaction and small amounts of NiO can explain the presence of the Ni+2 species in the samples [37,38,39,40,41]. Furthermore, for the Ni/AC(PS), the Ni 2p3/2 binding energies characteristic of the main peak shifted to lower energies (856.6 eV), suggesting the formation of a low valence of Ni [41].
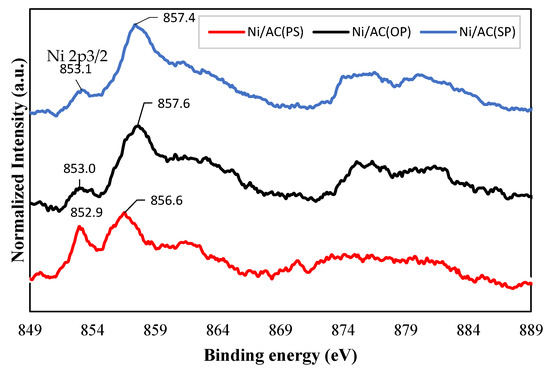
Figure 5.
XPS of the Ni 2p region for catalyst samples.
2.3.2. TPD Analysis
The TPD technique also analyzes the surface chemistry of samples, which was used to characterize the different types of oxygenated groups on the surface of the carbon. In TPDs, acidic oxygenated groups (carboxyl) and lactone are desorbed as CO2 during heat treatment, while non-acid groups (carbonyls, ethers, quinone) and phenols are desorbed as CO. The anhydride-type groups desorb as CO and CO2 at the same time [42].
Figure 6 shows the evolution of CO from the TPD analysis of the ACs (solid lines) and Ni/ACs (dashed lines) samples. It can be observed that most of the CO desorbed at remarkably high temperatures (between 800 and 873 °C), which has been previously assigned to the decomposition of stable phosphorus complexes such as the C-O-P type bonds of C-O-PO3 and C-PO3 surface groups [34]. There were some differences among the ACs; for example, the CO desorption from AC(OP) and AC(SP) occurred at a lower temperature, while in the case of AC(PS), it happened at a higher temperature, with a lower intensity. Furthermore, in terms of CO desorption, the AC(SP) showed a higher intensity. These behaviors could be related to the presence of different amounts of phosphorus groups. Indeed, PS contains a lower P content than OP and SP. Furthermore, SP is the richest in phosphorus among the three biomasses, along with other inorganic elements, which, if not totally washed during the preparation of the AC, can cause CO evolution during TPD [43]. After Ni loading on the ACs, the CO profiles shifted to lower temperatures (between 680 and 715 °C). This new feature found on the Ni-loaded ACs was undoubtedly related to the carbothermal reduction of nickel oxides to produce metallic nickel. In addition, the decrease in the CO evolution peak at higher temperatures, which is related to the presence of phosphorus groups, confirmed that nickel phosphides were formed during the thermal treatment of the catalysts, at the cost of losing phosphate groups. In fact, the Ni/AC(SP) catalyst, which showed the highest amount of nickel phosphides according to the XPS and XRD results, had the lowest CO-evolution peak, related to the reduction of nickel oxides, proving that most nickel is in the form of nickel phosphides in this catalyst.
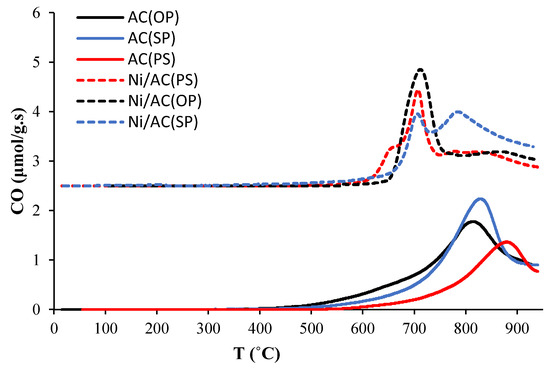
Figure 6.
CO evolution with temperature during the TPD conducted on activated carbon supports (solid lines) and catalysts (dashed lines).
Table 3 summarizes the amounts of CO and CO2 desorbed during the TPD. Higher levels of CO evolution after Ni loading can be seen in Table 3. Regarding the effect of biomass, compared to PS, the OP and SP have larger quantities of desorbed CO. As previously pointed out, this may be related to the higher amounts of P in the structure of OP and SP, which help in releasing greater quantities of gas.

Table 3.
Amount of CO and CO2 evolved in the TPD analysis.
The amount of CO2 evolved from the ACs and Ni/ACs was considerably lower than that from CO evolution, signifying a lower concentration of carboxyl, lactonic, and anhydride surface groups.
2.4. TEM Images
TEM images for the three catalyst are shown in Figure 7a–f. It can be clearly seen that the fine particles were quite well dispersed on the Ni/AC(PS) catalyst (Figure 7a,b), with particle sizes ranging between 30 and 120 nm, being centered around 50 nm (Figure 7b). This observation could be attributed to the developed pore structure of the AC(PS) sample, which was confirmed by the very low crystalline intensity peaks in the XRD results. The same observation was seen for Ni/AC(OP) (Figure 7c,d), whose active phases were distributed homogeneously but, to some extent, the nanoparticles showed larger sizes (Figure 7c). This could be related to the lower surface features of Ni/AC(OP) compared to Ni/AC(PS). In this sample, the particle size was in the range 20–140 nm. Finally, a good dispersion on the support was observed for the metal particles of the Ni/AC(SP) catalyst (Figure 7e,f); they showed cubic crystalline shapes, and the particle sizes in these samples shifted to larger sizes, in some cases reaching values as high as 130 nm (Figure 7f).
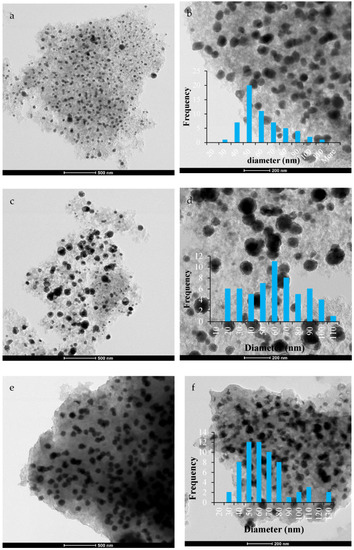
Figure 7.
TEM images (a,b) Ni/AC(PS), (c,d) Ni/AC(OP), and (e,f) Ni/AC(SP).
2.5. Catalytic Test
From a thermodynamic point of view, supercritical water gasification of bio-oil is a complex process, where many reactions occur simultaneously. The overall chemical conversion can be expressed by the following main reactions, which account for the bio-feedstock decomposition into H2, CO, CO2, and CH4.
Steam reforming:
Water gas shift reaction:
Methanation reaction:
In this study, the weight percentages of C, H, and O elements present in the bio-oil were 33.1%, 6.6%, and 58.7%, respectively. Based on these values and considering the stoichiometry of Equation (1), the steam reforming reaction can be written by Equation (4).
The reforming reaction of bio-oil (Equation (4)) is highly endothermic, and the water gas shift reaction (Equation (2)) is moderately exothermic, giving an endothermic process overall. Therefore, based on Le Chatelier’s principle, high temperatures shift the equilibrium of the endothermic reaction in a forward direction (Equation (4)), while lower reaction temperatures favor methane production (Equation (3)). Hence, at high reaction temperatures, hydrogen formation should predominate over methane formation [44]. The thermodynamic equilibrium composition for the gas phase was calculated at working operation conditions using a Gibbs reactor in AspenOne ® 12.1, finding an estimated composition of 3.0%, 0.4%, 34.4%, and 62.2% for H2, CO, CO2, and CH4, respectively, at 500 °C, which shifted towards a higher H2 and CO production at 550 °C (composition of H2, CO, CO2, and CH4 of 4.6%, 0.8%, 34.0%, and 60.7%, respectively).
The total amount of gas, gas composition as volume percentage, and mmol/g bio-oil, along with the LHV values obtained with different experimental conditions, are summarized in Table 4. As can be seen, the total gas yield ranged from 0.33 to 7.87 mmol/gr bio-oil. The lowest amount was achieved for the blank test, performed at 500 °C under similar operational conditions. This shows that the catalyst improved the gasification of the feedstock and even resulted in higher total gas yield at a lower temperature of 400 °C. Furthermore, the total gas yield was found to be highly affected by the temperature in the catalytic tests. Temperature plays a key role in gas production, because most of the reactions involved in SCWG, such as hydrolysis, decomposition, and steam reforming, are endothermic; thus, increasing the temperature enhances the gasification [45].

Table 4.
Total yield, gas composition, and LHV values obtained at different temperatures for the three catalysts.
As to the catalytic effect, the Ni/AC(PS) led to a higher total amount of gas compared to the Ni/AC(OP) and Ni/AC(SP) samples. Furthermore, the Ni/AC(OP) catalyst showed a better performance for gas production at 400 and 500 °C than the Ni/AC(SP) catalyst. The reason for this behavior could be traced back to the surface features of the samples. As was previously discussed, among the three catalysts, Ni/AC(PS) developed the highest apparent surface area and the highest mesoporosity, while AC(SP) gave rise to the lowest porosity development. The presence of a broader porosity was expected to minimize the impact of the diffusional constraints for the Ni/AC(PS) and Ni/AC(OP) samples. Similarly, Ni/AC(PS) showed the smallest average nanoparticle size, see Figure 7, which improved the activity of the active phase. Nevertheless, these varying catalytic activities may largely stem from the existence of distinct active phases. Nickel phosphides, which are found in Ni/AC(OP) and Ni/AC(SP) according to XPS and XRD measurements, are known to be active for hydrogenation reactions [46], and can shift the gas product distribution once hydrogen is formed; however, they are not expected to contribute toward catalyzing the steam gasification of bio-oil. In fact, the presence of a larger amount of active metallic nickel in Ni/AC(PS) was confirmed by the higher CO-evolution that was related to the carbothermal reduction in nickel during TPD, Figure 6. Therefore, the total gas production can be directly related to the greater porosity development and the larger amount of active metallic nickel with enhanced distribution shown by Ni/AC(PS).
The total gas production obtained with this catalyst was among the highest reported for similar conditions, only being surpassed by the that obtained in the work of Nanada et al. [47], who investigated the subcritical and supercritical water gasification of lignocellulosic biomass impregnated with nickel nanocatalysts for hydrogen production. The total gas produced under similar operating conditions at 500 °C was reported to be 7.1 mmol/g.
As for the product distribution, according to results depicted in the Table 4, the gas in the blank test was mainly composed of CO2, along with small amounts of CO, CH4, and H2. This clearly indicates that the application of a catalyst for hydrogen generation is critical. Regarding Ni/ACs, both Ni/AC(PS) and Ni/AC(OP) showed a better catalytic performance in H2 gas production. As expected, the gas compositions in terms of CH4 and CO2 were far from those predicted by the methanation and water gas shift equilibriums. Hydrogen production increased with temperature to a larger extent for the PS-derived catalyst. The increase in hydrogen at higher temperatures was related to the improvement of the radical reactions, which were enhanced at high temperatures [48]. CH4 was the primary product formed at 400 °C, being formed as a result of the decomposition of oxygenates, but its concentration diminished as the gasification temperature increased [48]. Nevertheless, the methane production was enhanced by Ni/AC(PS) with temperature. Metallic nickel is known to catalyze methanation with mild steam reforming conditions, and temperatures higher than 600 °C are needed to suppress CH4 formation, via steam reforming of the freshly produced methane [49]. The observed temperature-dependent generation of CO aligns with theoretical predictions, based on the prevalence of the reverse water gas shift reaction at elevated temperatures. Note that the temperature had little effect for the Ni/AC(PS) and Ni/AC(SP) samples on the yield of CO2. Similar trends in the CO2 yield were observed by Duan et al. during the SCWG of microalgae with Ru and Rh/AC [50]. However, the greater CO2/CO ratio shown by Ni/AC(OP) could be indicative of a larger contribution of WGS for this catalyst.
There are few examples in the literature to directly compare with the effectiveness of the catalysts in this work [24,51]. Remon et al. [24] investigated sub- and supercritical water gasification of bio-oil obtained from the fast pyrolysis of pinewood using a Ni-Co/Al-Mg catalyst under the operational conditions of temperature (310–450 °C), pressure (20–26 MPa), catalyst/bio-oil mass ratio (0–0.25 g catalyst/g bio-oil), and reaction time (0–60 min). They reported that under supercritical conditions at a temperature of 339 °C, pressure of 20 MPa, and catalyst/biooil ratio 0.2 g/g for 60 min, the highest amount of H2 production from bio-oil was 30 vol.%. In another study, Osada et al. [51] studied the supercritical water gasification of sugarcane bagasse over Ru/AC and Ru/TiO2. They reported that under gasification conditions of 0.1 g of bagasse, 0.3 g of catalyst, a reaction temperature of 400 °C, and reaction time of 15 min, the volume fractions of H2 were 9.1 and 14.4 vol.%, respectively. In this work, the volume fractions of H2 at the same temperature were 15.9, 12.7, and 11.5 vol.%, which highlights the outstanding performance of the Ni/ACs catalysts obtained from H3PO4-activated carbons.
Regarding the LHV value, this parameter increased with the process temperature (see Table 4), which was related to the higher contribution of CO and H2 to the gas product distribution. Moreover, compared to Ni/AC(OP) and Ni/AC(SP), Ni/AC(PS) delivered an enhanced LHV value.
3. Materials and Methods
3.1. Materials
The biomass materials used in this research were pistachio shell (PS), bitter orange peel (OP), and saffron petal (SP), with particle sizes between 300 and 500 . It is noted that three biomass samples were employed to prepare the activated carbon as support, and one of the biomass samples (i.e., pistachio shell) was also used as a raw material for producing the bio-oil, which was then utilized as feedstock to produce hydrogen-rich gas via a supercritical water gasification process.
The bio-oil was obtained via fast pyrolysis at 500 °C in a drop-down fixed-bed reactor. Information on this process and bio-oil characterization were reported in our previous work [52].
3.2. Catalyst Preparation
The precursors were initially impregnated with phosphoric acid (H3PO4, 85%, w/w) at a mass ratio of 3:1 (H3PO4/biomass); the optimum ratio according to the research by Rosas et al. [28]. The mixture was then dried at 60 °C for 12 h, and then activated in a tubular furnace, under nitrogen flow (150 cm3/min, purity of 99.999%, Linde, Málaga, Spain) at 500 °C for 2 h, using a heating rate of 10 °C/min. The activated carbon samples were washed with distilled water at 60 °C, until a constant pH in the residual water was reached. The resulting chemically activated carbon samples were denoted AC(PS), AC(OP), and AC(SP). After drying, the chemically activated carbons (ACs) were impregnated with Ni (NO3)2.6H2O using the incipient wetness method. The samples were loaded with 10% Ni, which has been proven to be the optimum amount of deposited nickel for steam reforming and SCWG processes [6]. The impregnated samples were then dried for 12 h at 120 °C, and then heat treated at 700 °C for 2 h under N2 atmosphere. The final products as catalysts were named Ni/AC(PS), Ni/AC(OP), and Ni/AC(SP). Table 5 shows the amounts of ash and the final mass yields based on the mass of dried of raw materials for the activated carbons and the catalysts. The higher amounts of ash in the catalysts compared to the supports were due to the presence of nickel, which remained as nickel oxide when the catalysts were submitted to the ash determination analyses.

Table 5.
Yield and ash quantity of the ACs and catalysts.
3.3. Characterization of the Catalysts
The porous structure of the activated carbons (ACs) and catalysts (Ni/ACs) was studied through N2 adsorption–desorption at −196 °C and CO2 adsorption at 0 °C in an ASAP 2020 instrument (ASAP 2020, Micromeritics Instruments Corp., Norcross, GA, USA). Samples had been previously outgassed at least for 8 h at 150 °C. From the N2 isotherm, the apparent surface area (ABET) was obtained using the Brunauer–Emmett–Teller (BET) equation, the micropore volume (Vt) and external surface area (At) were computed using the t-plot method, and the mesopore volume (Vmes) was obtained as the difference between the adsorbed volume of N2 at a relative pressure of 0.96 and the micropore volume (Vt). From the CO2 isotherm, the narrow micropore volume (VDR) was calculated by applying the Dubinin−Radushkevich equation. Pore size distributions were obtained from N2 isotherm data using the two-dimensional non-local density functional theory (2D-NLDFT) heterogeneous adsorption models for carbon slit-shaped pores. The surface chemistry of the ACs and Ni/ACs was investigated using X-ray photoelectron spectroscopy (XPS) and temperature-programmed desorption (TPD).
XPS analyses were performed in a spectrophotometer 5700C (VersaProbe II ESCA 5701, Physical Electronics, Chanhassen, MN, USA) with Mg Kα radiation (1253.6 eV). The C1s peak was fixed at 284.5 eV and used as a reference to position the rest of the peaks. TPD experiments were analyzed in a quartz tubular reactor mounted in an electrical furnace. In each run, 100 mg of the sample was heated from room temperature to 950 °C at a heating rate of 10 °C /min under a nitrogen flow (150 cm3 STP/min). The CO and CO2 desorption rates were recorded with a nondispersive infrared (NDIR) gas analyzer (ULTRAMAT 22, Siemens AG, Munich, Germany).
The active phase dispersion on the AC supports was studied through transmission electron microscopy (TEM) in a FEI Talos F200X microscope at an accelerating voltage of 200 kV and in a high angle annular dark field (HAADF). The X-ray diffraction patterns (XRD) of the Ni/ACs were gathered over 2θ = 5–90° region on an EMPYREAN PANalytical diffractometer using CuKα monochromatic radiation (operation value 45 kV and 40 mA), and using a PIXcel detector and Soller slits (incident and diffracted beam) of 0.04 rad.
3.4. SCWG Experiments
The SCWG experiments were performed in a batch micro-reactor made of Hastelloy alloy with a 5.8 cm3 volume. All experiments were conducted at a temperature of 400–550 °C, a reaction time of 30 min, and with 10 wt.% catalyst and a constant ratio of bio-oil/water of 1:10, to keep the pressure at a constant of 25 MPa. In a typical run, the reactor was loaded with a specific amount of feedstock and tightly sealed, then the reactor was vacuumed using a syringe. Subsequently, the sealed reactor was placed in a horizontal furnace and the run was performed for 30 min at each temperature. At the end of the reaction, the reactor was cooled to room temperature (~25 °C) using a water bath. Following this, the final pressure of the reactor was measured using a low-pressure gauge after opening the valve, to calculate the total gas produced. The composition of the produced gasses was measured and analyzed using a gas chromatograph (GC-TCD).
4. Conclusions
The development of low-cost and highly efficient catalysts is promising for biomass-derived hydrogen production technology. In this study, different chemically activated carbons were prepared using pistachio shell, bitter orange peel, and saffron petal as precursors, and subsequently used as a support for loading 10% nickel as an active phase. The resulting products were tested in the supercritical water gasification of bio-oil. The results of adsorption showed that all the ACs developed a significant amount of porosity, and the BET surface areas of the ACs were considerably higher. The presence of nickel phosphide phases on the ACs was confirmed using XRD, XPS, and TPD analyses. The results of the catalytic tests indicated that by increasing the temperature, the total amount of gas and hydrogen was enhanced. The catalyst of Ni supported on AC(PS) showed higher Ni dispersions and was found to have a superior catalytic performance.
Author Contributions
Conceptualization, M.J.H., J.R.-M. and T.C.; methodology, B.H.; validation, M.J.H. and R.R.-R.; formal analysis, R.R.-R.; investigation, B.H. and M.d.C.R.-R.; data curation, R.R.-R. and J.M.R.; writing—original draft preparation, B.H.; writing—review and editing, R.R.-R. and J.M.R.; visualization, F.E. and R.R.-R.; supervision, M.J.H., J.R.-M. and T.C.; project administration, J.R.-M.; funding acquisition, J.R.-M. All authors have read and agreed to the published version of the manuscript.
Funding
This research was funded by MICINN, grant number RTI2018-097555-B-100, and Junta de Andalucía/FEDER, grant numbers UMA18-FEDERJA-110 & P18-RT-4592. MCRR gratefully acknowledges financial support by MICINN through a FPI contract, grant number PRE2019-089340.
Data Availability Statement
The data presented in this study are available on request from the corresponding authors. The data are not publicly available due to privacy reasons.
Conflicts of Interest
The authors declare no conflict of interest.
References
- IEA. Global Hydrogen Review 2022; IEA: Paris, France, 2022; License: CC BY 4.0, 2022; Available online: https://www.iea.org/reports/global-hydrogen-review-2022 (accessed on 17 April 2023).
- Fahmy, T.Y.; Fahmy, Y.; Mobarak, F.; El-Sakhawy, M.; Abou-Zeid, R.E. Biomass pyrolysis: Past, present, and future. J. Environ. Dev. Sustain. 2020, 22, 17–32. [Google Scholar] [CrossRef]
- Kiadehi, A.D.; Taghizadeh, M.; Azarhoosh, M.J.; Aghaeinejad-Meybodi, A. Hydrogen production using ethylene glycol steam reforming in a micro-reformer: Experimental analysis, multivariate polynomial regression and genetic programming modeling approaches. J. Taiwan Inst. Chem. Eng. 2020, 112, 20–33. [Google Scholar] [CrossRef]
- Yahya, H.S.M.; Amin, N.A.S. Catalytic steam reforming of toluene for hydrogen production over nickel-cobalt supported activated carbon. Int. J. Integr. Eng. 2019, 11, 209–218. [Google Scholar]
- Zhu, H.L.; Pastor-Pérez, L.; Millan, M. Catalytic steam reforming of toluene: Understanding the influence of the main reaction parameters over a reference catalyst. Energies 2020, 13, 813. [Google Scholar] [CrossRef]
- Hu, Y.; Qi, L.; Rao, K.T.V.; Zhao, B.; Li, H.; Zeng, Y.; Xu, C.C. Supercritical water gasification of biocrude oil from low-temperature liquefaction of algal lipid extraction residue. Fuel 2020, 276, 118017. [Google Scholar] [CrossRef]
- Tavasoli, A.; Barati, M.; Karimi, A. Sugarcane bagasse supercritical water gasification in presence of potassium promoted copper nano-catalysts supported on γ-Al2O3. Int. J. Hydrogen Energy 2016, 41, 174–180. [Google Scholar] [CrossRef]
- Veiga, S.; Bussi, J. Steam reforming of crude glycerol over nickel supported on activated carbon. Energy Convers. Manag. 2017, 141, 79–84. [Google Scholar] [CrossRef]
- Wang, S.; Li, X.; Zhang, F.; Cai, Q.; Wang, Y.; Luo, Z. Bio-oil catalytic reforming without steam addition: Application to hydrogen production and studies on its mechanism. Int. J. Hydrogen Energy 2013, 38, 16038–16160. [Google Scholar] [CrossRef]
- Calles, J.A.; Carrero, A.; Vizcaíno, A.J.; García-Moreno, L.; Megía, P.J. Steam reforming of model bio-oil aqueous fraction using Ni-(Cu, Co, Cr)/SBA-15 catalysts. Int. J. Mol. Sci. 2019, 20, 512. [Google Scholar] [CrossRef]
- Bermúdez, J.M.; Arenillas, A.; Menéndez, J.A. Syngas from CO2 reforming of coke oven gas: Synergetic effect of activated carbon/Ni–γAl2O3 catalyst. Int. J. Hydrogen Energy 2011, 36, 13361–13368. [Google Scholar] [CrossRef]
- Zhang, G.; Sun, Y.; Xu, Y.; Zhang, R. Catalytic performance of N-doped activated carbon supported cobalt catalyst for carbon dioxide reforming of methane to synthesis gas. J. Taiwan Inst. Chem. Eng. 2018, 93, 234–244. [Google Scholar] [CrossRef]
- Qian, K.; Kumar, A. Catalytic reforming of toluene and naphthalene (model tar) by char supported nickel catalyst. Fuel 2017, 187, 128–136. [Google Scholar] [CrossRef]
- Kupila, R.; Lappalainen, K.; Hu, T.; Romar, H.; Lassi, U. Lignin-based activated carbon-supported metal oxide catalysts in lactic acid production from glucose. Appl. Catal. A Gen. 2021, 612, 118011. [Google Scholar] [CrossRef]
- Yang, X.; Liu, X.; Guo, T.; Liu, C. Effects of Cu and Fe additives on low-temperature catalytic steam reforming of toluene over Ni/AC catalysts. Catal. Surv. Asia 2019, 23, 54–63. [Google Scholar] [CrossRef]
- Liu, X.; Yang, X.; Liu, C.; Chen, P.; Yue, X.; Zhang, S. Low-temperature catalytic steam reforming of toluene over activated carbon supported nickel catalysts. J. Taiwan Inst. Chem. Eng. 2016, 65, 233–241. [Google Scholar] [CrossRef]
- Girgis, B.S.; Ishak, M.F. Activated carbon from cotton stalks by impregnation with phosphoric acid. Mater. Lett. 1999, 39, 107–114. [Google Scholar] [CrossRef]
- Hayashi, J.I.; Horikawa, T.; Takeda, I.; Muroyama, K.; Ani, F.N. Preparing activated carbon from various nutshells by chemical activation with K2CO3. Carbon 2002, 40, 2381–2386. [Google Scholar] [CrossRef]
- Rosas, J.M.; Bedia, J.; Rodríguez-Mirasol, J.; Cordero, T. On the preparation and characterization of chars and activated carbons from orange skin. Fuel Process. Technol. 2010, 91, 1345–1354. [Google Scholar] [CrossRef]
- Lee, I.G.; Ihm, S.K. Catalytic gasification of glucose over Ni/activated charcoal in supercritical water. Ind. Eng. Chem. Res. 2009, 48, 1435–1442. [Google Scholar] [CrossRef]
- Lee, I.G. Effect of metal addition to Ni/activated charcoal catalyst on gasification of glucose in supercritical water. Int. J. Hydrogen Energy 2011, 36, 8869–8877. [Google Scholar] [CrossRef]
- Che, Q.; Yang, M.; Wang, X.; Chen, X.; Chen, W.; Yang, Q.; Chen, H. Aromatics production with metal oxides and ZSM-5 as catalysts in catalytic pyrolysis of wood sawdust. Fuel Process. Technol. 2019, 188, 146–152. [Google Scholar] [CrossRef]
- Penninger, J.M.; Rep, M. Reforming of aqueous wood pyrolysis condensate in supercritical water. Int. J. Hydrogen Energy 2006, 31, 1597–1606. [Google Scholar] [CrossRef]
- Remón, J.; Arcelus-Arrillaga, P.; García, L.; Arauzo, J. Production of gaseous and liquid bio-fuels from the upgrading of lignocellulosic bio-oil in sub-and supercritical water: Effect of operating conditions on the process. Energy Convers. Manag. 2016, 119, 14–36. [Google Scholar] [CrossRef]
- Thommes, M.; Kaneko, K.; Neimark, A.V.; Olivier, J.P.; Rodriguez-Reinoso, F.; Rouquerol, J.; Sing, K.S. Physisorption of gases, with special reference to the evaluation of surface area and pore size distribution (IUPAC Technical Report). Pure Appl. Chem. 2015, 87, 1051–1069. [Google Scholar] [CrossRef]
- Sun, L.; Liang, X.; Liu, H.; Cao, H.; Liu, X.; Jin, Y.; Wu, X. Activation of Co-O bond in (110) facet exposed Co3O4 by Cu doping for the boost of propane catalytic oxidation. J. Hazard. Mater. 2023, 452, 131319. [Google Scholar] [CrossRef]
- Xu, S.; Niu, M.; Zhao, G.; Ming, S.; Li, X.; Zhu, Q.; Yamauchi, Y. Size control and electronic manipulation of Ru catalyst over B, N co-doped carbon network for high-performance hydrogen evolution reaction. Nano Res. 2022, 1–8. [Google Scholar] [CrossRef]
- Rosas, J.M.; Bedia, J.; Rodríguez-Mirasol, J.; Cordero, T. HEMP-derived activated carbon fibers by chemical activation with phosphoric acid. Fuel 2009, 88, 19–26. [Google Scholar] [CrossRef]
- Jagtoyen, M.; Derbyshire, F. Activated carbons from yellow poplar and white oak by H3PO4 activation. Carbon 1998, 36, 1085–1097. [Google Scholar] [CrossRef]
- Bedia, J.; Rosas, J.M.; Marquez, J.; Rodriguez-Mirasol, J.; Cordero, T. Preparation and characterization of carbon-based acid catalysts for the dehydration of 2-propanol. Carbon 2009, 47, 286–294. [Google Scholar] [CrossRef]
- Hosseinzaei, B.; Hadianfard, M.J.; Aghabarari, B.; García-Rollán, M.; Ruiz-Rosas, R.; Rosas, J.M.; Cordero, T. Pyrolysis of pistachio shell, orange peel and saffron petals for bioenergy production. Bioresour. Technol. Rep. 2022, 19, 101209. [Google Scholar] [CrossRef]
- Lozano-Castelló, D.; Cazorla-Amorós, D.; Linares-Solano, A. Usefulness of CO2 adsorption at 273 K for the characterization of porous carbons. Carbon 2004, 42, 1233–1242. [Google Scholar] [CrossRef]
- Ibeh, P.O.; García-Mateos, F.J.; Rosas, J.M.; Rodríguez-Mirasol, J.; Cordero, T. Activated carbon monoliths from lignocellulosic biomass waste for electrochemical applications. J. Taiwan Inst. Chem. Eng. 2019, 97, 480–488. [Google Scholar] [CrossRef]
- Palomo, J.; Rodríguez-Cano, M.A.; Rodríguez-Mirasol, J.; Cordero, T. On the kinetics of methanol dehydration to dimethyl ether on Zr-loaded P-containing mesoporous activated carbon catalyst. Chem. Eng. J. 2019, 378, 122198. [Google Scholar] [CrossRef]
- Valero-Romero, M.J.; García-Mateos, F.J.; Rodríguez-Mirasol, J.; Cordero, T. Role of surface phosphorus complexes on the oxidation of porous carbons. Fuel Process. Technol. 2017, 157, 116–126. [Google Scholar] [CrossRef]
- Torres-Liñan, J.; Garcia-Rollan, M.; Rosas, J.M.; Rodriguez-Mirasol, J.; Cordero, T. Deactivation of a Biomass-Derived Zirconium-Doped Phosphorus-Containing Carbon Catalyst in the Production of Dimethyl Ether from Methanol Dehydration. Energy Fuels 2021, 35, 17225–17240. [Google Scholar] [CrossRef]
- Mahmoudi, M.; Dufour, A.; Bettahar, M.E.M.; Medjahdi, G.; Ouederni, A.; Gadiou, R. Hydrogen production by methane decomposition over Ni-doped activated carbons: Effect of the activation method. Comptes Rendus. Chimie 2022, 25, 225–236. [Google Scholar] [CrossRef]
- Pham, L.K.H.; Kongparakul, S.; Reubroycharoen, P.; Ding, M.; Guan, G.; Vo, D.V.N.; Samart, C. High Catalytic Activity of a Nickel Phosphide Nanocatalyst Supported on Melamine-Doped Activated Carbon for Deoxygenation. Top. Catal. 2022, 66, 22–33. [Google Scholar] [CrossRef]
- Xin, H.; Guo, K.; Li, D.; Yang, H.; Hu, C. Production of high-grade diesel from palmitic acid over activated carbon-supported nickel phosphide catalysts. Appl. Catal. B Environ. 2016, 187, 375–385. [Google Scholar] [CrossRef]
- Sawhill, S.J.; Layman, K.A.; Van Wyk, D.R.; Engelhard, M.H.; Wang, C.; Bussell, M.E. Thiophene hydrodesulfurization over nickel phosphide catalysts: Effect of the precursor composition and support. J. Catal. 2005, 231, 300–313. [Google Scholar] [CrossRef]
- Sawhill, S.J.; Phillips, D.C.; Bussell, M.E. Thiophene hydrodesulfurization over supported nickel phosphide catalysts. J. Catal. 2003, 215, 208–219. [Google Scholar] [CrossRef]
- Figueiredo, J.L.; Pereira, M.F.R.; Freitas, M.M.A.; Orfao, J.J.M. Modification of the surface chemistry of activated carbons. Carbon 1999, 37, 1379–1389. [Google Scholar] [CrossRef]
- Palomo, J.; Rodríguez-Mirasol, J.; Cordero, T. Methanol dehydration to dimethyl ether on Zr-loaded P-containing mesoporous activated carbon catalysts. Materials 2019, 12, 2204. [Google Scholar] [CrossRef] [PubMed]
- Antal, M.J., Jr.; Allen, S.G.; Schulman, D.; Xu, X.; Divilio, R.J. Biomass gasification in supercritical water. Ind. Eng. Chem. Res. 2000, 39, 4040–4053. [Google Scholar] [CrossRef]
- Khorasani, R.; Khodaparasti, M.S.; Tavakoli, O. Hydrogen production from dairy wastewater using catalytic supercritical water gasification: Mechanism and reaction pathway. Int. J. Hydrogen Energy 2021, 46, 22368–22384. [Google Scholar] [CrossRef]
- Koike, N.; Hosokai, S.; Takagaki, A.; Nishimura, S.; Kikuchi, R.; Ebitani, K.; Oyama, S.T. Upgrading of pyrolysis bio-oil using nickel phosphide catalysts. J. Catal. 2016, 333, 115–126. [Google Scholar] [CrossRef]
- Nanda, S.; Reddy, S.N.; Dalai, A.K.; Kozinski, J.A. Subcritical and supercritical water gasification of lignocellulosic biomass impregnated with nickel nanocatalyst for hydrogen production. Int. J. Hydrogen Energy 2016, 41, 4907–4921. [Google Scholar] [CrossRef]
- Susanti, R.F.; Kim, J.; Yoo, K.-P. Supercritical water gasification for hydrogen production: Current status and prospective of high-temperature operation. In Supercritical Fluid Technology for Energy and Environmental Applications, 1st ed.; Anikeev, V., Fan, M., Eds.; Elsevier: Amsterdam, The Netherlands, 2014; pp. 111–137. [Google Scholar]
- Trane, R.; Dahl, S.; Skjøth-Rasmussen, M.S.; Jensen, A.D. Catalytic steam reforming of bio-oil. Int. J. Hydrogen Energy 2012, 37, 6447–6472. [Google Scholar] [CrossRef]
- Duan, P.G.; Li, S.C.; Jiao, J.L.; Wang, F.; Xu, Y.P. Supercritical water gasification of microalgae over a two-component catalyst mixture. Sci. Total Environ. 2018, 630, 243–253. [Google Scholar] [CrossRef] [PubMed]
- Osada, M.; Yamaguchi, A.; Hiyoshi, N.; Sato, O.; Shirai, M. Gasification of sugarcane bagasse over supported ruthenium catalysts in supercritical water. Energy Fuels 2012, 26, 3179–3186. [Google Scholar] [CrossRef]
- Hosseinzaei, B.; Hadianfard, M.J.; Ruiz-Rosas, R.; Rosas, J.M.; Rodríguez-Mirasol, J.; Cordero, T. Effect of heating rate and H3PO4 as catalyst on the pyrolysis of agricultural residues. J. Anal. Appl. Pyrolysis 2022, 168, 105724. [Google Scholar] [CrossRef]
Disclaimer/Publisher’s Note: The statements, opinions and data contained in all publications are solely those of the individual author(s) and contributor(s) and not of MDPI and/or the editor(s). MDPI and/or the editor(s) disclaim responsibility for any injury to people or property resulting from any ideas, methods, instructions or products referred to in the content. |
© 2023 by the authors. Licensee MDPI, Basel, Switzerland. This article is an open access article distributed under the terms and conditions of the Creative Commons Attribution (CC BY) license (https://creativecommons.org/licenses/by/4.0/).