Article

Catalytic Performance and Reaction Mechanisms of Ethyl Acetate Oxidation over the Au–Pd/TiO2 Catalysts

Beijing Key Laboratory for Green Catalysis and Separation, Key Laboratory of Beijing on Regional Air Pollution Control, Key Laboratory of Advanced Functional Materials, Education Ministry of China, Laboratory of Catalysis Chemistry and Nanoscience, Department of Chemical Engineering, Faculty of Environment and Life, Beijing University of Technology, Beijing 100124, China
*
Authors to whom correspondence should be addressed.
Catalysts 2023, 13(4), 643; https://doi.org/10.3390/catal13040643
Submission received: 6 March 2023 / Revised: 17 March 2023 / Accepted: 21 March 2023 / Published: 23 March 2023
(This article belongs to the Special Issue Exclusive Papers in Environmentally Friendly Catalysis in China)

Abstract

:
The development of efficient and stable catalysts is of great importance for the elimination of volatile organic pollutants (VOCs). In this work, AuPdx nanoparticles (NPs) were loaded on TiO2 through the electrostatic adsorption approach to generate the yAuPdx/TiO2 (i.e., 0.35AuPd0.46/TiO2, 0.34AuPd2.09/TiO2, and 0.37AuPd2.72/TiO2; x and y are Pd/Au molar ratio and AuPdx loading, respectively; x = 0.46–2.72; and y = 0.34–0.37 wt%) catalysts, and their catalytic activities for the oxidation of ethyl acetate were determined. The results showed that the 0.37AuPd2.72/TiO2 sample exhibited the best activity (T50% = 217 °C and T90% = 239 °C at SV = 40,000 mL/(g h), Ea = 37 kJ/mol, specific reaction rate at 220 °C = 113.8 µmol/(gPd s), and turnover frequency (TOFNoble metal) at 220 °C = 109.7 × 10⁻³ s−1). The high catalytic performance of the 0.37AuPd2.72/TiO2 sample was attributed to the good dispersion of AuPd2.72 NPs, the strong redox ability, the large ethyl acetate adsorption capacity, and the strong interaction between AuPdx and TiO2. Acetaldehyde, ethanol, and acetic acid are the main intermediates in the oxidation of ethyl acetate, and the loading of AuPdx NPs effectively reduces the formation of the toxic by-product acetaldehyde. The oxidation of ethyl acetate over the 0.34AuPd2.09/TiO2 sample might occur via the pathway of ethyl acetate → ethanol → acetic acid → acetate → CO2 and H2O. We believe that the obtained results may provide a useful idea for the design of bimetallic catalysts under industrial conditions and for understanding the VOCs oxidation mechanisms.

1. Introduction

Oxygenated volatile organic compounds (OVOCs) are significant precursors of the ozone (O3) and secondary organic aerosols in the atmosphere (SOA). OVOCs not only have active reactivity that has an impact on the environment and climate, but they also represent a significant risk to human health [1,2]. Catalytic oxidation is a crucial strategy for reducing OVOCs emissions, and the key issue is the development of high-performance catalysts [3,4,5,6]. The usage of ethyl acetate, a solvent with comparatively low toxicity, as a replacement for benzene solvents has greatly grown. However, fewer studies have been conducted to control ester-containing VOC pollution due to its low toxicity, and removing esters is more challenging than removing benzene. Usually, the difficulty of oxidizing a volatile organic compound increases with its molar mass, and the order of oxidation ease is as follows: alcohols < aldehydes < aromatics < ketones < acetates < alkanes [7]. The strongest bond in ethyl acetate and other oxygenated VOCs, in contrast to the hydrocarbon structure, is the C=O bond [8]. Such a feature suggests that there are some differences in the key active sites and reaction mechanisms catalyzing the oxidation of ethyl acetate [9].
Currently, the majority of research on the catalytic oxidation of ethyl acetate has been concentrated on transition metal oxides, which typically consist of the metal (Ce, Mn, Cu, Co, and Zr) oxides [10,11,12,13] with good redox characteristics. However, transition metal oxides exhibit poor low-temperature activities and high-temperature stability. Supported noble metals show good catalytic activities at low temperatures, an easy adsorption of reactants, and a strong ability to generate intermediate active species, but their use is constrained by their high cost. In the catalytic oxidation of ethyl acetate, there are two key issues: (i) ethyl acetate oxidation is prone to forming the by-products, among which acetaldehyde is more dangerous and photochemically active than any of the reactants and other by-products, and it is hence vital to assure full combustion of ethyl acetate [14]; and (ii) the effects of water vapor and sulfur dioxide on the activity of the catalysts in ethyl acetate combustion and their inhibition or promotion mechanisms have not been thoroughly investigated. Therefore, the development of a catalyst with high activity, low acetaldehyde selectivity, and good stability is essential for the catalytic oxidation of ethyl acetate.
The loading of bimetals can modify the surface electronic structures of the catalysts due to the interaction between the two metals, which may not only effectively enhance activity but also potentially improve thermal stability and resistance to poisoning of the catalysts [15,16,17,18]. For the oxidation of ethyl acetate, it was reported that the bimetallic 1Ru–5Cu/TiO2 catalyst possessed better catalytic stability, higher CO2 selectivity, and fewer by-products than the monometallic 1Ru/TiO2 and 5Cu/TiO2 catalysts [19]. Furthermore, the performance of ethyl acetate oxidation was investigated by loading gold onto various metal oxides, and the Au/CuO catalyst performed the best, since Au increased the reducibility and reactivity of the carrier oxide surface [20]. Pd was the critical component for the catalytic oxidation of ethyl acetate. For instance, the 0.26Pd/3.2N-TiO2 catalyst exhibited good photothermocatalytic activity (T90% = 212 °C) and good water resistance and stability in the oxidation of ethyl acetate [21]. The Pd/CeO2-SP catalyst showed the best activity (T90% = 180 °C at a space velocity of 60,000 mL/(g h)) for ethyl acetate oxidation due to the strong interaction between Pd NPs and CeO2 [22]. Substantial research on the Au–Pd bimetallic catalysts has occurred in recent years, which has demonstrated that such materials exhibited outstanding VOC oxidation performance with good low-temperature reducibility and stability [23,24,25]. Ilieva et al. [26] performed catalytic combustion of benzene over the Y-modified cerium oxide-supported Au, Pd, and Pd–Au bimetallic catalysts, and found that the supported Pd–Au catalyst exhibited a higher activity (a complete oxidation of benzene was achieved at 150 °C) than the supported Au or Pd monometallic catalyst, due to the enhanced oxygen mobility by the synergy of the two noble metals. Tabakova et al. [27] used a continuous deposition–precipitation method to prepare the Pd–Au bimetallic particles on the alumina-supported Y-doped ceria, and observed that the doping of Y to CeO2–Al2O3 increased the catalytic activity of the supported Pd–Au catalysts for benzene oxidation. Additionally, lowering the precious metal content can lessen the cost of the as-obtained catalysts. It has been shown that the electrostatic adsorption technique may produce uniformly dispersed noble metal nanoparticles (NPs) with small particle sizes, and the fabrication procedure is rather straightforward. The electrostatic adsorption method is based on the strong electrostatic adsorption (SEA), i.e., a charged metal precursor is strongly adsorbed on an oppositely charged support surface by controlling the pH value relative to the surface zero charge point (PZC) [28,29,30]. DeRita et al. used the electrostatic adsorption approach to generate the Ptiso/TiO2 catalysts with a low loading of 0.1 wt%, which employed the precious metal more efficiently [31]. A low noble metal loading can be used to selectively fill the most thermodynamically stable adsorption sites on a high-surface-area carrier with the atomically dispersed noble metal. When preparing some bimetallic catalysts by the electrostatic adsorption strategy, C, SiO2, and TiO2 are usually selected as the support. Titanium dioxide, which exhibits the oxidation–reduction property, is inherently catalytically active, and its supported precious metal catalysts show good low-temperature catalytic oxidation activities [32,33]. In addition, the high specific surface area and low cost of titanium dioxide make it the preferred choice as the noble metal catalyst support.
Up to now, however, there have been no reports on the utilization of the supported Au–Pd bimetallic catalysts for the oxidation of OVOCs; especially, reaction mechanisms of the ethyl acetate oxidation and SO2 impact on this reaction are scarce. In the present work, we employed gold–palladium bimetallic NPs as the primary active component and nano-TiO2 as the support to prepare the yAuPdx/TiO2 (y is the weight loading of Au–Pd NPs, and x is the Pd/Au molar ratio) catalysts and investigate their catalytic performance for ethyl acetate oxidation, examine water- and sulfur-resistant behaviors, identify the reaction intermediates, and probe the catalytic reaction mechanisms.

2. Results and Discussion

2.1. Crystal Phase Composition, Microstructure, and Surface Area

Figure 1 shows XRD patterns of the TiO2, 0.33Pd/TiO2, 0.36Au/TiO2, 0.37AuPd2.72/TiO2, 0.34AuPd2.09/TiO2, and 0.35AuPd0.46/TiO2 samples. By comparing with the XRD pattern (JCPDS PDF# 21-1272) of the standard TiO2 sample, we can realize that all of the samples exhibit diffraction peaks that are characteristic of the anatase TiO2 phase, and those diffraction peaks at 2θ = 25.3°, 37.8°, 48.0°, 53.9°, 55.1°, 62.7°, 68.8°, 70.3°, and 75.0° are assigned to the (101), (004), (200), (105), (211), (204), (116), (220), and (215) crystal planes of anatase TiO2, respectively. After loading the noble metals, no diffraction peaks due to the Pd phase were detected. By referring to the XRD pattern (JCPDS PDF# 4-0783) of the standard gold sample, one can assign the diffraction peaks at 2θ = 38.2°, 44.5°, 64.6°, and 77.7° to the (111), (200), (220), and (311) crystal planes of the Au phase, respectively. The peaks at 2θ = 38.2° and 64.6° corresponded to the (004) and (204) crystal planes of the TiO2 phase. However, the lack of the peaks at 2θ = 44.5° and 77.7° suggests that no Au aggregates are present in the samples [34,35]. For each of the yAuPdx/TiO2 samples, the XRD pattern was the same as that of anatase TiO2. This result might be due to the lower loading of Au, Pd, or AuPdx NPs or their high dispersion on the surface of TiO2.
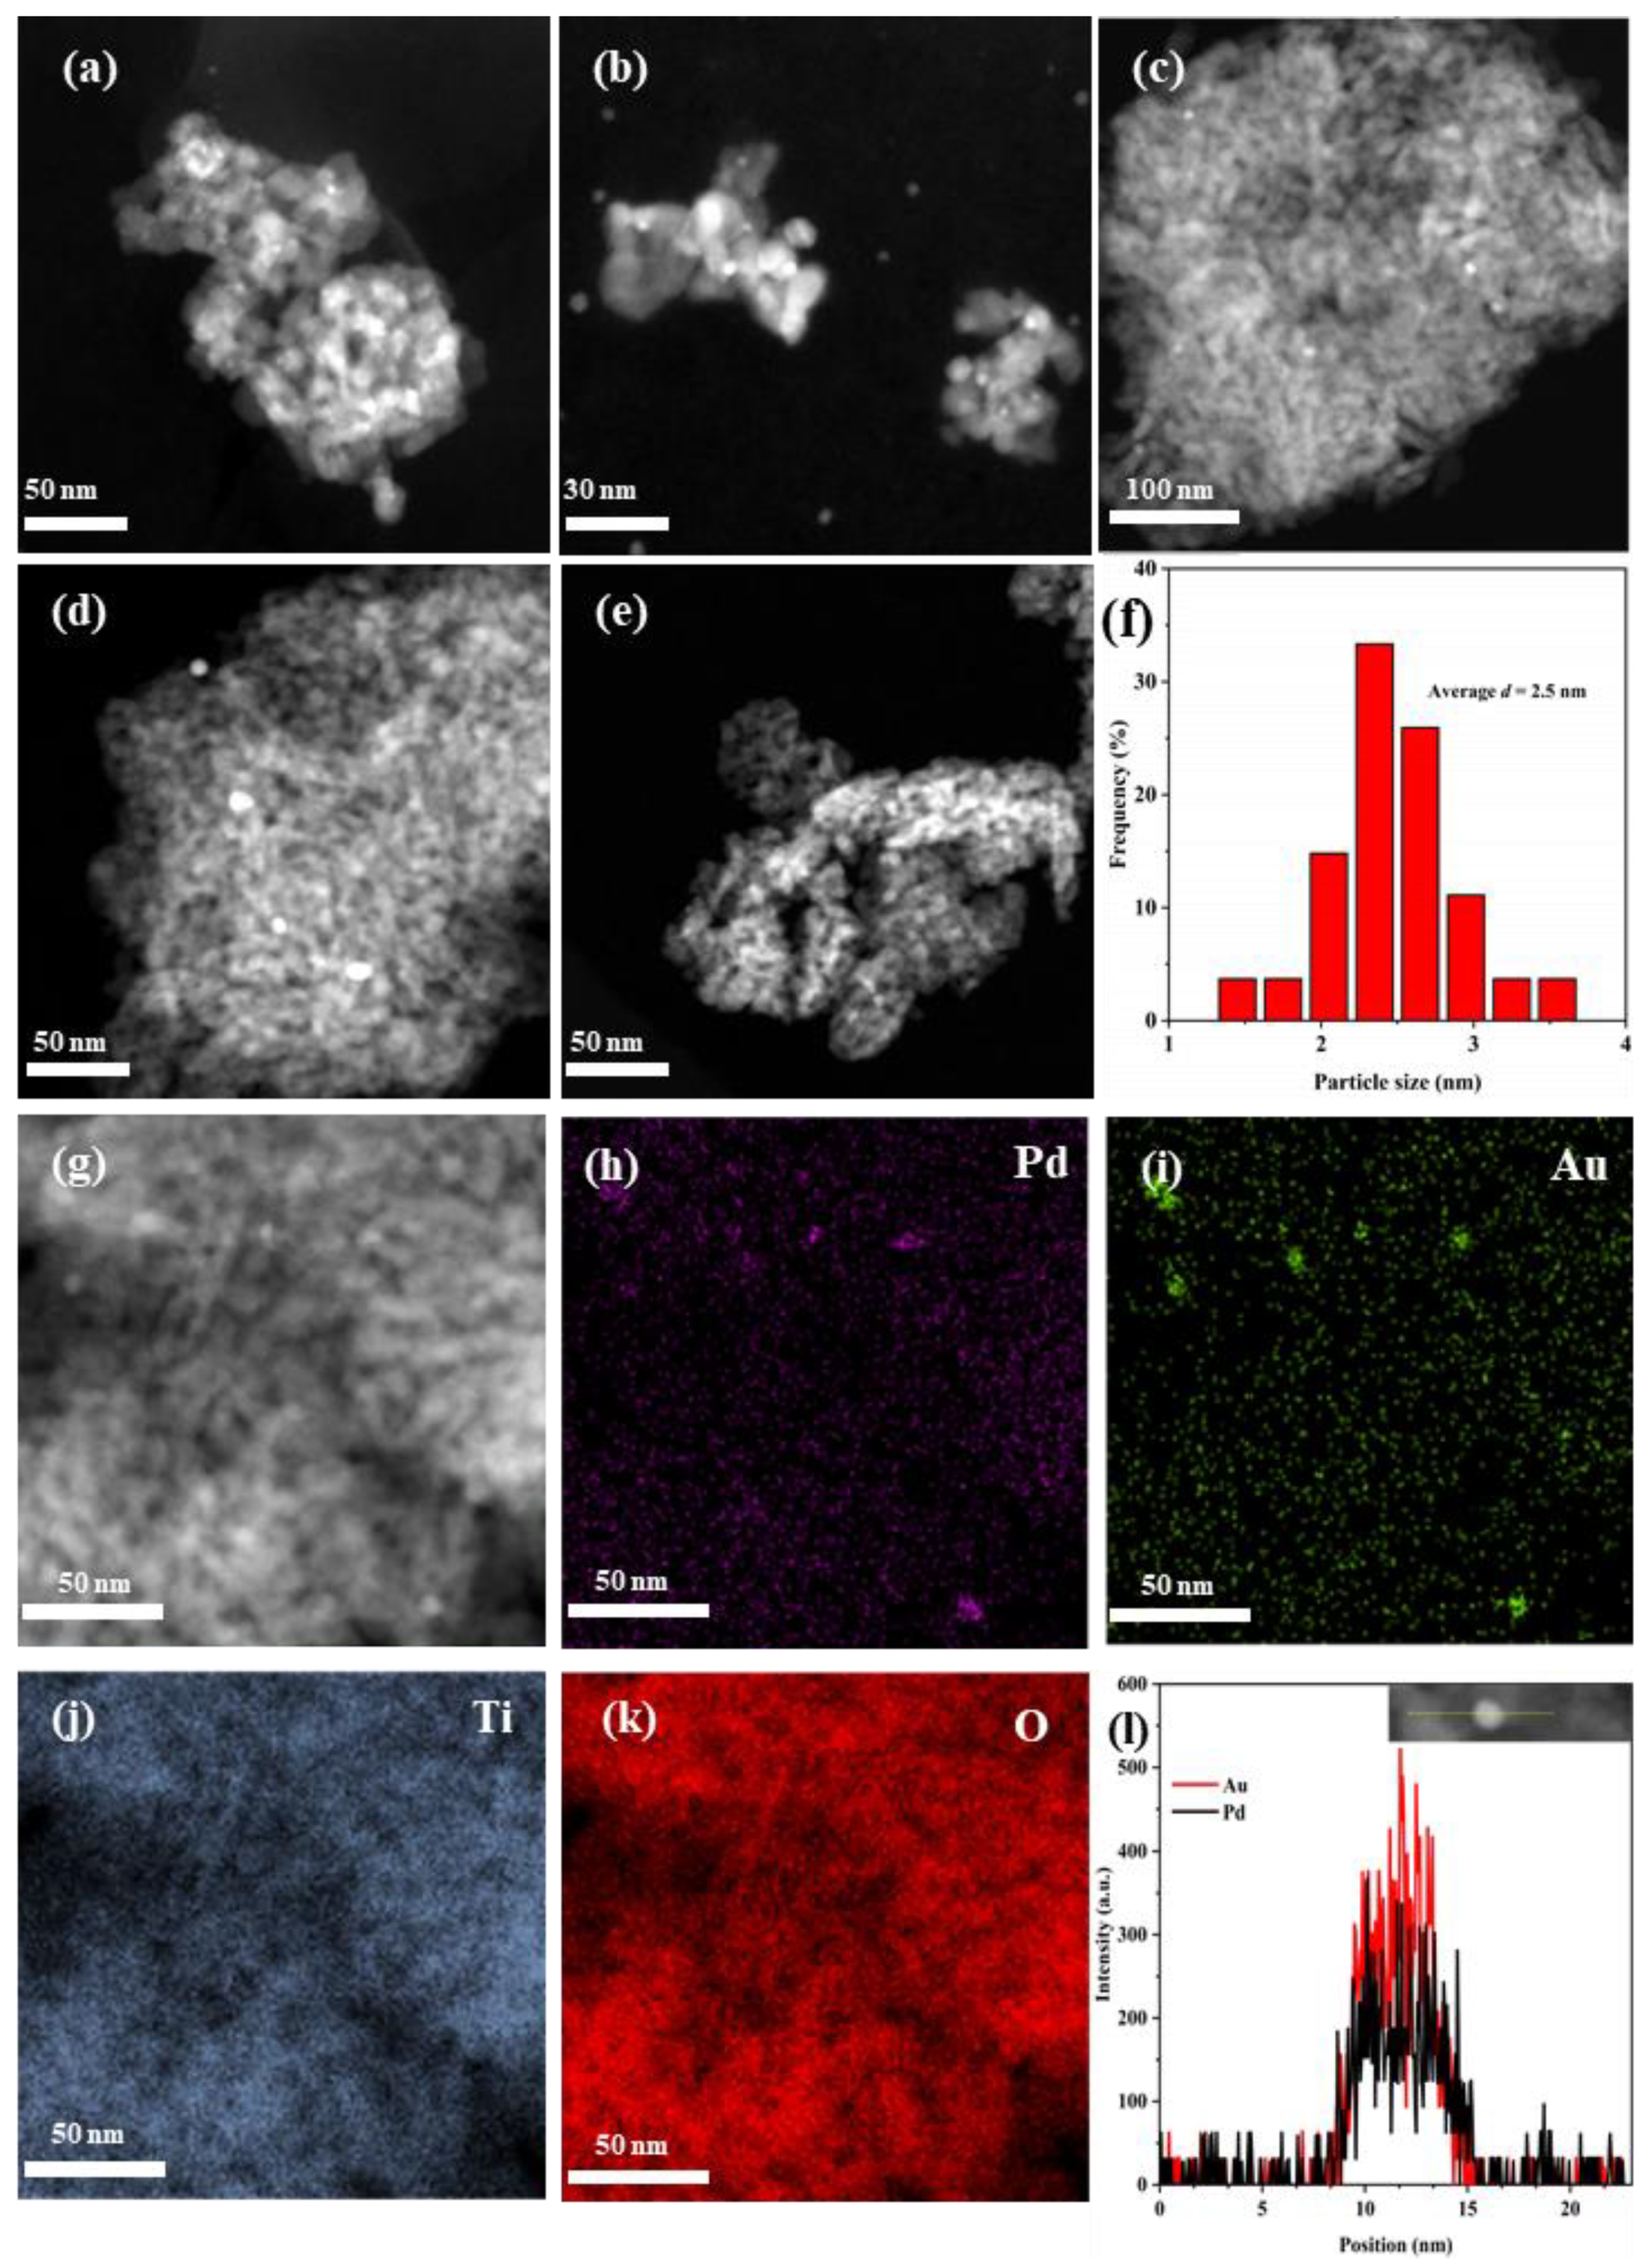
Figure 2a–f shows HAADF–STEM images of the as-fabricated samples and the particle-size distribution of 0.37AuPd2.72/TiO2. The particle sizes and AuPdx particle distribution can be estimated from the HAADF–STEM images, and the noble metal NPs were highly dispersed on the surface of TiO2. After analyzing the particle sizes of the noble metal NPs in the TEM images, we can know that the AuPd2.72 NPs possess an average particle size of 2.5 nm (Figure 2f). The particle size of Au NPs in the 0.36Au/TiO2 sample was 5–9 nm, and a high Pd dispersion on the 0.33Pd/TiO2 sample could be seen in the elemental mapping (Figure S1 of the Supplementary Data), although it was difficult to see Pd NPs in the HAADF–STEM images. In addition, the Pd and Au elements in 0.37AuPd2.72/TiO2 were uniformly distributed on the TiO2 surface, as shown in the elemental mappings (Figure 2h–k). The results of the linear scanning element analysis are shown in Figure 2l. It is clear that Pd and Au elements in AuPdx NPs have nearly identical signal positions and intensities, indicating that a Au–Pd alloy was formed. Therefore, the strong electrostatic adsorption method was used to successfully create a Au–Pd bimetallic alloyed structure of AuPdx/TiO2 with a uniform particle size and a good precious metal dispersion on TiO2. Furthermore, it can be seen from the data listed in Table 1 that the surface area of TiO2 was 168 m2/g, and those of the Au-, Pd-, and AuPdx-loaded samples were 111–163 m2/g.

2.2. Surface Property

The XPS technique was used to analyze the surface oxygen species and element compositions of the samples. Figure 3 shows O 1s, Pd 3d, and Au 4f XPS spectra of the samples, and their quantitative analysis results are summarized in Table 1.
The asymmetric peaks of each O 1s XPS spectrum could be decomposed into three components with binding energies (Bes) of 529.5, 531.1, and 532.3 eV, which were attributed to the surface lattice oxygen (Olatt), surface adsorbed oxygen (Oads), and surface adsorbed molecular water or carbonate species [36,37,38], respectively. Among all of the samples, 0.37AuPd2.72/TiO2 possessed the highest Oads/Olatt molar ratio (0.33), which was slightly higher than those (0.26–0.28) of 0.35AuPd0.46/TiO2 and 0.34AuPd2.09/TiO2, but much higher than those (0.18–0.20) of 0.33Pd/TiO2 and 0.36Au/TiO2. It is well known that the increase in the concentration of the adsorbed oxygen species on the catalyst is beneficial for the enhancement of the catalytic activity of a sample. Hence, the 0.37AuPd2.72/TiO2 sample is expected to show better catalytic activity than the other samples for ethyl acetate oxidation. Each Pd 3d spectrum was decomposed into four components: The ones at BE = 335.8 and 340.9 eV were due to the surface metallic Pd (Pd0) species, while the ones at BE = 337.8 and 342.8 eV were owing to the surface oxidized Pd (Pd2+) species [39,40]. The 0.35AuPd0.46/TiO2, 0.34AuPd2.09/TiO2, and 0.33Pd/TiO2 samples possessed surface Pd2+/Pd0 molar ratios (0.22–0.23) higher than that (0.15) of the 0.35AuPd0.46/TiO2 sample. The Au 4f XPS spectrum of each sample was decomposed into four components: The ones at BE = 83.3 and 87.0 eV were assigned to the surface metallic Au (Au0) species, whereas the ones at BE = 84.9 and 88.9 eV were attributed to the surface oxidized Au (Auδ+) species [41]. The Au–Pd alloy-loaded samples exhibited higher Auδ+/Au0 molar ratios (0.30–0.42) than that (0.25) of the Pd-free sample. As can be seen from the data in Table 1, the 0.37AuPd2.72/TiO2 sample possessed the highest surface Auδ+/Au0 and Pd2+/Pd0 molar ratios and the highest surface adsorbed oxygen species concentration, hence showing the best catalytic activity for the oxidation of ethyl acetate.

2.3. Reducibility

The reducibility of the samples was investigated using the H2-TPR characterization, and the results are shown in Figure 4. Two reduction peaks for the TiO2 sample were observed at 311 and 488 °C, with the former resulting from the removal of the oxygen species adsorbed on the TiO2 surface and the latter originating from the reduction of Ti4+ to Ti3+ and the removal of the oxygen species in the lattice [42,43]. In the H2-TPR profiles of the samples, one weak reduction peak at 70–100 °C was observed after the loading of noble metals, which was attributed to the reduction of noble metals in an oxidized state on the catalyst surface [23], as confirmed by the XPS results. Part of the Au and Pd on the sample surface were present in the form of Auδ+ and Pd2+, but most of them still existed in the form of the metallic states. It should be noted that the weak reduction peak was also related to the removal of the oxygen species adsorbed on the TiO2 surface at low temperatures [44,45]. In addition, the reduction peak of TiO2 was shifted to lower temperatures, and the peak at 330–401 °C was related to the reduction of Ti4+ to Ti3+, which occurred through the dissociation of H2 chemisorbed on the surface of the precious metals to generate the atomic hydrogen spillover on the support, and the more pronounced hydrogen spillover implied a stronger interaction between the noble metals and the support [46,47]. The H2 consumption of the various samples was estimated through quantitative analysis of the reduction peaks in their H2-TPR profiles, as summarized in Table 2. The order in H2 consumption from the highest to the lowest was 0.37AuPd2.72/TiO2 (0.35 mmol/gcat) > 0.34AuPd2.09/TiO2 (0.32 mmol/gcat) > 0.35AuPd0.46/TiO2 (0.27 mmol/gcat) > 0.33Pd/TiO2 (0.26 mmol/gcat) > 0.36AuTiO2 (0.19 mmol/gcat) > TiO2 (0.14 mmol/gcat). Apparently, the H2 consumption was closely associated with the catalytic activity, i.e., the better the reducibility, the higher the catalytic activity. Therefore, 0.37AuPd2.72/TiO2 would show the best catalytic performance for the oxidation of ethyl acetate, as confirmed by the activity data presented below.

2.4. Catalytic Performance and By-Products Distribution

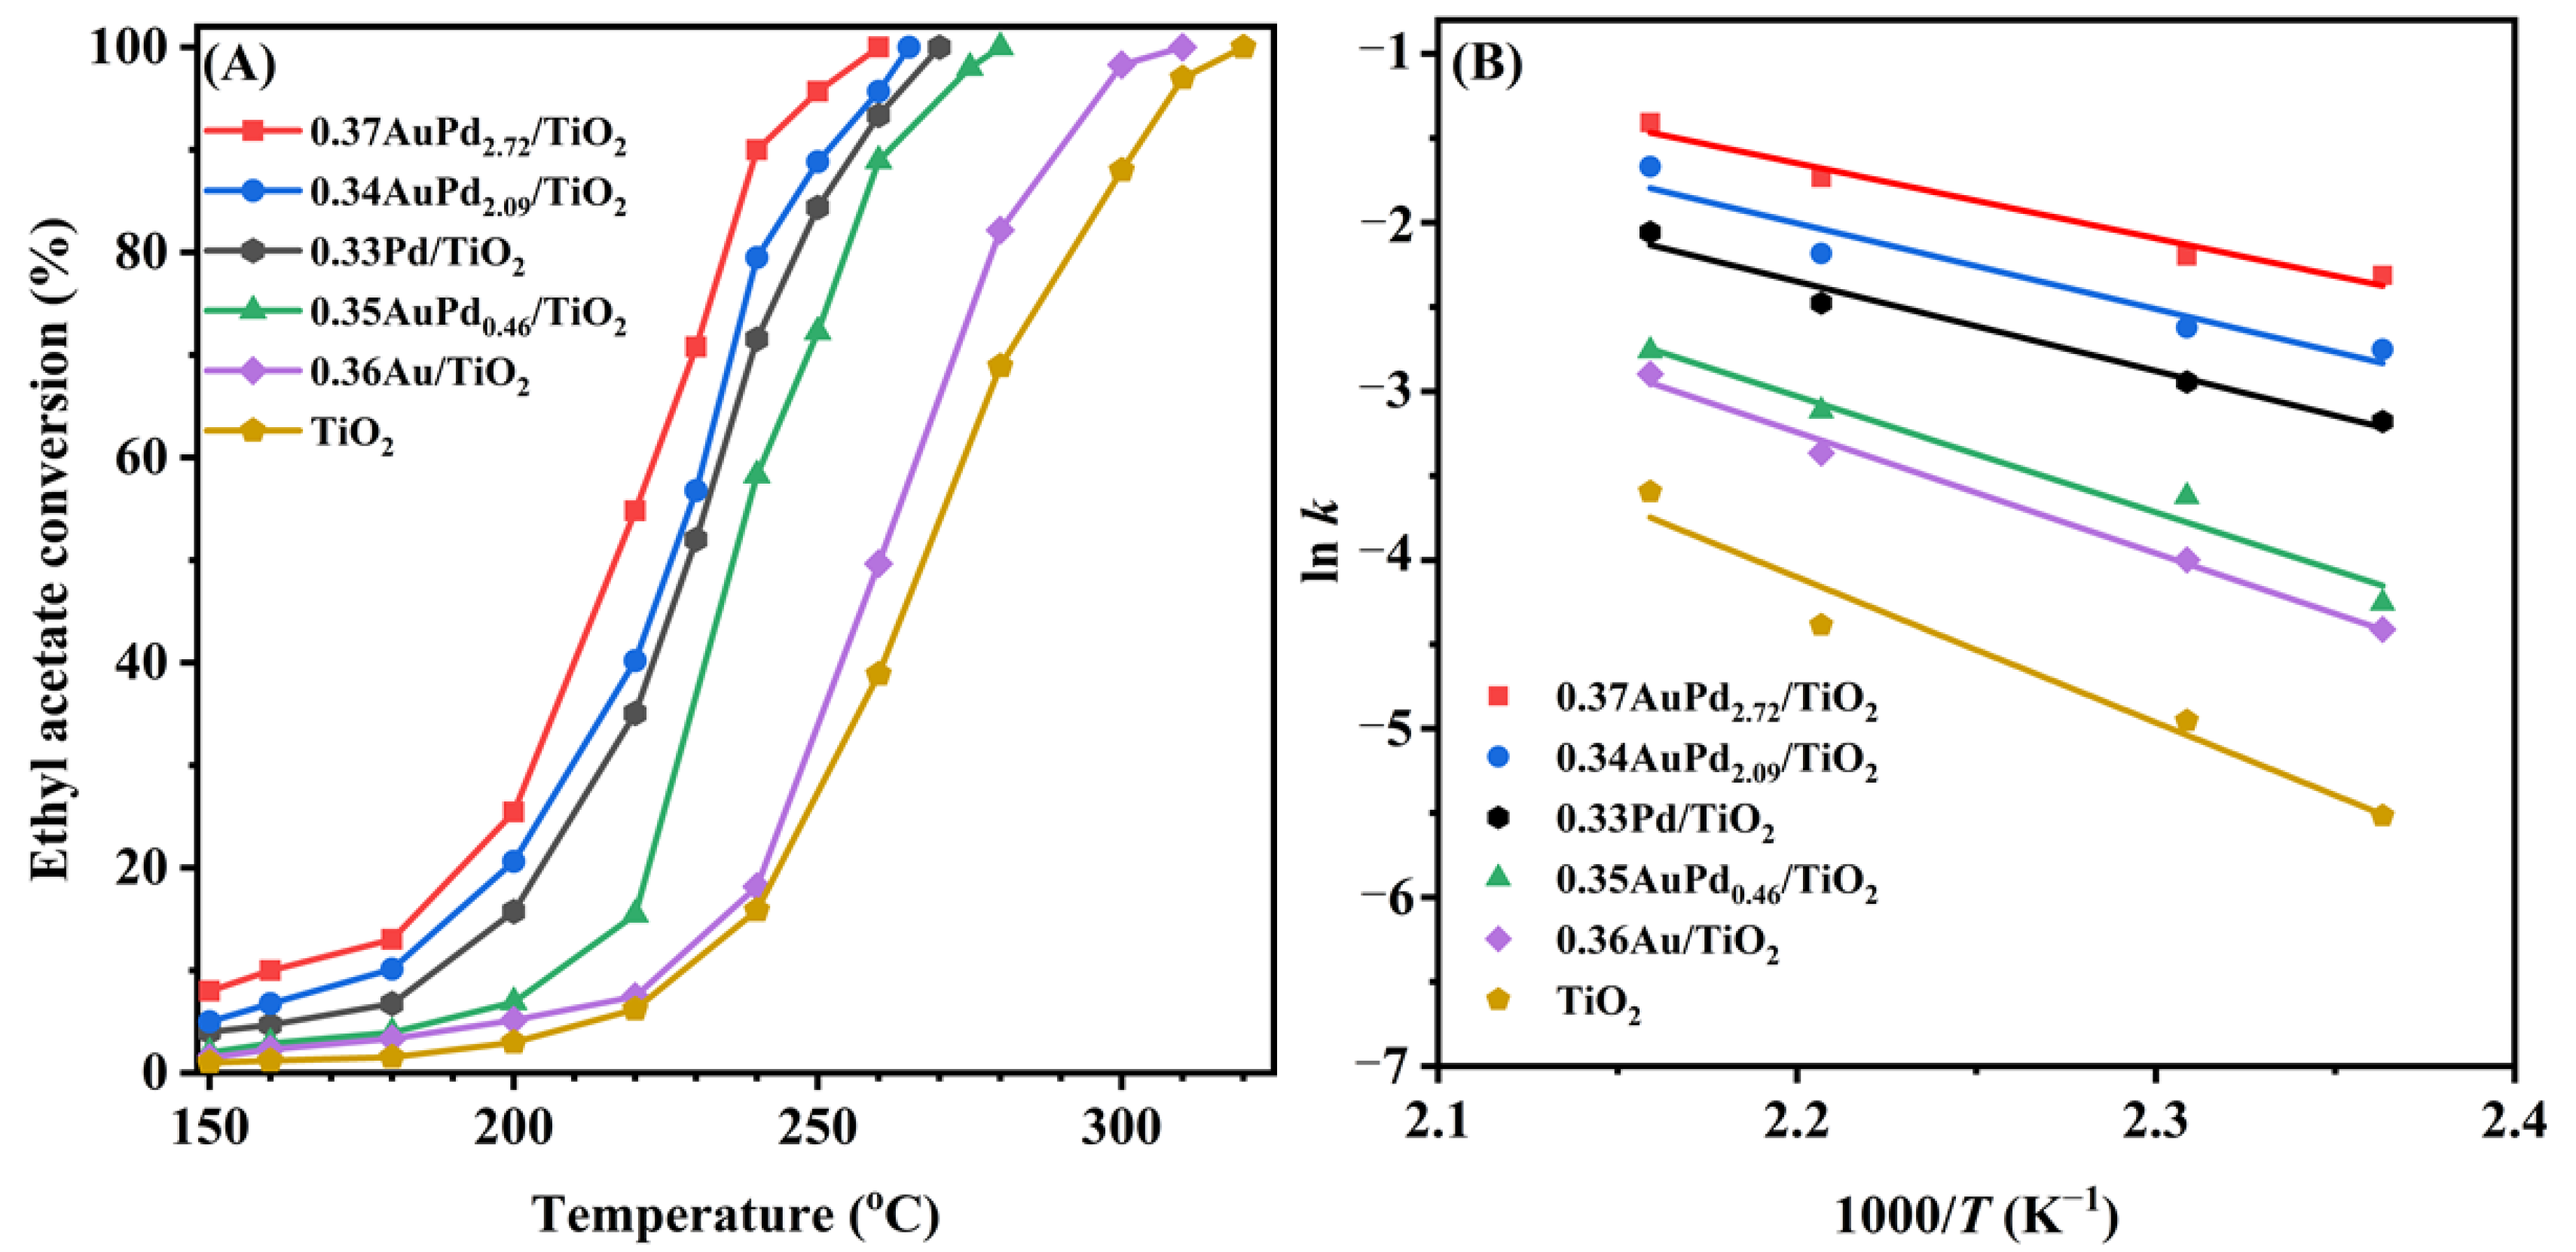
Ethyl acetate is a typical OVOC that was utilized as a probe molecule to assess the oxidation activity of the catalysts. Figure 5A displays the ethyl acetate conversions over the samples as a function of the temperature at SV = 40,000 mL/(g h). The T10%, T50%, and T90% were used to compare the catalytic activities of the samples, as summarized in Table 2. It can be observed that the catalytic activity was substantially higher over the sample when Pd NPs were loaded on the TiO2 surface than that over the sample when Au NPs were loaded. Especially, the supported Au–Pd bimetallic samples exhibited an excellent catalytic performance, and furthermore, the higher the Pd content, the better the ethyl acetate oxidation activity, with the 0.37AuPd2.72/TiO2 sample exhibiting the best catalytic activity (T10% = 160 °C, T50% = 217 °C, and T90% = 239 °C at SV = 40,000 mL/(g h)).
In order to better compare activities of the different catalysts, we calculated the turnover frequencies (TOFPd or TOFNoble metal) and the specific reaction rates, and the obtained results are listed in Table 2. It can be seen that the TOFPd (60.0–73.9 × 10⁻³ s−1), TOFNoble metal (14.1–109.7 × 10⁻³ s−1), and the specific reaction rates (97.5–113.8 μmol/(gPd s)) of the yAuPdx/TiO2 catalysts at 220 °C were significantly higher than the TOFPd (26.9 × 10⁻³ s−1), TOFNoble metal (11.9 × 10⁻³ s−1), and the specific reaction rate (48.3 μmol/(gPd s)) of the 0.33Pd/TiO2 catalyst. We also compared the catalytic activities for ethyl acetate oxidation of the 0.37AuPd2.72/TiO2 catalyst prepared in this work with other catalysts reported in the literature, as shown in Table S1. Apparently, the specific reaction rate at 220 °C (67.7 µmol/(gNoble metal s)) of 0.37AuPd2.72/TiO2 was higher than that (22.7 µmol/(gNoble metal s)) of 0.63 wt% Pd/UiO-66 [48], that (55.4 µmol/(gNoble metal s)) of 0.47 wt% Pd/Al2O3-pm [49], that (25.4 µmol/(gNoble metal s)) of 1 wt% Au/CuO [20], that (34 µmol/(gNoble metal s)) of 1 wt% Ru–5Cu/TiO2 [19], and that (8.6 µmol/(gNoble metal s)) of 1 wt% Pt/SnO2 [50], but lower than that (92.4 µmol/(gNoble metal s)) of 0.3 wt% Pd/SBA-15 [51] and that (107.1 µmol/(gPd s)) of 0.84 Au/CeO2 [52].
The kinetic results of ethyl acetate oxidation reveal that under the oxygen-enriched conditions, the oxidation of ethyl acetate follows a first-order toward the concentration of ethyl acetate [53]. Therefore, it is anticipated that ethyl acetate oxidation under oxygen-rich conditions (ethyl acetate/O2 molar ratio = 1/200) can be considered to follow the first-order reaction kinetics toward ethyl acetate concentration as follows: r = −kc = −Aexp(−Ea/(RT))c, where r, A, k, and Ea are the reaction rate (mol/s), pre-exponential factor, rate constant (s–1), and apparent activation energy (kJ/mol), respectively. The k value can be calculated using the reaction rates and reactant conversions at various temperatures. Figure 5B shows the Arrhenius curves for the oxidation of ethyl acetate over the samples at an SV of 40,000 mL/(g h), and Table 2 lists the apparent activation energies (Ea). The Ea value increased in the sequence of 0.37AuPd2.72/TiO2 (37 kJ/mol) < 0.34AuPd2.09/TiO2 (42 kJ/mol) < 0.33Pd/TiO2 (44 kJ/mol) < 0.35AuPd0.46/TiO2 (57 kJ/mol) < 0.36Au/TiO2 (60 kJ/mol) < TiO2 (72 kJ/mol). It has been widely known that the lower the Ea value, the easier the reaction proceeds. The 0.37AuPd2.72/TiO2 sample possessed the lowest Ea value, further demonstrating that this sample showed the maximal catalytic activity for oxidizing ethyl acetate.
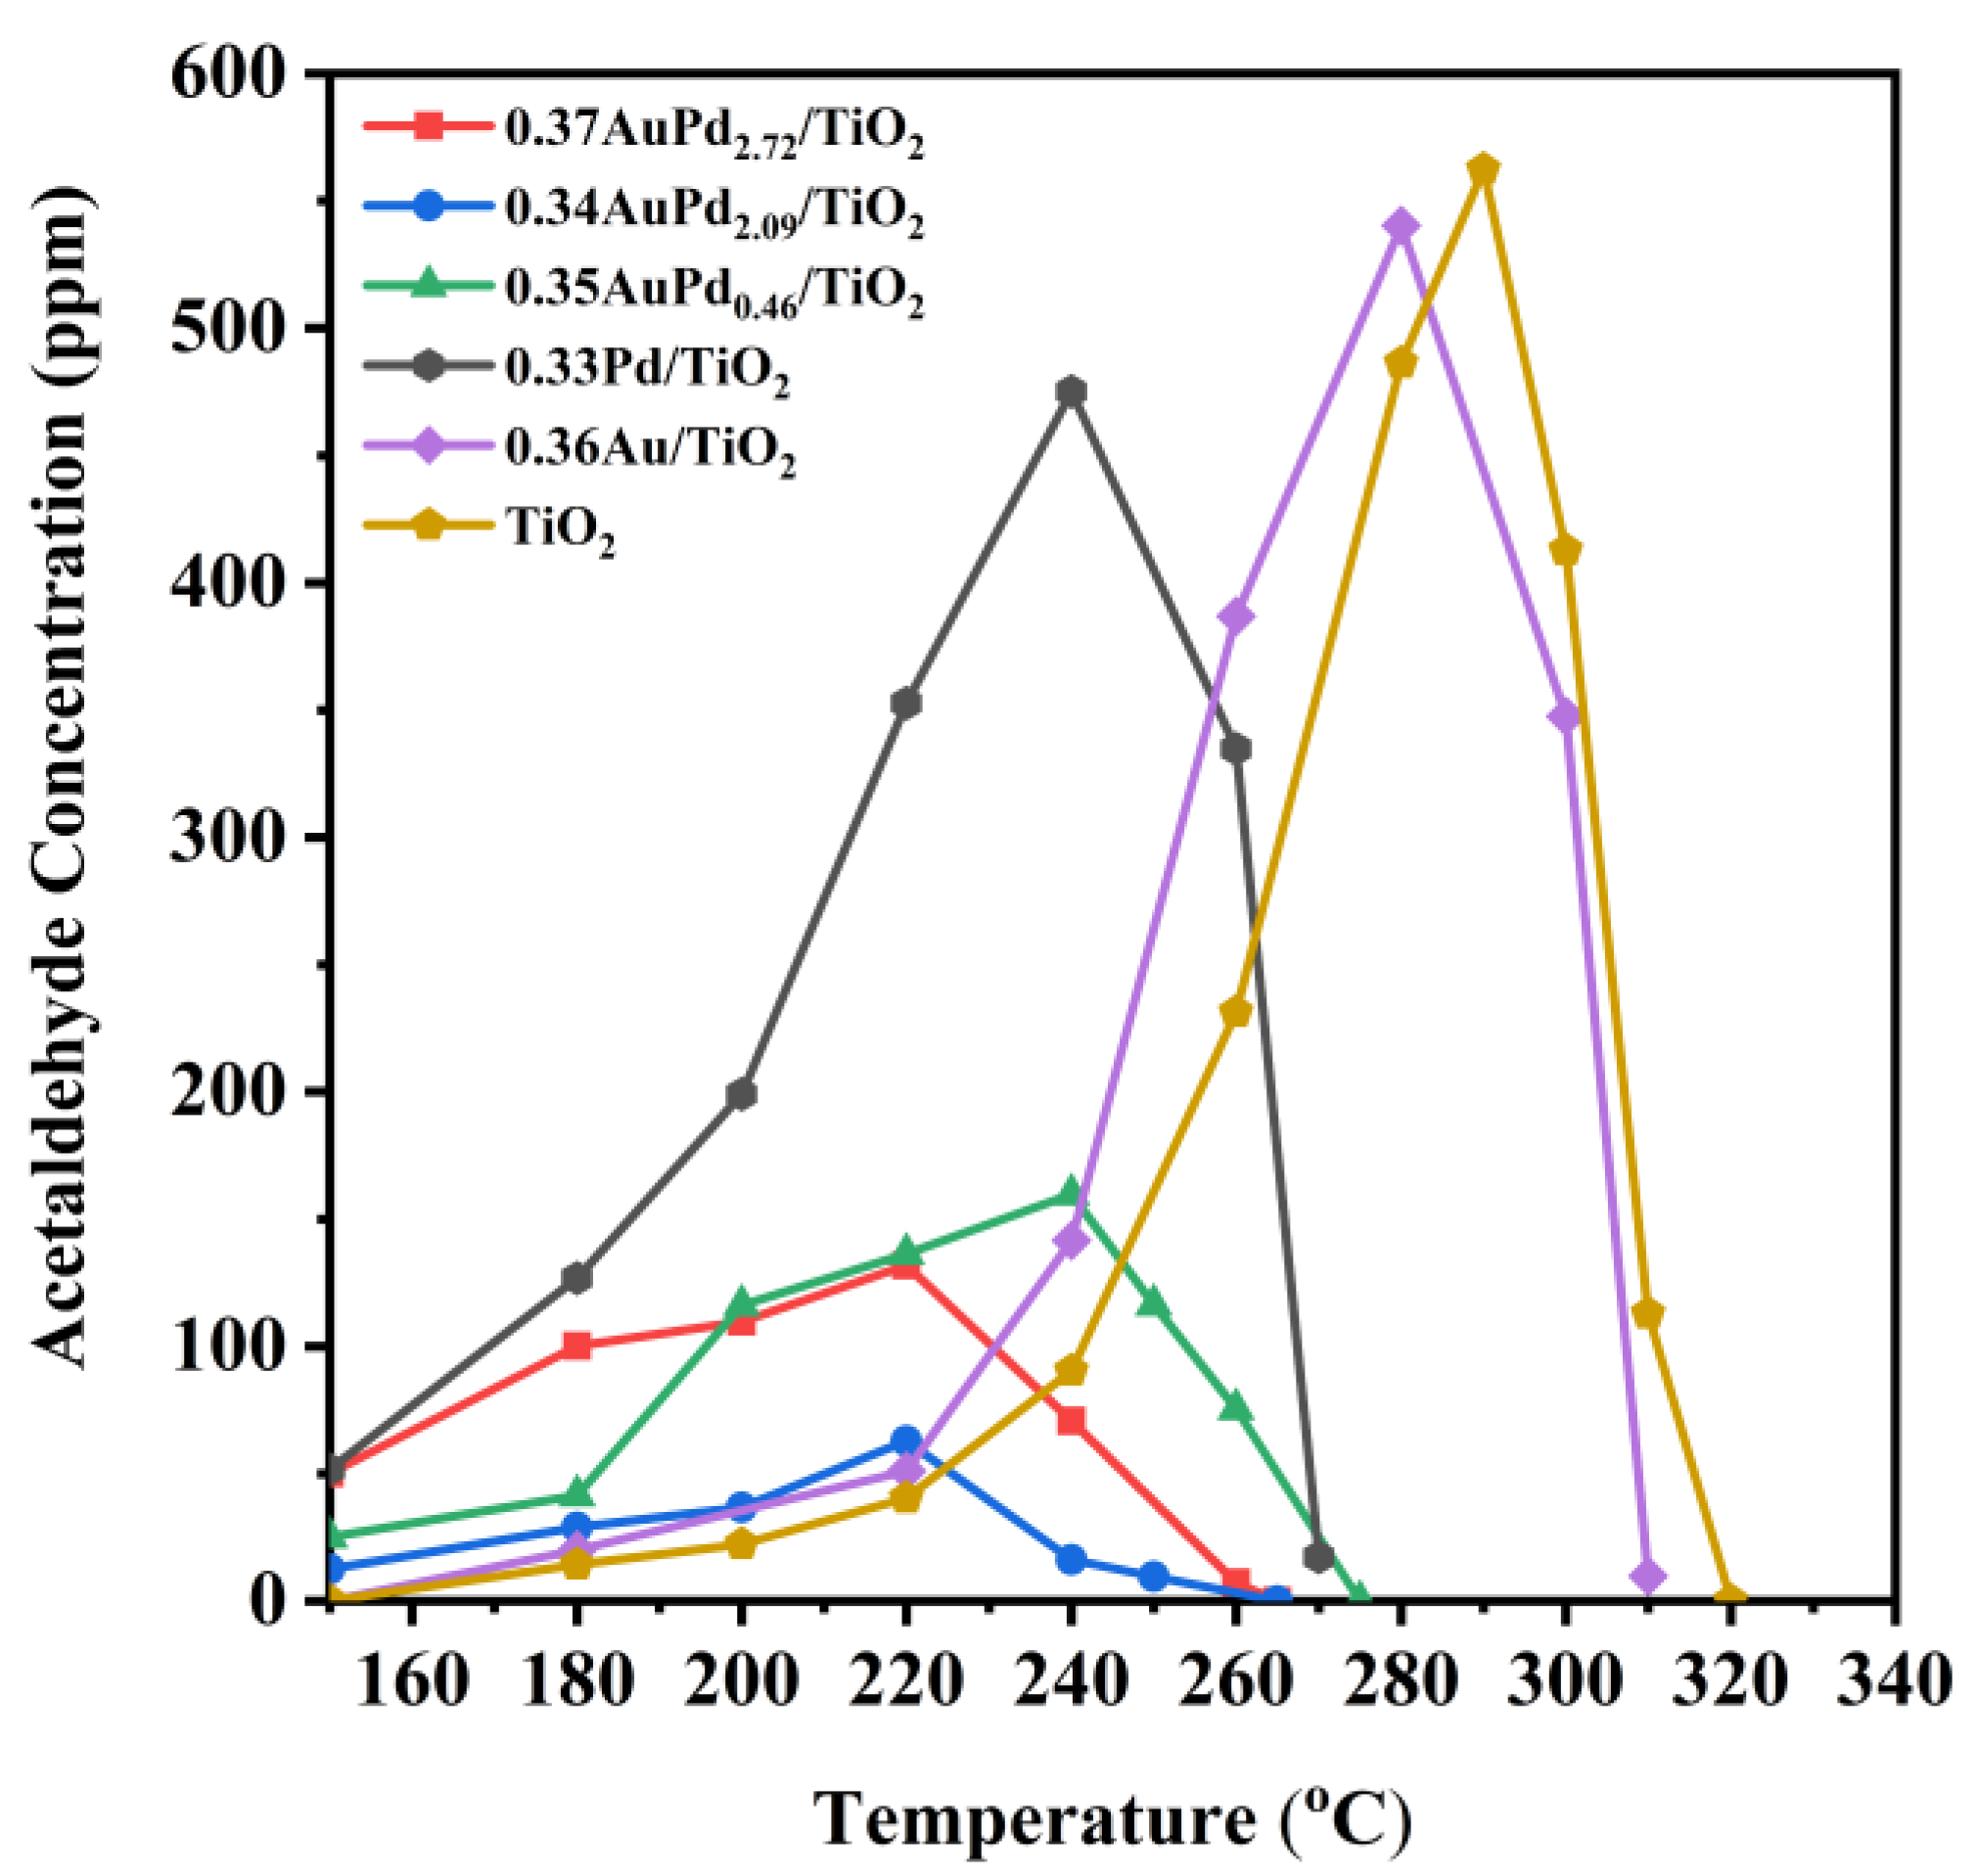
Other organic by-products were discovered to be produced over the 0.33Pd/TiO2, 0.36Au/TiO2, and yAuPdx/TiO2 samples during the ethyl acetate oxidation process. Figure 6 displays the concentration of acetaldehyde at different temperatures, in which acetaldehyde was the major byproduct formed over these samples in ethyl acetate oxidation. Obviously, the concentration of acetaldehyde formed over each sample was low at low ethyl acetate conversions, and when ethyl acetate was converted, higher concentrations of acetaldehyde were produced over the TiO2, 0.33Pd/TiO2, and 0.36Au/TiO2 samples, which first reached their maximal values and then decreased until the acetaldehyde intermediate disappeared. However, the amounts of acetaldehyde that formed over the supported Au–Pd bimetallic samples were significantly reduced, with the acetaldehyde concentration that formed over the 0.34AuPd2.09/TiO2 sample being less than 60 ppm at all of the reaction temperatures. Ethyl acetate might be totally oxidized to CO2 and H2O, but a portion of ethyl acetate formed the intermediate products at low temperatures, including acetaldehyde, ethanol, and acetic acid [13]. The decrease in the amount of generated acetaldehyde over the AuPdx-loaded samples was attributed to the conversion of the formed acetaldehyde to acetic acid [54], which avoids generating intermediates with secondary contamination.

2.5. Effects of H2O and SO2 on Catalytic Activity and Intermediate Selectivity

Since exhaust gas frequently contains water vapor under actual working circumstances, and furthermore, water is also one of the products of VOCs oxidation, it is hence necessary to examine the high-temperature stability and water resistance of the typical samples. Figure 7 shows the influence of water vapor on the catalytic activity and selectivity of the 0.34AuPd2.09/TiO2, 0.33Pd/TiO2, and 0.36Au/TiO2 samples for ethyl acetate oxidation at SV = 40,000 mL/(g h). The 0.34AuPd2.09/TiO2 and 0.33Pd/TiO2 samples possessed good stability in the absence of water, whereas the 0.36Au/TiO2 sample was less stable. After the introduction of 5 vol% water vapor, the catalytic ethyl acetate oxidation activity of each sample showed a boosting effect, and the conversion of ethyl acetate was improved by about 10, 15, and 14%, respectively. Ethyl acetate conversions over the 0.34AuPd2.09/TiO2 and 0.33Pd/TiO2 samples were restored to their initial levels after the supply of H2O was cut off; however, the activity of 0.36Au/TiO2 declined by around 5%, which was associated with its poor stability. The distributions of the major byproducts before and after the introduction of water were compared, as shown in Figure 7D. It was evident that more by-products were produced with the addition of water, in which there was a slight rise in the amount of by-products over 0.34AuPd2.09/TiO2, an increase in the amount of acetaldehyde over 0.33Pd/TiO2, and increases in the amounts of acetaldehyde and ethanol over 0.36Au/TiO2.
In general, the presence of water vapor decreases the conversion of ethyl acetate over the sample, the hydrolysis of ethyl acetate increases the formation of acetic acid and ethanol, and the adsorption of hydroxyl groups produced by the hydrolysis at the oxygen vacancies inhibits the production of surface oxygen and prevents further conversion of intermediates to acetates, thus decreasing the yield of carbon dioxide [19,55,56]. However, our earlier research work [21,57] demonstrated that the addition of water also boosted the catalytic activity, because new OOH species that formed on the catalyst surface could generate more reactive oxygen species. This finding was supported by the isotopic H218O analysis results, which also suggested that the reaction mechanism might be altered in the case of water addition, i.e., shifting from the Mars–van Krevelen (MvK) mechanism to the coexistence of MvK and Langmuir–Hinshelwood (L-H) mechanisms [58]. Therefore, the presence of water not only facilitated the conversion of ethyl acetate but it also increased the concentration of the by-products produced via the hydrolysis of ethyl acetate. Furthermore, the generation of further by-products was prevented over the supported Au–Pd bimetallic samples.
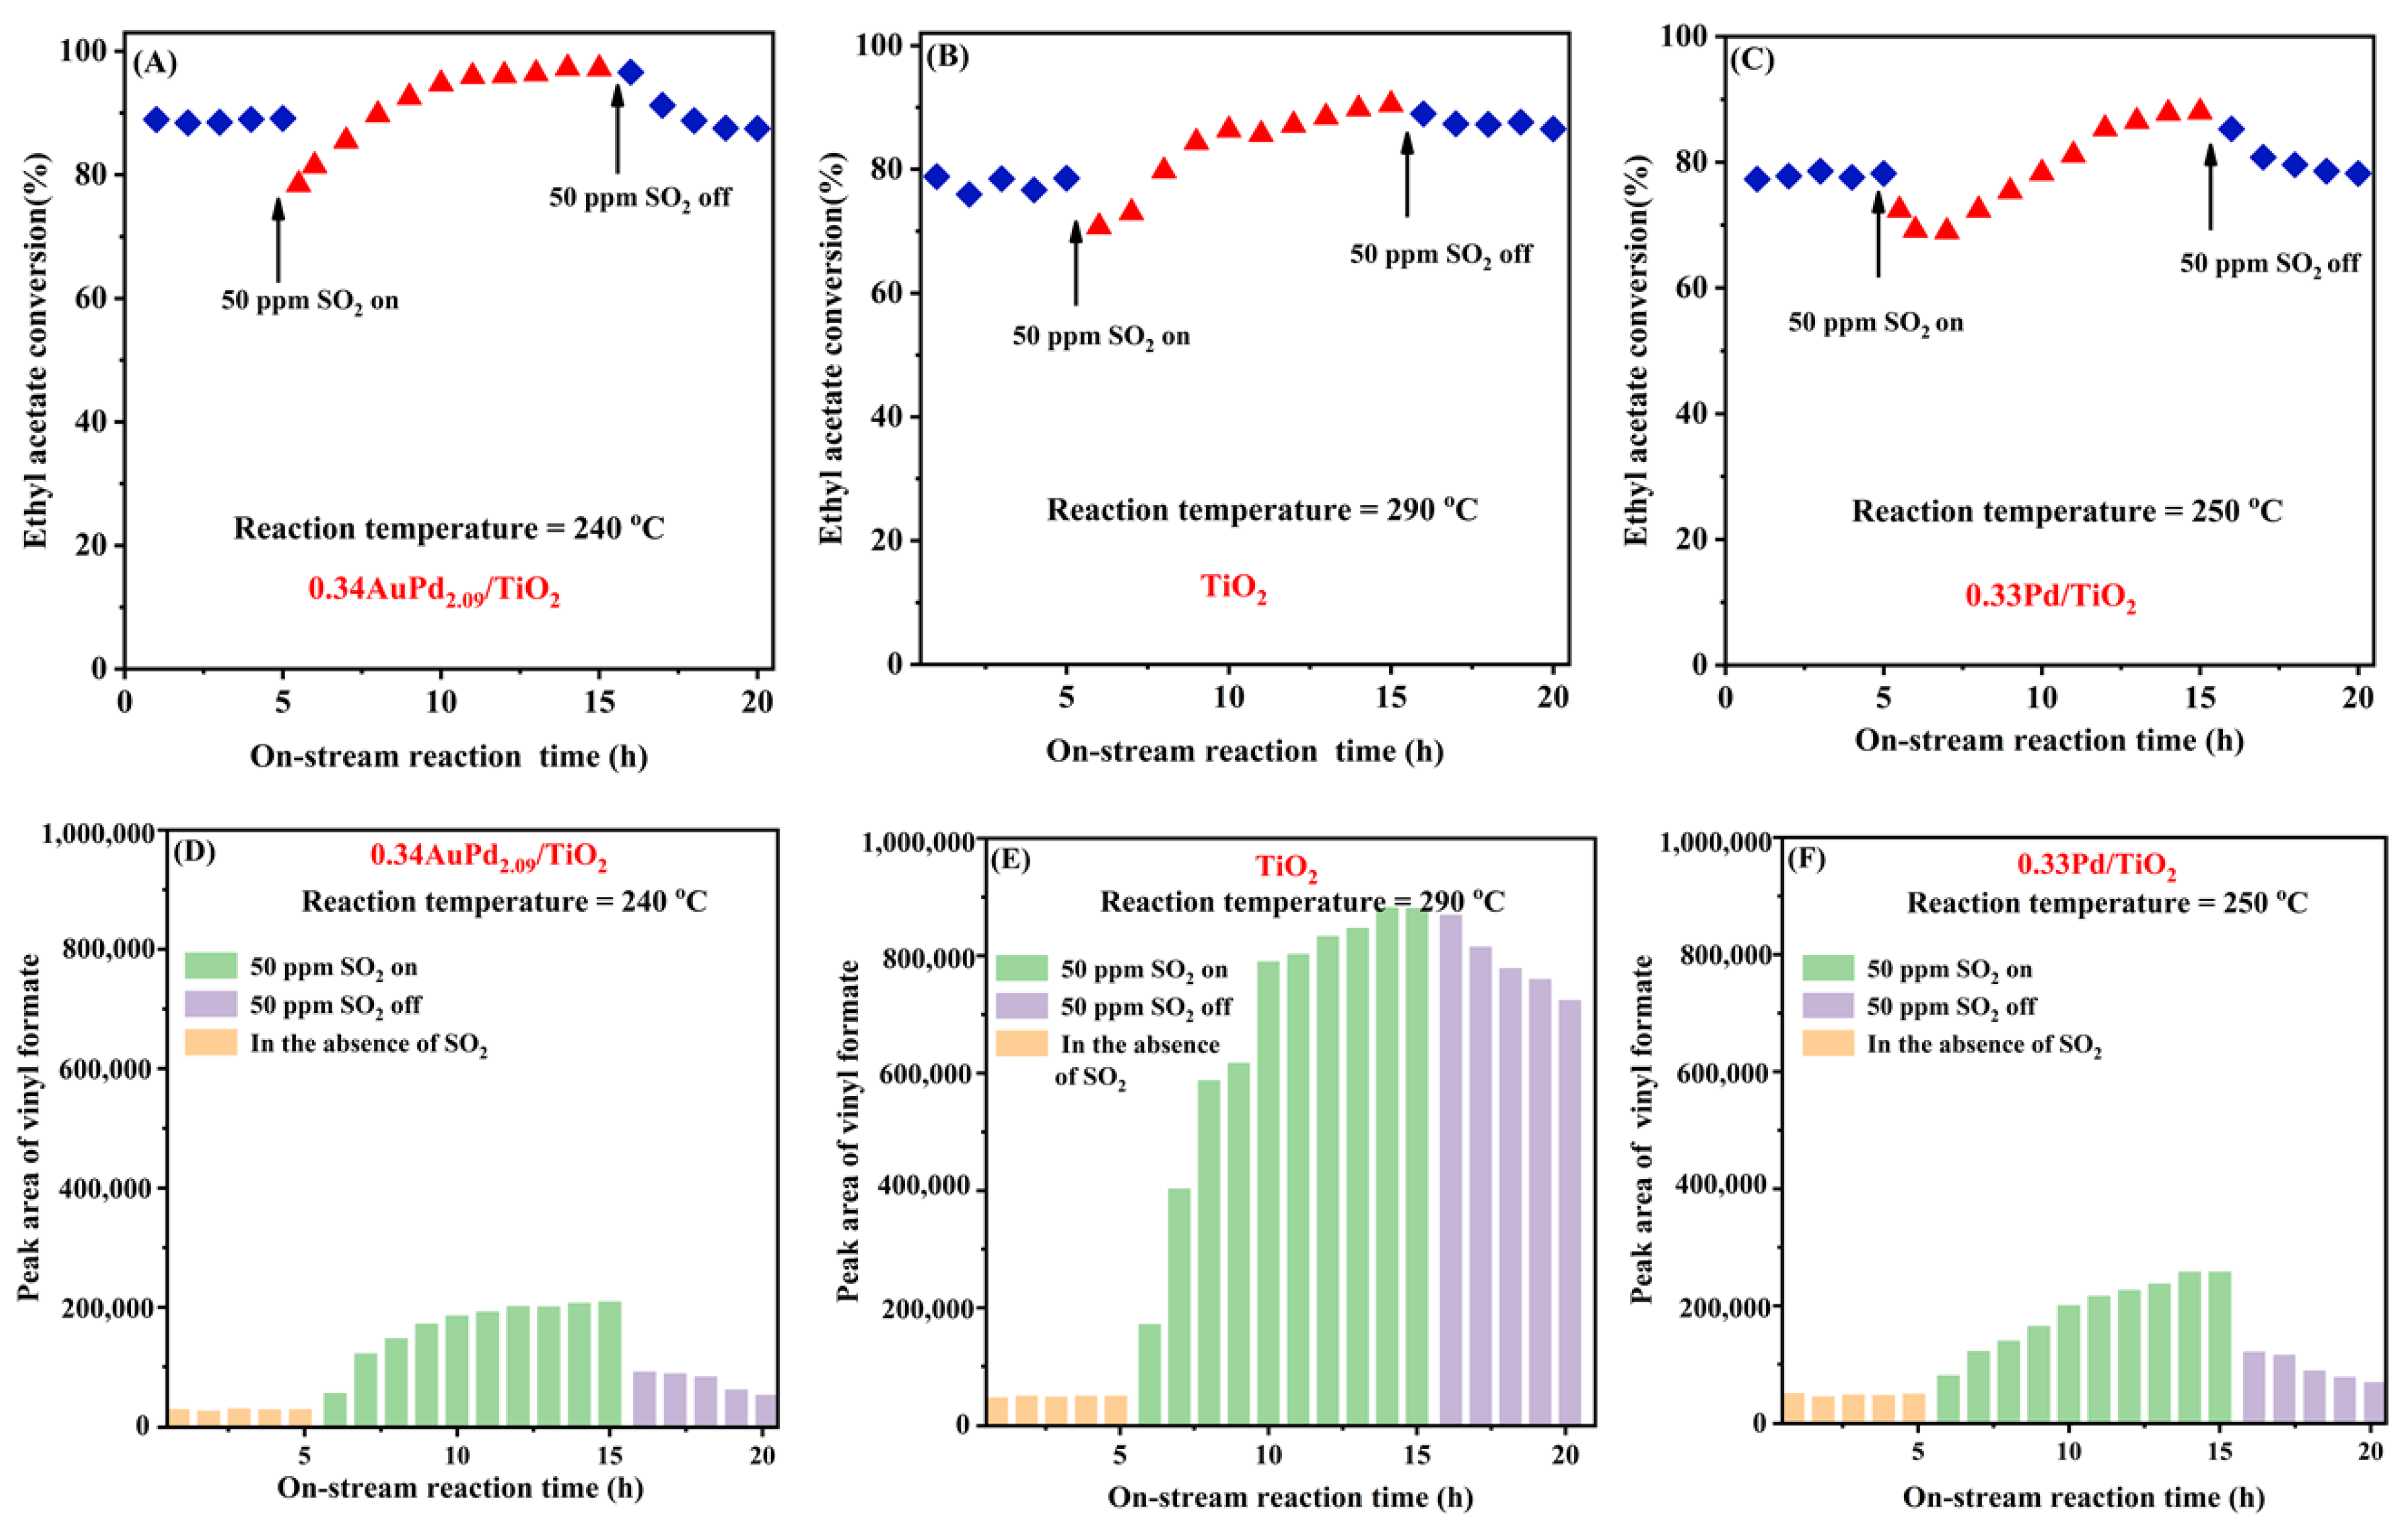
The SO2 present in the exhaust gas may significantly affect the stability of a catalyst in the real industrial process. To investigate SO2 resistance of the typical catalysts, we determined the effect of 50 ppm SO2 on the catalytic activity of the 0.34AuPd2.09/TiO2, 0.33Pd/TiO2, and TiO2 samples for ethyl acetate oxidation at an SV of 40,000 mL/(g h), and the results are shown in Figure 8. The conversion of ethyl acetate over the 0.34AuPd2.09/TiO2 sample initially decreased by around 10% with the addition of 50 ppm SO2, but it gradually increased to 10% higher than that in the absence of SO2. After cutting off SO2, the activity was recovered to its initial level, demonstrating that the changes in ethyl acetate conversion induced before and after SO2 introduction were reversible, and comparable phenomena were also observed over the 0.33Pd/TiO2 and TiO2 samples. At the same time, the GC results clearly showed that the level of one of the by-products formed by ethyl acetate oxidation was progressively growing, while the contents of the other by-products (e.g., acetaldehyde and ethanol) were gradually dropping. In particular, numerous by-products were gradually produced over the TiO2 sample. After the SO2 was cut off, the catalytic activity and intermediate selectivity of the catalyst were recovered, but the by-products over TiO2 were only slowly decreased. It is speculated that the introduction of SO2 promotes the conversion of ethyl acetate and alters the reaction pathway of ethyl acetate oxidation over this supported bimetallic catalyst. Over the 0.34AuPd2.09/TiO2 sample, the generation of even more by-products was prevented.

2.6. Products Distribution of Ethyl Acetate Oxidation in the Absence or Presence of SO2

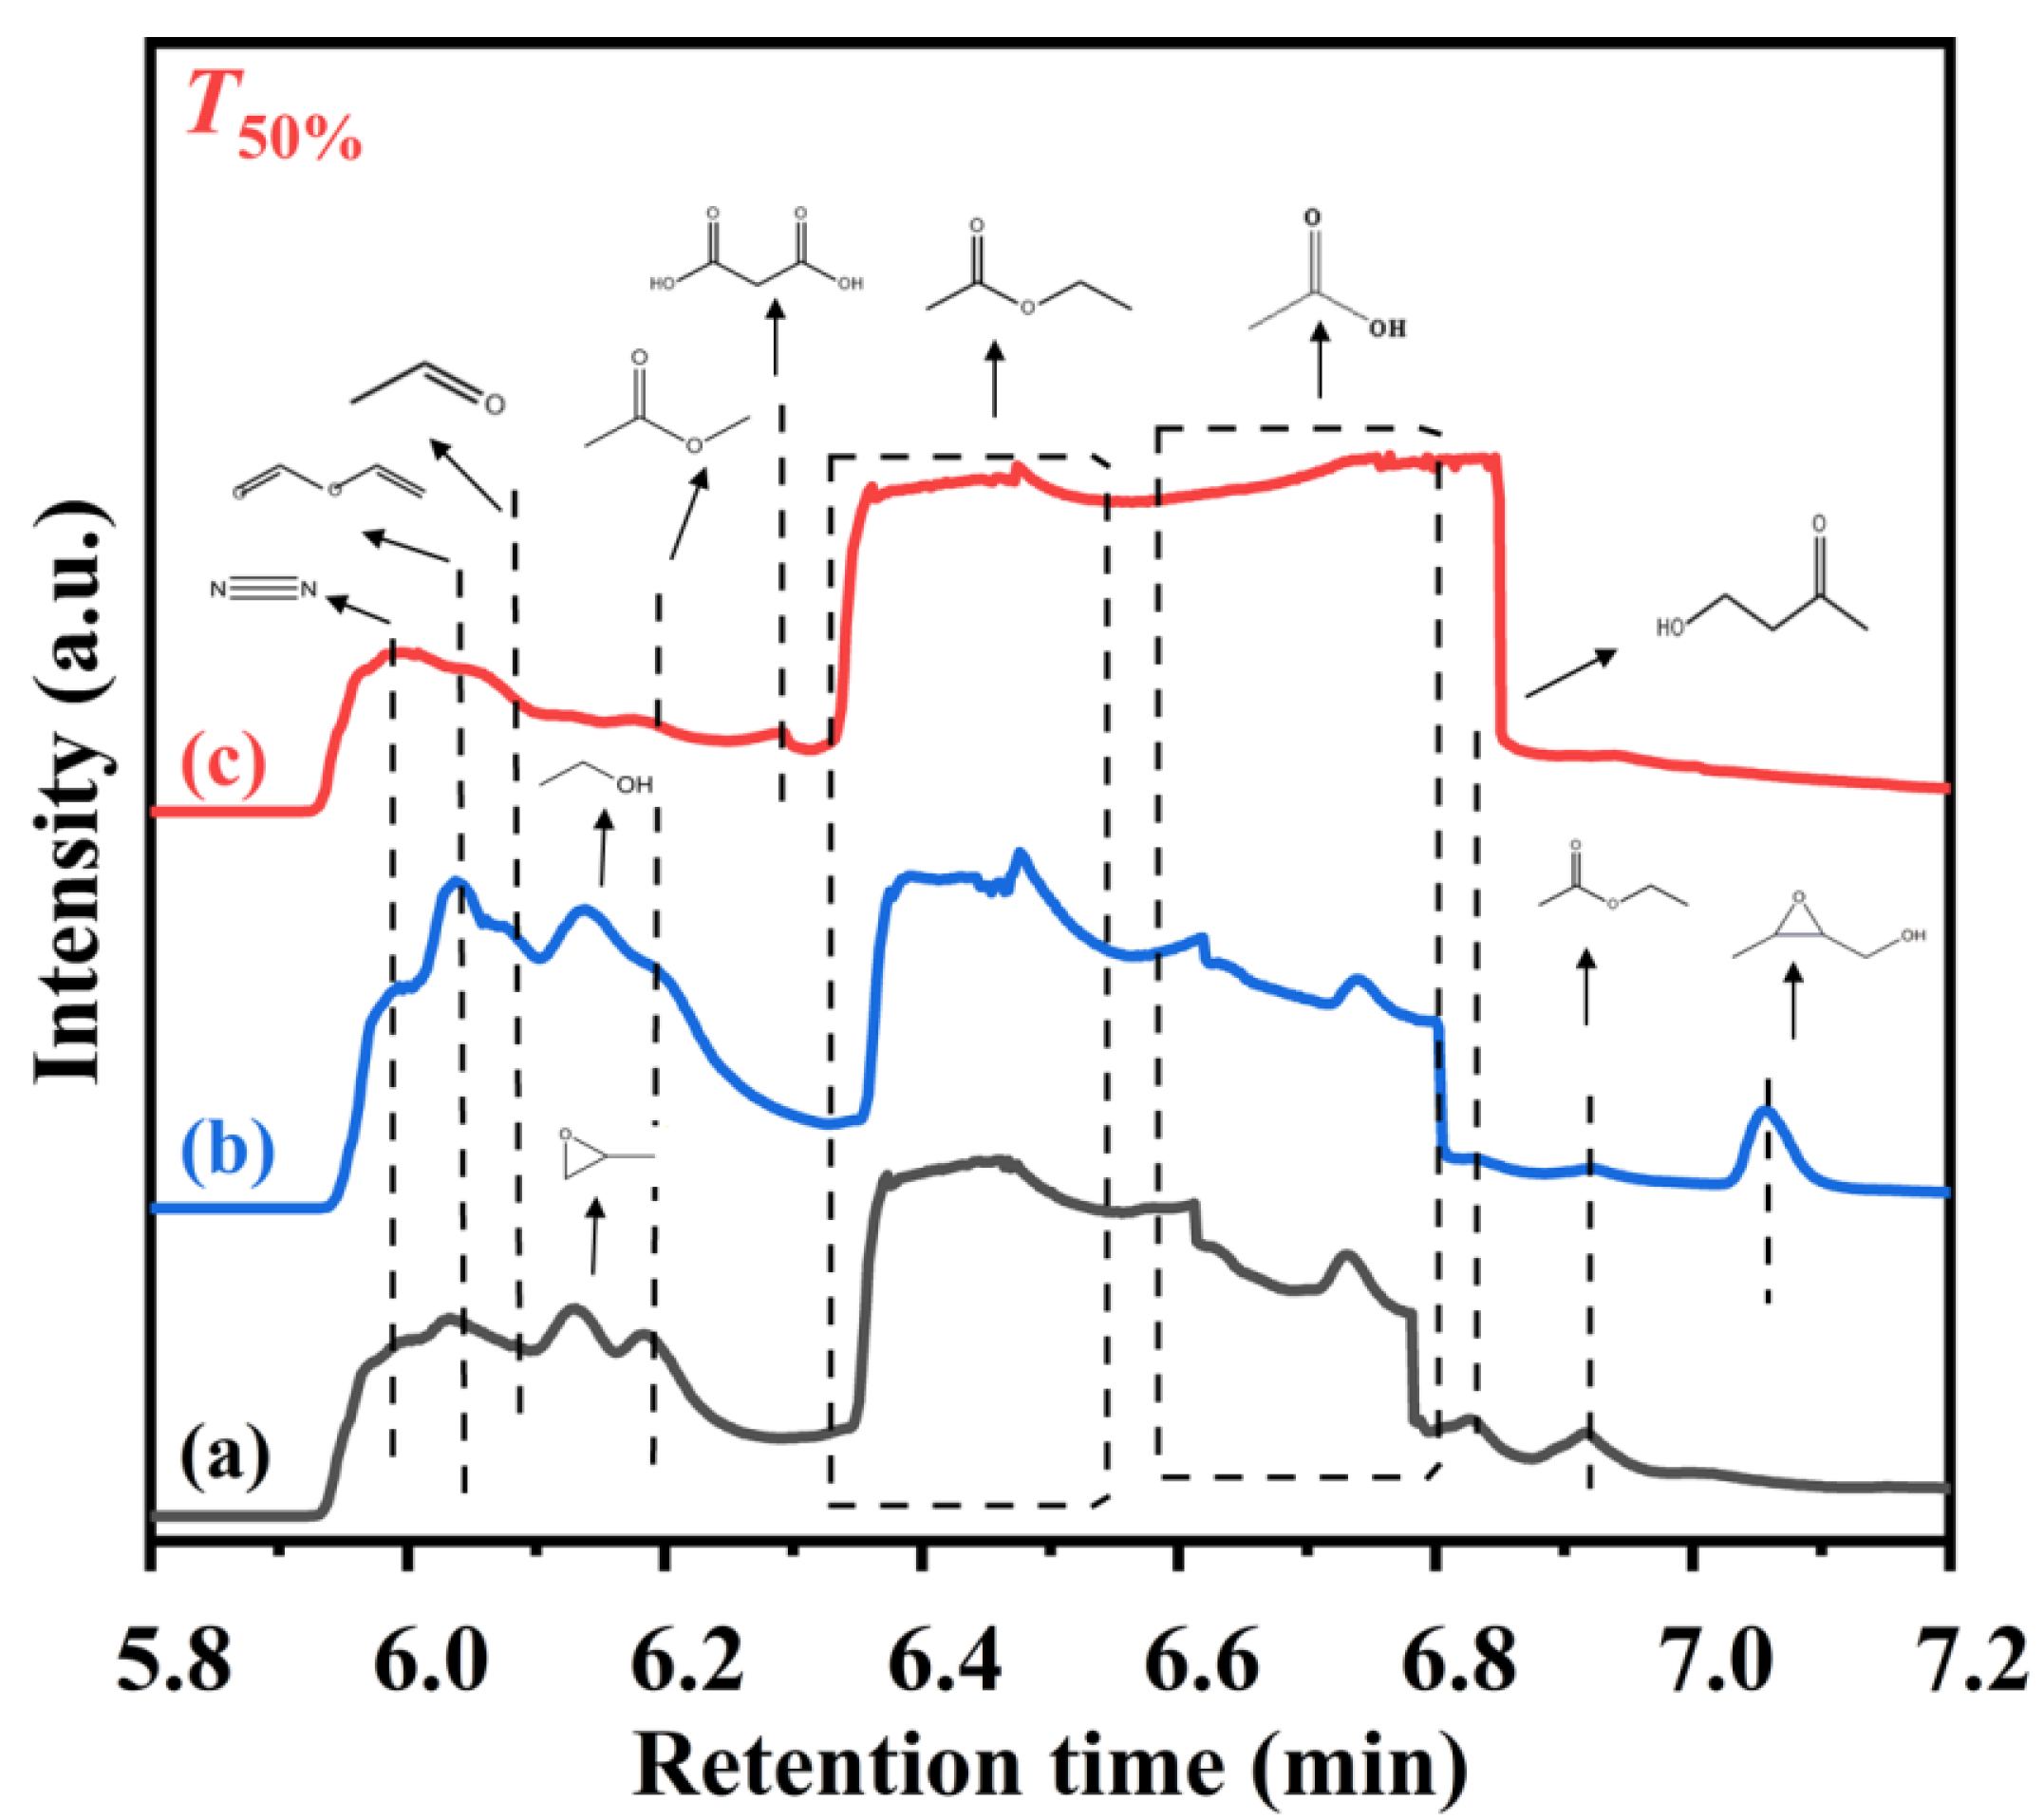
As shown in Figure 9, in order to better understand the catalytic oxidation of ethyl acetate, we attempt to identify the potential intermediates formed over the TiO2, 0.34AuPd2.09/TiO2, and 0.33Pd/TiO2 samples at T50% using the GC/MS technique. In addition to the main intermediates of acetaldehyde (CH3CHO), ethanol (CH3CH2OH), and acetic acid (CH3COOH), the reaction of ethyl acetate and O2 over TiO2 gave rise to vinyl formate (HCOOCH=CH2), propylene oxide (C3H6O), methyl acetate (CH3COOCH3), and 4-hydroxy-2-butanone (CH3COCH2CH2OH). Over the 0.33Pd/TiO2 sample, in addition to the intermediate products similar to those over TiO2, there was also (3-methyloxiran-2-yl)methanol (C4H8O2). Over the 0.34AuPd2.09/TiO2 sample, however, both amounts of the intermediates produced and intensities of the corresponding signal peaks were dramatically reduced. Only the reactant (i.e., ethyl acetate) and the by-products (e.g., vinyl formate, acetic acid, and propanedioic acid (HOOCCH2COOH)) were detected, which was consistent with the GC results. As a result, the AuPd2.09 NPs in the 0.34AuPd2.09/TiO2 sample could efficiently convert acetaldehyde to acetic acid by changing the path of ethyl acetate conversion, and lessening the generation of the by-products.
Figure S2 displays the possible reaction intermediates detected during the ethyl acetate oxidation process over the 0.34AuPd2.09/TiO2, TiO2, and 0.33Pd/TiO2 samples in the presence or absence of SO2 at T90% and SV = 40,000 mL/(g h) for 5 h of ethyl acetate oxidation. In conjunction with the GC findings, the introduction of SO2 increased the formation of vinyl formate, while it inhibited the production of the by-products such as propylene oxide and methyl acetate. The GC/MS data showed the decreased peak areas of propylene oxide, methyl acetate, and ethyl acetate, but the peak area of vinyl formate did not increase, which was probably due to its weak adsorption. According to the findings, the increased conversion of ethyl acetate in the presence of SO2 could be caused by the following: (i) The five-coordinated titanium atoms (Ti5c) and two-coordinated oxygen atoms on the surface of anatase TiO2 react more readily with sulfur dioxide to generate titanium sulfate [59], which covers the active sites on TiO2 and prevents the transformation of ethyl acetate to acetaldehyde, propylene oxide, and methyl acetate; (ii) SO2 is adsorbed on the catalyst surface, which hinders the adsorption and further conversion of ethyl acetate; and (iii) SO2 is involved in the oxidation of ethyl acetate, which results in the conversion of ethyl acetate to a new by-product. Therefore, the introduction of SO2 changed the pathway of ethyl acetate oxidation, resulting in a partial conversion of ethyl acetate to vinyl formate. The addition of precious metals effectively reduced the poisoning of the active sites and avoided the generation of more by-products.

2.7. Intermediates of Ethyl Acetate Oxidation and Possible Reaction Mechanisms

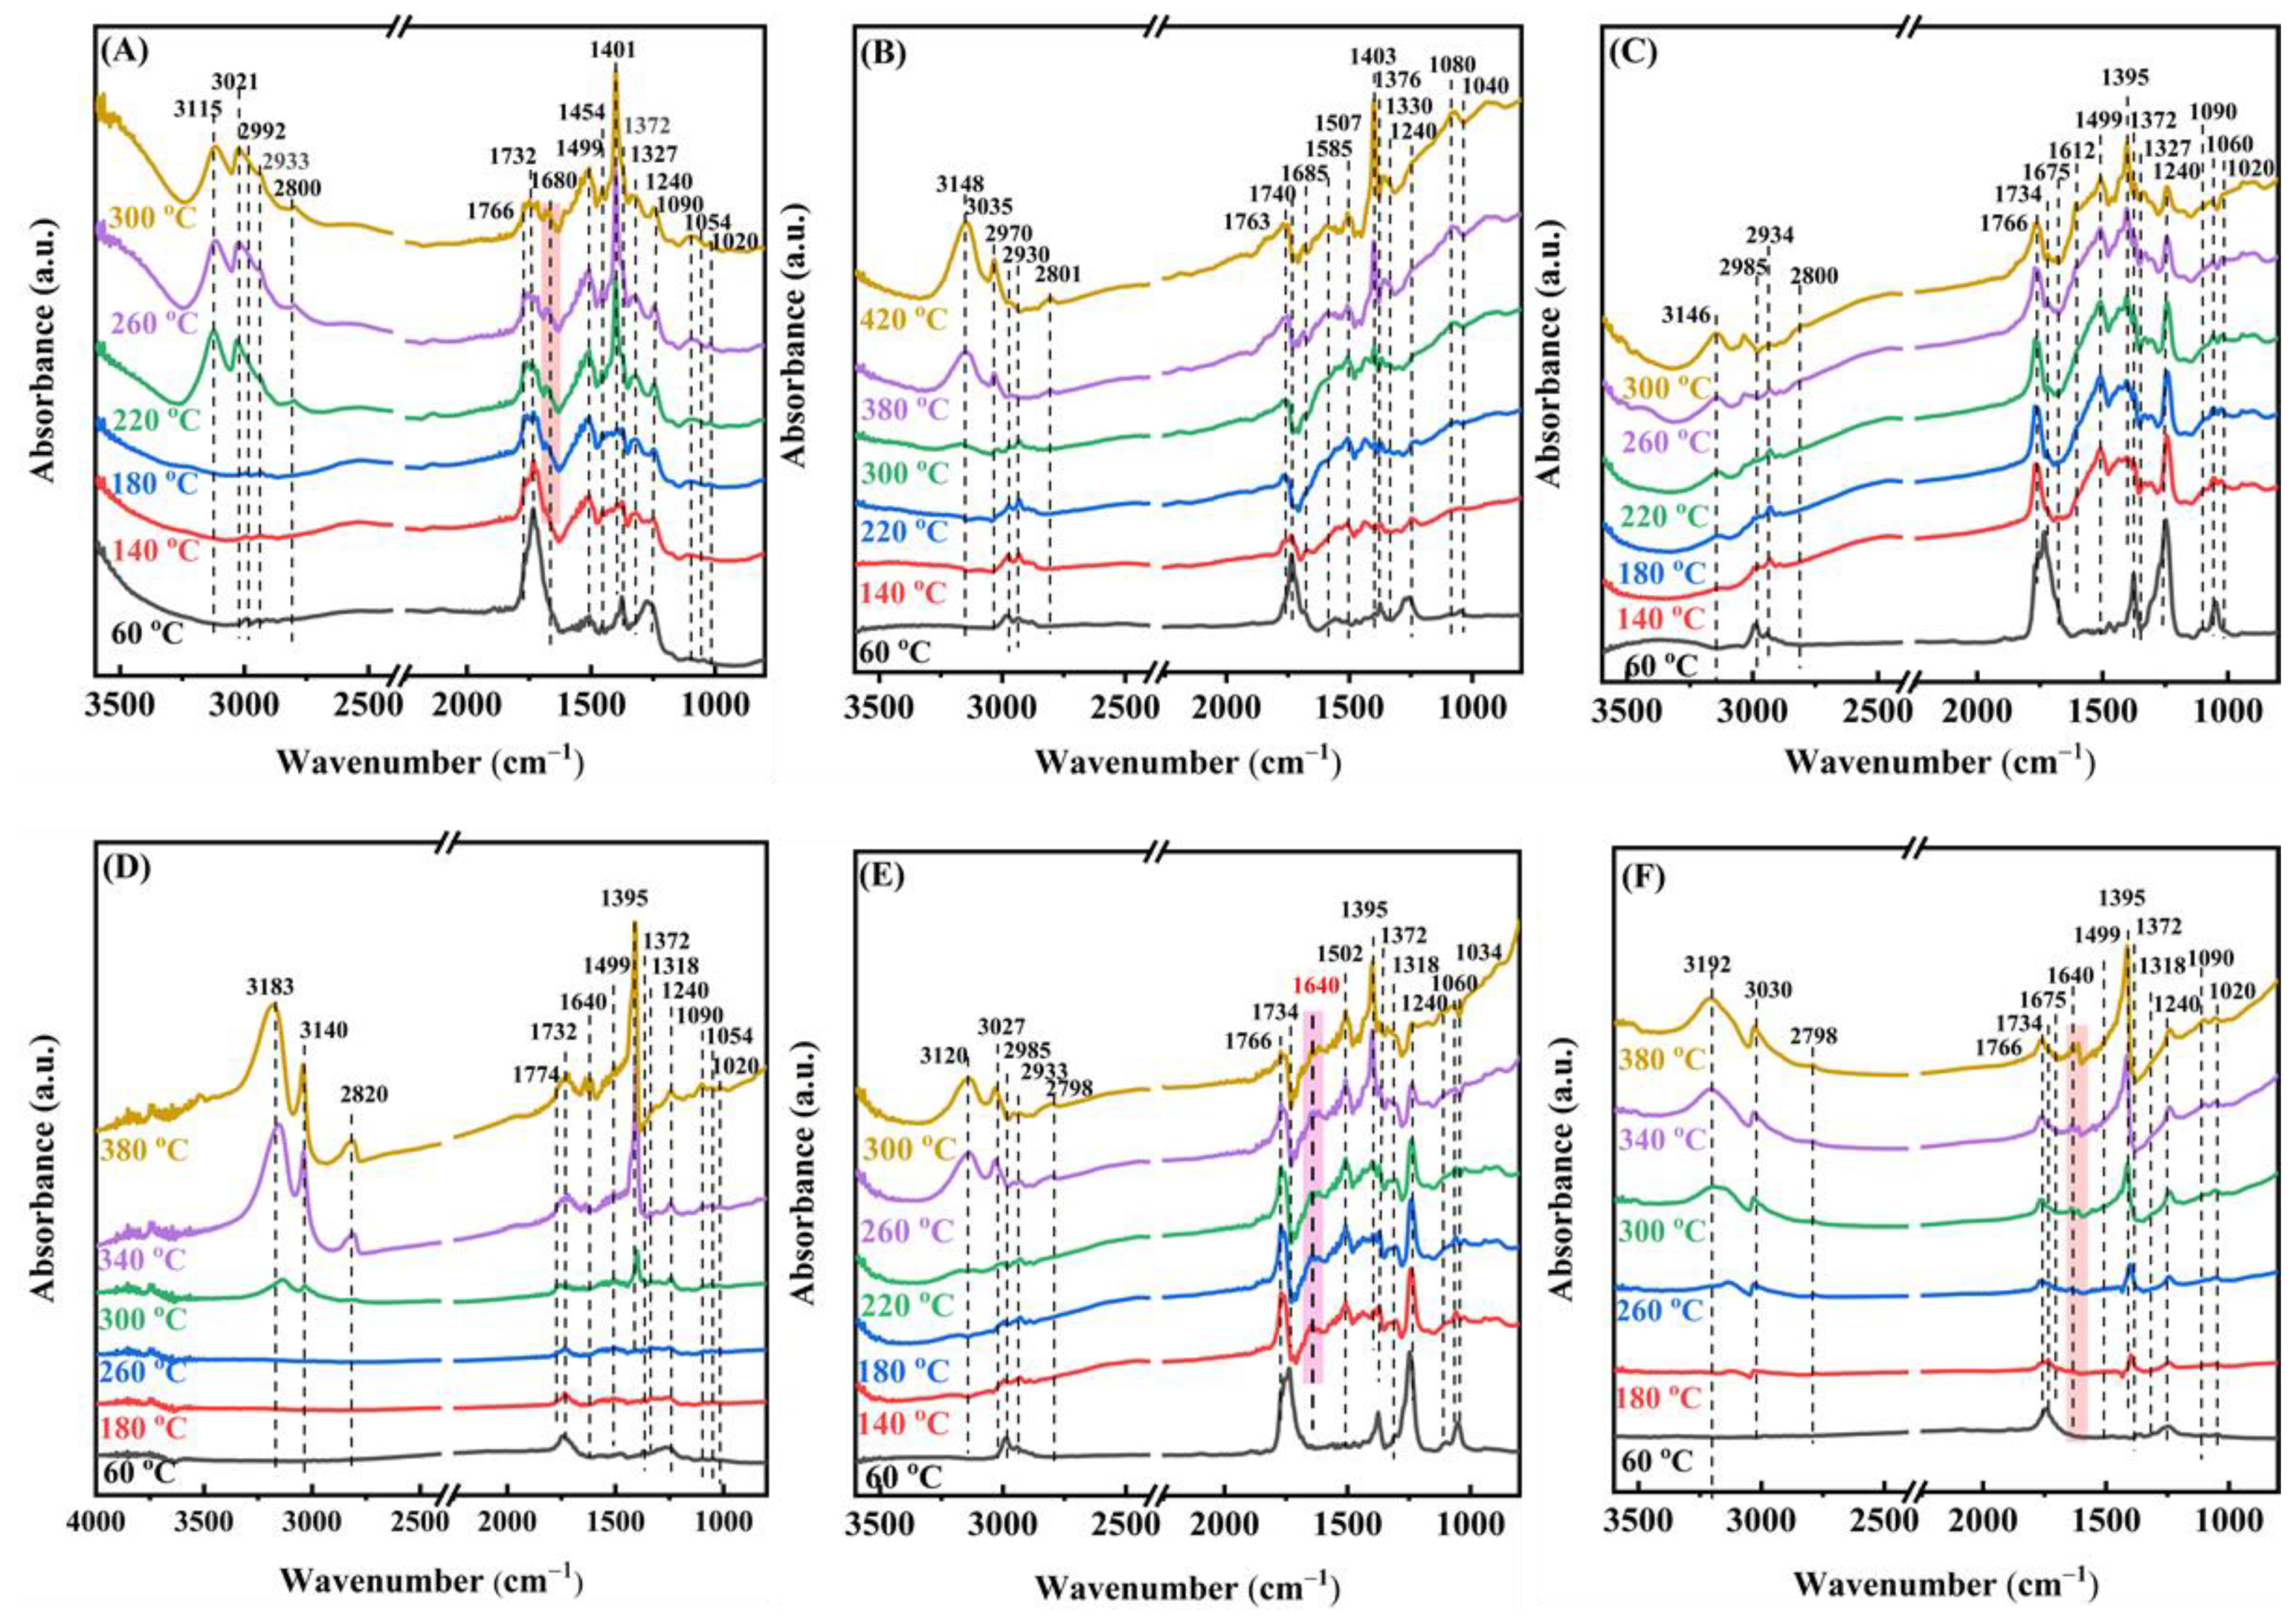
Moreover, we applied the in situ DRIFTS technique to further probe the surface species generated and their alterations during the oxidation of ethyl acetate over the samples. The gas mixture used in the in situ DRIFTS study was the same as that utilized in the activity assessment. After the samples were activated in the oxygen flow for 1 h, in situ DRIFTS spectra of the adsorbed species on the surface of the 0.33Pd/TiO2, 0.34AuPd2.09/TiO2, and 0.36Au/TiO2 samples were recorded at different temperatures, as shown in Figure 10. At 60 °C, the vibration absorption bands at 1060 and 1240 cm−1 corresponded to the ethyl acetate C−O stretching vibrations (v(C−O) and ν(CO)) [48], the ones at 1375 and 1454 cm−1 were assigned to the symmetric bending vibration (δs(CH3)) and asymmetric bending vibration (δas(CH3)) of methyl, respectively. The band at 1734 cm−1 was ascribed to the C−O stretching vibration ((νasC=O)) of ethyl acetate, and the vibrational absorption bands at 2933 and 2992 cm−1 corresponded to the symmetric stretching vibration (νs(CH3)) and the asymmetric stretching vibration (νas(CH3)) of methyl [60], respectively.
The band corresponding to ethyl acetate gradually vanished as the temperature rose, the band at 1247 cm−1 corresponded to the C−O stretching vibration (ν(C−O)) of the surface alcoholates [19], and the one at 1327 cm−1 was due to the CH3 stretching vibration of the surface acetates [48]. The bands at 1401 and 1463 cm−1 were assigned to the symmetric stretching vibrations of COO (νs(C=O)), indicating the generation of acetates and formates, and the broad multibands located in the range of 1472–1589 cm−1 were assigned to the antisymmetric stretching vibrations of overlapping COO (νas(C=O)) in surface acetate and formate [19,61]. In addition, the absorption band at 1680 cm−1 was attributed to the C=O stretching vibration of aldehyde (νas(C=O)) [62], and the one at 1766 cm−1 was ascribed to the C=O stretching vibration of acetic acid (νas(C=O)) [61]. The band at 1020 cm−1 was assigned to the symmetric stretching vibration (νs(C−O−C)) of the C−O−C bond in propylene oxide [63]. The signal band of methyl acetate was similar to that of ethyl acetate, and none of the other by-products, such as vinyl formate, were detected, which was possibly due to their low concentrations. Thus, it may be inferred that ethanol, aldehyde, and acetic acid are the main intermediate products of ethyl acetate oxidation. It is interesting to notice that compared to the other samples, the C=O stretching vibration band of acetaldehyde at 1680 cm−1 vanished and the C−H stretching vibration band of aldehyde at 2800 cm−1 was greatly reduced on the 0.34AuPd2.09/TiO2 sample [64]. It was shown that the formation of the Au–Pd alloy in 0.34AuPd2.09/TiO2 helped to reduce the amount of the hazardous by-products (such as acetaldehyde) generated via the catalytic oxidation of ethyl acetate. Additionally, an accumulation of COO was observed over the samples, suggesting that the oxidation of COO was the step that determined the rate of the ethyl acetate combustion [60]. Combining the foregoing findings, we conclude that the major catalytic ethyl acetate oxidation process is as follows: Ethyl acetate is initially adsorbed on the sample, followed by the breaking of the C−O and C−C bonds to produce intermediates such as ethanol and acetaldehyde. These intermediates then undergo a further reaction with the adsorbed oxygen (O2, O22−, or O) species to produce the acetate species, and are eventually oxidized to CO2 and H2O.
To investigate the effect of 50 ppm SO2 presence on the adsorbed species during the oxidation of ethyl acetate, in situ DRIFTS spectra of the adsorbed species at different temperatures were recorded. As shown in Figure 10E,F, the absorption band at 1640 cm−1 clearly increased in intensity, which was ascribed to the C=C stretching vibration (νs(C=C)) [56]. The vinyl formate was presumed to be the by-product whose concentration rose after SO2 introduction since the C=C bond was not found in the other possible by-products generated. The vibration bands corresponding to ethanol and acetaldehyde disappeared, which was consistent with the results of the GC/MS measurements. Furthermore, acetate was formed earlier in the presence of 50 ppm SO2 and already formed at 180 °C on the TiO2 sample, demonstrating that SO2 promotes the conversion of ethyl acetate. However, the addition of SO2 decreased the area of the band that was assignable to acetate. It has been shown that acetate and sulfite can compete for the adsorption at the surface active sites, leading to a decreased amount of acetate. The co-existing acetic acid might stymie the heterogeneous reaction of SO2, resulting in a dramatic reduction in the amount of sulfites [65].
Figure S3 shows the ethyl acetate TPSR profiles of the 0.34AuPd2.09/TiO2 and 0.33Pd/TiO2 samples to examine the adsorption–desorption behavior of ethyl acetate. The highest abundance fragments from ethyl acetate were those with mass-to-charge ratios of m/z = 45 and m/z = 43, but since the same mass-to-charge ratio could also be formed in acetic acid, acetaldehyde, ethanol, and other by-products, a mass-to-charge ratio of m/z = 88 was employed as a characteristic fragment from ethyl acetate. The 0.34AuPd2.09/TiO2 sample displayed a higher intensity of the desorption peak and a lower desorption temperature, indicating that the bimetallic sample possesses a stronger ability to adsorb ethyl acetate, and the loading of Au–Pd NPs improves the catalytic activity of the sample. The fragments with m/z = 18 and m/z = 44 were characteristic H2O and CO2, respectively. The signal peak appeared in the range of 150–208 °C of the desorption curve at m/z = 18, meaning that the breaking of the C−O bond occurred during the oxidation of ethyl acetate, hence a strong water desorption peak was observed at 300–500 °C due to the complete oxidation of the reactants and products. Similar to this phenomenon, the peak at 300–500 °C of the desorption curve at m/z = 44 was due to the desorption of the generated CO2. The 0.34AuPd2.09/TiO2 sample exhibited a higher intensity of the CO2 desorption peak. The fragment with the highest abundance of acetaldehyde possessed a mass-to-charge ratio of m/z = 29. However, since ethyl acetate was more strongly adsorbed on the Au–Pd bimetallic sample, the desorption peak of acetaldehyde produced after the reaction was similarly strong in intensity. Because ethyl acetate and ethanol both generated the fragment with m/z = 29, the contribution of such a fragment from ethyl acetate and ethanol to the signal peak of the desorption curves could not be ignored.
As shown in Figure 11, ethyl acetate temperature-programmed desorption (ethyl acetate-TPD) was performed from the 0.34AuPd2.09/TiO2, 0.33Pd/TiO2, and 0.36Au/TiO2 samples. Compared to the 0.33Pd/TiO2 and 0.36Au/TiO2 samples, the peak intensity of CO2 desorption from the 0.34AuPd2.09/TiO2 sample was stronger, indicating that a larger amount of ethyl acetate was adsorbed. The fragments with m/z = 58 and m/z = 74 were characteristic of propylene oxide (C3H6O) and methyl acetate (CH3COOCH3), respectively. Since m/z = 42 was another characteristic fragment of acetaldehyde, it shared many characteristics with the m/z = 29 desorption curve. Additionally, in the m/z = 31 desorption curve, the ethanol peak of the 0.34AuPd2.09/TiO2 sample displayed a higher intensity and temperature than those of the other samples, showing that 0.34AuPd2.09/TiO2 possessed a larger ethanol adsorption capacity. The 0.34AuPd2.09/TiO2 sample exhibited weaker peaks for the desorption of acetaldehyde, propylene oxide, and methyl acetate, further demonstrating that the formation of the Au–Pd alloy helped to decrease amounts of the by-products.
We propose a possible pathway for the oxidation of ethyl acetate over our catalysts by combining the TPSR profiles, in situ DRIFTS spectra, and possible reaction intermediates discovered by the GC/MS technique with the data provided in the pertinent literature. The reaction mechanism can be described as follows: (i) Ethyl acetate molecules are adsorbed on the catalyst surface; (ii) the C−O bond in ethyl acetate is broken, resulting in the primary by-products such as CH3CH2OH and CH3CHO as well as the quick conversion of ethanol to acetaldehyde, which is released as a by-product; and (iii) a little fraction of the C−C bond in ethyl acetate is broken to produce CH3COOCH3, which is then broken down to form HCOOCH=CH2, or other C=O bonds are broken to produce the other oxygenated by-products, such as C3H6O. However, in the presence of Au–Pd alloys, acetaldehyde is easily oxidized to CH3COOH, avoiding the release of acetaldehyde. In the end, CH3COOH and other oxygenated by-products are further converted to CO2 and H2O. When water vapor is added to the reaction system, the rise in reactive oxygen and hydroxyl groups encouraged the hydrolysis of ethyl acetate, speeding up the reaction pathway of alcohol → aldehyde → carboxylic acid. In particular, the deep oxidation of ethyl acetate is inhibited and the reaction pathway is changed when SO2 is added to the reaction system.

3. Materials and Methods

3.1. Chemicals

The tetraamminepalladium dinitrate (Pd(NH3)4(NO3)2) was obtained from Heowns Opde Technologies, Ltd., Tianjin, China, and chloroauric acid was obtained from Sinopharm Chemical Reagent Co., Ltd., Shanghai, China, both of were used as the Pd and Au precursors, respectively. The reagent grade NH4OH (28–30 wt% in concentration) used in the catalyst synthesis was obtained from Beijing Myriad Technology Co., Ltd., Beijing, China. The commercial nano-TiO2 (99.8 wt%) was purchased from Aladdin Company, Shanghai, China. All of the chemicals were used without further purification.

3.2. Preparation of the Au/TiO2 and Pd/TiO2 Catalysts

The Pd/TiO2 and Au/TiO2 catalysts were prepared by the strong electrostatic adsorption (SEA) method reported in the literature [31,66]. In a typical preparation process, 0.5 g of TiO2 was added to 100 mL of a NH4OH aqueous solution with a pH of 12. A total of 3.5 mL of tetraamminepalladium dinitrate (0.0067 mol/L) or 1.3 mL of chloroauric acid (0.01 mol/L) solution was added to 20 mL of a NH4OH aqueous solution with a pH of 12 and it was stirred magnetically for 30 min; the precursor solution was slowly added to the above TiO2-containing solution and stirred for 12 h. The final mixed solution was heated to 70 °C until it had completely dried. The dried powders were calcined in a dry air flow of 100 mL/min at a ramp of 10 °C/min in a tubular furnace at 450 °C for 4 h, so that all of the remaining amine or nitrate ligands were ensured to be removed. The corresponding TiO2-supported Pd or Au nanocatalysts were finally obtained. After determining the actual noble metal loadings by the inductively coupled plasma–atomic emission spectroscopic (ICP–AES) technique, we can find that the actual Pd and Au loadings in the Pd/TiO2 and Au/TiO2 samples were 0.33 and 0.36 wt% (Table 1), respectively, and the corresponding samples were denoted as 0.33Pd/TiO2 and 0.36Au/TiO2.

3.3. Preparation of the yAuPdx/TiO2 Catalysts

A total of 0.5 g of TiO2 was added to 100 mL of a NH4OH aqueous solution with a pH of 12. Either 0.7, 1.8, or 2.2 mL of tetraamminepalladium dinitrate (0.0067 mol/L) or 1, 0.6, or 0.5 mL of chloroauric acid (0.01 mol/L) solution was added to 20 mL of a NH4OH aqueous solution with a pH of 12 and stirred magnetically for 30 min. The Au- or Pd-containing precursor solution was added slowly and sequentially to the TiO2-containing aqueous solution and then was stirred for 12 h. The final mixed aqueous solution was heated to 70 °C until it was completely dried. The dried powders were calcined in a dry air flow of 100 mL/min at a ramp of 10 °C/min in a tubular furnace at 450 °C for 4 h, so that all of the remaining amine or nitrate ligands were ensured to be removed. According to the results of ICP–AES characterization (Table 1), the actual Au–Pd loadings (y) in the as-prepared catalysts were 0.37, 0.34, and 0.35 wt%, and the Pd/Au molar ratios (x) were 2.72, 2.09, and 0.46, respectively. For better presentation, we denote the as-obtained catalysts as 0.37AuPd2.72/TiO2, 0.34AuPd2.09/TiO2, and 0.35AuPd0.46/TiO2, respectively.

3.4. Catalyst Characterization

Physicochemical properties of the catalysts were measured using the following techniques, including X-ray diffraction (XRD, Berlin, Germany), transmission electron microscopy (TEM, JEOL JEM-2010, Tokyo, Japan), high-angle annular dark field–scanning transmission electron microscopy (HAADF–STEM, FEI G280-200/Chemi-STEM, Potsdam, Germany), X-ray photoelectron spectroscopy (XPS, Thermo Fisher Scientific ESCALAB 250 Xi spectrometer, Waltham, MA, USA), N2 adsorption–desorption (BET, Micromeritics ASAP 2020 analyzer, Norcross, GA, USA), thermal analyzer-gas chromatography/mass spectrometry (GC/MS, 7890B-5977, Agilent, Santa Clara, USA), hydrogen temperature-programmed reduction (H2-TPR, AutoChem II 2920, Micromeritics, Norcross, GA, USA), in situ diffuse reflectance infrared Fourier transform spectroscopy (in situ DRIFTS, Nicolet 6700 FT-IR spectrometer with a liquid-nitrogen-cooled MCT detector, Bruker, Berlin, Germany), and temperature-programmed surface reaction and desorption experiments (TPSR and TPD, Autochem II 2920, Micromeritics, Norcross, GA, USA). The detailed characterization procedures are described in the Supplementary Materials.

3.5. Catalytic Evaluation

Catalytic activities of the samples for ethyl acetate oxidation were assessed in a fixed-bed quartz tubular microreactor (inner diameter = 6.0 mm), as illustrated in Scheme S1. In the microreactor, a thermocouple was placed in the quartz tube and directly in contact with the catalyst bed to measure the reaction temperatures. Ethyl acetate and its products were analyzed online on a gas chromatograph (GC-2010, Shimadzu, Japan) equipped with a flame ionization detector (FID) and a stabilwax@-DA column (30 m in length) for VOC separation and a Carboxen 1000 column (3 m in length, and 1/8 inch in diameter) for permanent gas separation. A total of 50 mg of the sample (40–60 mesh) and 250 mg of quartz sand were well mixed in the microreactor. Prior to measuring the catalytic activity, each sample was activated with an oxygen flow of 20 mL/min at 250 °C for 1 h. The feedstock gas mixture was composed of (1000 ppm ethyl acetate + 20 vol% O2 + N2 (balance)), with the total flow rate, space velocity (SV), and ethyl acetate/oxygen molar ratio being 33.4 mL/min, 40,000 mL/(g h), and 1/200, respectively. In the case of water vapor introduction, 5.0 vol% H2O was added via a water saturator at 34 °C. In the case of SO2 addition, a mass flow controller was used to introduce 50 ppm SO2 into the reaction system from a SO2 cylinder that was balanced with N2. The conversion of ethyl acetate was calculated according to the following formula: (cincout)/cin × 100%, where cin and cout are the concentrations of ethyl acetate at the inlet and outlet, respectively. Catalytic activities of the samples were assessed using the temperatures (T10%, T50%, and T90%) required for ethyl acetate conversions of 10, 50, and 90%, respectively. In addition, specific reaction rates and turnover frequencies (TOFNoble metal) at a given temperature were also utilized to evaluate catalytic activities of the samples.

4. Conclusions

The electrostatic adsorption approach was used to successfully load Au, Pd, and AuPdx NPs on the surface of anatase-type TiO2, thus preparing the 0.36Au/TiO2, 0.33Pd/TiO2, and yAuPdx/TiO2 samples, respectively. Among all of the samples, the oxidation of ethyl acetate was performed on each sample, and 0.37AuPd2.72/TiO2 exhibited the highest catalytic activity (T50% = 217 °C and T90% = 239 °C at SV = 40,000 mL/(g h), Ea = 37 kJ/mol, specific reaction rate at 220 °C = 113.8 µmol/(gPd s), and TOFNoble metal at 220 °C = 109.7 × 10⁻³ s−1). The adsorption of the oxygen species and low-temperature reducibility of the samples were improved after the loading of AuPdx NPs. The introduction of 5 vol% H2O promoted the conversion of ethyl acetate to produce more amounts of acetaldehyde and ethanol. When 50 ppm SO2 was introduced, the ethyl acetate conversions first decreased and then recovered or even increased by 10%, but more amounts of by-products were generated (inhibiting the deep oxidation of ethyl acetate), with the lowest amounts of by-products being produced over the 0.34AuPd2.09/TiO2 sample. Except for some low-concentration by-products (such as HCOOCH=CH2, C3H6O, and CH3COOCH3), the main intermediates in the oxidation of ethyl acetate were CH3CHO, CH3CH2OH, and CH3COOH. The oxidation of ethyl acetate over the 0.34AuPd2.09/TiO2 sample might take place via the route of ethyl acetate → ethanol → acetic acid → acetate → CO2 and H2O.

Supplementary Materials

The following are all available online at https://www.mdpi.com/article/10.3390/catal13040643/s1. Catalyst characterization procedures and catalytic evaluation procedures. Scheme S1: An illustration of the setup used for the catalytic activity evaluation, Figure S1: (a,c) TEM images, (b-1,d-1) HAADF–STEM images, and (b-2–b-4,d-2–d-4) elemental mappings of (a,b) 0.33Pd/TiO2 and (c,d) 0.36Au/TiO2; Figure S2: Possible reaction intermediates detected during the ethyl acetate oxidation process at T90% and SV = 40,000 mL/(g h) over the 0.34AuPd2.09/TiO2, TiO2, and 0.33Pd/TiO2 samples in the presence or absence of SO2; Figure S3: TPSR profiles of (a) 0.34AuPd2.09/TiO2 and (b) 0.33Pd/TiO2 for ethyl acetate oxidation, and references. Table S1: Comparison of catalytic activities for ethyl acetate oxidation of the 0.37AuPd2.72/TiO2 sample obtained in the present work and the various catalysts reported in the literature, Table S2. Possible reaction intermediates detected by GC/MS during ethyl acetate oxidation over the 0.34AuPd2.09/TiO2, 0.33Pd/TiO2, and TiO2 samples.

Author Contributions

Conceptualization, H.D.; methodology, Y.L. and H.D.; software, J.D. and L.J.; investigation, M.B.; resources, H.D.; data curation, Z.H., Z.W., L.W. and X.Y.; writing—original draft preparation, M.B.; writing—review and editing, Y.L., J.D., L.J. and H.D.; visualization, Z.H., Z.W., L.W. and X.Y.; supervision, Y.L. and H.D.; project administration, H.D.; funding acquisition, H.D. All authors have read and agreed to the published version of the manuscript.

Funding

This work was supported by the National Natural Science Foundation Committee of China–Liaoning Provincial People’s Government Joint Fund (U1908204), the National Key R&D Program of China (2022YFB3506200 and 2022YFB3504100), the National Natural Science Foundation of China (21876006 and 21976009), the Beijing Natural Science Foundation (J210006), and the R&D Program of Beijing Municipal Education Commission (KZ202210005011).

Data Availability Statement

All the relevant data used in this study have been provided in the form of figures and tables in the published article, and all data provided in the present manuscript are available to whom they may concern.

Conflicts of Interest

The authors declare no conflict of interest.

References

  1. Mellouki, A.; Wallington, T.J.; Chen, J. Atmospheric chemistry of oxygenated volatile organic compounds: Impacts on air quality and climate. Chem. Rev. 2015, 115, 3984–4014. [Google Scholar] [CrossRef]
  2. He, C.; Cheng, J.; Zhang, X.; Douthwaite, M.; Pattisson, S.; Hao, Z.P. Recent advances in the catalytic oxidation of volatile organic compounds: A review based on pollutant sorts and sources. Chem. Rev. 2019, 119, 4471–4568. [Google Scholar] [CrossRef] [PubMed]
  3. Wang, H.L.; Sun, S.M.; Nie, L.; Zhang, Z.S.; Li, W.P.; Hao, Z.P. A review of whole-process control of industrial volatile organic compounds in China. J. Environ. Sci. 2022, 123, 127–139. [Google Scholar] [CrossRef] [PubMed]
  4. Guo, Y.L.; Wen, M.C.; Li, G.Y.; An, T. Recent advances in VOC elimination by catalytic oxidation technology onto various nanoparticles catalysts: A critical review. Appl. Catal. B 2021, 281, 119447. [Google Scholar] [CrossRef]
  5. Liu, L.C.; Corma, A. Metal catalysts for heterogeneous catalysis: From single atoms to nanoclusters and nanoparticles. Chem. Rev. 2018, 118, 4981–5079. [Google Scholar] [CrossRef] [PubMed] [Green Version]
  6. Kamal, M.S.; Razzak, S.A.; Hossain, M.M. Catalytic oxidation of volatile organic compounds (VOCs)—A review. Atmos. Environ. 2016, 140, 117–134. [Google Scholar] [CrossRef]
  7. Sedjame, H.-J.; Fontaine, C.; Lafaye, G.; Barbier, J., Jr. On the promoting effect of the addition of ceria to platinum based alumina catalysts for VOCs oxidation. Appl. Catal. B 2014, 144, 233–242. [Google Scholar] [CrossRef]
  8. Tilvez, E.; Cardenas-Jiron, G.I.; Menendez, M.I.; Lopez, R. Understanding the hydrolysis mechanism of ethyl acetate catalyzed by an aqueous molybdocene: A computational chemistry investigation. Inorg. Chem. 2015, 54, 1223–1231. [Google Scholar] [CrossRef]
  9. Jiang, Y.W.; Gao, J.H.; Zhang, Q.; Liu, Z.Y.; Fu, M.L.; Wu, J.L.; Hu, Y.; Ye, D.Q. Enhanced oxygen vacancies to improve ethyl acetate oxidation over MnOx−CeO2 catalyst derived from MOF template. Chem. Eng. J. 2019, 371, 78–87. [Google Scholar] [CrossRef]
  10. Zhang, L.; Yang, Y.; Li, Y.Z.; Wu, J.C.; Wu, S.W.; Tan, X.; Hu, Q.Q. Highly efficient UV-visible-infrared photothermocatalytic removal of ethyl acetate over a nanocomposite of CeO2 and Ce-doped manganese oxide. Chin. J. Catal. 2022, 43, 379–390. [Google Scholar] [CrossRef]
  11. Feng, S.Y.; Liu, J.D.; Gao, B. Synergistic mechanism of Cu–Mn–Ce oxides in mesoporous ceramic base catalyst for VOCs microwave catalytic combustion. Chem. Eng. J. 2022, 429, 132302. [Google Scholar] [CrossRef]
  12. Pan, T.T.; Deng, H.; Kang, S.Y.; Zhang, Y.; Lian, W.; Zhang, C.B.; He, H. Facile homogeneous precipitation method to prepare MnO2 with high performance in catalytic oxidation of ethyl acetate. Chem. Eng. J. 2021, 417, 129246. [Google Scholar] [CrossRef]
  13. Li, S.M.; Hao, Q.L.; Zhao, R.Z.; Liu, D.L.; Duan, H.Z.; Dou, B.J. Highly efficient catalytic removal of ethyl acetate over Ce/Zr promoted copper/ZSM-5 catalysts. Chem. Eng. J. 2016, 285, 536–543. [Google Scholar] [CrossRef]
  14. Larsson, P.O.; Andersson, A. Complete oxidation of CO, ethanol, and ethyl acetate over copper oxide supported on titania and ceria modified titania. J. Catal. 1998, 179, 72–89. [Google Scholar] [CrossRef]
  15. Lee, J.D.; Miller, J.B.; Shneidman, A.V.; Sun, L.; Weaver, J.F.; Aizenberg, J.; Biener, J.; Boscoboinik, J.A.; Foucher, A.C.; Frenkel, A.I.; et al. Dilute alloys based on Au, Ag, or Cu for efficient catalysis: From synthesis to active sites. Chem. Rev. 2022, 122, 8758–8808. [Google Scholar] [CrossRef]
  16. Li, G.J.; Zhang, W.S.; Luo, N.; Xue, Z.G.; Hu, Q.M.; Zeng, W.; Xu, J.Q. Bimetallic nanocrystals: Structure, controllable synthesis and applications in catalysis, energy and sensing. Nanomaterials 2021, 11, 1926. [Google Scholar] [CrossRef]
  17. Gilroy, K.D.; Ruditskiy, A.; Peng, H.C.; Qin, D.; Xia, Y. Bimetallic nanocrystals: Syntheses, properties, and applications. Chem. Rev. 2016, 116, 10414–10472. [Google Scholar] [CrossRef]
  18. Tao, F.F. Synthesis, catalysis, surface chemistry and structure of bimetallic nanocatalysts. Chem. Soc. Rev. 2012, 41, 7977–7979. [Google Scholar] [CrossRef] [PubMed] [Green Version]
  19. Liu, X.L.; Han, Q.Z.; Shi, W.B.; Zhang, C.; Li, E.W.; Zhu, T.Y. Catalytic oxidation of ethyl acetate over Ru–Cu bimetallic catalysts: Further insights into reaction mechanism via in situ FTIR and DFT studies. J. Catal. 2019, 369, 482–492. [Google Scholar] [CrossRef]
  20. Carabineiro, S.A.C.; Chen, X.; Martynyuk, O.; Bogdanchikova, N.; Avalos-Borja, M.; Pestryakov, A.; Tavares, P.B.; Órfão, J.J.M.; Pereira, M.F.R.; Figueiredo, J.L. Gold supported on metal oxides for volatile organic compounds total oxidation. Catal. Today 2015, 244, 103–114. [Google Scholar] [CrossRef]
  21. Wang, X.; Wu, L.K.; Wang, Z.W.; Feng, Y.; Liu, Y.X.; Dai, H.X.; Wang, Z.H.; Deng, J.G. Photothermal synergistic catalytic oxidation of ethyl acetate over MOFs-derived mesoporous N-TiO2 supported Pd catalysts. Appl. Catal. B 2023, 322, 122075. [Google Scholar] [CrossRef]
  22. Wen, X.Y.; Li, W.C.; Yan, J.X.; Wang, X.J.; Ren, E.B.; Shi, Z.F.; Li, J.; Ding, X.G.; Mo, S.P.; Mo, D.Q. Strong metal–support interaction in Pd/CeO2 promotes the catalytic activity of ethyl acetate oxidation. J. Phys. Chem. C 2022, 126, 1450–1461. [Google Scholar] [CrossRef]
  23. Zhang, X.; Liu, Y.X.; Deng, J.G.; Yu, X.H.; Han, Z.; Zhang, K.F.; Dai, H.X. Alloying of gold with palladium: An effective strategy to improve catalytic stability and chlorine-tolerance of the 3DOM CeO2-supported catalysts in trichloroethylene combustion. Appl. Catal. B 2019, 257, 117879. [Google Scholar] [CrossRef]
  24. Liu, J.L.; Uhlman, M.B.; Montemore, M.M.; Trimpalis, A.; Giannakakis, G.; Shan, J.; Cao, S.; Hannagan, R.T.; Sykes, E.C.H.; Flytzani-Stephanopoulos, M. Integrated catalysis-surface science-theory approach to understand selectivity in the hydrogenation of 1-hexyne to 1-hexene on PdAu single-atom alloy catalysts. ACS Catal. 2019, 9, 8757–8765. [Google Scholar] [CrossRef]
  25. Griffin, M.B.; Rodriguez, A.A.; Montemore, M.M.; Monnier, J.R.; Williams, C.T.; Medlin, J.W. The selective oxidation of ethylene glycol and 1,2–propanediol on Au, Pd, and Au–Pd bimetallic catalysts. J. Catal. 2013, 307, 111–120. [Google Scholar] [CrossRef]
  26. Ilieva, L.; Venezia, A.M.; Petrova, P.; Pantaleo, G.; Liotta, L.F.; Zanella, R.; Kaszkur, Z.; Tabakova, T. Effect of Y modified ceria support in mono and bimetallic Pd–Au catalysts for complete benzene oxidation. Catalysts 2018, 8, 283. [Google Scholar] [CrossRef] [Green Version]
  27. Tabakova, T.; Ilieva, L.; Petrova, P.; Venezia, M.A.; Karakirova, Y.; Liotta, L.F.; Avdeev, G. Complete benzene oxidation over mono and bimetallic Pd–Au catalysts on alumina-supported Y-doped ceria. Appl. Sci. 2020, 10, 1088. [Google Scholar] [CrossRef] [Green Version]
  28. Wong, Q.L.; Griffin, S.; Nicholls, A.; Regalbuto, J.R. Synthesis of ultrasmall, homogeneously alloyed, bimetallic nanoparticles on silica supports. Science 2017, 358, 1427–1430. [Google Scholar] [CrossRef] [Green Version]
  29. Resasco, J.; DeRita, L.; Dai, S.; Chada, J.P.; Xu, M.J.; Yan, X.X.; Finzel, J.; Hanukovich, S.; Hoffman, A.S.; Graham, G.W.; et al. Uniformity is key in defining structure-function relationships for atomically dispersed metal catalysts: The case of Pt/CeO2. J. Am. Chem. Soc. 2020, 142, 169–184. [Google Scholar] [CrossRef]
  30. Ma, Y.L.; Kuhn, A.N.; Gao, W.P.; Al-Zoubi, T.; Du, H.; Pan, X.Q.; Yang, H. Strong electrostatic adsorption approach to the synthesis of sub-three nanometer intermetallic platinum–cobalt oxygen reduction catalysts. Nano Energy 2021, 79, 105465. [Google Scholar] [CrossRef]
  31. DeRita, L.; Dai, S.; Lopez-Zepeda, K.; Pham, N.; Graham, G.W.; Pan, X.Q.; Christopher, P. Catalyst architecture for stable single atom dispersion enables site-specific spectroscopic and reactivity measurements of CO adsorbed to Pt atoms, oxidized Pt clusters, and metallic Pt clusters on TiO2. J. Am. Chem. Soc. 2017, 139, 14150–14165. [Google Scholar] [CrossRef]
  32. Liu, Y.X.; Deng, J.G.; Xie, S.H.; Wang, Z.W.; Dai, H.X. Catalytic removal of volatile organic compounds using ordered porous transition metal oxide and supported noble metal catalysts. Chin. J. Catal. 2016, 37, 1193–1205. [Google Scholar] [CrossRef]
  33. Wang, Z.W.; Li, S.; Xie, S.H.; Liu, Y.X.; Dai, H.X.; Guo, G.S.; Deng, J.G. Supported ultralow loading Pt catalysts with high H2O-, CO2-, and SO2-resistance for acetone removal. Appl. Catal. A 2019, 579, 106–115. [Google Scholar] [CrossRef]
  34. Ilieva, L.; Petrova, P.; Pantaleo, G.; Zanella, R.; Liotta, L.F.; Georgiev, V.; Boghosian, S.; Kaszkur, Z.; Sobczak, J.W.; Lisowski, W.; et al. Gold catalysts supported on Y-modified ceria for CO-free hydrogen production via PROX. Appl. Catal. B 2016, 188, 154–168. [Google Scholar] [CrossRef]
  35. Li, S.W.; Guo, S.J.; Yang, H.L.; Gou, G.L.; Ren, R.; Li, J.; Dong, Z.P.; Jin, J.; Ma, J.T. Enhancing catalytic performance of Au catalysts by noncovalent functionalized graphene using functional ionic liquids. J. Hazard. Mater. 2014, 270, 11–17. [Google Scholar] [CrossRef] [PubMed]
  36. Chen, Y.X.; Huang, Z.W.; Zhou, M.J.; Ma, Z.; Chen, J.M.; Tang, X.F. Single silver adatoms on nanostructured manganese oxide surfaces: Boosting oxygen activation for benzene abatement. Environ. Sci. Technol. 2017, 51, 2304–2311. [Google Scholar] [CrossRef]
  37. He, M.; Ji, J.; Liu, B.Y.; Huang, H.B. Reduced TiO2 with tunable oxygen vacancies for catalytic oxidation of formaldehyde at room temperature. Appl. Surf. Sci. 2019, 473, 934–942. [Google Scholar] [CrossRef]
  38. Yang, X.Q.; Yu, X.L.; Lin, M.Y.; Ge, M.F.; Zhao, Y.; Wang, F.Y. Interface effect of mixed phase Pt/ZrO2 catalysts for HCHO oxidation at ambient temperature. J. Mater. Chem. A 2017, 5, 13799–13806. [Google Scholar] [CrossRef]
  39. Huang, S.Y.; Zhang, C.B.; He, H. Effect of pretreatment on Pd/Al2O3 catalyst for catalytic oxidation of o-xylene at low temperature. J. Environ. Sci. 2013, 25, 1206–1212. [Google Scholar] [CrossRef]
  40. Yang, X.; Chen, D.; Liao, S.J.; Song, H.Y.; Li, Y.W.; Fu, Z.Y.; Su, Y.L. High-performance Pd–Au bimetallic catalyst with mesoporous silica nanoparticles as support and its catalysis of cinnamaldehyde hydrogenation. J. Catal. 2012, 291, 36–43. [Google Scholar] [CrossRef]
  41. Liu, Y.; Liu, B.C.; Wang, Q.; Li, C.Y.; Hu, W.T.; Liu, Y.X.; Jing, P.; Zhao, W.Z.; Zhang, J. Three-dimensionally ordered macroporous Au/CeO2–Co3O4 catalysts with mesoporous walls for enhanced CO preferential oxidation in H2-rich gases. J. Catal. 2012, 296, 65–76. [Google Scholar] [CrossRef]
  42. Zhang, X.; Liu, Y.X.; Deng, J.G.; Zhang, K.F.; Yang, J.; Han, Z.; Dai, H.X. AuPd/3DOM TiO2 catalysts: Good activity and stability for the oxidation of trichloroethylene. Catalysts 2018, 8, 666. [Google Scholar] [CrossRef] [Green Version]
  43. Huang, Y.; Tian, M.J.; Jiang, Z.; Ma, M.D.; Chen, C.W.; Xu, H.; Zhang, J.J.; Albilali, R.; He, C. Inserting Cr2O3 dramatically promotes RuO2/TiO2 catalyst for low-temperature 1,2-dichloroethane deep destruction: Catalytic performance and synergy mechanism. Appl. Catal. B 2022, 304, 121002. [Google Scholar] [CrossRef]
  44. Xie, S.H.; Deng, J.G.; Zang, S.M.; Yang, H.G.; Guo, G.S.; Arandiyan, H.; Dai, H.X. Au–Pd/3DOM Co3O4: Highly active and stable nanocatalysts for toluene oxidation. J. Catal. 2015, 322, 38–48. [Google Scholar] [CrossRef]
  45. Hosseini, M.; Barakat, T.; Cousin, R.; Aboukaïs, A.; Su, B.L.; De Weireld, G.; Siffert, S. Catalytic performance of core–shell and alloy Pd–Au nanoparticles for total oxidation of VOC: The effect of metal deposition. Appl. Catal. B 2012, 111, 218–224. [Google Scholar] [CrossRef]
  46. Karim, W.; Spreafico, C.; Kleibert, A.; Gobrecht, J.; VandeVondele, J.; Ekinci, Y.; van Bokhoven, J.A. Catalyst support effects on hydrogen spillover. Nature 2017, 541, 68–71. [Google Scholar] [CrossRef]
  47. Wei, H.S.; Liu, X.Y.; Wang, A.Q.; Zhang, L.L.; Qiao, B.T.; Yang, X.F.; Huang, Y.Q.; Miao, S.; Liu, J.Y.; Zhang, T. FeOx-supported platinum single-atom and pseudo-single-atom catalysts for chemoselective hydrogenation of functionalized nitroarenes. Nat. Commun. 2014, 5, 5634. [Google Scholar] [CrossRef] [Green Version]
  48. Li, J.T.; Xu, Z.L.; Wang, T.; Xie, X.W.; Li, D.D.; Wang, J.G.; Huang, H.B.; Ao, Z.M. A versatile route to fabricate metal/UiO-66 (metal = Pt, Pd, Ru) with high activity and stability for the catalytic oxidation of various volatile organic compounds. Chem. Eng. J. 2022, 448, 136900. [Google Scholar] [CrossRef]
  49. Ma, M.D.; Yang, R.; He, C.; Jiang, Z.Y.; Shi, J.W.; Albilali, R.; Fayaz, K.; Liu, B.J. Pd-based catalysts promoted by hierarchical porous Al2O3 and ZnO microsphere supports/coatings for ethyl acetate highly active and stable destruction. J. Hazard. Mater. 2021, 401, 123281. [Google Scholar] [CrossRef]
  50. Kamiuchi, N.; Mitsui, T.; Yamaguchi, N.; Muroyama, H.; Matsui, T.; Kikuchi, R.; Eguchi, K. Activation of Pt/SnO2 catalyst for catalytic oxidation of volatile organic compounds. Catal. Today 2010, 157, 415–419. [Google Scholar] [CrossRef]
  51. He, C.; Yue, L.; Zhang, X.Y.; Li, P.; Dou, B.J.; Ma, C.Y.; Hao, Z.P. Deep catalytic oxidation of benzene, toluene, ethyl acetate over Pd/SBA-15 catalyst: Reaction behaviors and kinetics. Asia-Pac. J. Chem. Eng. 2012, 7, 705–715. [Google Scholar] [CrossRef]
  52. Bastos, S.S.T.; Carabineiro, S.A.C.; Órfão, J.J.M.; Pereira, M.F.R.; Delgado, J.J.; Figueiredo, J.L. Total oxidation of ethyl acetate, ethanol and toluene catalyzed by exotemplated manganese and cerium oxides loaded with gold. Catal. Today 2012, 180, 148–154. [Google Scholar] [CrossRef]
  53. Xia, Y.X.; Dai, H.X.; Jiang, H.Y.; Deng, J.G.; He, H.; Au, C.T. Mesoporous chromia with ordered Three-Dimensional structures for the complete oxidation of toluene and ethyl acetate. Environ. Sci. Technol. 2009, 43, 8355–8360. [Google Scholar] [CrossRef] [PubMed]
  54. Han, S.M.; Shin, K.; Henkelman, G.; Mullins, C.B. Selective oxidation of acetaldehyde to acetic acid on Pd–Au bimetallic model catalysts. ACS Catal. 2019, 9, 4360–4368. [Google Scholar] [CrossRef]
  55. Liang, Y.J.; Liu, Y.X.; Deng, J.G.; Zhang, K.F.; Hou, Z.Q.; Zhao, X.T.; Zhang, X.; Zhang, K.Y.; Wei, R.J.; Dai, H.X. Coupled palladium-tungsten bimetallic nanosheets/TiO2 hybrids with enhanced catalytic activity and stability for the oxidative removal of benzene. Environ. Sci. Technol. 2019, 53, 5926–5935. [Google Scholar] [CrossRef]
  56. Ma, M.D.; Yang, R.; Jiang, Z.Y.; Chen, C.W.; Liu, Q.Y.; Albilali, R.; He, C. Fabricating M/Al2O3/cordierite (M = Cr, Mn, Fe, Co, Ni and Cu) monolithic catalysts for ethyl acetate efficient oxidation: Unveiling the role of water vapor and reaction mechanism. Fuel 2021, 303, 121244. [Google Scholar] [CrossRef]
  57. Yu, X.H.; Dai, L.Y.; Deng, J.G.; Liu, Y.X.; Jing, L.; Zhang, X.; Gao, R.Y.; Hou, Z.Q.; Wei, L.; Dai, H.X. An isotopic strategy to investigate the role of water vapor in the oxidation of 1,2-dichloroethane over the Ru/WO3 or Ru/TiO2 catalyst. Appl. Catal. B 2022, 305, 121037. [Google Scholar] [CrossRef]
  58. Hou, Z.Q.; Dai, L.Y.; Deng, J.G.; Zhao, G.F.; Jing, L.; Wang, Y.S.; Yu, X.H.; Gao, R.Y.; Tian, X.R.; Dai, H.X.; et al. Electronically engineering water resistance in methane combustion with an atomically dispersed tungsten on PdO catalyst. Angew. Chem. Int. Ed. 2022, 134, e202201655. [Google Scholar] [CrossRef]
  59. Li, J.C.; Zhang, C.; Li, Q.; Gao, T.; Yu, S.H.; Tan, P.; Fang, Q.Y.; Chen, G. Promoting mechanism of SO2 resistance performance by anatase TiO2 {001} facets on Mn−Ce/TiO2 catalysts during NH3-SCR reaction. Chem. Eng. Sci. 2022, 251, 117438. [Google Scholar] [CrossRef]
  60. Zhang, W.; Innocenti, G.; Ferbinteanu, M.; Enrique, V.; Fernandez, R.; Sepulveda-Escribano, A.; Wu, H.H.; Cavani, F.; Rothenberg, G.; Raveendran, N. Understanding the oxidative dehydrogenation of ethyl lactate to ethyl pyruvate over vanadia/titania. Catal. Sci. Technol. 2018, 8, 3737–3747. [Google Scholar] [CrossRef] [Green Version]
  61. Ma, M.D.; Feng, X.B.; Yang, R.; Li, L.; Jiang, Z.Y.; Chen, C.W.; He, C. Engineering CoCexZr1−x/Ni foam monolithic catalysts for ethyl acetate efficient destruction. Fuel 2022, 317, 123574. [Google Scholar] [CrossRef]
  62. Dong, N.; Ye, Q.; Zhang, D.; Xiao, Y.; Dai, H.X. Reduced graphene oxide as an effective promoter to the layered manganese oxide-supported Ag catalysts for the oxidation of ethyl acetate and carbon monoxide. J. Hazard. Mater. 2022, 431, 128518. [Google Scholar] [CrossRef]
  63. Wang, Y.N.; Ma, W.H.; Wang, D.Y.; Zhong, Q. Study on the reaction mechanism of the propylene oxide rearrangement via in situ DRIFTS. Chem. Eng. J. 2017, 307, 1047–1054. [Google Scholar] [CrossRef]
  64. Jetzki, M.; Luckhaus, D.; Signorell, R. Fermi resonance and conformation in glycolaldehyde particles. Can. J. Chem. 2004, 82, 915–924. [Google Scholar] [CrossRef]
  65. Yang, N.; Tsona, N.T.; Cheng, S.; Li, S.; Xu, L.; Wang, Y.; Wu, L.; Du, L. Competitive reactions of SO2 and acetic acid on alpha-Al2O3 and CaCO3 particles. Sci. Total Environ. 2020, 699, 134362. [Google Scholar] [CrossRef]
  66. Jiao, L.; Regalbuto, J.R. The synthesis of highly dispersed noble and base metals on silica via strong electrostatic adsorption: I. Amorphous silica. J. Catal. 2008, 260, 329–341. [Google Scholar] [CrossRef]
Figure 1. XRD patterns of (a) TiO2, (b) 0.33Pd/TiO2, (c) 0.36Au/TiO2, (d) 0.37AuPd2.72/TiO2, (e) 0.34AuPd2.09/TiO2, and (f) 0.35AuPd0.46/TiO2.
Catalysts 13 00643 g001
Figure 2. HAADF–STEM images of (a,g) 0.37AuPd2.72/TiO2, (b) 0.34AuPd2.09/TiO2, (c) 0.35AuPd0.46/TiO2, (d) 0.36Au/TiO2, (e) 0.33Pd/TiO2, (f) particle-size distribution of AuPd2.72 NPs, (hk) elemental mappings, and (l) line scan of 0.37AuPd2.72/TiO2.
Catalysts 13 00643 g002
Figure 3. (A) O 1s, (B) Pd 3d, and (C) Au 4f XPS spectra of (a) 0.36AuTiO2, (b) 0.33Pd/TiO2, (c) 0.35AuPd0.46/TiO2, (d) 0.34AuPd2.09/TiO2, and (e) 0.37AuPd2.72/TiO2.
Catalysts 13 00643 g003
Figure 4. H2-TPR profiles of (a) TiO2, (b) 0.36Au/TiO2, (c) 0.33Pd/TiO2, (d) 0.35AuPd0.46/TiO2, (e) 0.34AuPd2.09/TiO2, and (f) 0.37AuPd2.72/TiO2.
Catalysts 13 00643 g004
Figure 5. (A) Ethyl acetate conversion as a function of temperature and (B) Arrhenius plots for ethyl acetate oxidation over the as-obtained samples at SV = 40,000 mL/(g h).
Catalysts 13 00643 g005
Figure 6. Acetaldehyde concentration as a function of temperature over the samples at SV = 40,000 mL/(g h).
Catalysts 13 00643 g006
Figure 7. Effect of 5.0 vol% water vapor on (A–C) catalytic activity and (D) intermediate selectivity of the (A) 0.34AuPd2.09/TiO2, (B) 0.33Pd/TiO2, and (C) 0.36Au/TiO2 samples for ethyl acetate oxidation at an SV of 40,000 mL/(g h).
Catalysts 13 00643 g007
Figure 8. Effect of 50 ppm SO2 on (A–C) catalytic activity and (D–F)intermediate selectivity of the (A,C) 0.34AuPd2.09/TiO2, (B,E) TiO2, and (C,F) 0.33Pd/TiO2 samples for ethyl acetate oxidation at SV = 40,000 mL/(g h).
Catalysts 13 00643 g008
Figure 9. GC/MS chromatograms of the gaseous organic products of ethyl acetate oxidation at T50% over (a) TiO2, (b) 0.33Pd/TiO2, and (c) 0.34AuPd2.09/TiO2.
Catalysts 13 00643 g009
Figure 10. In situ DRIFTS spectra of (A) 0.33Pd/TiO2, (B) 0.36Au/TiO2, (C,E) 0.34AuPd2.09/TiO2, and (D,F) TiO2 during (AD) 1000 ppm ethyl acetate oxidation and (E,F) (1000 ppm ethyl acetate + 50 ppm SO2) oxidation at different temperatures.
Catalysts 13 00643 g010
Figure 11. Ethyl acetate-TPD profiles of (a) 0.34AuPd2.09/TiO2, (b) 0.33Pd/TiO2, and (c) 0.36Au/TiO2.
Catalysts 13 00643 g011
Table 1. Crystal phases, BET surface areas, actual noble metal contents, actual Pd/Au molar ratios, and surface element compositions of the as-prepared samples.
SampleCrystal
Phase a
BET Surface Area b
(m2/g)
Actual Au Content c
(wt%)
Actual Pd Content c
(wt%)
Actual Pd/Au
Molar Ratio c
(mol/mol)
Surface Element Composition (mol/mol)
Pd2+/Pd0
Molar Ratio
Auδ+/Au0
Molar Ratio
Oads/Olatt
Molar Ratio
0.33Pd/TiO2Anatase1680.330.220.20
0.36Au/TiO2Anatase1550.360.250.18
0.35AuPd0.46/TiO2Anatase1110.280.070.460.150.300.26
0.34AuPd2.09/TiO2Anatase1340.160.182.090.220.360.28
0.37AuPd2.72/TiO2Anatase1630.150.222.720.230.420.33
a Crystal phases were identified according to the XRD results; b Data were determined by the BET method; c Data were determined by the ICP–AES technique.
Table 2. Catalytic activities at SV = 40,000 mL/(g h), apparent activation energies (Ea), metal dispersion, TOFPd, TOFNoble metal, specific reaction rates at 220 °C, and H2 consumption of the samples.
SampleCatalytic ActivityEthyl Acetate Oxidation at 220 °CEa
(kJ/mol)
Metal
Dispersion (%)
H2
Consumption (mmol/gcat)
T10%T50%T90%Specific Reaction RateTOFPdTOFNoble metal
(°C)(°C)(°C)(µmol/(gPd s))(×10−3 s−1)(×10−3 s−1)
TiO2228268303720.14
0.36Au/TiO22242612893.860520.19
0.33Pd/TiO217922526148.326.914.644350.26
0.35AuPd0.46/TiO220823625797.546.411.757410.27
0.34AuPd2.09/TiO2188229251101.251.959.142380.32
0.37AuPd2.72/TiO2160217239113.873.9109.737300.35
Disclaimer/Publisher’s Note: The statements, opinions and data contained in all publications are solely those of the individual author(s) and contributor(s) and not of MDPI and/or the editor(s). MDPI and/or the editor(s) disclaim responsibility for any injury to people or property resulting from any ideas, methods, instructions or products referred to in the content.