
Promotion Effects of Ce-Doping on Catalytic Oxidation of Ethane over Pt/CexTi1−xO2

Abstract
1. Introduction
2. Results and Discussion
2.1. Catalytic Activity
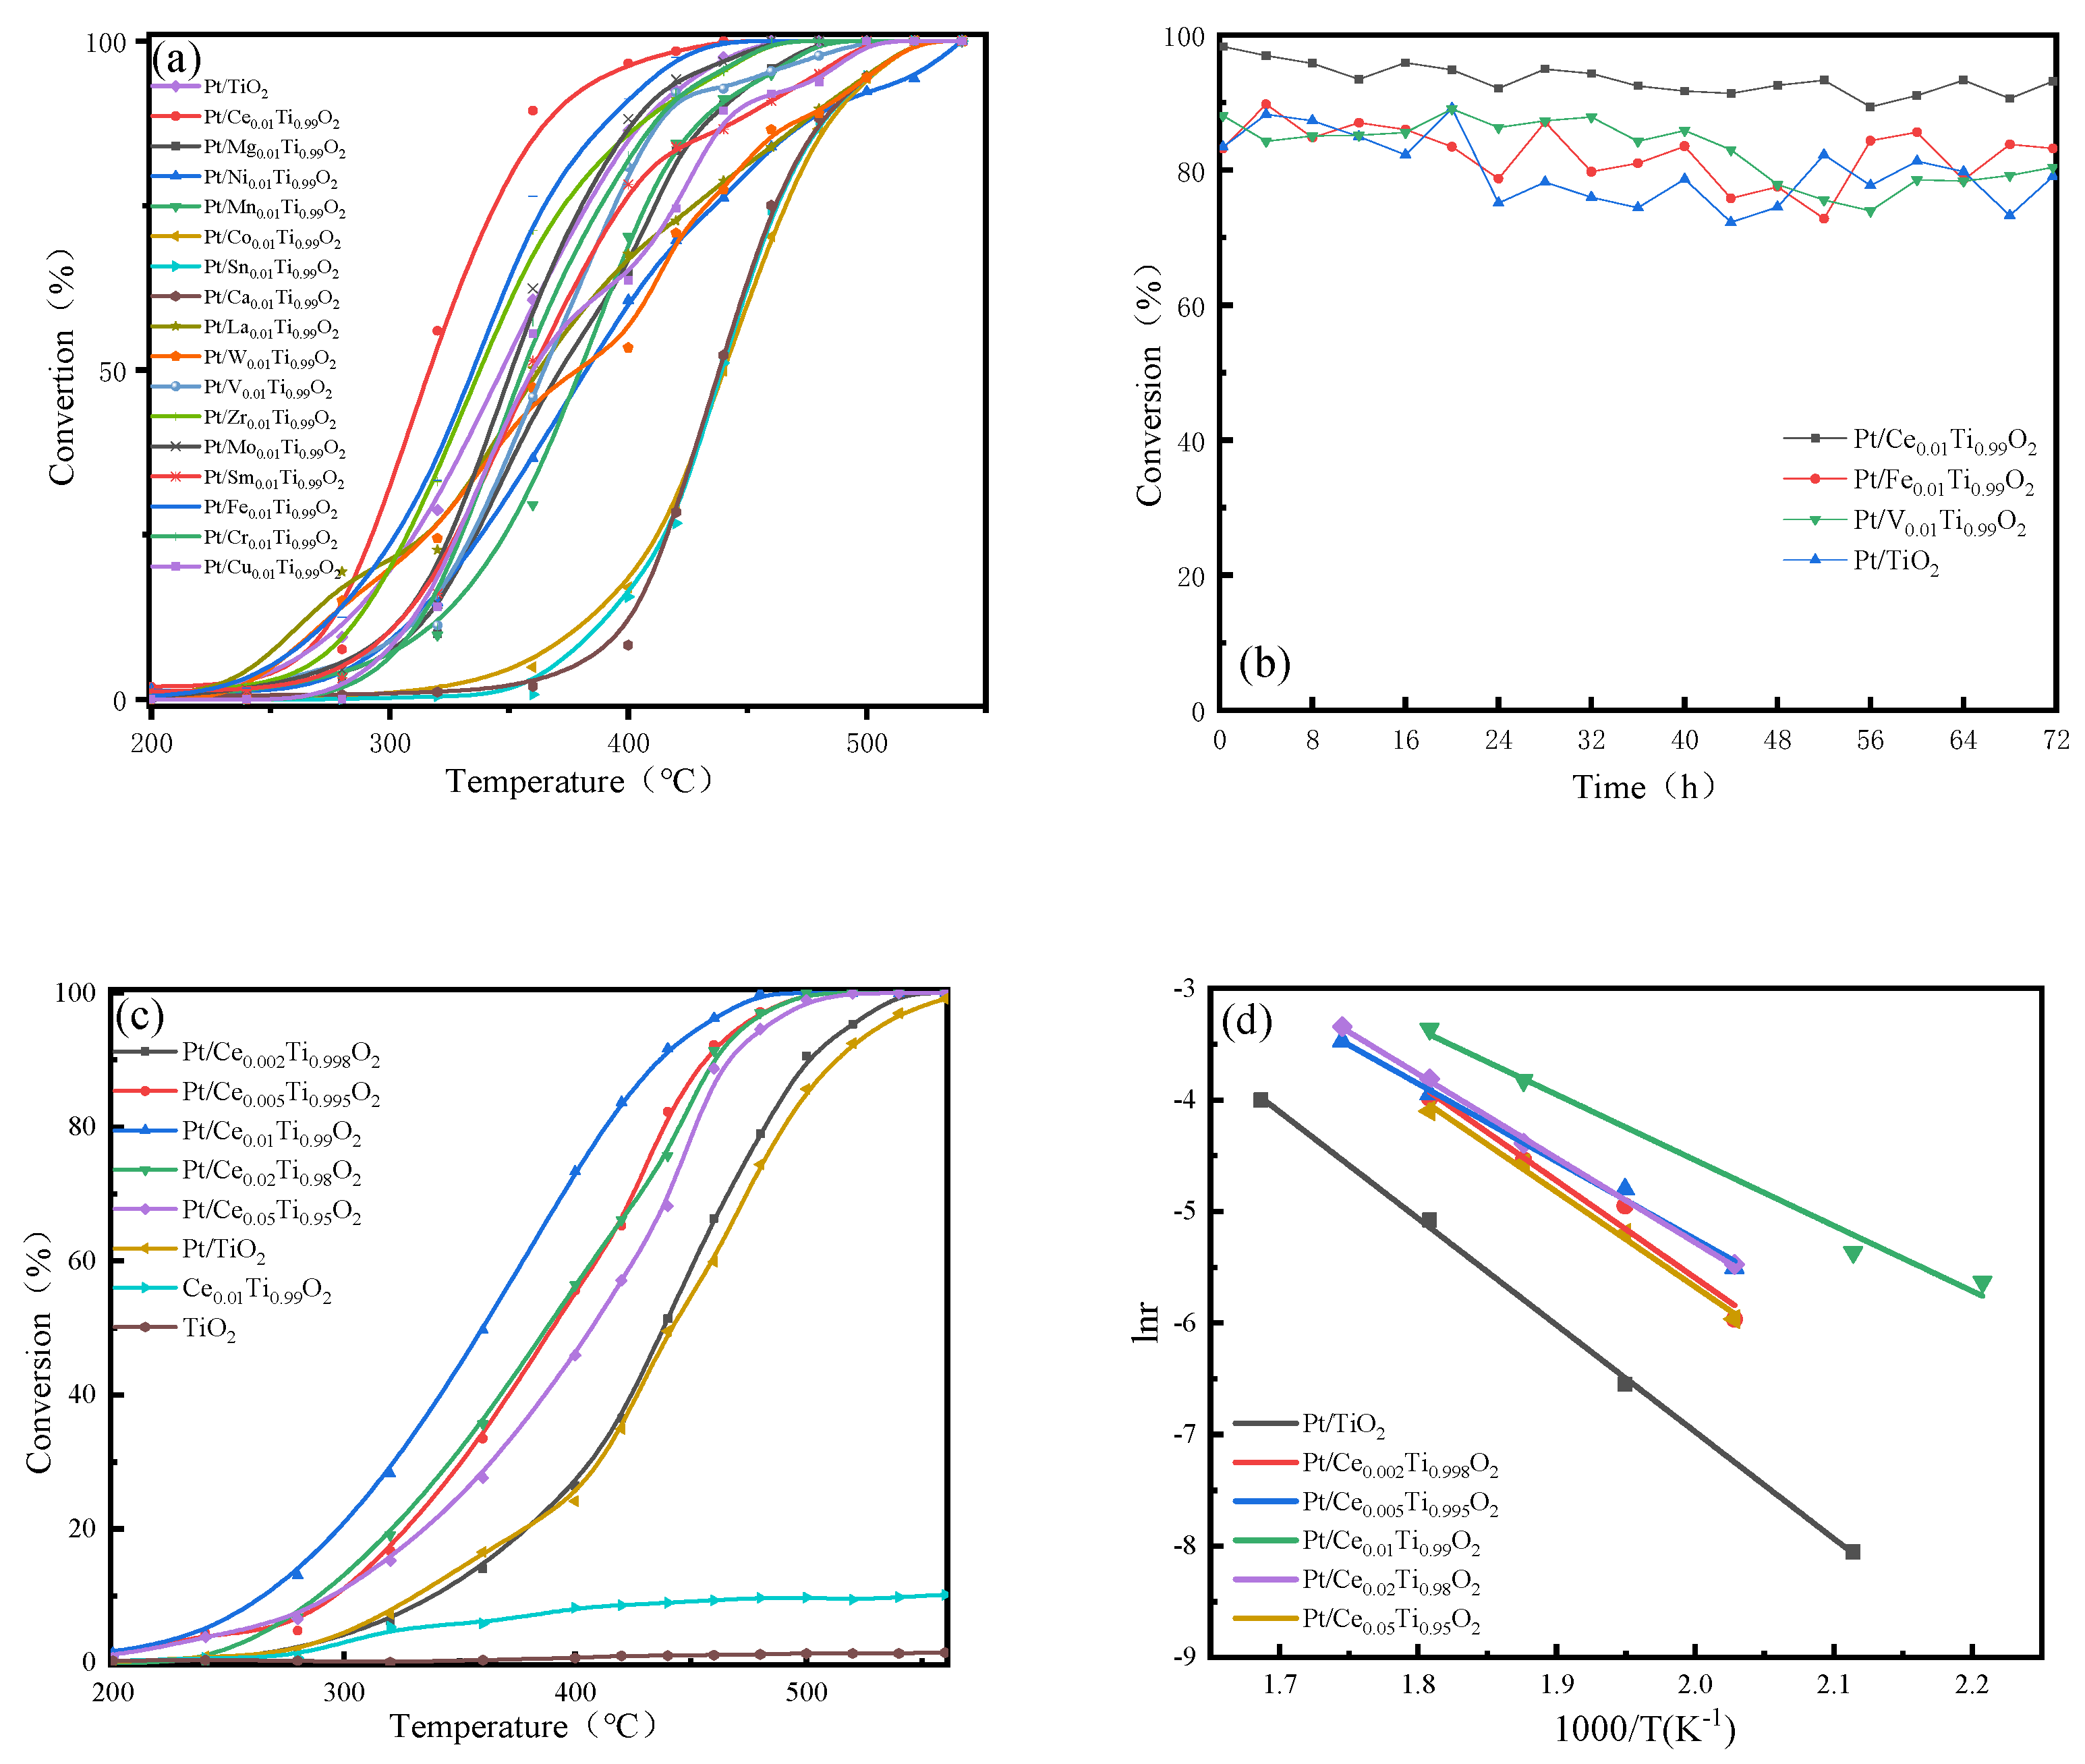
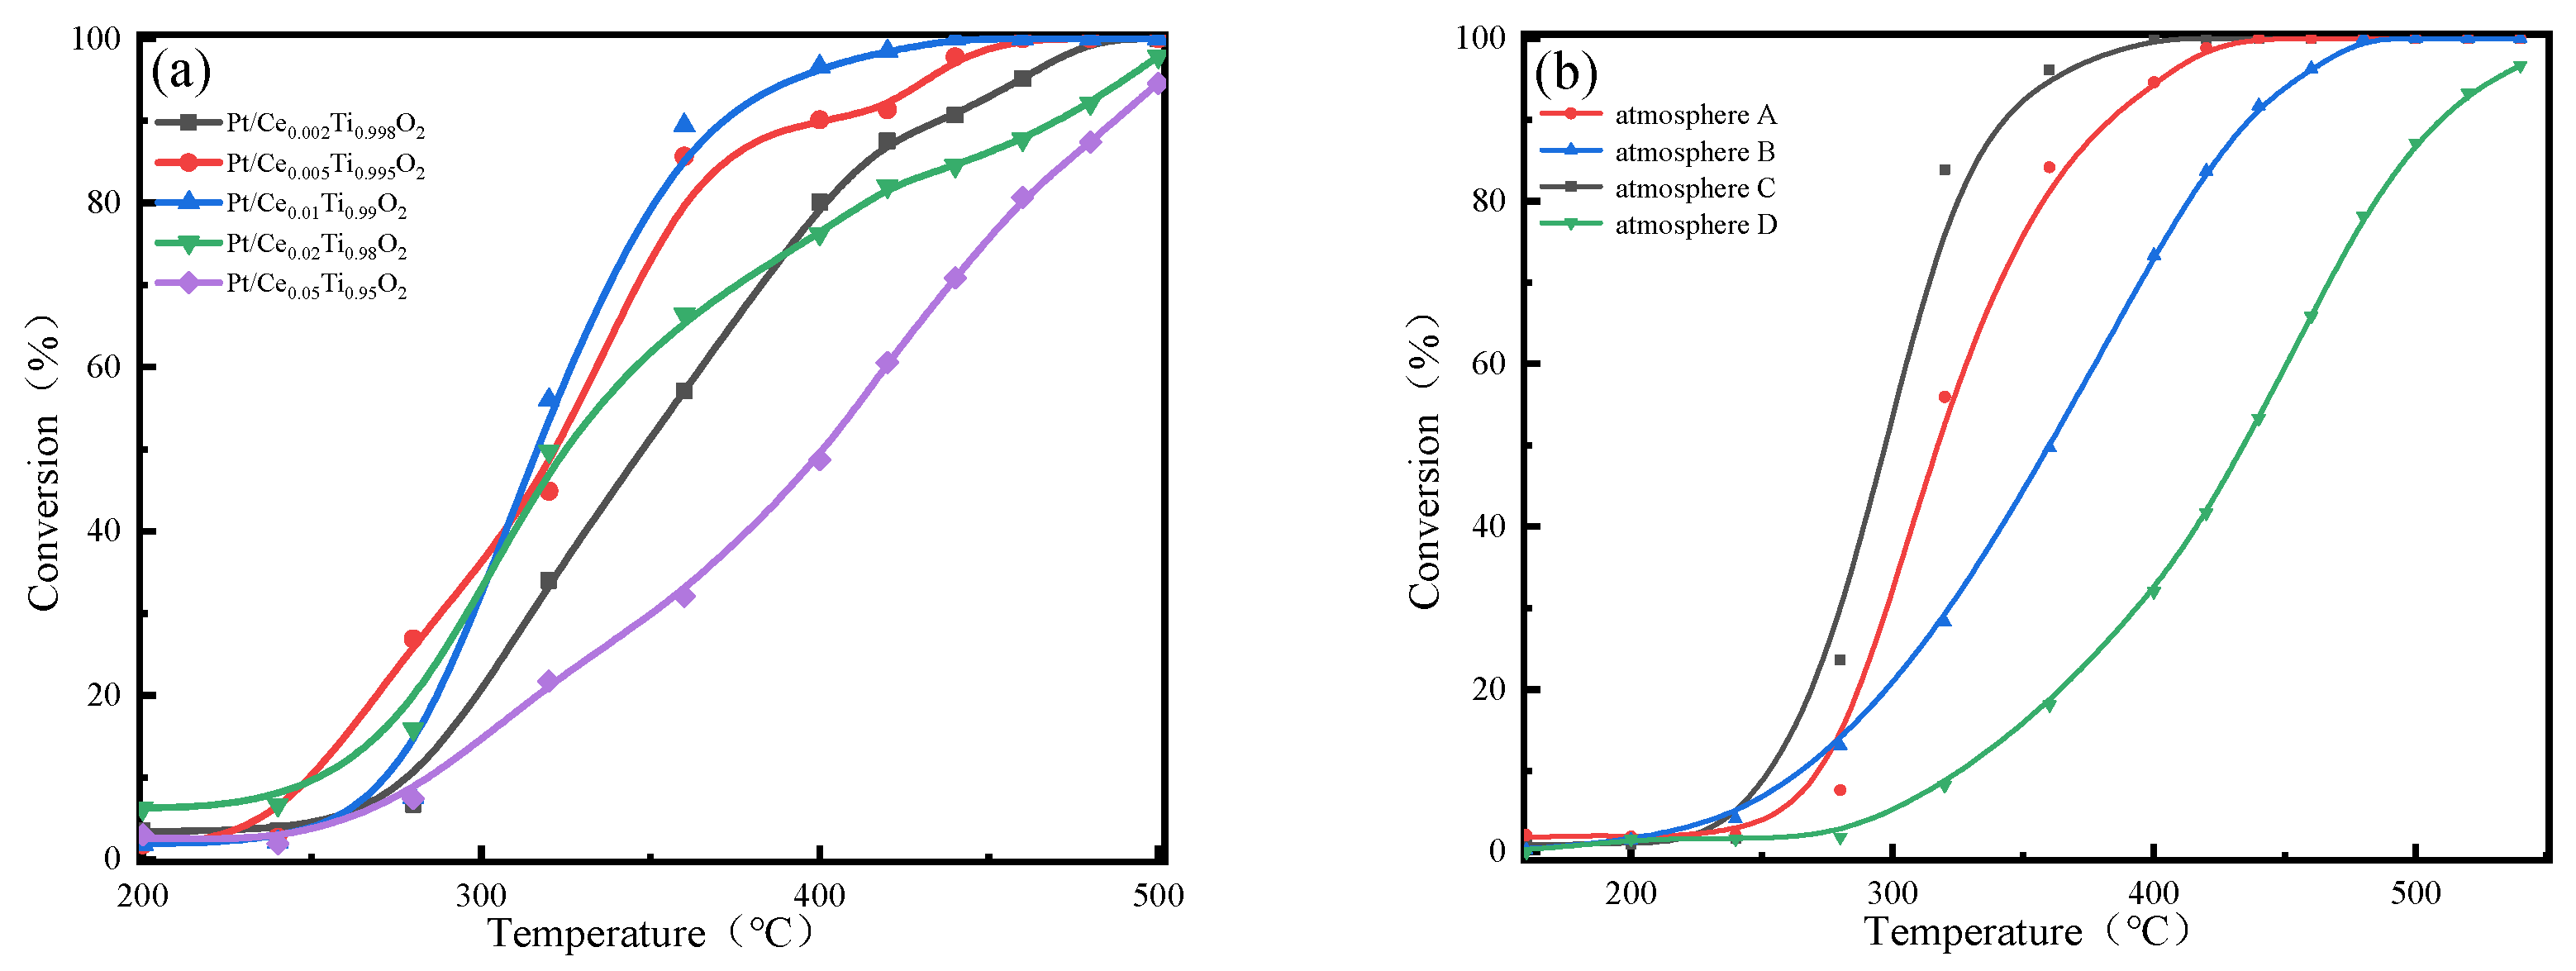
2.1.1. Catalytic Performance in Ethane Oxidation
2.1.2. Catalytic Performance towards SO2 and H2O Resistance
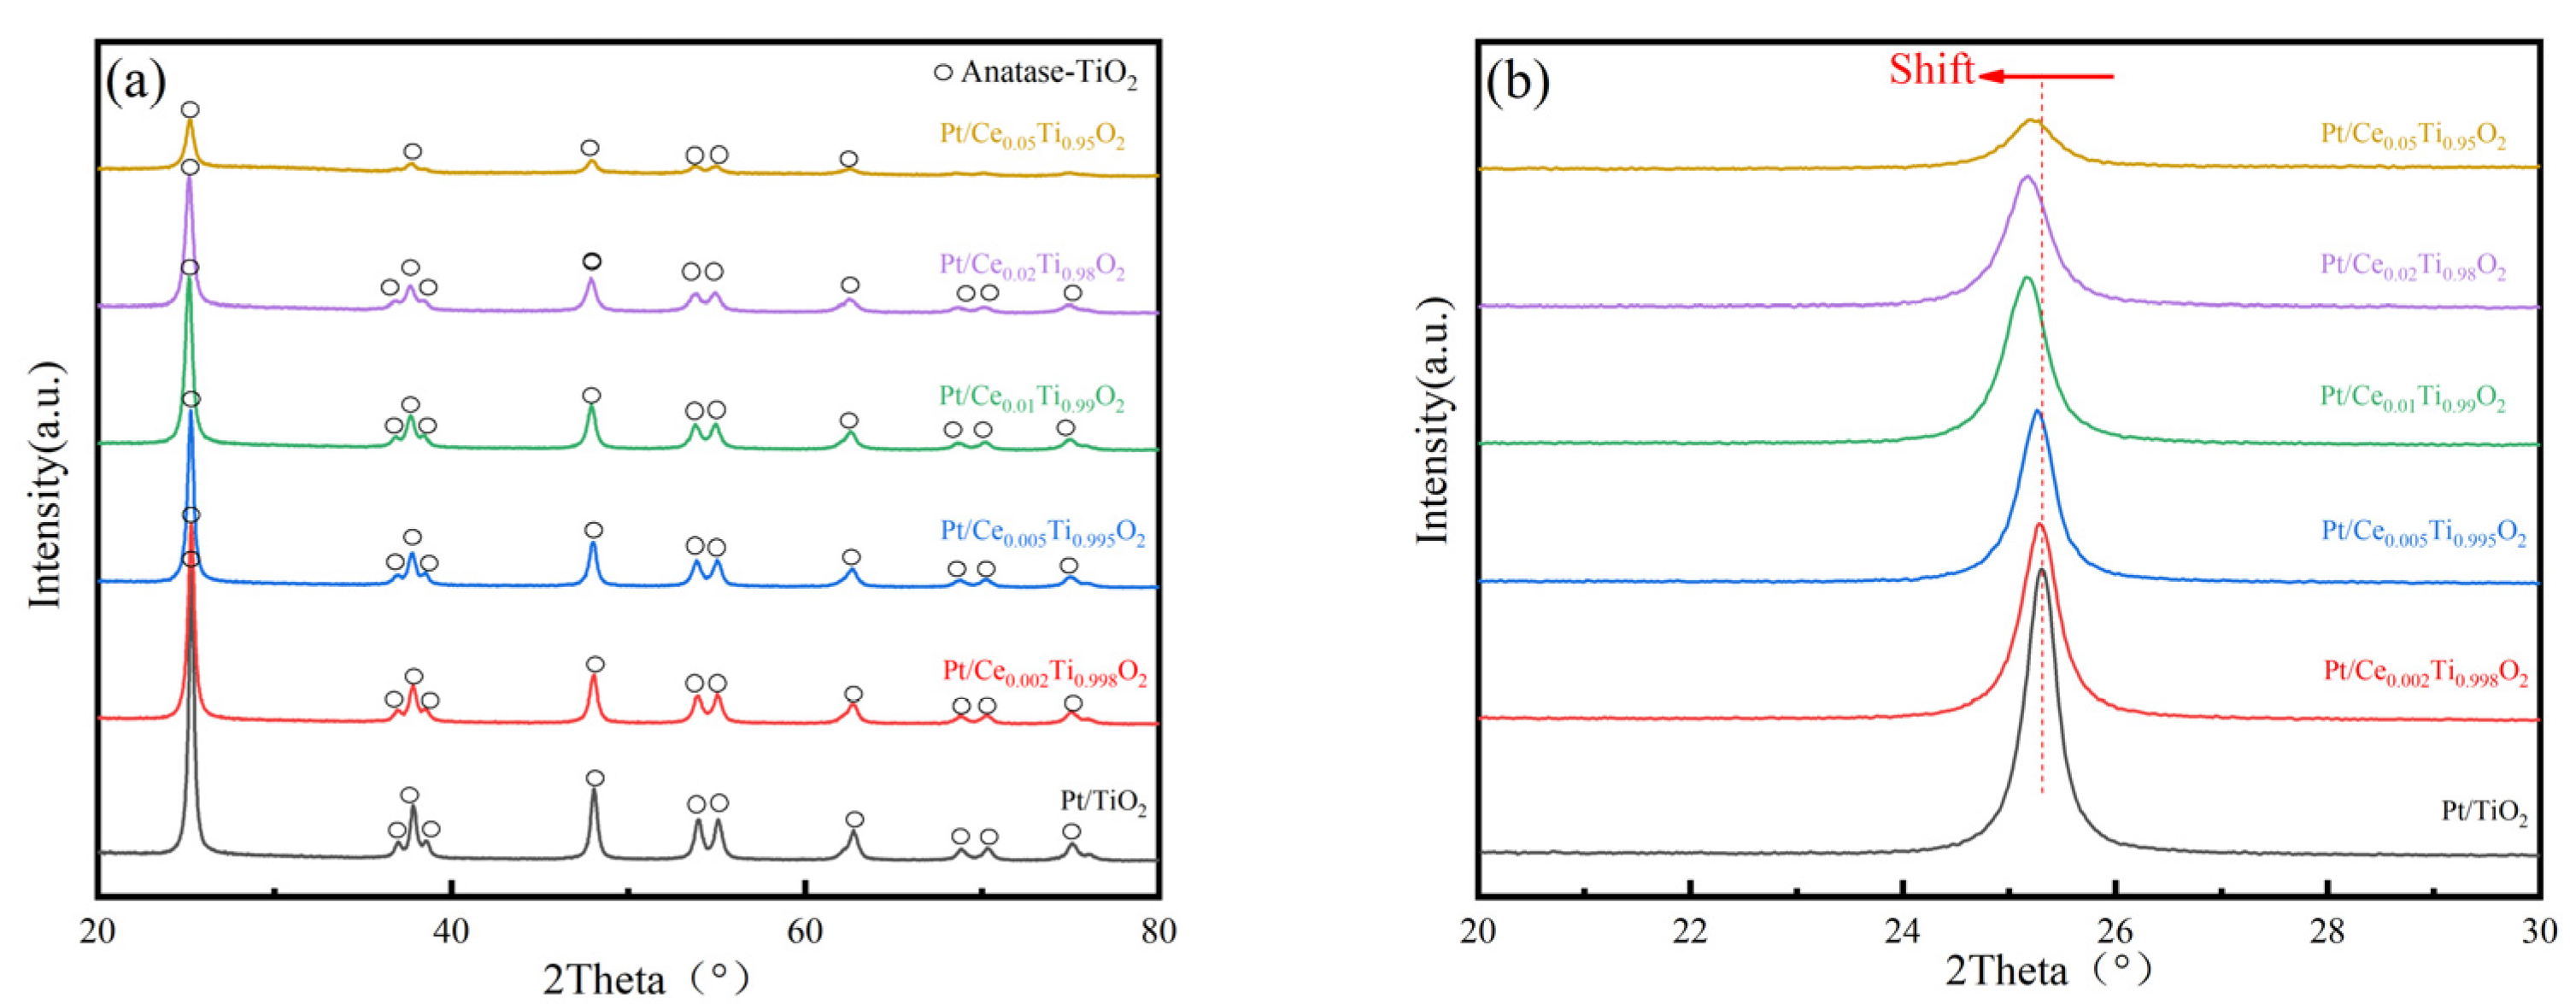
2.2. XRD
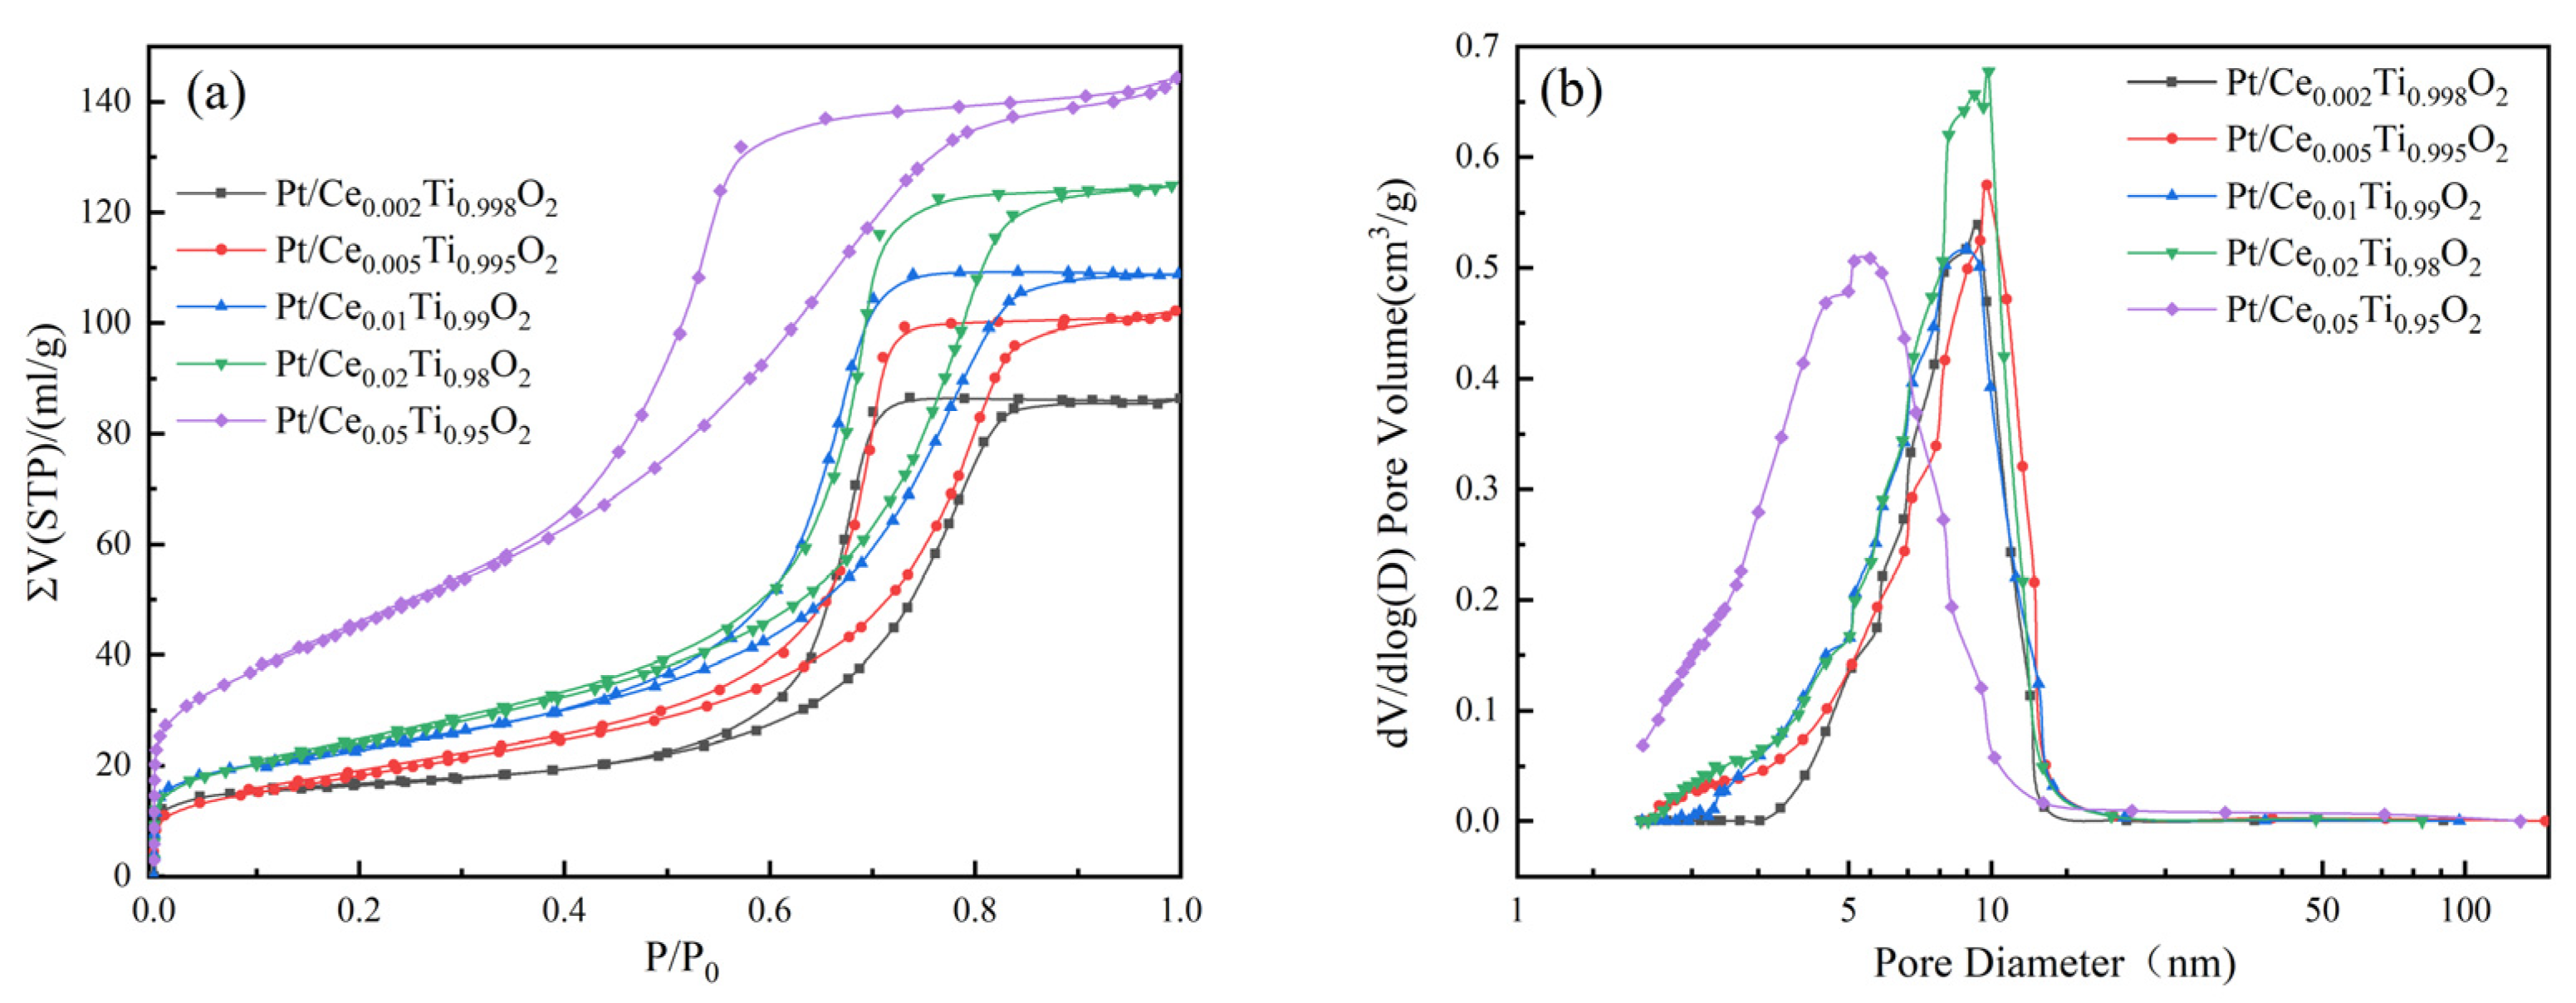
2.3. Physisorption
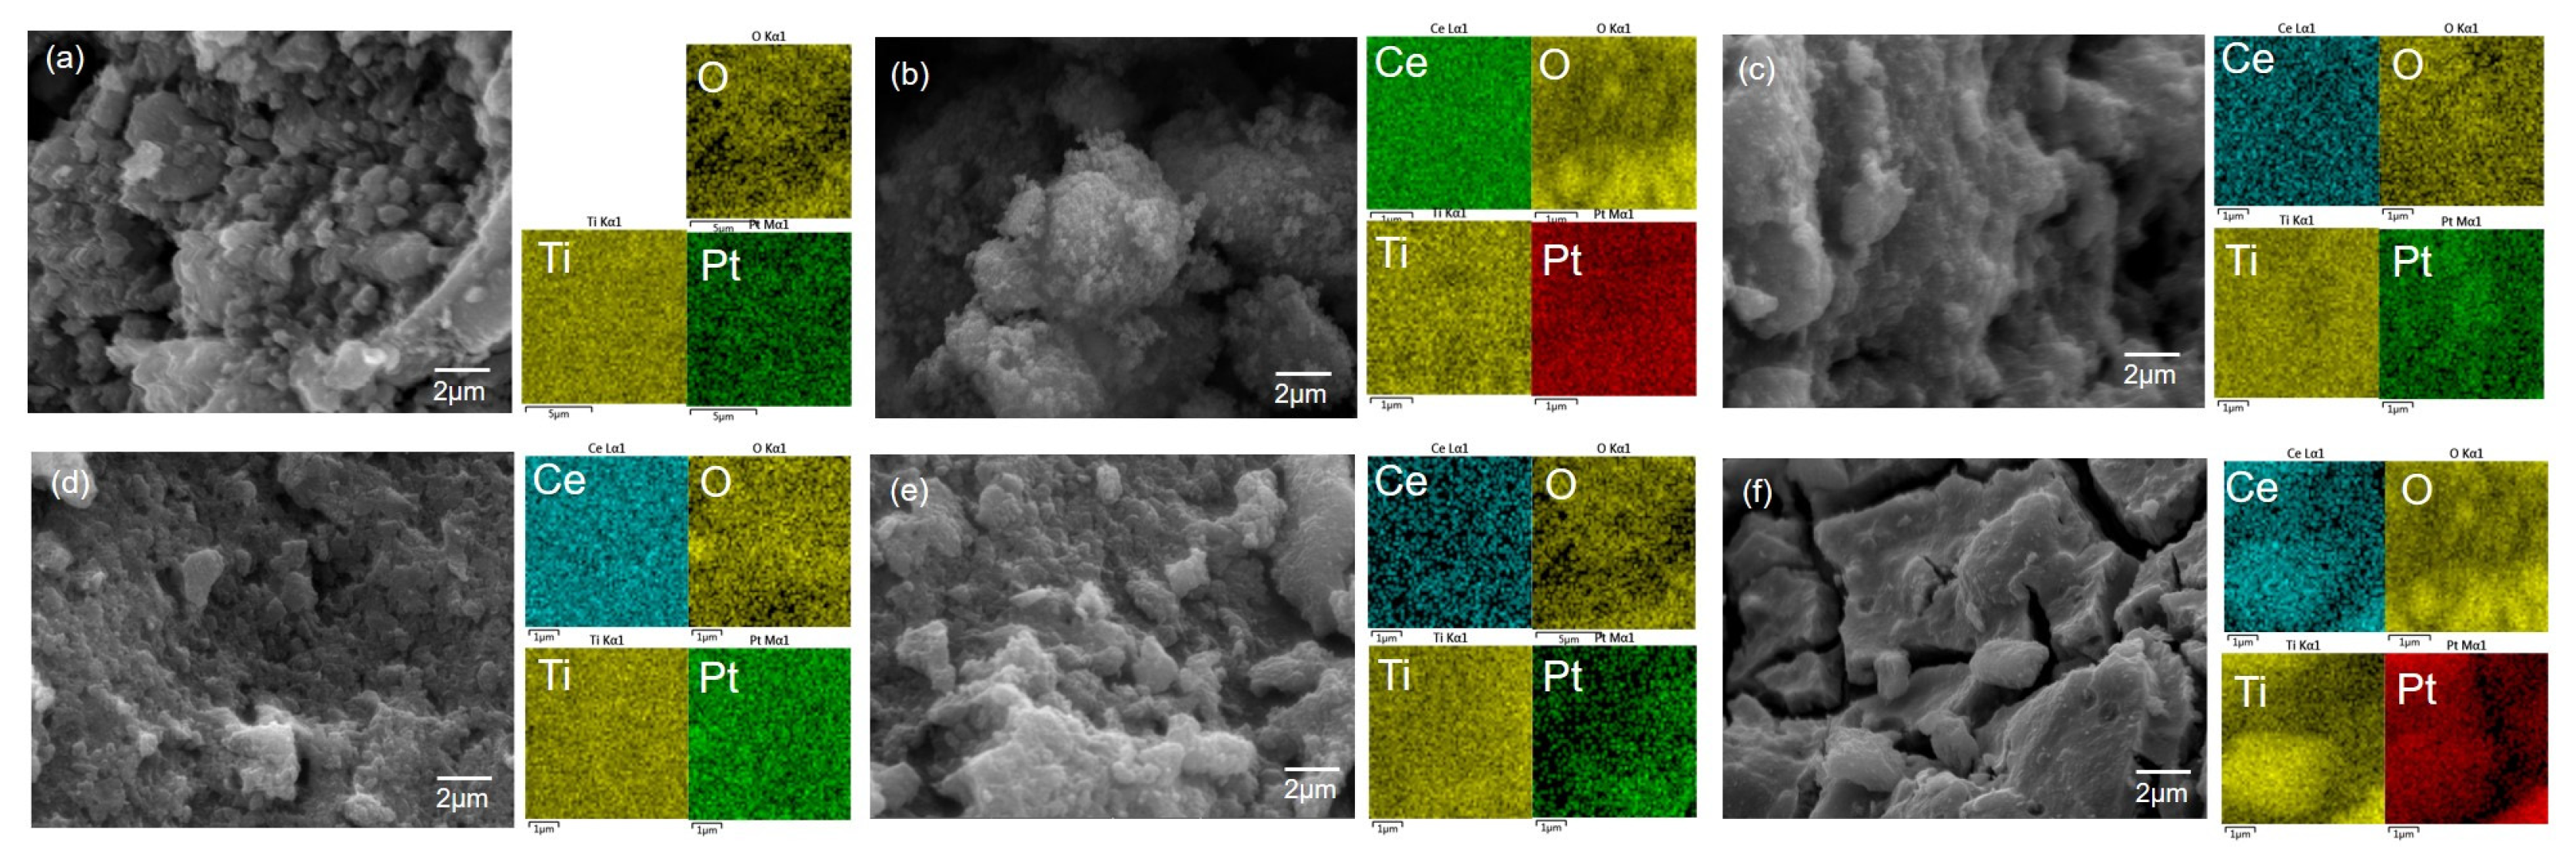
2.4. SEM
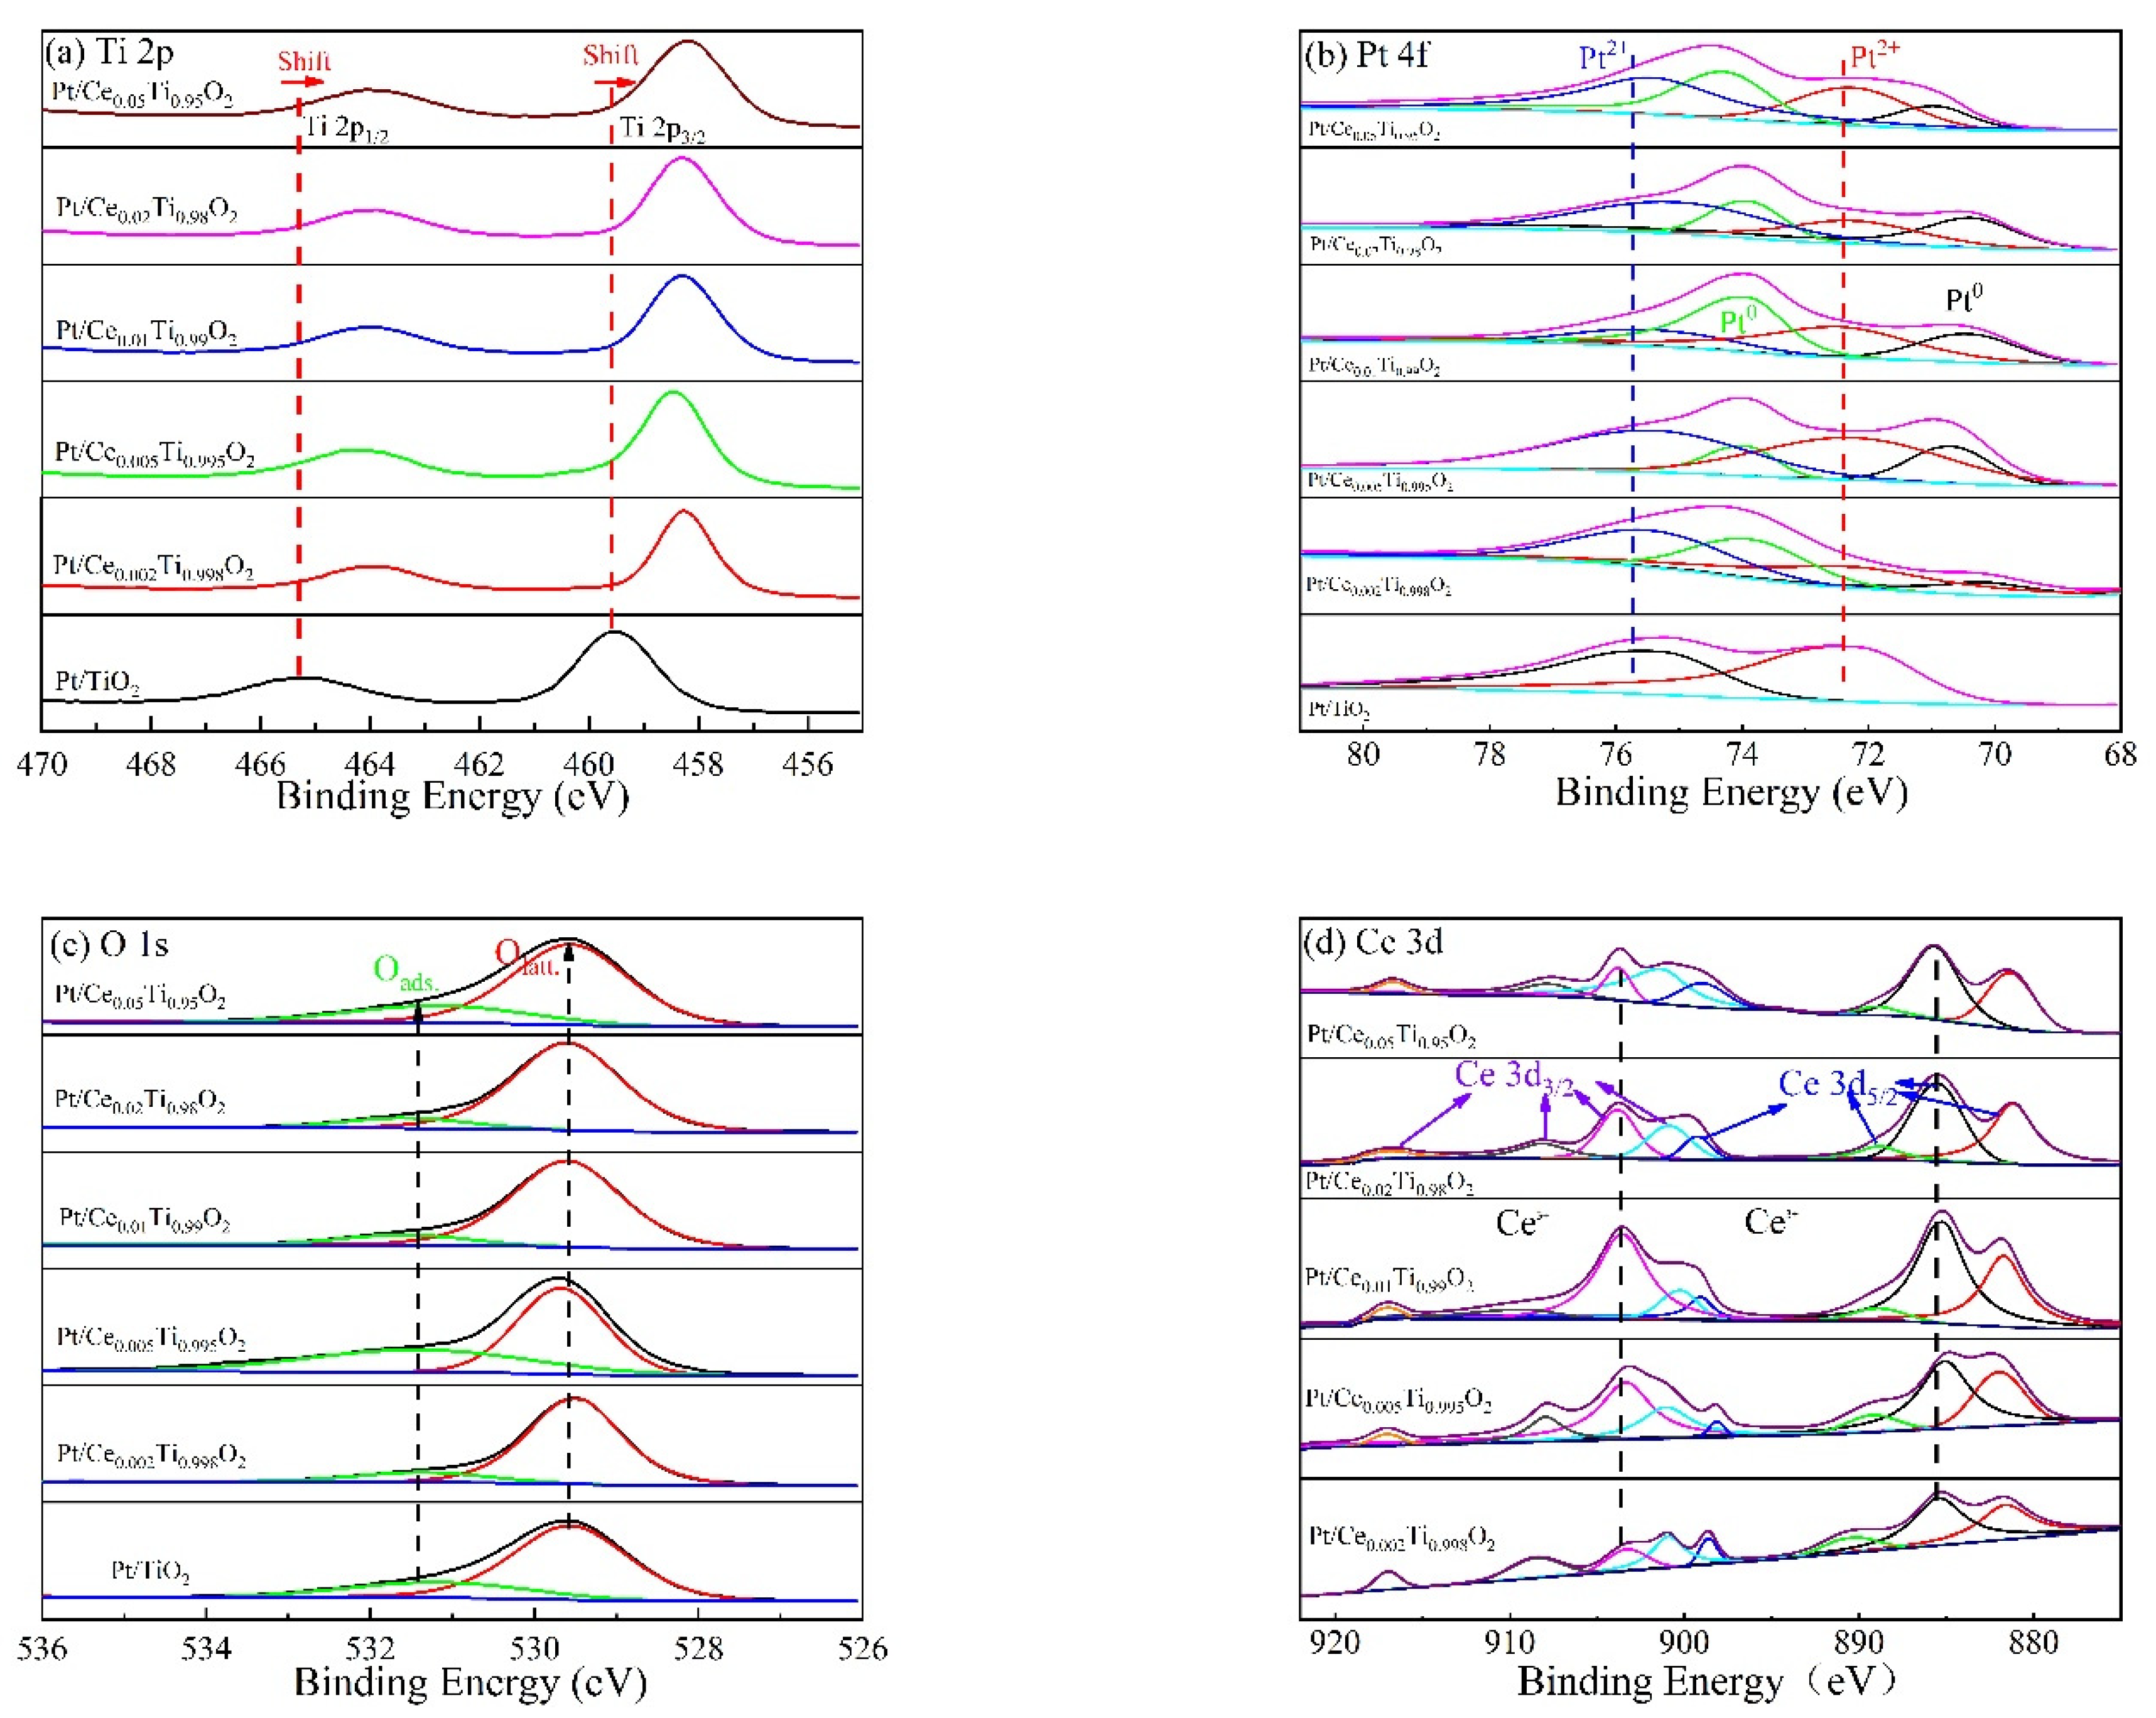
2.5. XPS
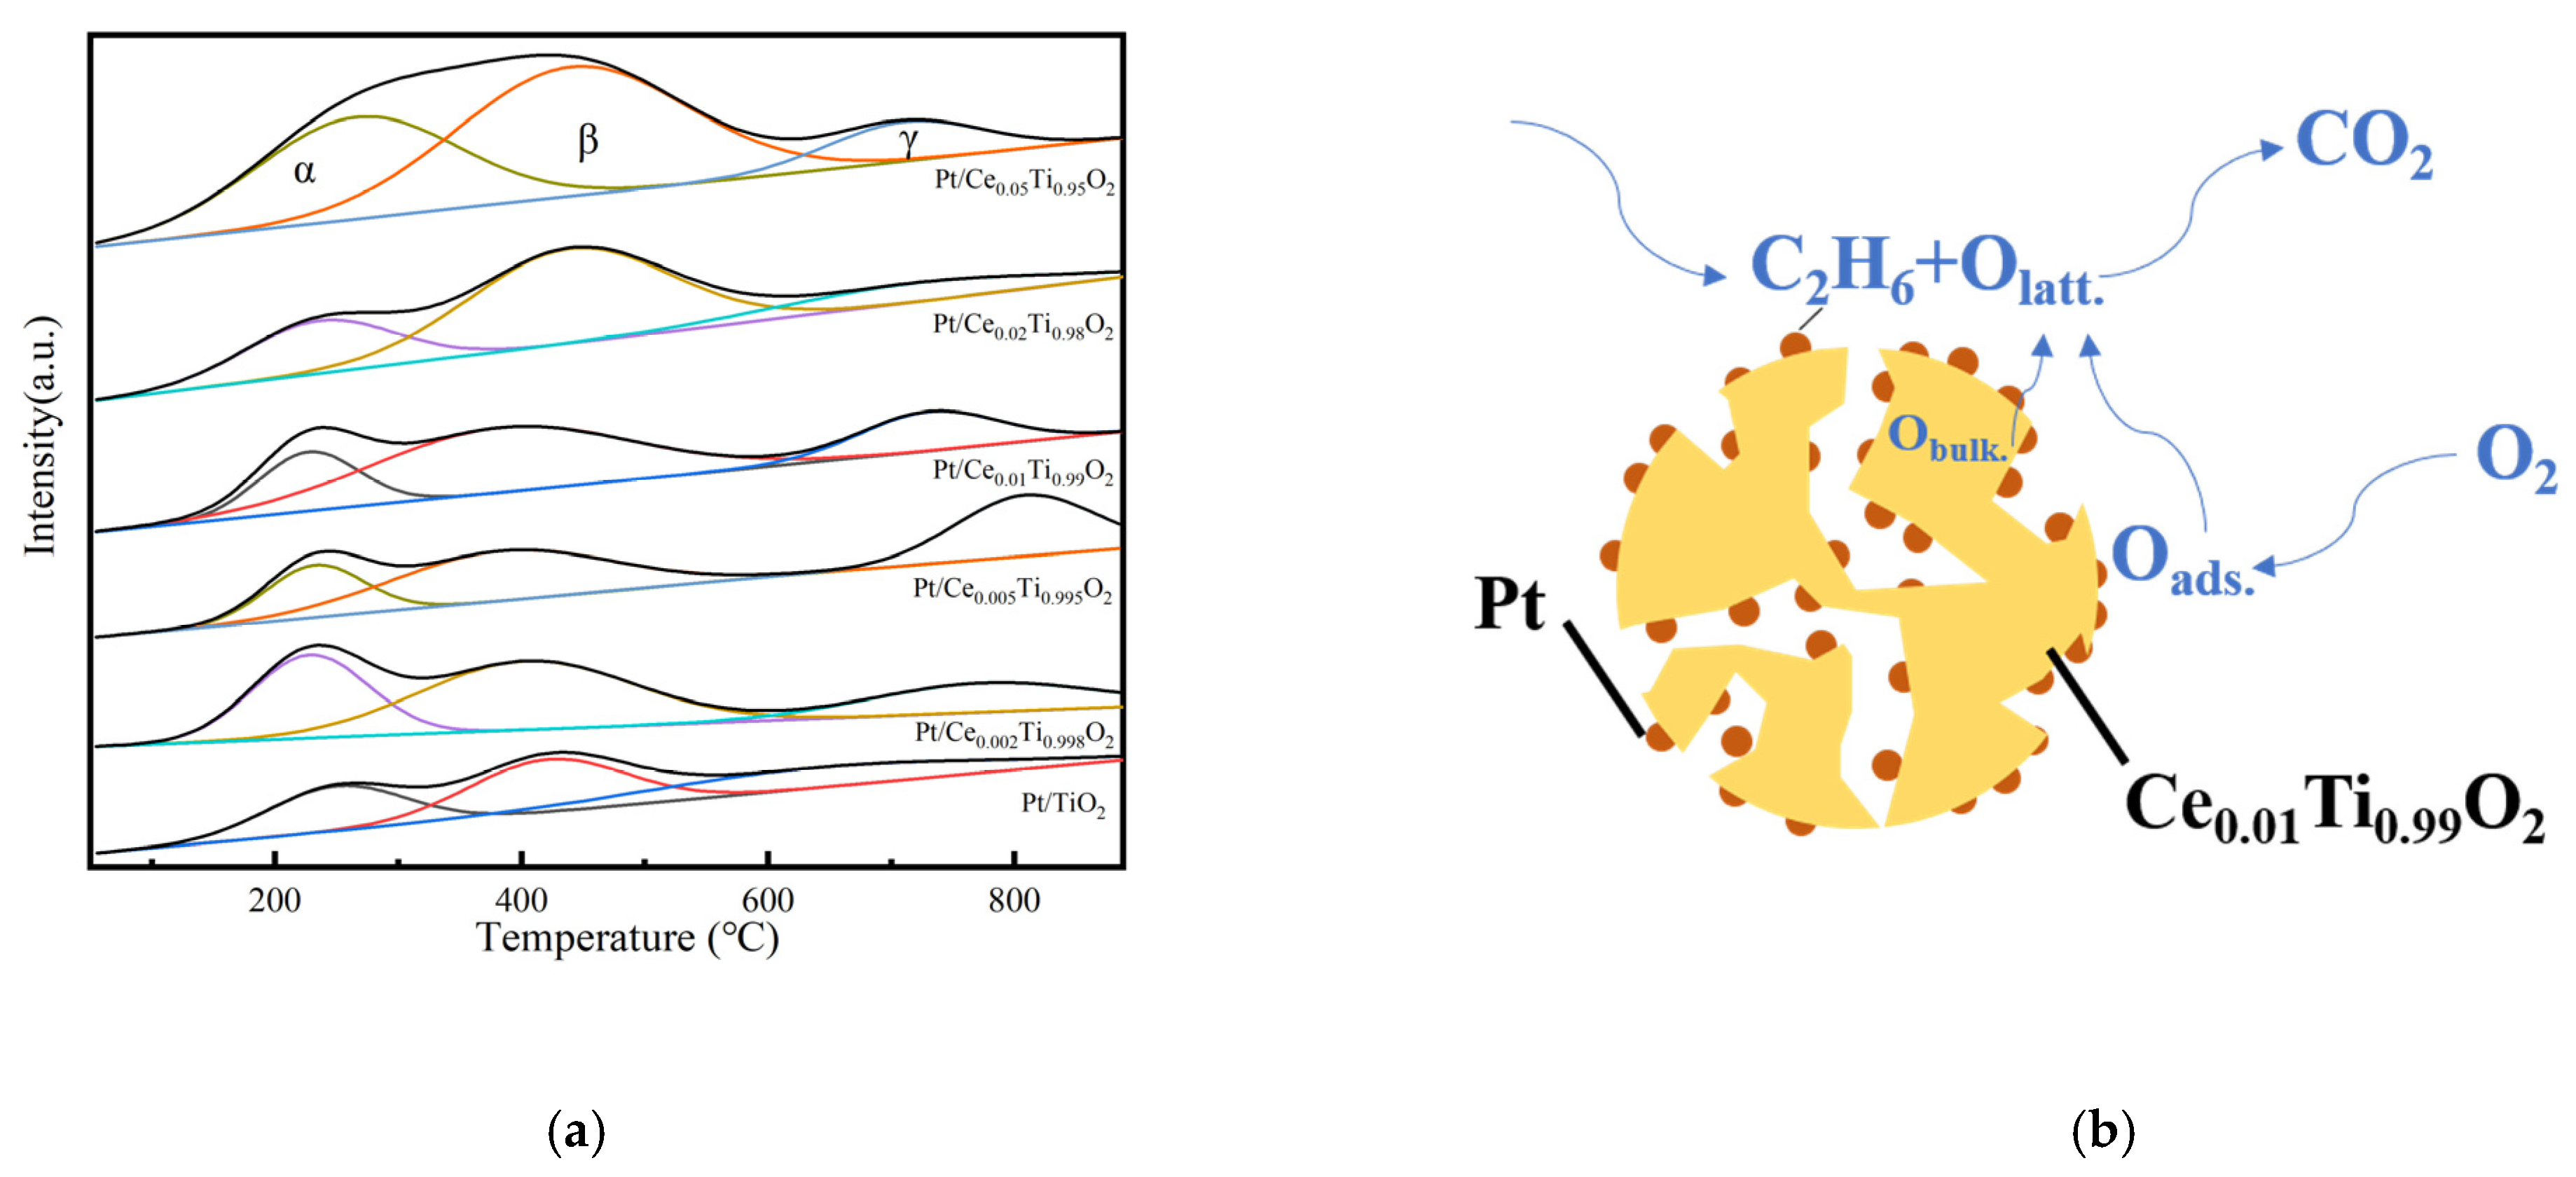
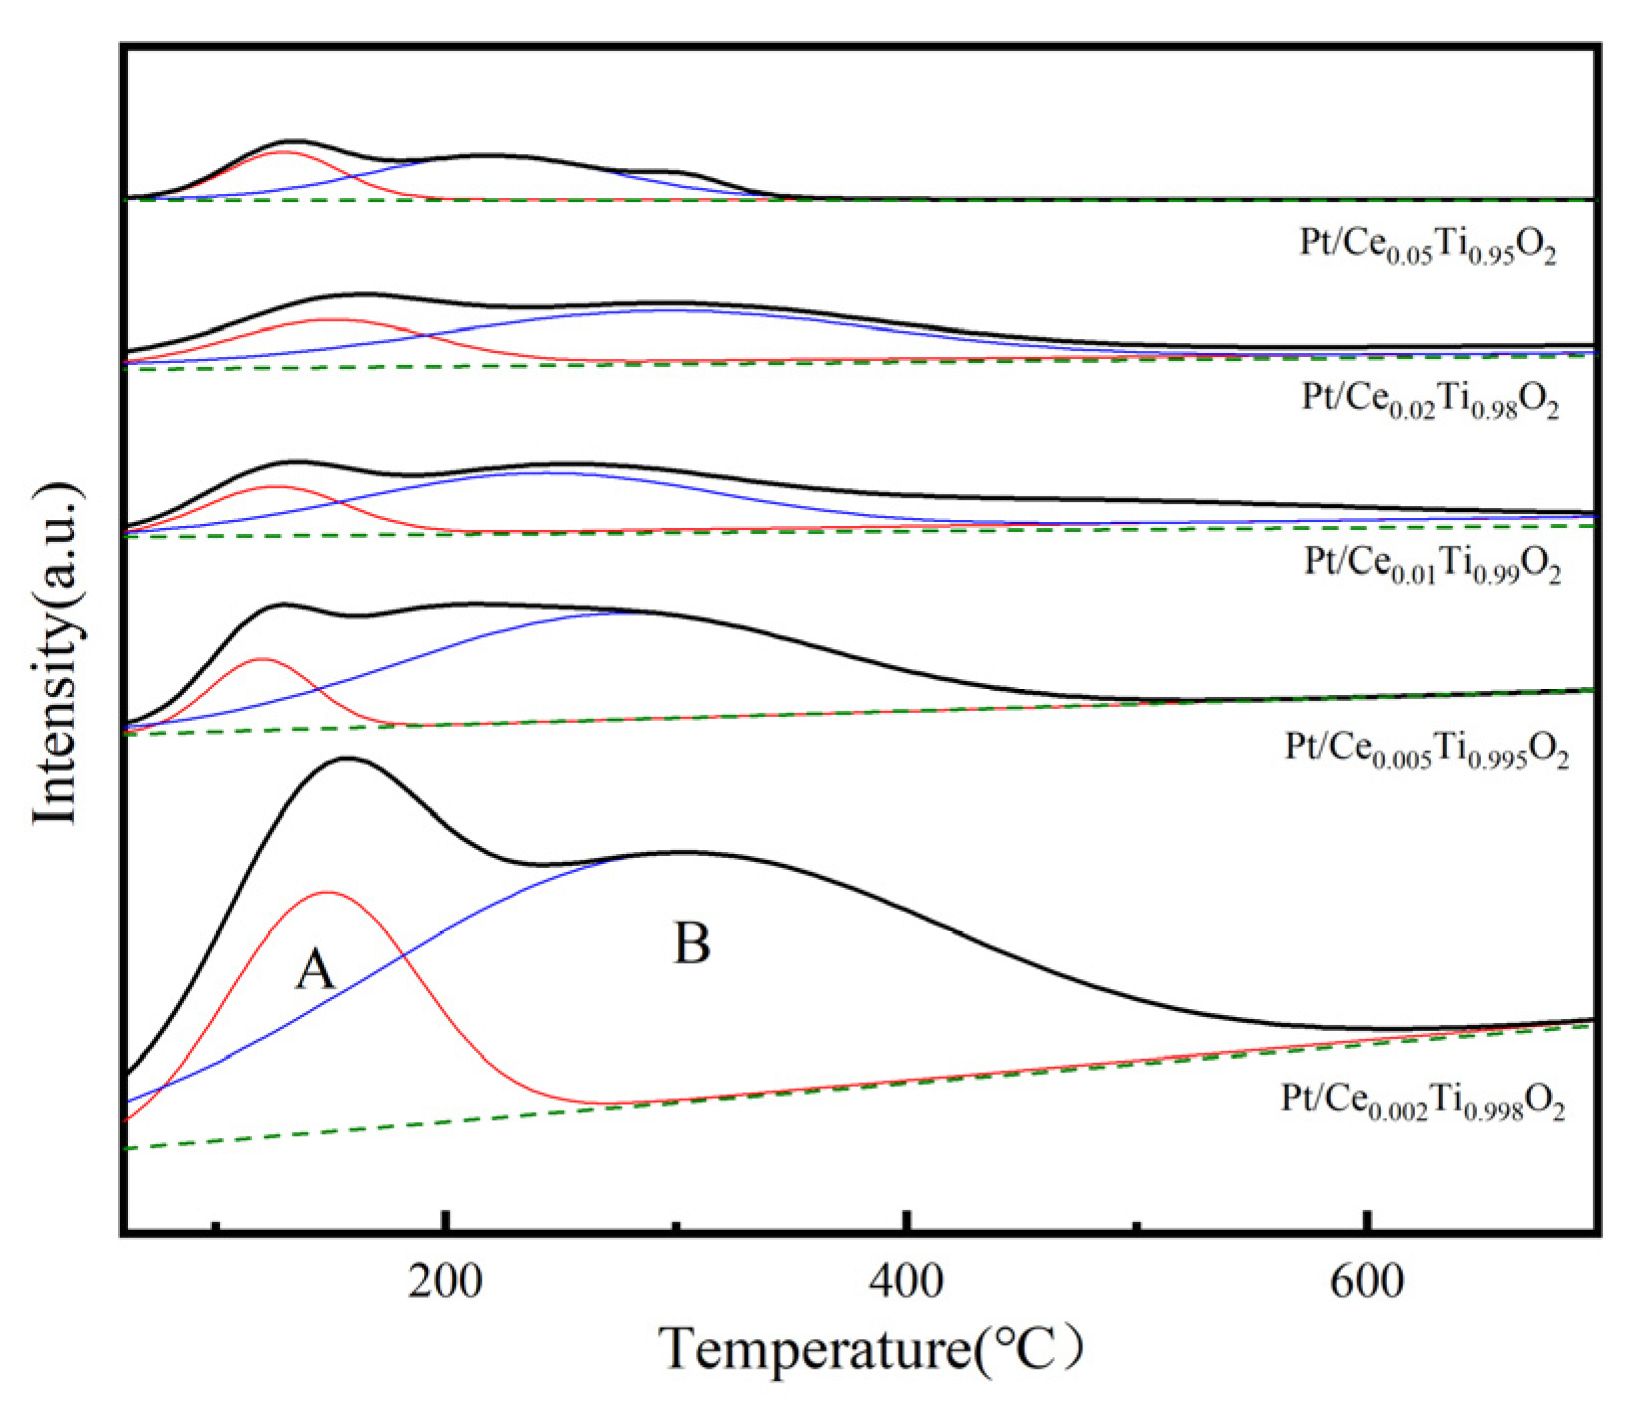
2.6. O2-TPD Analysis
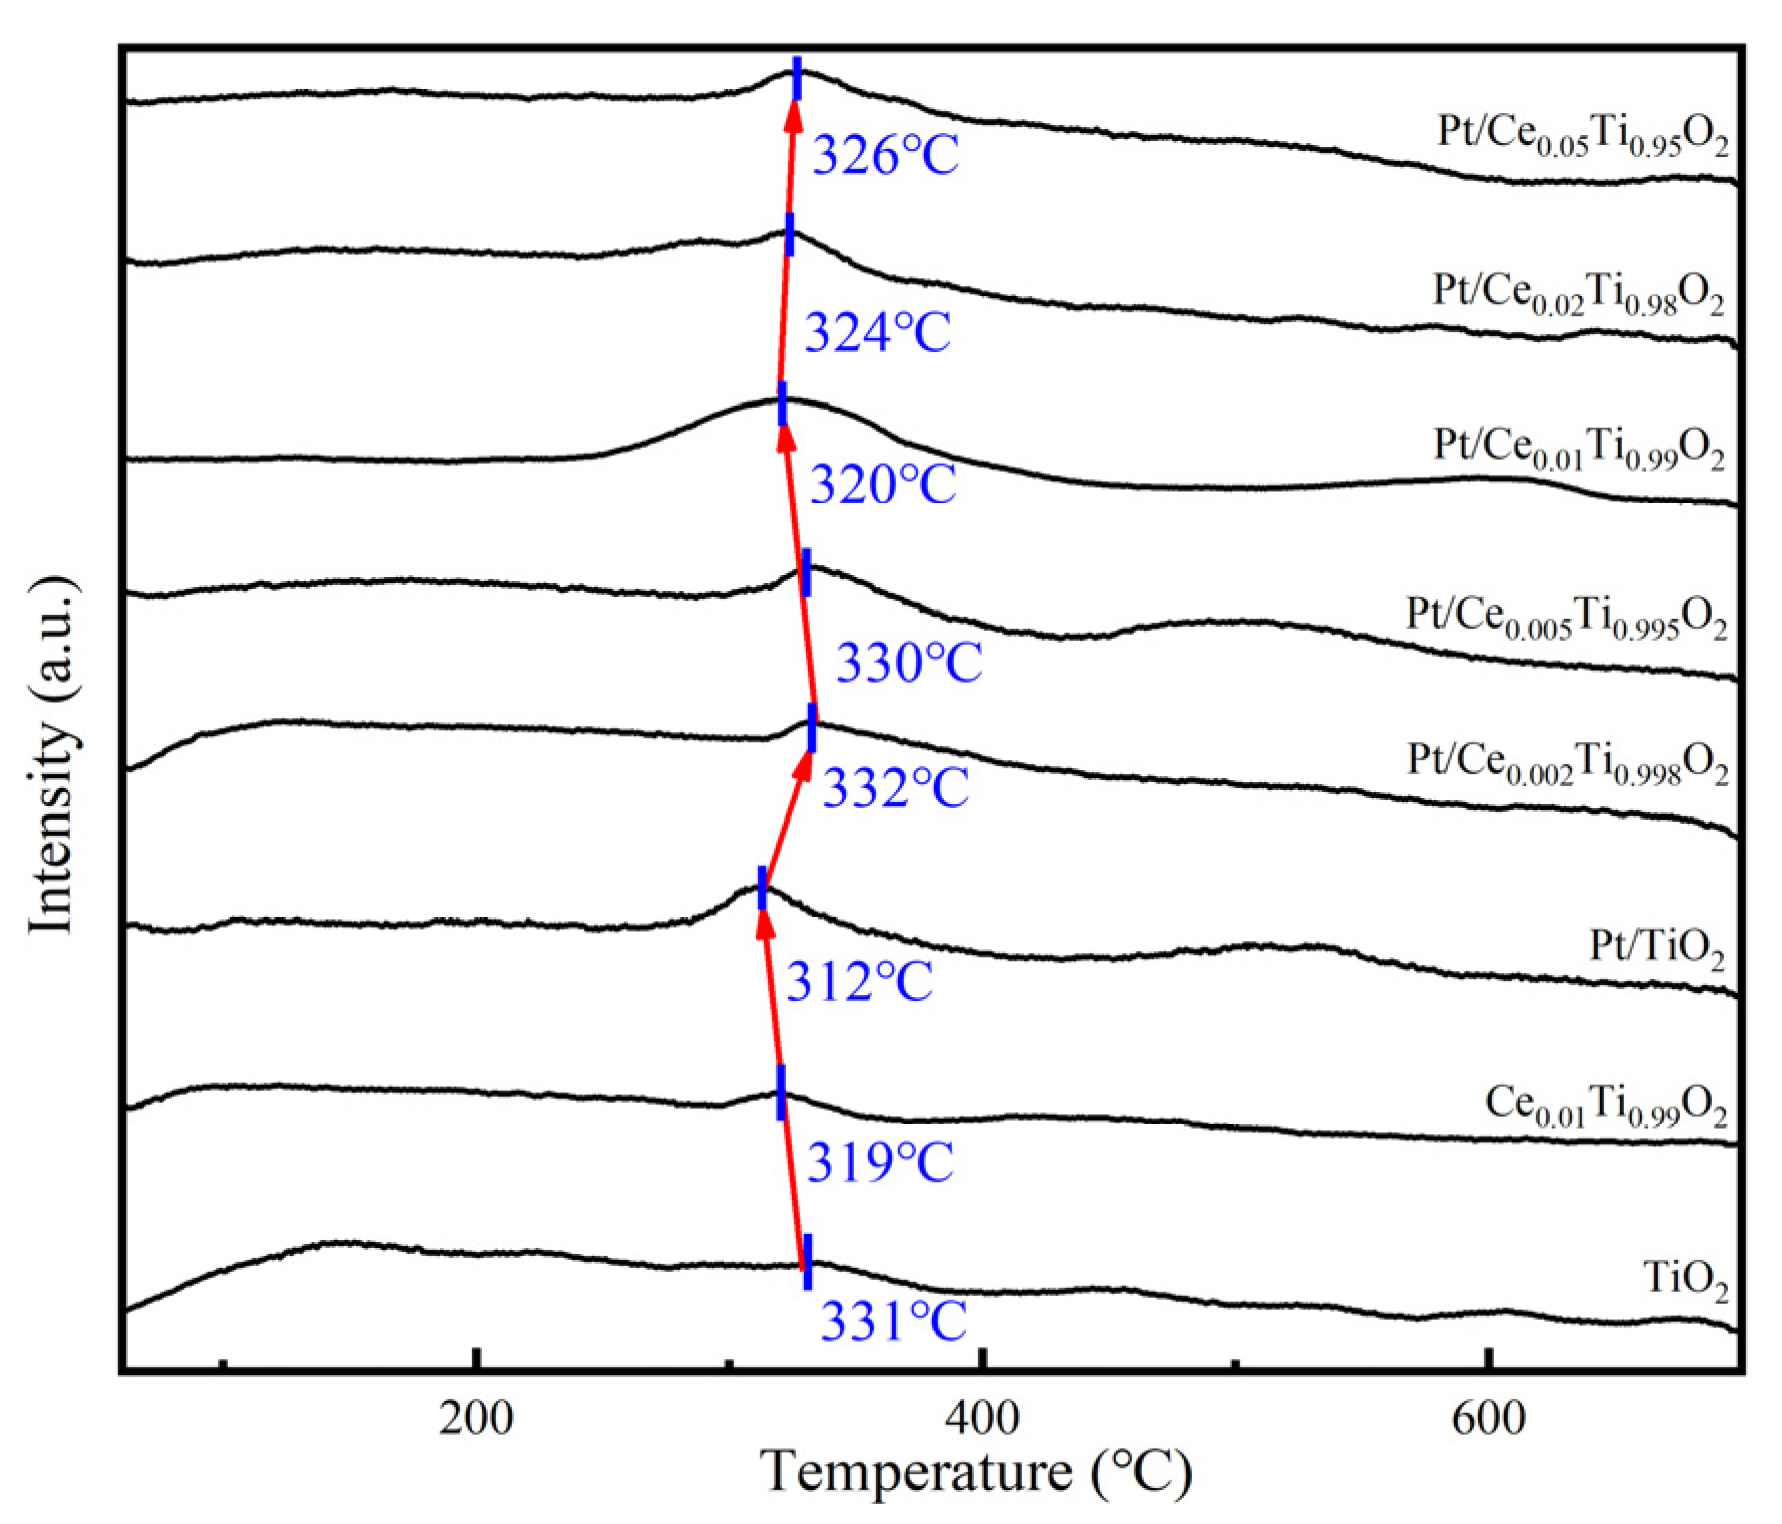
2.7. H2-TPR Analysis
2.8. NH3-TPD Analysis
3. Materials and Methods
3.1. Preparation of Catalysts
3.2. Characterization
3.3. Catalytic Evaluation
4. Conclusions
Supplementary Materials
Author Contributions
Funding
Data Availability Statement
Conflicts of Interest
References
- Hien, T.T.; Huy, D.H.; Dominutti, P.A.; Thien Chi, N.D.; Hopkins, J.R.; Shaw, M.; Forster, G.; Mills, G.; Le, H.A.; Oram, D. Comprehensive volatile organic compound measurements and their implications for ground-level ozone formation in the two main urban areas of Vietnam. Atmos. Environ. 2022, 269, 118872. [Google Scholar] [CrossRef]
- Zulkifli, M.F.H.; Hawari, N.S.S.L.; Latif, M.T.; Hamid, H.H.A.; Mohtar, A.A.A.; Idris, W.M.R.W.; Mustaffa, N.I.H.; Juneng, L. Volatile organic compounds and their contribution to ground-level ozone formation in a tropical urban environment. Chemosphere 2022, 302, 134852. [Google Scholar] [CrossRef] [PubMed]
- He, C.; Cheng, J.; Zhang, X.; Douthwaite, M.; Pattisson, S.; Hao, Z. Recent Advances in the Catalytic Oxidation of Volatile Organic Compounds: A Review Based on Pollutant Sorts and Sources. Chem. Rev. 2019, 119, 4471–4568. [Google Scholar] [CrossRef] [PubMed]
- Suciu, G.; Pasat, A.; Balaceanu, C.M.; Balanescu, M.; Nadrag, C. Assessment of the impact of volatile organic compounds (VOC) on human health in sensitive areas. Proc. SPIE 2018, 10977, 109770S. [Google Scholar]
- Kamal, M.S.; Razzak, S.A.; Hossain, M.M. Catalytic oxidation of volatile organic compounds (VOCs)—A review. Atmos. Environ. 2016, 140, 117–134. [Google Scholar] [CrossRef]
- Jian, Y.; Yu, T.; Jiang, Z.; Yu, Y.; Douthwaite, M.; Liu, J.; Albilali, R.; He, C. In-Depth Understanding of the Morphology Effect of α-Fe2O3 on Catalytic Ethane Destruction. ACS Appl. Mater. Interfaces 2019, 11, 11369–11383. [Google Scholar] [CrossRef]
- Guo, M.; Li, K.; Zhang, H.; Min, X.; Liang, J.; Hu, X.; Guo, W.; Jia, J.; Sun, T. Promotional removal of oxygenated VOC over manganese-based multi oxides from spent lithium-ions manganate batteries: Modification with Fe, Bi and Ce dopants. Sci. Total Environ. 2020, 740, 139951. [Google Scholar] [CrossRef]
- Yu, X.; Deng, J.; Liu, Y.; Jing, L.; Gao, R.; Hou, Z.; Zhang, Z.; Dai, H. Enhanced Water Resistance and Catalytic Performance of Ru/TiO2 by Regulating Brønsted Acid and Oxygen Vacancy for the Oxidative Removal of 1,2-Dichloroethane and Toluene. Environ. Sci. Technol. 2022, 56, 11739–11749. [Google Scholar] [CrossRef]
- Yoo, M.; Yu, Y.-S.; Ha, H.; Lee, S.; Choi, J.-S.; Oh, S.; Kang, E.; Choi, H.; An, H.; Lee, K.-S.; et al. A tailored oxide interface creates dense Pt single-atom catalysts with high catalytic activity. Energy Environ. Sci. 2020, 13, 1231–1239. [Google Scholar] [CrossRef]
- Ye, J.; Cheng, B.; Yu, J.; Ho, W.; Wageh, S.; Al-Ghamdi, A.A. Hierarchical Co3O4-NiO hollow dodecahedron-supported Pt for room-temperature catalytic formaldehyde decomposition. Chem. Eng. J. 2022, 430, 132715. [Google Scholar] [CrossRef]
- Peng, H.; Ying, J.; Zhang, J.; Zhang, X.; Peng, C.; Rao, C.; Liu, W.; Zhang, N.; Wang, X. La-doped Pt/TiO2 as an efficient catalyst for room temperature oxidation of low concentration HCHO. Chin. J. Catal. 2017, 38, 39–47. [Google Scholar] [CrossRef]
- Chen, Q.-Y.; Li, N.; Luo, M.-F.; Lu, J.-Q. Catalytic oxidation of dichloromethane over Pt/CeO2–Al2O3 catalysts. Appl. Catal. B Environ. 2012, 127, 159–166. [Google Scholar] [CrossRef]
- Shi, Y.; Wang, J.; Zhou, R. Pt-support interaction and nanoparticle size effect in Pt/CeO2–TiO2 catalysts for low temperature VOCs removal. Chemosphere 2021, 265, 129127. [Google Scholar] [CrossRef] [PubMed]
- Huang, K.; Lin, L.; Yang, K.; Dai, W.; Chen, X.; Fu, X. Promotion effect of ultraviolet light on NO+CO reaction over Pt/TiO2 and Pt/CeO2–TiO2 catalysts. Appl. Catal. B Environ. 2015, 179, 395–406. [Google Scholar] [CrossRef]
- Feng, Y.; Ma, P.; Wang, Z.; Shi, Y.; Wang, Z.; Peng, Y.; Jing, L.; Liu, Y.; Yu, X.; Wang, X.; et al. Synergistic Effect of Reactive Oxygen Species in Photothermocatalytic Removal of VOCs from Cooking Oil Fumes over Pt/CeO2/TiO2. Environ. Sci. Technol. 2022, 56, 17341–17351. [Google Scholar] [CrossRef]
- Ma, X.; Shen, J.; Pu, W.; Sun, H.; Pang, Q.; Guo, J.; Zhou, T.; Cao, H. Water-resistant Fe–Ca–Ox/TiO2 catalysts for low temperature 1,2-dichlorobenzene oxidation. Appl. Catal. A Gen. 2013, 466, 68–76. [Google Scholar] [CrossRef]
- Corro, G.; Fierro, J.L.G.; Odilon, V.C. An XPS evidence of Pt4+ present on sulfated Pt/Al2O3 and its effect on propane combustion. Catal. Commun. 2003, 4, 371–376. [Google Scholar] [CrossRef]
- Fan, X.; Liu, D.; Sun, X.; Yu, X.; Li, D.; Yang, Y.; Liu, H.; Diao, J.; Xie, Z.; Kong, L.; et al. Mn-doping induced changes in Pt dispersion and PtxMny alloying extent on Pt/Mn-DMSN catalyst with enhanced propane dehydrogenation stability. J. Catal. 2020, 389, 450–460. [Google Scholar] [CrossRef]
- Hu, D.; Fan, W.; Liu, Z.; Li, L. Three-Dimensionally Hierarchical Pt/C Nanocomposite with Ultra-High Dispersion of Pt Nanoparticles as a Highly Efficient Catalyst for Chemoselective Cinnamaldehyde Hydrogenation. Chem. Cat. Chem. 2018, 10, 779–788. [Google Scholar] [CrossRef]
- Zhao, Y.; Zhao, Y.; Shi, R.; Wang, B.; Waterhouse, G.I.N.; Wu, L.-Z.; Tung, C.-H.; Zhang, T. Tuning Oxygen Vacancies in Ultrathin TiO2 Nanosheets to Boost Photocatalytic Nitrogen Fixation up to 700 nm. Adv. Mater. 2019, 31, 1806482. [Google Scholar] [CrossRef]
- Fang, J.; Bi, X.; Si, D.; Jiang, Z.; Huang, W. Spectroscopic studies of interfacial structures of CeO2–TiO2 mixed oxides. Appl. Surf. Sci. 2007, 253, 8952–8961. [Google Scholar] [CrossRef]
- Thommes, M.; Kaneko, K.; Neimark, A.V.; Olivier, J.P.; Rodriguez-Reinoso, F.; Rouquerol, J.; Sing, K.S.W. Physisorption of gases, with special reference to the evaluation of surface area and pore size distribution (IUPAC Technical Report). Pure Appl. Chem. 2015, 87, 1051–1069. [Google Scholar] [CrossRef]
- Stefa, S.; Lykaki, M.; Fragkoulis, D.; Binas, V.; Pandis, P.K.; Stathopoulos, V.N.; Konsolakis, M. Effect of the Preparation Method on the Physicochemical Properties and the CO Oxidation Performance of Nanostructured CeO2/TiO2 Oxides. Processes 2020, 8, 847. [Google Scholar] [CrossRef]
- Shi, Y.; Guo, X.; Wang, Y.; Kong, F.; Zhou, R. New insight into the design of highly dispersed Pt supported CeO2–TiO2 catalysts with superior activity for VOCs low-temperature removal. Green Energy Environ. 2022, in press. [Google Scholar] [CrossRef]
- Svintsitskiy, D.A.; Kibis, L.S.; Stadnichenko, A.I.; Koscheev, S.V.; Zaikovskii, V.I.; Boronin, A.I. Highly Oxidized Platinum Nanoparticles Prepared through Radio-Frequency Sputtering: Thermal Stability and Reaction Probability towards CO. Chemphyschem 2015, 16, 3318–3324. [Google Scholar] [CrossRef]
- Fu, J.; Zhang, X.; Li, H.; Chen, B.; Ye, S.; Zhang, N.; Yu, Z.; Zheng, J.; Chen, B. Enhancing electronic metal support interaction (EMSI) over Pt/TiO2 for efficient catalytic wet air oxidation of phenol in wastewater. J. Hazard. Mater. 2022, 426, 128088. [Google Scholar] [CrossRef]
- Descorme, C.; Jacobs, P.W.; Somorjai, G.A. Catalytic Combustion of Ethane over Palladium Foil in the 300–450 °C Range: Kinetics and Surface Composition Studies. J. Catal. 1998, 178, 668–678. [Google Scholar] [CrossRef]
- Kim, G.J.; Lee, S.M.; Chang Hong, S.; Kim, S.S. Active oxygen species adsorbed on the catalyst surface and its effect on formaldehyde oxidation over Pt/TiO2 catalysts at room temperature; role of the Pt valence state on this reaction? RSC Adv. 2018, 8, 3626–3636. [Google Scholar] [CrossRef]
- Liu, H.; Sun, C.; Fan, Z.; Jia, X.; Sun, J.; Gao, F.; Tang, C.; Dong, L. Doping effect of Sm on the TiO2/CeSmOx catalyst in the NH3-SCR reaction: Structure–activity relationship, reaction mechanism and SO2 tolerance. Catal. Sci. Technol. 2019, 9, 3554–3567. [Google Scholar] [CrossRef]
- Hou, J.; Hu, J.; Bao, W.; Yao, J.; Wu, D.; Wang, J.; Wang, B.; Zeng, Z.; Cui, X.; Su, S.; et al. Effects of Ti modified CeCu mixed oxides on the catalytic performance and SO2 resistance towards benzene combustion. Catal. Commun. 2023, 174, 106596. [Google Scholar] [CrossRef]
- Zhang, T.; Qiu, W.; Zhu, H.; Ding, X.; Wu, R.; He, H. Promotion Effect of the Keggin Structure on the Sulfur and Water Resistance of Pt/CeTi Catalysts for CO Oxidation. Catalysts 2022, 12, 4. [Google Scholar] [CrossRef]
- Fang, Y.; Li, L.; Yang, J.; Hoang, S.; Wang, L.; Xu, J.; Yang, W.; Pan, C.; Zhu, Y.; Deng, H.; et al. Engineering the Nucleophilic Active Oxygen Species in CuTiOx for Efficient Low-Temperature Propene Combustion. Environ. Sci. Technol. 2020, 54, 15476–15488. [Google Scholar] [CrossRef] [PubMed]
- Yao, J.; Wu, D.; Yan, X.; Wang, B.; Hu, J.; Bao, W.; Chang, L.; Wang, J. Highly catalytic-performance for benzene oxidation: Effect of oxygen species on OMS-2 by Co doping. Fuel 2021, 305, 121538. [Google Scholar] [CrossRef]
- Dong, C.; Zhou, Y.; Ta, N.; Liu, W.; Li, M.; Shen, W. Shape impact of nanostructured ceria on the dispersion of Pd species. Chin. J. Catal. 2021, 42, 2234–2241. [Google Scholar] [CrossRef]
- Gholizadeh, A.; Malekzadeh, A.; Ghiasi, M. Structural and magnetic features of La0.7Sr0.3Mn1−xCoxO3 nano-catalysts for ethane combustion and CO oxidation. Ceram. Int. 2016, 42, 5707–5717. [Google Scholar] [CrossRef]
- Kwon, H.C.; Park, Y.; Park, J.Y.; Ryoo, R.; Shin, H.; Choi, M. Catalytic Interplay of Ga, Pt, and Ce on the Alumina Surface Enabling High Activity, Selectivity, and Stability in Propane Dehydrogenation. ACS Catal. 2021, 11, 10767–10777. [Google Scholar] [CrossRef]
- Ruan, C.; Huang, Z.-Q.; Lin, J.; Li, L.; Liu, X.; Tian, M.; Huang, C.; Chang, C.-R.; Li, J.; Wang, X. Synergy of the catalytic activation on Ni and the CeO2–TiO2/Ce2Ti2O7 stoichiometric redox cycle for dramatically enhanced solar fuel production. Energy Environ. Sci. 2019, 12, 767–779. [Google Scholar] [CrossRef]
- Oh, D.-k.; Lee, Y.-J.; Lee, K.-Y.; Park, J.-S. Nitrogen Monoxide and Soot Oxidation in Diesel Emissions with Platinum–Tungsten/Titanium Dioxide Catalysts: Tungsten Loading Effect. Catalysts 2020, 10, 1283. [Google Scholar] [CrossRef]
- Shi, D.; Fu, G.; Omran, A.; Haw, K.-G.; Zhu, L.; Ding, R.; Lang, Q.; Wang, S.; Fang, Q.; Qiu, S.; et al. Acidic properties of Al-rich ZSM-5 crystallized in strongly acidic fluoride medium. Microporous Mesoporous Mater. 2022, 112332, in press. [Google Scholar] [CrossRef]
- Lv, L.; Wang, S.; Ding, Y.; Zhang, L.; Gao, Y.; Wang, S. Mechanistic insights into the contribution of Lewis acidity to brominated VOCs combustion over titanium oxide supported Ru catalyst. Chemosphere 2021, 263, 128112. [Google Scholar] [CrossRef]
- Jiang, Y.; Wang, X.; Lai, C.; Shi, W.; Liang, G.; Bao, C.; Ma, S. Effect of Ca Doping on the Selective Catalytic Reduction of NO with NH3 over Ce–Ti Oxide Catalyst. Catal. Lett. 2018, 148, 2911–2917. [Google Scholar] [CrossRef]


| Catalyst | T50 1 (°C) | T90 1 (°C) | Ea (kJ/mol) | T50 2 (°C) | T90 2 (°C) |
|---|---|---|---|---|---|
| Pt/TiO2 | 441 | 514 | 79.54 | 345 | 413 |
| Pt/Ce0.02Ti0.98O2 | 439 | 500 | 72.31 | 348 | 441 |
| Pt/Ce0.05Ti0.95O2 | 390 | 455 | 57.92 | 321 | 416 |
| Pt/Ce0.01Ti0.99O2 | 360 | 436 | 48.84 | 316 | 370 |
| Pt/Ce0.02Ti0.98O2 | 389 | 460 | 62.82 | 326 | 472 |
| Pt/Ce0.05Ti0.95O2 | 407 | 466 | 70.75 | 403 | 490 |
| Catalyst | Physisorption | O2-TPD | XPS | |||||||
|---|---|---|---|---|---|---|---|---|---|---|
| Surface Area (m2/g) | Pore Volume (cm3/g) | Average Pore Diameter (nm) | Temperature of α Peak (°C) | Temperature of β Peak (°C) | Aβ/ Aα 1 | Ti 2p3/2 (eV) | Pt0/ Pt2++Pt0 | Olatt. conc. 2 (%) | Ce3+/ Cetotal | |
| Pt/TiO2 | 48.40 | 0.13 | 10.29 | 250.10 | 420.68 | 1.33 | 459.58 | - | 0.86 | - |
| Pt/Ce0.02Ti0.98O2 | 53.47 | 0.14 | 7.66 | 228.62 | 404.06 | 1.52 | 458.19 | 0.33 | 0.81 | 0.38 |
| Pt/Ce0.05Ti0.95O2 | 66.78 | 0.17 | 7.20 | 232.49 | 383.23 | 2.42 | 458.42 | 0.41 | 0.60 | 0.55 |
| Pt/Ce0.01Ti0.99O2 | 81.14 | 0.19 | 6.87 | 227.18 | 382.87 | 2.90 | 458.28 | 0.49 | 0.88 | 0.56 |
| Pt/Ce0.02Ti0.98O2 | 87.70 | 0.21 | 6.89 | 236.10 | 439.08 | 2.39 | 458.28 | 0.48 | 0.87 | 0.43 |
| Pt/Ce0.05Ti0.95O2 | 168.32 | 0.23 | 4.48 | 266.18 | 439.02 | 1.55 | 458.18 | 0.41 | 0.77 | 0.39 |
| Catalyst | Weak | Medium | Total 1 | Weak (%) | Medium (%) |
|---|---|---|---|---|---|
| Pt/Ce0.02Ti0.98O2 | 2.28 | 7.18 | 9.46 | 24.45 | 75.55 |
| Pt/Ce0.05Ti0.95O2 | 0.88 | 3.52 | 4.40 | 19.97 | 80.03 |
| Pt/Ce0.01Ti0.99O2 | 0.33 | 1.34 | 1.67 | 19.59 | 80.41 |
| Pt/Ce0.02Ti0.98O2 | 0.42 | 1.39 | 1.81 | 23.22 | 76.78 |
| Pt/Ce0.05Ti0.95O2 | 0.25 | 0.65 | 0.90 | 27.86 | 72.13 |
Disclaimer/Publisher’s Note: The statements, opinions and data contained in all publications are solely those of the individual author(s) and contributor(s) and not of MDPI and/or the editor(s). MDPI and/or the editor(s) disclaim responsibility for any injury to people or property resulting from any ideas, methods, instructions or products referred to in the content. |
© 2023 by the authors. Licensee MDPI, Basel, Switzerland. This article is an open access article distributed under the terms and conditions of the Creative Commons Attribution (CC BY) license (https://creativecommons.org/licenses/by/4.0/).
Share and Cite
Wu, D.; Lv, X.; Ren, X.; Hou, C.; Ma, Q.; Yao, J.; Hu, J. Promotion Effects of Ce-Doping on Catalytic Oxidation of Ethane over Pt/CexTi1−xO2. Catalysts 2023, 13, 626. https://doi.org/10.3390/catal13030626
Wu D, Lv X, Ren X, Hou C, Ma Q, Yao J, Hu J. Promotion Effects of Ce-Doping on Catalytic Oxidation of Ethane over Pt/CexTi1−xO2. Catalysts. 2023; 13(3):626. https://doi.org/10.3390/catal13030626
Chicago/Turabian StyleWu, Dengmao, Xianyan Lv, Xiurong Ren, Changming Hou, Qianwei Ma, Junxuan Yao, and Jiangliang Hu. 2023. "Promotion Effects of Ce-Doping on Catalytic Oxidation of Ethane over Pt/CexTi1−xO2" Catalysts 13, no. 3: 626. https://doi.org/10.3390/catal13030626
APA StyleWu, D., Lv, X., Ren, X., Hou, C., Ma, Q., Yao, J., & Hu, J. (2023). Promotion Effects of Ce-Doping on Catalytic Oxidation of Ethane over Pt/CexTi1−xO2. Catalysts, 13(3), 626. https://doi.org/10.3390/catal13030626