Abstract
The tin-doped TiO2 powders obtained by sol-gel and microwave-assisted sol-gel methods were investigated. The synthesis took place in a basic medium (pH 10, ammonium hydroxide, 25%) starting from tetrabutyl orthotitanate in its parental alcohol. In the case of the dopant, Tin(II) 2-ethylhexanoate as SnO2 precursor was used in the amount of 1, 2, or 4 mol % SnO2. Based on thermal analysis data, the powders were thermally treated in air, at 500 °C. The comparative investigation of the structure and morphology of the nanopowders annealed at 500 °C was performed by scanning electron microscopy (SEM), high-resolution transmission electron microscopy with selected area electron diffraction (HRTEM/SAED), scanning transmission electron microscopy (STEM) coupled with EDX mapping, Fourier transmission infrared (FTIR), UV–Vis, Raman and photoluminescence (PL) spectroscopy, X-ray diffraction (XRD), and X-ray florescence spectroscopy (XRF). The obtained materials were tested for the photocatalytic removal of methyl orange dye from aqueous solutions. High degradation efficiencies (around 90%) were obtained by Sn doping after 3 h of UV light irradiation.
1. Introduction
The presence of toxic and non-biodegradable azo dyes, including the well-known methyl orange, in industrial effluents from textile and dye manufacturing activities, causes severe health risk factors for living organisms and the environment. To solve this problem, several chemical, biological, and physical techniques, as well as mixed methods have been used [1,2]. Among them, photocatalytic degradation has great potential for the treatment of wastewater with a high content of organic pollutants, being a simple, cost-effective, and environmentally friendly technology [3]. The process of photocatalytic degradation of organic pollutants in an aqueous medium is based on the capacity of a photocatalytic material to generate under irradiation electrons and holes that will further interact with hydroxyl ions and oxygen from the reaction medium. Thus, reactive oxygen species are obtained, responsible for the degradation of organic pollutants [1]. Various photocatalytic systems based on TiO2, ZnO, ZrO2, ZnS, NiO, WOx, SnO2, and CdS were synthesized for this purpose [4,5]. Among these, TiO2 has been extensively used as a photocatalyst due to its properties, such as environmental friendliness, low cost, excellent electronic and optical properties, non-toxicity, high chemical stability, and strong oxidation activity [6,7,8,9,10,11,12].
Titanium dioxide is an n-type semiconductor that crystallizes in three polymorphic phases: anatase, brookite, and rutile [13]. Among these, anatase has the best photocatalytic activity due to a longer lifetime of photogenerated electrons [14,15]. Moreover, it has often been reported that a mixture of anatase–rutile phases has better photocatalytic properties than the anatase itself. This behaviour is explained by a better separation of photogenerated charge because electrons transfer can occur between the two phases [16].
It is fundamental to improve the properties of the titanium dioxide, determined by the features appropriate for the designed application.
Highly significant is the synthesis method, which has a considerable influence on the properties of the materials. The general tendency is to limit external interferences over the system and to use rather closed or well-controlled systems. By using soft chemical methods, regulation of the stoichiometry and purity of the studied systems can be carried out [17,18,19].
Pristine and doped TiO2 powders were synthesized by several processes as the ceramic method or liquid phase methods, such as coprecipitation [20], the hydrothermal method [21,22,23], sol-gel process [20,24,25,26,27], sol-gel assisted by ultrasounds [20,28], microwave-assisted hydrothermal method [29], or sol-gel assisted by microwaves [20,30,31,32].
The sol-gel method is an intensive technique used with large industrial applications. This process presents advantages, such as low cost, formation of materials with clearly specific arrangements that can be controlled by the type of precursors, synthesis at low temperatures, and obtaining products with different shapes [20,33,34].
The microwave-assisted sol-gel method obtains, lately, more attention to TiO2 materials preparation [35,36]. Micro- and macroscopic features of nanoparticulate materials, such as particle size, purity, shape and morphology, surface defects, as well as the kinetic of reactions, were improved by using microwave irradiation [37]. By varying the temperature and reaction time, and the composition of the system, the solid state, and phase composition can be directed [38,39].
The narrow spectrum of their photocatalytic activity (only UV), the rapid recombination of the photogenerated electron–hole pairs, and the low adsorption of the organic dye represent the main disadvantages of the conventional systems. A multi-component system as Sn-doped TiO2 is a solution for improving the photocatalytic performances by suppressing charge carrier recombination, widening of band gap energy that allows its activation under visible light irradiation, and also by obtaining a hybrid structure of anatase and rutile in the case of a high content of Sn dopant [3,4]. Increasing TiO2 efficiency under visible-light activation has been one of the most requested enhancement and a facile way to accomplish that is by TiO2 modification with metal or non-metal species. Tin turns out to be a noteworthy doping element to enhance the photocatalytic activity of both TiO2 phases, anatase [40,41], and rutile [13,42]. It was reported an increase by several orders of magnitude in the degradation rate of the toxic dyes under UV irradiation when anatase was doped with tin [42,43]. It can be explained by a change in the electronic structure of anatase by lowering the band gap (shifting the absorption edge towards the visible light region). However, the main drawback of these materials consisted in the segregation of SnO2 [44]. Given the similar ionic radii of the Sn4+ (0.69 Å) and Ti4+ (0.61 Å), tin can easily substitute titanium in anatase and rutile polymorphs [43].
In this work, a novel and simple one-step method was proposed to synthesize Sn–doped TiO2 with enhanced photocatalytic properties compared to pristine TiO2. It studied the influence of microwave on the structural, morphological, textural, and optical properties of materials and how all of these factors influence the photocatalytic activity in the degradation of methyl orange (MO) dye. Furthermore, it evaluated the effect of the tin amount incorporated by the microwave-assisted sol-gel method on the main important characteristics of materials for photocatalytic performances. From the thermal analysis, we found out that 500 °C was a suitable temperature for the elimination of the organic parts from the studied samples and for obtaining crystalline phases. Single-phase anatase in the Sn-doped TiO2 system was identified by XRD measurements. Based on these results, we investigated the tin quantity impact on the photocatalytic capacity of these materials for the degradation of methyl orange dye.
2. Results and Discussion
Sn-doped TiO2 powders, prepared by sol-gel (TiO2/SnO2 = 98/2) and microwave assisted sol-gel methods (TiO2/SnO2 = 99/1, 98/2, and 96/4), were investigated for structure, morphology, and photocatalytic activity. The properties of these samples were discussed as against undoped TiO2 samples.
2.1. Thermal Treatment
The thermal behaviour of the materials gives information about the stability of the materials with respect to temperature. In order to determine the thermal properties and stability of the as-prepared materials, TG/DTA/DTG has been used. The behaviour of the samples against thermal treatment, respectively TG/DTA/DTG curves, are shown in Figure 1 for the 2Sn–TiO2 samples, and in Figure 2 for the 1Sn–TiO2 and 4Sn–TiO2 samples. In Figure 1a, the TG curves of the 2Sn–TiO2 MW sample prepared by the microwave-assisted sol-gel method shows a mass loss of 24.46%. Three important thermal effects were noticed on the DTA curve. The endothermic effect at 62 °C is assigned to the removal of adsorbed water and alcohol. The exothermic effect at 274 °C was assigned to the decomposition and the subsequent burning out of the organic residues, and dehydroxylation (elimination of structural hydroxyls). The second exothermic effect at 432 °C was assigned to the conversion of Ti(OH)4 into TiO2 (dehydroxylation) and the occurred crystallization of the anatase. In Figure 1b, the TG curves of 2Sn–TiO2 SG sample prepared by the sol-gel method shows a similar behaviour with a total mass loss of 22.33%. The mass loss within the temperature range up to 100 °C in this case is due to the removal of the free or adsorbed water molecules and alcohol, and it corresponds to the endothermic effect at 79 °C. The mass loss within the temperature range of 100–500 °C is due to the burning out of organic residues and the removal of the structural hydroxyls. The corresponding exothermic effect to the combustion of organic matter is located at 269 °C. The exothermic effect at 441 °C can be assigned to the crystallization of the anatase, accompanied by dehydroxylation.
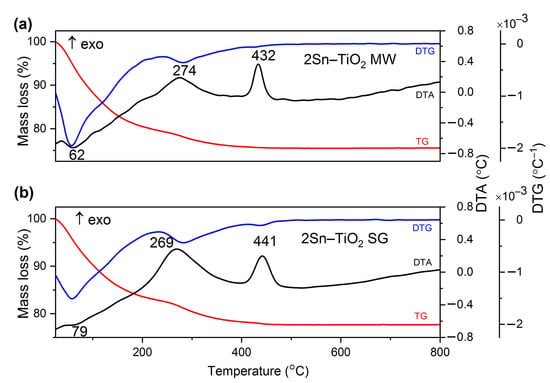
Figure 1.
The TG (red)/DTG (blue)/DTA (black) curves of 2Sn-doped TiO2 sample prepared by (a) microwave-assisted sol-gel method and (b) sol-gel method; heating rate was 10 °C/min and using air as carrier gas.
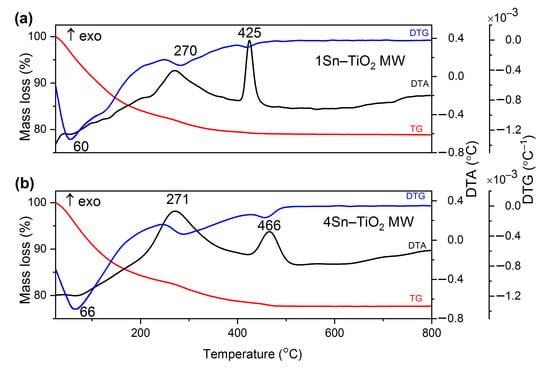
Figure 2.
The TG (red)/DTG (blue)/DTA (black) curves of doped TiO2 sample prepared by microwave-assisted sol-gel method (a) 1% Sn and (b) 4% Sn; heating rate was 10 °C/min and using air as carrier gas.
In Figure 2, the TG curves of 1Sn–TiO2 MW and 4Sn–TiO2 MW samples prepared by the microwave-assisted sol-gel method show a total mass loss of 21.04% for 1% and 22.33% for 4%, respectively. In both cases, the mass loss takes place in the temperature range up to 500 °C and it can be assigned to the release of the physically absorbed water and the alcohol, which has the corresponding endothermic effect at 60 °C for 1Sn–TiO2 MW and 66 °C for the sample 4Sn–TiO2 MW. The exothermic effect located at ~270 °C for both samples (1Sn–TiO2 MW and 4Sn–TiO2 MW) is due to the burning out of organic residues. The second exothermic effect, located at 425 °C for the sample 1Sn–TiO2 MW and 466 °C for the sample 4Sn–TiO2 MW, can be assigned to the conversion of Ti(OH)4 into TiO2 (dehydroxylation) and the occurring crystallization of the anatase. For all four samples, no further mass loss could be observed at temperatures above 500 °C.
The preparation method does not significantly affect the thermal behaviour of the samples, and minor shifting of the thermal effects is noticed. The sol-gel process is strongly influenced by the pH of the reaction medium, as one of the most relevant parameters. The most sensitive parameters to the pH medium are the rate of the hydrolysis and condensation processes. Literature data recorded critical differences during the sol-gel process as the pH of the solution varied from the acidic to basic medium. The pH of sol controls the amount of H+ or OH− ions in the sol that effectively determines the polymerization of the metal–oxygen bonds. A slow gelation process was noticed at strongly acidic values (pH up to 5) that favour the formation of an extended network in solution, primarily prepared for films and coatings. Nanoparticles formed in a basic medium solution (pH > 9) due to enhanced hydrolysis and a fast gelation process [45,46].
2.2. X-ray Diffraction
Figure 3 shows the X-ray diffractograms of the sol-gel prepared Sn-doped TiO2 samples (Figure 3a) and the microwave-assisted sol-gel prepared Sn-doped TiO2 samples (Figure 3b), thermally treated at 500 °C. The corresponding diffraction patterns of the undoped TiO2 samples, thermally treated at 450 °C, were used as a reference. All the diffraction lines matched well against ICDD file no. 21–1272, corresponding to TiO2, the anatase phase. No polymorphs of titanium dioxide (rutile or brookite) or tin-based compounds were detected within the limit of the instrument, implying that tin enters into the anatase lattice. The impact of different Sn proportions on the anatase crystals was investigated in terms of lattice parameters, and crystallite size and the results are listed in Table 1.
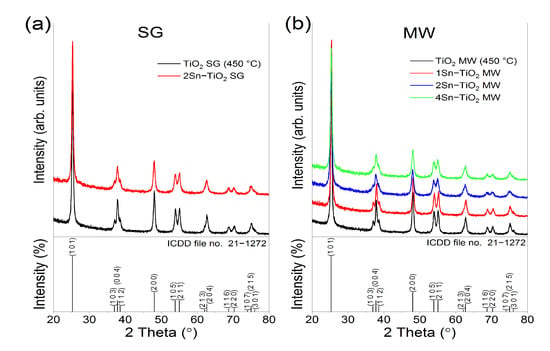
Figure 3.
X–ray diffractograms of (a) the sol-gel prepared samples and (b) microwave-assisted sol-gel prepared samples, thermally treated.

Table 1.
The lattice parameters and the estimated crystallite size of the samples.
Based on the XRD data, the anatase lattice parameters and the crystallite size were altered by tin doping compared to the standard ICDD file. The lattice parameters increase when the concentration of tin dopant increases, which can be explained by the larger effective radius of Sn4+ (0.69 Å) compared to that of Ti4+ (0.61 Å).
2.3. X-ray Fluorescence (XRF)
The presence and the amount of Sn dopant in the TiO2 matrix were measured employing X-ray fluorescence. Tin was detected in all the samples, and the quantities (by mass% for each element) are listed in Table 2. There is no difference between the amount of tin (mass%) detected in the samples 2Sn–TiO2 MW and 4Sn–TiO2 MW, and can be explained by reaching the solubility limit by this preparation method.

Table 2.
XRF results of the analyzed samples.
2.4. SEM Results
The SEM investigation was realized to bring information about the morphologies of the studied samples. Figure 4a–d shows the images of thermally treated samples at 500 °C, and also presents comparative images of surface morphology of 2%Sn-doped TiO2 obtained by SG (a) and MW (b), respectively.
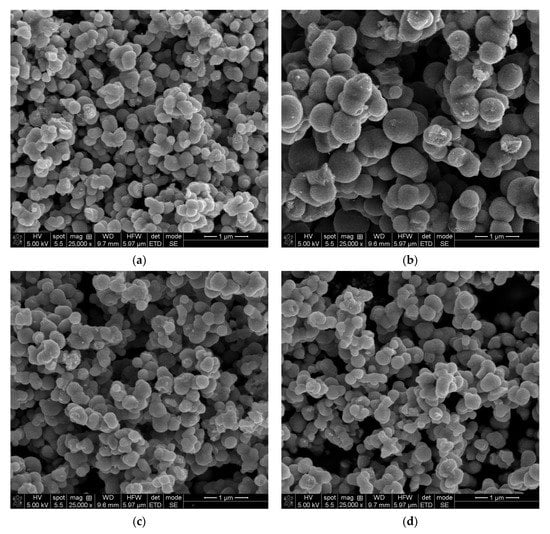
Figure 4.
SEM images of thermally treated samples (a) 2Sn–TiO2 SG, (b) 2Sn–TiO2 MW, (c) 1Sn–TiO2 MW, and (d) 4Sn–TiO2 MW, respectively.
For the 2Sn–TiO2 SG sample, the particles have a quasi-granular-like morphology and an average width of 300 nm, slightly smaller than the comparative sample obtained for a similar composition by the MW-assisted method (Figure S1 from Supplementary Materials shows details of particle sizes). In the 2Sn–TiO2 MW case, the particles are rather spherical and well defined, with a mean diameter of around 500 nm. For (b) and (c) images, samples prepared by the MW route have polydisperse morphology, the quantity of dopant does not seem to influence the shapes and sizes of nano-grained particles, which are almost similar to the 2Sn–TiO2 SG sample, as Raman measurements reported. Taking into account the values of the average crystallite size (Table 1) determined from the XRD data, one can conclude that the particles noticed in the SEM images are polycrystalline or could be aggregates of small, single-crystal nanoparticles with a high tendency of agglomeration, often observed in wet–chemically prepared TiO2 systems [47,48,49]. In order to see more clearly a potential structuring of these particles, TEM investigations are required.
2.5. TEM/HRTEM/SAED Investigations
The results of TEM/HRTEM/SAED investigations for the powdered samples thermally treated at 500 °C are presented in Figure 5. As it was supposed, the lower magnification TEM images show that the so-called submicron, spherical particles observed in the SEM images are actually aggregates of polyhedral primary nanoparticles, almost uniform as shape and size (Figure 5a,d,g,j). It is hard to provide an accurate estimation of the particle average size, since isolated nanoparticles were distinguished just in the proximity of the aggregate’s surfaces. However, a rough estimation indicates that the values of the sizes of these nanoparticles are ranged between 8–22 nm, which is consistent with the average crystallite sizes of Table 1. This proves the single-crystal nature of these particles for all four powders under investigation. The long-range ordered fringes inside the nanoparticles revealed by the HRTEM images of Figure 5b,e,h,k, as well as the well-defined dashed diffraction rings consisting of bright spots of the SAED patterns, show that despite their size, the nanoparticles exhibit a high crystallinity degree, irrespective of the dopant content or synthesis method (Figure 5c,f,i,l).
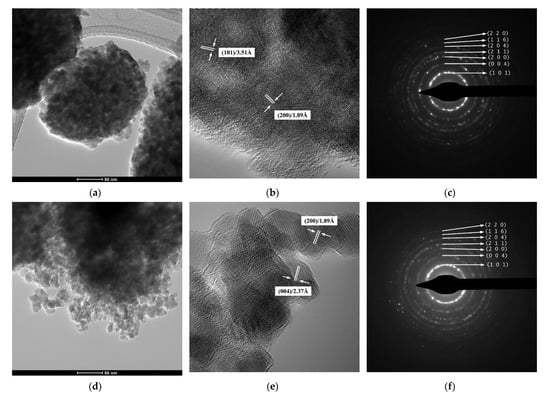
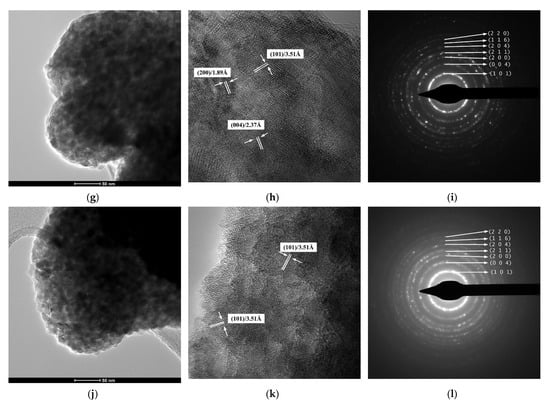
Figure 5.
(a,d,g,j) TEM images, (b,e,h,k) HRTEM images, and (c,f,i,l) SAED patterns of thermally treated samples: (a–c) 2Sn–TiO2 SG, (d–f) 2Sn–TiO2 MW, (g–i) 1Sn–TiO2 MW, and (j–l) 4Sn–TiO2 MW, respectively.
2.6. STEM/EDX Investigations
The EDX spectra of the Sn-doped TiO2 powders confirm the exclusive presence of the Ti, Sn, and O species that make up the anatase solid solutions, which rules out any contamination during the synthesis process (Figure S2 from Supplementary Materials).
The overall and elemental EDX maps (Figure 6b–d,f–h,j–l) recorded on the areas displayed by the STEM images of Figure 6a,e,i show a high compositional homogeneity of all four powders due to the uniform incorporation of the tin dopant into the host crystalline lattice. These results are consistent with the XRD data revealing the presence of the single anatase phase and the absence of any segregation of any residual secondary phases.

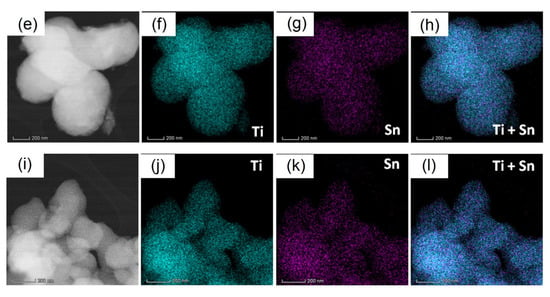
Figure 6.
STEM image and the overall and elemental EDX maps of the 2Sn–TiO2 SG sample (a–d), 2Sn–TiO2 MW sample (e–h), and 4Sn–TiO2 MW sample (i–l).
2.7. Textural Characterization
For the textural characterization of the thermally treated Sn-doped TiO2, the adsorption–desorption isotherms N2 were registered and are shown in Figure 7. All the analyzed materials show type-IV adsorption–desorption isotherms with H2-type hysteresis loops (inset of Figure 7), characteristic for mesoporous materials with complex pore structures in which network effects are relevant [50]. The calculated textural parameters are listed in Table 3. It can be noticed that, by increasing the dopant amount from 1% to 4%, the samples obtained by the microwave-assisted sol-gel method have increased specific surface areas. The total pore volume has the same value of 0.100 cm3g−1 for samples doped with 1% and 2% Sn, and increases slightly in the sample doped with 4% Sn (0.113 cm3g−1). There is no clear relationship between the average pore size and the Sn content. However, for all four samples, the pore size distribution determined by the BJH model is relatively narrow, ranging from 2.5 to 6 nm, with the average values shown in Table 3. For the sample doped with 2% Sn obtained by the sol-gel method, the total pore volume is the smallest of all four samples (0.093 cm3g−1), while the specific surface area is smaller compared to that of the sample doped with the same amount of Sn, but obtained by the microwave-assisted sol-gel method. An explanation could be the release of a volume of gas from the sample during the microwave irradiation, which causes the appearance of a larger volume of pores, and, implicitly, a larger specific surface area for the microwave-assisted sol-gel samples.
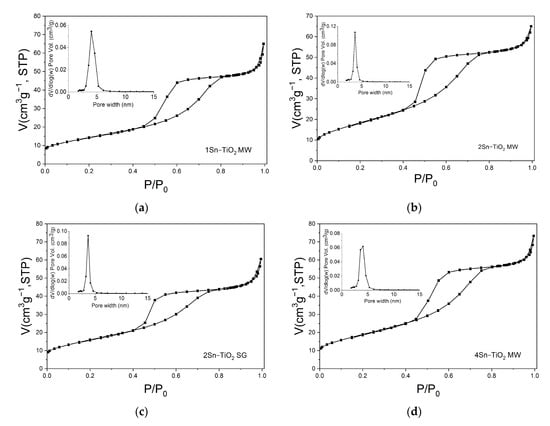
Figure 7.
The nitrogen adsorption–desorption isotherms of the samples: (a) 1Sn–TiO2 MW, (b) 2Sn–TiO2 MW, (c) 2Sn–TiO2 SG, and (d) 4Sn–TiO2 MW, respectively (inset: pore-size distribution).

Table 3.
The specific BET surface areas (SBET), total pore volume (Vtotal), and average pore diameter (d) of the samples.
2.8. Raman Spectroscopy Analysis
Raman spectra of the xSn–TiO2 powders are illustrated in Figure 8. The anatase phase is noticeable in the 1Sn–TiO2 MW sample by its bands at 398 cm−1 (B1g) and 633 cm−1 [41]. This result is analogous with the spectral findings for the tin-doped titania photocatalysts obtained by hydrogen peroxide method with a tin oxide content up to 7% [43]. Increasing tin content triggers the formation of the rutile polymorph (447 cm−1, Eg, and 606 cm−1, A1g [40]) in the 4Sn–TiO2 powders. While the 2Sn–TiO2 SG sample resembles the 1Sn–TiO2 MW, the spectral features of the 2Sn–TiO2 MW are comparable with the ones for the 4Sn–TiO2 MW. However, a small quantity of brookite (498 cm−1, B1g, and 584 cm−1, B2g [41]) might form in the 2Sn–TiO2 MW samples. Formation of brookite have been reported for tin-doped titania films (3 at.% Sn), annealed at 450 and 500 °C [51]. Moreover, SnO2 gives a spectral feature at about 472 cm−1 due to the symmetric stretching of Sn–O [52].
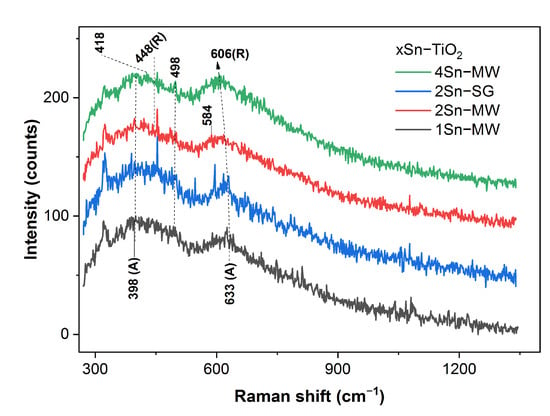
Figure 8.
UV–Raman spectra of the xSn–TiO2 MW/SG powders (R and A stand for rutile and anatase).
2.9. UV–Vis Spectroscopy Analysis
Figure 9 illustrates the UV–Vis absorption spectra of the Sn-doped TiO2 nanopowders. All the samples show a strong and broad absorption band in the UV domain due to the interband electronic transitions of TiO2 from the valence band to the conduction band. A weak absorption band is observed between 410–525 nm for TiO2 MW and 1Sn–TiO2 MW samples. This band can be assigned to d–d transitions of Ti3+ localized states, suggesting the presence of some structural defects that influence the photocatalytic properties of materials [53]. This weak absorption band was not observed in the case of the samples with a higher tin content, indicating a decrease in the number of defects.
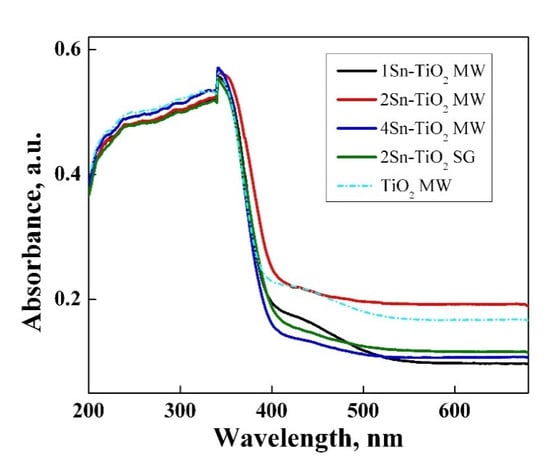
Figure 9.
UV–Vis absorption spectrum for Sn-doped TiO2 nanopowders.
A slightly red shift of absorption spectra was recorded only for the sample with 2.0% Sn, probably due to the presence of a mixture of phases anatase–rutile, according to the Raman results, the last one having a smaller band gap than anatase. The xSn–doped materials have band gap values between 3.11 and 3.18 eV (Table 4). The values lower than 3.2 eV of the band gap energy obtained by Sn doping is attributed to the new interband energy levels that are available to accept the excited electrons from the valence band of TiO2 [54]. The 2Sn–TiO2 MW sample (3.11 eV) presents the lowest value due to the co-existence of titanium dioxide polymorphs (anatase–rutile) and also due to the interband levels induced by tin ions. Thus, the required energy for electrons transfer from the valence band of TiO2 to the nearest unoccupied energy level is lower in the sample doped with 2% Sn compared to the other doped photocatalysts.

Table 4.
Band gap values for the synthesized samples.
2.10. Photoluminescence (PL) Analysis
Figure 10 shows the photoluminescence (PL) spectra of the synthesized nanopowders. In the case of pure TiO2 obtained in the presence of microwaves, a main peak located at ~392 nm was recorded. This can be assigned to the direct recombination of electrons (e−) from the valence band with holes (h+) formed on the conduction band after excitation [55].
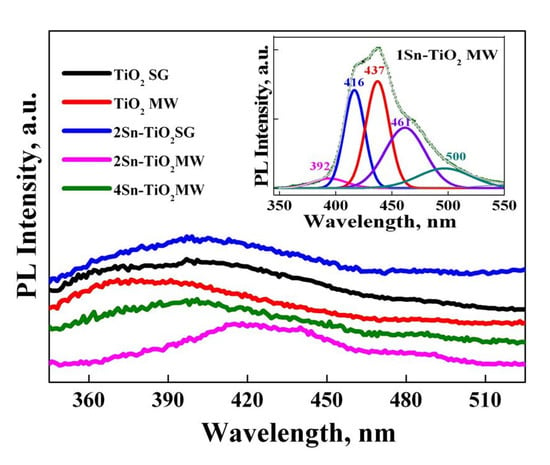
Figure 10.
Photoluminescence spectra for Sn-doped TiO2 samples prepared by different methods (λexc = 320 nm).
By the doping of TiO2 prepared by the microwave-assisted sol-gel method with a low concentration of SnO2 (1 and 2%), a widening of the photoluminescence emission band in a low-energy range was shown, corresponding to a combination of different phenomenon: indirect band-to-band recombination (416 nm), excitons (437 nm) and trapped electrons from oxygen vacancies (461 nm), and surface defects (500 nm) [55,56]. The appearance of oxygen vacancies or crystal defects can be explained by the replacement of Ti4+ ions with Sn4+, taking into account that the radius of tin ions (0.69 Å) is close to that of titanium (0.61 Å) [55]. The highest intensity of the PL emission recorded for the 1Sn–TiO2 MW sample indicates the formation of more defects, the signals being attributed to excitons originating from surface oxygen vacancies and defects. The similarity between the PL emission spectra of the pure TiO2 MW (450 °C) and 4Sn–TiO2 MW samples suggests that a higher concentration of SnO2 does not lead to the appearance of defects or oxygen vacancies, only to a phase transformation from anatase to rutile, as Raman results evidenced.
2.11. Photocatalytic Activity
To investigate the photocatalytic capacity of tin-doped titania photocatalysts, their ability to generate under irradiation ·OH radicals (the main active species involved in the degradation of organic dyes [57]) was evaluated by a photoluminescence method, using terephthalic acid (TA), which readily reacts with ·OH radicals in aqueous solution. The PL intensity recorded for the resulting compound (2-hydroxyterephthalic acid—TAOH) is proportional to the amount of ·OH radicals generated under irradiation. Figure 11 shows the fluorescence emission spectra of TAOH resulting after interaction between TA and ·OH radicals generated by synthesized Sn-doped TiO2 samples under irradiation. It was noticed that there was a gradual generation of ·OH radicals with irradiation time for all the samples, but the best results were obtained for 4Sn–TiO2 MW.
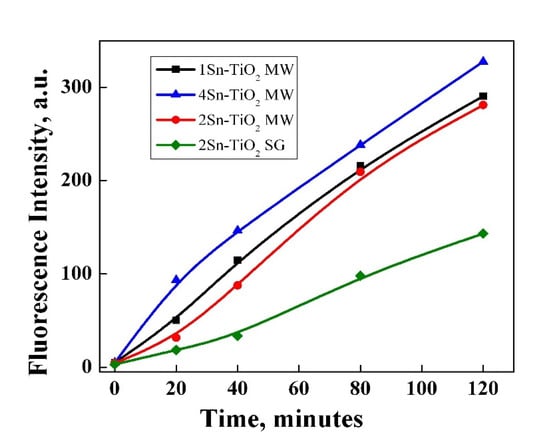
Figure 11.
Fluorescence emission spectra of TAOH resulted after interaction between TA and ·OH radicals generated by synthesized Sn-doped TiO2 samples under irradiation.
The synthesized materials were tested in photocatalytic degradation of methyl orange dye under UV and visible-light irradiation. Figure 12a,b illustrates the photocatalytic results.
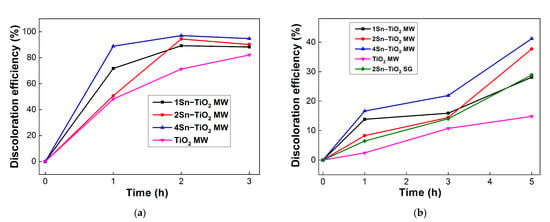
Figure 12.
Photocatalytic activity of synthesized Sn-doped TiO2 samples under UV (a) and visible light (b) irradiation.
The 4Sn–TiO2 MW photocatalyst had the highest efficiency in both irradiation conditions, probably due to its higher capacity to generate hydroxyl radicals, as was highlighted before (Figure 11). Even if the capacity to generate hydroxyl radicals is lower for the 2Sn–TiO2 MW sample than 1Sn–TiO2 MW, a better activity in the degradation of methyl orange was observed for the first one. There are two possible explanations: (1) the presence of anatase–rutile polymorph mixture that enhances the photocatalytic activity as the rate of electron–hole recombination is decreased [58], and (2) a higher surface area (Table 3) that facilitates the contact between the adsorbed dye molecules and the active sites dispersed on the photocatalyst surface.
There are various recent reports on the photocatalytic degradation of organic dyes in water in the presence of TiO2 doped with different concentrations of tin. A comparative analysis of the main characteristics of Sn-doped TiO2 photocatalysts used for the degradation of dyes was summarized in Table 5. Although it is difficult to compare the photocatalytic results because there is a diversity regarding the experimental conditions (synthesis method, dopant concentration, light irradiation, time, type of the dye, and its concentration), it can be observed that the materials obtained in the present work show high photocatalytic activity in contrast to similar others used in the photocatalytic degradation of methyl orange (Table 5). An important contribution to the photocatalytic performances of the samples is also the high dispersion of tin in the TiO2 structure obtained by the proposed synthesis method, as was highlighted by the STEM images and elemental EDX maps (Figure 6).

Table 5.
A comparison of the main characteristics of Sn-doped TiO2 materials used for photocatalytic degradation of dyes: A–anatase, R–rutile, B–brookite.
Under visible-light irradiation (Figure 12b), the efficiency of the photocatalyst preserves a similar tendency as in the case of UV irradiation. Furthermore, it was evidenced that there was an extension of TiO2 photocatalytic activity to the visible light region by doping with tin, obtaining an increase of discoloration efficiency from 14% for the TiO2 MW (450 °C) sample to 41% by doping with 4% tin (4Sn–TiO2 MW) after 5 h of irradiation.
The improved photocatalytic capacity of this sample could be explained by the synergistic effect of several textural, structural, and optical properties generated by the incorporation of tin in a concentration of 4% in the TiO2 structure. Thus, the replacement of Ti4+ ions by Sn4+ ions causes a slight deformation of the TiO2 network and the appearance of surface defects, which implies unsaturated cations and surface hydroxyl groups involved in the adsorption of dye molecules [60,61]. Furthermore, a higher surface area, as was found for the 4Sn–TiO2 MW sample (Table 3), means a higher number of unsaturated sites that contribute to the increase of photocatalytic activity. Another crucial role of Sn dopants in improving the photocatalytic activity of TiO2 is its ability to promote the phase transformation from anatase to rutile. A mixture of anatase–rutile, as was evidenced by Raman spectroscopy for the samples with a higher Sn content, is beneficial in photocatalysis due to a better separation of the e−/h+ pairs [16]. An increase in the lifetime of photo-generated species is also obtained by the tin doping itself, which provides new intermediate energy levels available for the transfer of electrons from the conduction band of TiO2 to the conduction band of SnO2, as was illustrated in Figure 13.
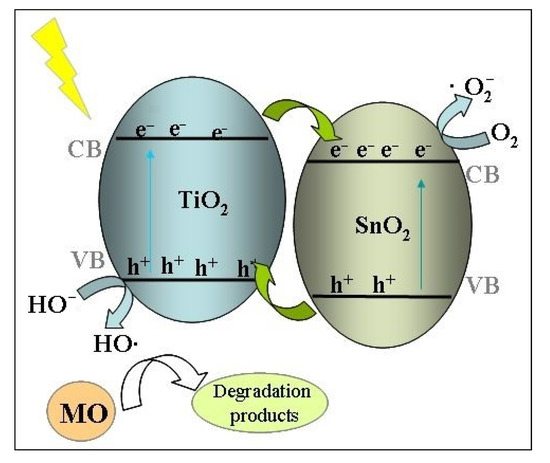
Figure 13.
The proposed mechanism of MO dye degradation on the Sn-doped TiO2 photocatalysts.
The photocatalytic degradation mechanism of methyl orange dye by the active species resulting after the photoactivation of Sn-doped TiO2 materials was investigated previously [59,60,63]. The hydroxyl radicals are the main reactive oxygen species responsible for the photocatalytic degradation of organic pollutants from wastewater [59]. In the present study, it was evidenced that there was a direct dependence between the amount of hydroxyl radicals generated by the synthesized photocatalysts (determined by the terephthalic acid method, Figure 11) and their photocatalytic performance (Figure 12), suggesting that the discoloration of the MO dye was mainly due to the hydroxyl reactive species. As was illustrated in Figure 13, under light irradiation, the excited electrons (e−) from the valence band of TiO2 are transferred in the conduction band with the formation of paired holes (h+). Because the Fermi level of SnO2 is lower than that of TiO2, the photoexcited electrons from the valence band of TiO2 are easily transferred to the conduction band of SnO2, thus increasing the electron–hole pairs separation. Therefore, a large quantity of holes is available for the oxidation of water with the formation of hydroxyl radicals. In addition, the degradation pathway of methyl orange involves a direct attack of the azo bond by reactive ·OH species, followed by an electrophilic attack of the benzene ring, as reported before [64]. The same degradation mechanism seems to be valid in the present work, as was suggested by UV–Vis spectroscopy (Figure 14 and Figure S3a,b). It is well-known that the absorption spectrum of methyl orange contains two important peaks at 464 and 271 nm, assigned to the azo group and benzene rings structures, respectively [65]. During the photocatalytic experiment made with a 4Sn–TiO2 MW sample, a decrease of both specific peaks was observed (Figure 14), indicating the splitting of the azo bond (-N=N-). The shift of the absorption peak located at 271 nm towards lower wavelengths in the first hours of photocatalytic reaction indicates some structural changes of the dye (possible hydroxylation of the benzene ring), as has already been reported [64,65,66]. However, at the end of the reaction, no absorption band located at wavelengths < 270 nm was observed, indicating destruction of the aromatic rings [65]. The same behavior was shown for all the samples used in the photocatalytic degradation of methyl orange under UV (Figure S3a) and visible-light irradiation (Figure S3b).
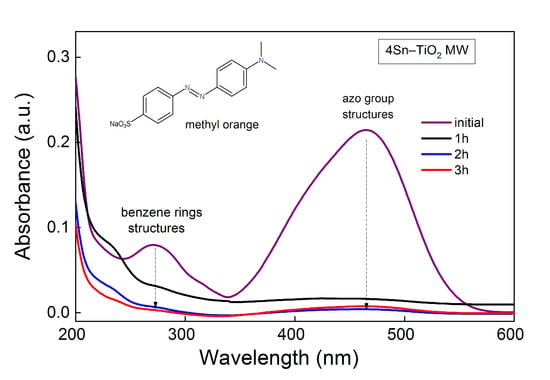
Figure 14.
UV–Vis absorbance spectra of MO during photocatalytic reaction under UV for 4Sn–TiO2 MW sample.
3. Materials and Methods
3.1. Gels and Powders Preparation
The Sn-doped TiO2 powders were prepared by sol-gel or by microwave-assisted sol-gel methods. The initial calculated compositions correspond to a TiO2:SnO2 molar percentage of 96:4 98:2 and 99:1, respectively. The reaction started from tetrabutyl orthotitanate (Merck, Hohenbrunn, Germany) [TBOT=Ti(OC4H10)4] as TiO2 precursor and Tin(II) 2-ethylhexanoate [CH3(CH2)3CH(C2H5)CO2]2Sn (Sigma-Aldrich, Steinheim, Germany) as SnO2 precursor. The butyl alcohol C4H9-OH (J.T. Baker, Deventer, Holland) was used as the solvent; triethanolamine (TEA) (Merck, Darmstadt, Germany) acts as a chelating agent, being added in a molar ratio Tin(II) 2-ethylhexanoate:chelating agent = 5:1, water (H2O), as hydrolysis agent; and ammonium hydroxide (NH4OH) (Riedel-de Haën, Seetze, Germany), as catalyst. The preparation procedure was described in detail in Ref. [19]. The main difference between the two methods is the exposure of the precursor solution to microwave irradiation for 10 min at 200 W for the microwave-assisted sol-gel method. The filtered and dried powders were subjected to thermal treatment for 1 h at 500 °C, based on the TGA/DTG/DTA results. In Figure 15, a flow diagram of the preparation routes is shown.
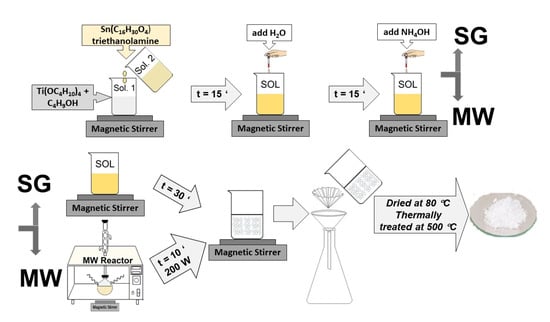
Figure 15.
The flow diagram of the sample preparation by sol-gel method.
The samples were labeled (xSn–TiO2 MW, where x is 1, 2, or 4) for the microwave-assisted sol-gel method and (2Sn–TiO2 SG) in the case of the sol-gel method.
The composition of the initial solutions and the experimental conditions used are presented in Table 6.

Table 6.
Composition of the initial solution and the experimental conditions of sol preparation.
3.2. Methods of Gels and Powders Characterization
The thermal behavior of the as-prepared samples was determined by thermogravimetric and differential thermal analysis (TG/DTG/DTA) using Mettler Toledo TGA/SDTA 851e (Greifensee, Switzerland) equipment in open Al2O3 crucibles in a flowing air atmosphere. The maximum temperature was set at 800 °C and the heating rate was of 10 °C/min.
Secondary electron micrographs were recorded in a high-vacuum mode using SEM Quanta 3D FEG (FEI, Brno, Czech Republic) equipment at an accelerating voltage of 5 kV. The powders were placed on carbon conductive band and scanned without coating.
To investigate in detail the powders morphology and crystallinity, TEM/HRTEM/SAED investigations were performed by means of a TITAN THEMIS ultra-high-resolution electron microscope from Thermo Fisher Scientific (Hillsboro, OR, USA). For the acquisition of the EDX spectra and elemental maps, the transmission electron microscope was operated in STEM (scanning transmission electron microscopy) mode at 300 kV using a HAADF (high-angle annular dark-field) detector for imaging and in column window less 4 Super EDX detector for elemental analysis.
UV–Raman spectra were collected by means of a Labram HR 800 spectrometer (Horiba France SAS, Palaiseau, France) equipped with a 325 nm laser (Kimmon Koha Ltd., Tokyo, Japan), a grating of 2400 lines, and a 40×/0.47 NUV objective (Olympus Corporation, Tokyo, Japan). The Edge filter prevented us from recording Raman spectra bellow 260 cm−1.
The textural analysis of the samples was performed through N2 physisorption at 196 °C using a Micromeritics ASAP 2020 analyzer (Norcross, GA, USA). Prior to each measurement, the samples were degassed under vacuum at 200 °C for 5 h. The specific surface areas were calculated using the Brunauer–Emmett–Teller (BET) equation and the total pore volume was estimated from the amount adsorbed at the relative pressure of 0.99. The pore-size distribution (PSD) curves were obtained from the desorption data using the Barrett–Joyner–Halenda (BJH) model.
X-ray diffraction (XRD) patterns were recorded using a PANalytical Empyrean diffractometer (Malvern Panalytical, Malvern, UK) with Ni-filtered Cu Kα radiation (λ = 0.15406 Å). The equipment was set on theta–theta geometry, with 1/4° divergence slit, 1/2° anti-scatter slit, and 0.02° soller slit on the incident beam side; and 1/2° anti-scatter slit mounted on a PIXCel3D detector operating in 1D on the diffracted beam side. The scan parameters were: range 10.0000–80.0107°, step size 0.0263°, and counting time per step of 255 s. Phase analysis was performed using HighScorePlus 3.0.e software coupled with the ICDD PDF4+ 2022 database. Determination of the unit cell parameters and average crystallite size was performed by Rietveld formalism, using a polynomial background with 4 parameters and a Pseudo–Voigt function for peak profiles.
Rigaku ZSX Primus II spectrometer (Rigaku Corp., Tokyo, Japan) with wavelength dispersion in vacuum was used for the elemental analysis of the materials. The SQX analytical software from Rigaku for semi-quantitative standardless analysis was used to calculate the chemical composition of the samples.
The UV–Vis diffuse reflectance spectra were recorded on a JASCO V570 spectrophotometer (Tokyo, Japan). As reference, a certified reflectance standard, spectralon, has been used and the measurements were carried out in the range 800–200 nm.
The photoluminescence spectra (PL) of the powders were recorded with an FLSP 920 spectrofluorometer (Edinburgh Instruments, Livingston, UK). The excitation source was a Xe lamp, excitation wavelength 350 nm, and spectra were recorded between 350 and 600 nm. A spectrofluorometer FluoroMax 4P (Horiba Jobin Yvon, Northampton, UK) was used for the evaluation of materials capacity to generate hydroxyl radicals in solution during light irradiation. This method involves the use of terephthalic acid (TA) (5 × 10⁻⁴ M TA solution, prepared in aqueous solution of NaOH with 2 × 10⁻³ M concentration) that interacts with the hydroxyl radicals generated by the photocatalytic materials during irradiation (λexc = 312 nm), resulting a highly fluorescent compound (2-hydroxyterephthalic acid).
The photocatalytic experiments were carried out by adding 5 mg of photocatalyst to 10 mL of methyl orange dye (MO) solution (1 × 10⁻⁵ M). Prior to irradiation, the reaction mixture was stirred in dark for 30 min to allow MO molecules to adsorb on the surface of the photocatalysts. Then, the reaction mixture was irradiated under stirring with a UV–Vis lamp at desired wavelengths. At regular intervals of time, the same aliquots of MO solution were taken, filtered, and spectrophotometrically recorded using the same JASCO V570 spectrophotometer in order to evaluate the progress of the photocatalytic reaction. The discoloration efficiency was evaluated as reported before [34,44,67].
4. Conclusions
Nanostructured Sn-doped TiO2 powders were obtained/prepared by sol-gel and microwave-assisted sol-gel methods in a basic medium. In the case of the microwave-assisted sol-gel method, the Sn-doped TiO2 was synthesized under mild conditions of short time exposed to microwaves for 10 min at 200 W.
The morphology of the samples shows nanometer size particles and quasi-granular-like morphology, and an average width between 300–500 nm.
The X-ray diffraction investigation detected single-phase anatase in all the samples thermally treated at 500 °C. TEM images show aggregates of spherical particles, as also observed in SEM images. HRTEM/SAED results indicated a high crystallinity degree of nanoparticles, and STEM images showed uniform incorporation of the tin dopant into the TiO2 lattice. The elemental EDX maps show a high compositional homogeneity due to the uniform incorporation of the tin dopant into the host crystalline lattice, no matter the synthesis route.
The synthesized materials proved high photocatalytic activity in methyl orange dye (MO) removal from water under UV and visible-light irradiation. Better photocatalytic results were observed for the samples obtained by the microwave-assisted sol-gel method due to the textural and structural properties thus obtained, as a higher surface area and the co-existence of anatase–rutile phases. A direct correlation between the formation of ·OH radicals and photocatalytic performances was evidenced, suggesting that the hydroxyl radicals are the main species involved in the degradation of MO.
Supplementary Materials
The following supporting information can be downloaded at: https://www.mdpi.com/article/10.3390/catal13030534/s1, Figure S1: SEM images with particle sizes measurements of thermally treated samples (a) 2Sn–TiO2 SG, (b) 2Sn–TiO2 MW, (c) 1Sn–TiO2 MW, and (d) 4Sn–TiO2 MW, respectively; Figure S2: EDX spectra of the Sn-doped TiO2 powders; Figure S3: UV–Vis absorbance spectra of MO before and after photocatalytic experiment using xSn-TiO2 MW materials under (a) UV and (b) visible-light irradiation.
Author Contributions
Conceptualization, L.P.; methodology, L.P.; investigation, L.P., E.M.C., G.P., S.P., J.P.-C., E.M.A., S.V.P., D.C.C., A.B., V.-A.S. and B.Ș.V.; resources, L.P. and A.C.I.; writing—original draft preparation, L.P., E.M.C., G.P., S.P., J.P.-C., E.M.A., S.V.P., D.C.C., A.B. and A.C.I.; writing—review and editing, L.P., G.P., S.P. and A.C.I.; visualization, S.P. and L.P.; project administration, L.P. All authors have read and agreed to the published version of the manuscript.
Funding
This research was funded by the Romanian Ministry of Research and Innovation grant PCCDI-UEFISCDI project number PN-III-P1-1.2-PCCDI-2017-0476/51PCCDI/2018.
Data Availability Statement
All data are available upon reasonable request from the authors.
Acknowledgments
This work was supported by the research programme “Materials Science and Advanced Methods for Characterization” of the Institute of Physical Chemistry “Ilie Murgulescu” of the Romanian Academy.
Conflicts of Interest
The authors declare no conflict of interest.
References
- Raliya, R.; Avery, C.; Chakrabarti, S.; Biswas, P. Photocatalytic Degradation of Methyl Orange Dye by Pristine Titanium Dioxide, Zinc Oxide, and Graphene Oxide Nanostructures and Their Composites under Visible Light Irradiation. Appl. Nanosci. 2017, 7, 253–259. [Google Scholar] [CrossRef]
- Gürses, A.; Güneş, K.; Şahin, E. Chapter 5—Removal of Dyes and Pigments from Industrial Effluents. In Green Chemistry and Water Remediation: Research and Applications; Sharma, S.K., Ed.; Advances in Green and Sustainable Chemistry; Elsevier: Amsterdam, The Netherlands, 2021; pp. 135–187. ISBN 978-0-12-817742-6. [Google Scholar]
- Wang, J.; Wang, Z.; Zhao, D.; Liang, Y.; Wang, H.; Wang, N.; Jiang, W.; Liu, S.; Liu, C.; Ding, W.; et al. Preparation, Structural and Photocatalytic Activity of Sn/Fe Co-Doped TiO2 Nanoparticles by Sol-Gel Method. Ceram. Int. 2022, 48, 8297–8305. [Google Scholar] [CrossRef]
- Gaur, N.; Dutta, D.; Singh, A.; Dubey, R.; Kamboj, D.V. Recent Advances in the Elimination of Persistent Organic Pollutants by Photocatalysis. Front. Environ. Sci. 2022, 10, 2076. [Google Scholar] [CrossRef]
- Anwer, H.; Mahmood, A.; Lee, J.; Kim, K.-H.; Park, J.-W.; Yip, A.C.K. Photocatalysts for Degradation of Dyes in Industrial Effluents: Opportunities and Challenges. Nano Res. 2019, 12, 955–972. [Google Scholar] [CrossRef]
- Thamaraiselvi, K.; Sivakumar, T. Photocatalytic Reduction of Carbon Dioxide by Using Bare and Copper Oxide Impregnated Nano Titania Catalysts. J. Nanosci. Nanotechnol. 2017, 17, 313–322. [Google Scholar] [CrossRef]
- Stride, J.A.; Tuong, N.T. Controlled Synthesis of Titanium Dioxide Nanostructures. Solid State Phenom. 2010, 162, 261–294. [Google Scholar] [CrossRef]
- Prakash, J.; Sun, S.; Swart, H.C.; Gupta, R.K. Noble Metals-TiO2 Nanocomposites: From Fundamental Mechanisms to Photocatalysis, Surface Enhanced Raman Scattering and Antibacterial Applications. Appl. Mater. Today 2018, 11, 82–135. [Google Scholar] [CrossRef]
- Muniandy, S.S.; Mohd Kaus, N.H.; Jiang, Z.-T.; Altarawneh, M.; Lee, H.L. Green Synthesis of Mesoporous Anatase TiO2 Nanoparticles and Their Photocatalytic Activities. RSC Adv. 2017, 7, 48083–48094. [Google Scholar] [CrossRef]
- Mathew, S.; Ganguly, P.; Kumaravel, V.; Harrison, J.; Hinder, S.J.; Bartlett, J.; Pillai, S.C. Effect of Chalcogens (S, Se, and Te) on the Anatase Phase Stability and Photocatalytic Antimicrobial Activity of TiO2. Mater. Today Proc. 2020, 33, 2458–2464. [Google Scholar] [CrossRef]
- Kanan, S.; Moyet, M.A.; Arthur, R.B.; Patterson, H.H. Recent Advances on TiO2-Based Photocatalysts toward the Degradation of Pesticides and Major Organic Pollutants from Water Bodies. Catal. Rev. 2020, 62, 1–65. [Google Scholar] [CrossRef]
- Chen, X.; Mao, S.S. Titanium Dioxide Nanomaterials: Synthesis, Properties, Modifications, and Applications. Chem. Rev. 2007, 107, 2891–2959. [Google Scholar] [CrossRef] [PubMed]
- Štengl, V.; Grygar, T.M.; Henych, J.; Kormunda, M. Hydrogen Peroxide Route to Sn-Doped Titania Photocatalysts. Chem. Cent. J. 2012, 6, 113. [Google Scholar] [CrossRef]
- Bjelajac, A.; Petrović, R.; Vujancevic, J.; Veltruska, K.; Matolin, V.; Siketic, Z.; Provatas, G.; Jaksic, M.; Stan, G.E.; Socol, G.; et al. Sn-Doped TiO2 Nanotubular Thin Film for Photocatalytic Degradation of Methyl Orange Dye. J. Phys. Chem. Solids 2020, 147, 109609. [Google Scholar] [CrossRef]
- Wang, J.; Cai, Q.; Li, H.; Cui, Y.; Wang, H. A Review on Nanotube Film Photocatalysts Prepared by Liquid-Phase Deposition. Int. J. Photoenergy 2012, 2012, 702940. [Google Scholar] [CrossRef]
- Buchalska, M.; Kobielusz, M.; Matuszek, A.; Pacia, M.; Wojtyła, S.; Macyk, W. On Oxygen Activation at Rutile- and Anatase-TiO2. ACS Catal. 2015, 5, 7424–7431. [Google Scholar] [CrossRef]
- Athar, T. Chapter 14—Metal Oxide Nanopowder. In Emerging Nanotechnologies for Manufacturing, 2nd ed.; Ahmed, W., Jackson, M.J., Eds.; Micro and Nano Technologies; William Andrew Publishing: Boston, MA, USA, 2015; pp. 343–401. ISBN 978-0-323-28990-0. [Google Scholar]
- Athar, T. Chapter 17—Smart Precursors for Smart Nanoparticles. In Emerging Nanotechnologies for Manufacturing, 2nd ed.; Ahmed, W., Jackson, M.J., Eds.; Micro and Nano Technologies; William Andrew Publishing: Boston, MA, USA, 2015; pp. 444–538. ISBN 978-0-323-28990-0. [Google Scholar]
- Pandele-Cusu, J.; Petrescu, S.; Preda, S.; Petcu, G.; Ciobanu, M.; Predoana, L. Comparative Study of the TiO2 Nanopowders Prepared from Different Precursors and Chemical Methods for Heterogeneous Photocatalysis Application. J. Therm. Anal. Calorim. 2022, 147, 13111–13124. [Google Scholar] [CrossRef]
- Kumar, S.G.; Rao, K.S.R.K. Polymorphic Phase Transition among the Titania Crystal Structures Using a Solution-Based Approach: From Precursor Chemistry to Nucleation Process. Nanoscale 2014, 6, 11574–11632. [Google Scholar] [CrossRef] [PubMed]
- Lu, C.-W.; Cao, Y.; Li, H.; Webb, C.; Pan, W.-P. Synthesis of TiO2 Based on Hydrothermal Methods Using Elevated Pressures and Microwave Conditions. J. Therm. Anal. Calorim. 2014, 116, 1241–1248. [Google Scholar] [CrossRef]
- Bregadiolli, B.A.; Fernandes, S.L.; de Graeff, C.F.O. Easy and Fast Preparation of TiO2—Based Nanostructures Using Microwave Assisted Hydrothermal Synthesis. Mater. Res. 2017, 20, 912–919. [Google Scholar] [CrossRef]
- Mehraz, S.; Kongsong, P.; Taleb, A.; Dokhane, N.; Sikong, L. Large Scale and Facile Synthesis of Sn Doped TiO2 Aggregates Using Hydrothermal Synthesis. Sol. Energy Mater. Sol. Cells 2019, 189, 254–262. [Google Scholar] [CrossRef]
- Vinogradov, A.V.; Vinogradov, V.V. Low-Temperature Sol–Gel Synthesis of Crystalline Materials. RSC Adv. 2014, 4, 45903–45919. [Google Scholar] [CrossRef]
- Jongprateep, O.; Puranasamriddhi, R.; Palomas, J. Nanoparticulate Titanium Dioxide Synthesized by Sol–Gel and Solution Combustion Techniques. Ceram. Int. 2015, 41, S169–S173. [Google Scholar] [CrossRef]
- Abdel-Messih, M.F.; Ahmed, M.A.; El-Sayed, A.S. Photocatalytic Decolorization of Rhodamine B Dye Using Novel Mesoporous SnO2–TiO2 Nano Mixed Oxides Prepared by Sol–Gel Method. J. Photochem. Photobiol. Chem. 2013, 260, 1–8. [Google Scholar] [CrossRef]
- Rangel-Vázquez, I.; Angel, G.D.; Bertin, V.; González, F.; Vázquez-Zavala, A.; Arrieta, A.; Padilla, J.M.; Barrera, A.; Ramos-Ramirez, E. Synthesis and Characterization of Sn Doped TiO2 Photocatalysts: Effect of Sn Concentration on the Textural Properties and on the Photocatalytic Degradation of 2,4-Dichlorophenoxyacetic Acid. J. Alloys Compd. 2015, 643, S144–S149. [Google Scholar] [CrossRef]
- Wei, X.; Cai, H.; Feng, Q.; Liu, Z.; Ma, D.; Chen, K.; Huang, Y. Synthesis of Co-Existing Phases Sn-TiO2 Aerogel by Ultrasonic-Assisted Sol-Gel Method without Calcination. Mater. Lett. 2018, 228, 379–383. [Google Scholar] [CrossRef]
- Falk, G.S.; Borlaf, M.; López-Muñoz, M.J.; Fariñas, J.C.; Rodrigues Neto, J.B.; Moreno, R. Microwave-Assisted Synthesis of TiO2 Nanoparticles: Photocatalytic Activity of Powders and Thin Films. J. Nanopart. Res. 2018, 20, 23. [Google Scholar] [CrossRef]
- Simonsen, M.E.; Li, Z.; Søgaard, E.G. Influence of the OH Groups on the Photocatalytic Activity and Photoinduced Hydrophilicity of Microwave Assisted Sol–Gel TiO2 Film. Appl. Surf. Sci. 2009, 255, 8054–8062. [Google Scholar] [CrossRef]
- Andrade-Guel, M.; Díaz-Jiménez, L.; Cortés-Hernández, D.; Cabello-Alvarado, C.; Ávila-Orta, C.; Bartolo-Pérez, P.; Gamero-Melo, P. Microwave Assisted Sol–Gel Synthesis of Titanium Dioxide Using Hydrochloric and Acetic Acid as Catalysts. Bol. Soc. Esp. Cerámica Vidr. 2019, 58, 171–177. [Google Scholar] [CrossRef]
- Reda, S.M.; Khairy, M.; Mousa, M.A. Photocatalytic Activity of Nitrogen and Copper Doped TiO2 Nanoparticles Prepared by Microwave-Assisted Sol-Gel Process. Arab. J. Chem. 2020, 13, 86–95. [Google Scholar] [CrossRef]
- Carp, O.; Huisman, C.L.; Reller, A. Photoinduced Reactivity of Titanium Dioxide. Prog. Solid State Chem. 2004, 32, 33–177. [Google Scholar] [CrossRef]
- Preda, S.; Pandele-Cușu, J.; Petrescu, S.V.; Ciobanu, E.M.; Petcu, G.; Culiță, D.C.; Apostol, N.G.; Costescu, R.M.; Raut, I.; Constantin, M.; et al. Photocatalytic and Antibacterial Properties of Doped TiO2 Nanopowders Synthesized by Sol-Gel Method. Gels 2022, 8, 673. [Google Scholar] [CrossRef]
- Li, X.; Wang, L.; Lu, X. Preparation of Silver-Modified TiO2 via Microwave-Assisted Method and Its Photocatalytic Activity for Toluene Degradation. J. Hazard. Mater. 2010, 177, 639–647. [Google Scholar] [CrossRef]
- Tongon, W.; Chawengkijwanich, C.; Chiarakorn, S. Visible Light Responsive Ag/TiO2/MCM-41 Nanocomposite Films Synthesized by a Microwave Assisted Sol–Gel Technique. Superlattices Microstruct. 2014, 69, 108–121. [Google Scholar] [CrossRef]
- Baghbanzadeh, M.; Carbone, L.; Cozzoli, P.D.; Kappe, C.O. Microwave-Assisted Synthesis of Colloidal Inorganic Nanocrystals. Angew. Chem. Int. Ed. 2011, 50, 11312–11359. [Google Scholar] [CrossRef]
- Das, S.; Mukhopadhyay, A.K.; Datta, S.; Basu, D. Prospects of Microwave Processing: An Overview. Bull. Mater. Sci. 2009, 32, 1–13. [Google Scholar] [CrossRef]
- Li, Y.; Yang, W. Microwave Synthesis of Zeolite Membranes: A Review. J. Membr. Sci. 2008, 316, 3–17. [Google Scholar] [CrossRef]
- Wang, X.; Shen, J.; Pan, Q. Raman Spectroscopy of Sol–Gel Derived Titanium Oxide Thin Films. J. Raman Spectrosc. 2011, 42, 1578–1582. [Google Scholar] [CrossRef]
- Iliev, M.N.; Hadjiev, V.G.; Litvinchuk, A.P. Raman and Infrared Spectra of Brookite (TiO2): Experiment and Theory. Vib. Spectrosc. 2013, 64, 148–152. [Google Scholar] [CrossRef]
- Bindhu, M.R.; Willington, T.D.; Hatshan, M.R.; Chen, S.-M.; Chen, T.-W. Environmental Photochemistry with Sn/F Simultaneously Doped TiO2 Nanoparticles: UV and Visible Light Induced Degradation of Thiazine Dye. Environ. Res. 2022, 207, 112108. [Google Scholar] [CrossRef] [PubMed]
- Lin, J.; Yu, J.C.; Lo, D.; Lam, S.K. Photocatalytic Activity of Rutile Ti1−xSnxO2 Solid Solutions. J. Catal. 1999, 183, 368–372. [Google Scholar] [CrossRef]
- Fruth, V.; Todan, L.; Codrea, C.I.; Poenaru, I.; Petrescu, S.; Aricov, L.; Ciobanu, M.; Jecu, L.; Ion, R.M.; Predoana, L. Multifunctional Composite Coatings Based on Photoactive Metal-Oxide Nanopowders (MgO/TiO2) in Hydrophobic Polymer Matrix for Stone Heritage Conservation. Nanomaterials 2021, 11, 2586. [Google Scholar] [CrossRef] [PubMed]
- O’Brien, P.; Wright, J.D.; Sommedijk, N.A.J.M.; Phillips, D.; Roberts, S. Sol-Gel Materials: Chemistry and Applications, 1st ed.; CRC Press: London, UK, 2017; ISBN 978-1-315-27380-8. [Google Scholar]
- Zhang, Y.; Fang, Z.Z.; Sun, P.; Huang, Z.; Zheng, S. A Study on the Synthesis of Coarse TiO2 Powder with Controlled Particle Sizes and Morphology via Hydrolysis. Powder Technol. 2021, 393, 650–658. [Google Scholar] [CrossRef]
- Crişan, M.; Răileanu, M.; Drăgan, N.; Crişan, D.; Ianculescu, A.; Niţoi, I.; Oancea, P.; Şomăcescu, S.; Stănică, N.; Vasile, B.; et al. Sol–Gel Iron-Doped TiO2 Nanopowders with Photocatalytic Activity. Appl. Catal. Gen. 2015, 504, 130–142. [Google Scholar] [CrossRef]
- Drăgan, N.; Crişan, M.; Răileanu, M.; Crişan, D.; Ianculescu, A.; Oancea, P.; Şomăcescu, S.; Todan, L.; Stănică, N.; Vasile, B. The Effect of Co Dopant on TiO2 Structure of Sol–Gel Nanopowders Used as Photocatalysts. Ceram. Int. 2014, 40, 12273–12284. [Google Scholar] [CrossRef]
- Răileanu, M.; Crișan, M.; Ianculescu, A.; Crișan, D.; Drăgan, N.; Osiceanu, P.; Şomăcescu, S.; Stănică, N.; Todan, L.; Nițoi, I. The Influence of Ni Dopant on the Structure and Photocatalytic Properties of Sol-Gel TiO2 Nanopowders. Water Air Soil Pollut. 2013, 224, 1773. [Google Scholar] [CrossRef]
- Thommes, M.; Kaneko, K.; Neimark, A.V.; Olivier, J.P.; Rodriguez-Reinoso, F.; Rouquerol, J.; Sing, K.S.W. Physisorption of Gases, with Special Reference to the Evaluation of Surface Area and Pore Size Distribution (IUPAC Technical Report). Pure Appl. Chem. 2015, 87, 1051–1069. [Google Scholar] [CrossRef]
- Beldjebli, O.; Bensaha, R.; Panneerselvam, P. Effect of Both Sn Doping and Annealing Temperature on the Properties of Dip-Coated Nanostructured TiO2 Thin Films. J. Inorg. Organomet. Polym. Mater. 2022, 32, 1624–1636. [Google Scholar] [CrossRef]
- Wang, W.; Xu, C.; Wang, G.; Liu, Y.; Zheng, C. Synthesis and Raman Scattering Study of Rutile SnO2 Nanowires. J. Appl. Phys. 2002, 92, 2740–2742. [Google Scholar] [CrossRef]
- Kernazhitsky, L.; Shymanovska, V.; Gavrilko, T.; Naumov, V.; Fedorenko, L.; Kshnyakin, V.; Baran, J. Photoluminescence of Cr-Doped TiO2 Induced by Intense UV Laser Excitation. J. Lumin. 2015, 166, 253–258. [Google Scholar] [CrossRef]
- Rajeswari, R.; Venugopal, D.; George, A.; Raj, A.D.; Sundaram, S.J.; Bashir, A.K.H.; Maaza, M.; Kaviyarasu, K. Synthesis and Characterization of Sn-Doped TiO2 Film for Antibacterial Applications. Appl. Phys. A 2021, 127, 498. [Google Scholar] [CrossRef]
- Qin, Q.; Wang, J.; Xia, Y.; Yang, D.; Zhou, Q.; Zhu, X.; Feng, W. Synthesis and Characterization of Sn/Ni Single Doped and Co–Doped Anatase/Rutile Mixed–Crystal Nanomaterials and Their Photocatalytic Performance under UV–Visible Light. Catalysts 2021, 11, 1341. [Google Scholar] [CrossRef]
- Saha, A.; Moya, A.; Kahnt, A.; Iglesias, D.; Marchesan, S.; Wannemacher, R.; Prato, M.; Vilatela, J.J.; Guldi, D.M. Interfacial Charge Transfer in Functionalized Multi-Walled Carbon Nanotube@TiO2 Nanofibres. Nanoscale 2017, 9, 7911–7921. [Google Scholar] [CrossRef]
- Collin, F. Chemical Basis of Reactive Oxygen Species Reactivity and Involvement in Neurodegenerative Diseases. Int. J. Mol. Sci. 2019, 20, 2407. [Google Scholar] [CrossRef] [PubMed]
- Ani, I.J.; Akpan, U.G.; Olutoye, M.A.; Hameed, B.H. Photocatalytic Degradation of Pollutants in Petroleum Refinery Wastewater by TiO2- and ZnO-Based Photocatalysts: Recent Development. J. Clean. Prod. 2018, 205, 930–954. [Google Scholar] [CrossRef]
- Xiufeng, Z.; Juan, L.; Lianghai, L.; Zuoshan, W. Preparation of Crystalline Sn-Doped TiO2 and Its Application in Visible-Light Photocatalysis. J. Nanomater. 2011, 2011, 432947. [Google Scholar] [CrossRef]
- Bayan, E.M.; Lupeiko, T.G.; Pustovaya, L.E.; Volkova, M.G. Synthesis and Photocatalytic Properties of Sn–TiO2 Nanomaterials. J. Adv. Dielectr. 2020, 10, 2060018. [Google Scholar] [CrossRef]
- Rasouli, H.; Jafarpisheh, F.; Ghorbanpour, M. Synthesis and Characterization of Sn-Doped TiO2 Nanoparticles and the Evaluation of Their Photocatalytic Performance under Vis-Lights. J. Water Environ. Nanotechnol. 2022, 7, 344–350. [Google Scholar] [CrossRef]
- Mohammadi, R.; Massoumi, B. Sn/Cu-TiO2 Nanoparticles Produced via Sol-Gel Method: Synthesis, Characterization, and Photocatalytic Activity. Russ. J. Phys. Chem. A 2014, 88, 1184–1190. [Google Scholar] [CrossRef]
- Deshmukh, S.M.; Patil, S.S.; Babar, S.B.; Alshehri, S.; Ghoneim, M.M.; Tamboli, A.M.; Lam, N.H.; Truong, N.T.N.; Kim, C.D.; Tamboli, M.S.; et al. TiO2-SnO2 Nanocomposites for Photocatalytic Environmental Remediation under UV-Light. Metals 2022, 12, 733. [Google Scholar] [CrossRef]
- Gómez-Obando, V.A.; García-Mora, A.-M.; Basante, J.S.; Hidalgo, A.; Galeano, L.-A. CWPO Degradation of Methyl Orange at Circumneutral PH: Multi-Response Statistical Optimization, Main Intermediates and by-Products. Front. Chem. 2019, 7, 772. [Google Scholar] [CrossRef] [PubMed]
- Szeto, W.; Kan, C.W.; Yuen, C.W.M.; Chan, S.-W.; Lam, K.H. Effective Photodegradation of Methyl Orange Using Fluidized Bed Reactor Loaded with Cross-Linked Chitosan Embedded Nano-CdS Photocatalyst. Int. J. Chem. Eng. 2014, 2014, 270946. [Google Scholar] [CrossRef]
- Chen, T.; Zheng, Y.; Lin, J.-M.; Chen, G. Study on the Photocatalytic Degradation of Methyl Orange in Water Using Ag/ZnO as Catalyst by Liquid Chromatography Electrospray Ionization Ion-Trap Mass Spectrometry. J. Am. Soc. Mass Spectrom. 2008, 19, 997–1003. [Google Scholar] [CrossRef] [PubMed]
- Gingașu, D.; Mîndru, I.; Culiță, D.C.; Predoană, L.; Petcu, G.; Ciobanu, E.M.; Preda, S.; Pandele-Cușu, J.; Petrescu, S. MgO Obtained by Chemical and Green Synthesis Methods and Applied in Photocatalytic Degradation of Methyl Orange. Rev. Roum. Chim. 2021, 66, 463–473. [Google Scholar] [CrossRef]
Disclaimer/Publisher’s Note: The statements, opinions and data contained in all publications are solely those of the individual author(s) and contributor(s) and not of MDPI and/or the editor(s). MDPI and/or the editor(s) disclaim responsibility for any injury to people or property resulting from any ideas, methods, instructions or products referred to in the content. |
© 2023 by the authors. Licensee MDPI, Basel, Switzerland. This article is an open access article distributed under the terms and conditions of the Creative Commons Attribution (CC BY) license (https://creativecommons.org/licenses/by/4.0/).