Abstract
The use of visible-light-driven photocatalysts in wastewater treatment, photoreduction of CO2, green solar fuels, and solar cells has elicited substantial research attention. Bismuth oxyhalide and its derivatives are a group of visible-light photocatalysts that can diminish electron–hole recombination in layered structures and boost photocatalytic activity. The energy bandgap of these photocatalysts lies in the range of visible light. A simple hydrothermal method was applied to fabricate a series of bismuth oxychloride/bismuth oxyiodide/grafted graphitic carbon nitride (BiOmCln/BiOpIq/g-C3N4) sheets with different contents of g-C3N4. The fabricated sheets were characterized through XRD, TEM, SEM-EDS, XPS, UV-vis DRS, PL, and BET. The conversion efficiency of CO2 reduction to CH4 of BiOmCln/BiOpIq of 4.09 μmol g−1 can be increased to 39.43 μmol g−1 by compositing with g-C3N4. It had an approximately 9.64 times improvement. The photodegradation rate constant for crystal violet (CV) dye of BiOmCln/BiOpIq of k = 0.0684 can be increased to 0.2456 by compositing with g-C3N4. It had an approximately 3.6 times improvement. The electron paramagnetic resonance results and the quenching effects indicated that 1O2, •OH, h+, and •O2− were active species in the aforementioned photocatalytic degradation. Because of their heterojunction, the prepared ternary nanocomposites possessed the characteristics of a heterojunction of type II band alignment.
1. Introduction
Semiconductor photocatalysis is an effective green technology because it can completely decompose environmental pollutants under mild conditions. The applications of semiconductor photocatalysts have elicited much scholarly attention for use in the treatment of organic pollutants because these photocatalysts can transform solar energy into chemical energy [1]. In addition, photocatalysts can also be used in the reduction of CO2 and/or the construction of solar cells [2,3,4,5,6]. Since Fujishima and Honda reported the photocatalytic decomposition of water on the surface of TiO2, TiO2 has been widely studied to degrade pollutants or decompose water. However, the wide band gap (3.0–3.2 eV) of TiO2 limits its application range [7]. Because the band gap in this range can only be applied to UV light with a small energy proportion in solar energy for photocatalysis, if the band gap can be reduced to below 2.5 eV, visible light can also be applied for photocatalysis, which accounts for a larger proportion of solar energy, and can be used more effectively.
Many semiconductor photocatalysts have been developed, including TiO2, Fe2O3, CuO, and BiOX (X = I, Br, Cl). In particular, BiOX photocatalysts have drawn much research interest due to their unique electronic structure [8,9,10,11]. Bismuth oxychloride (BiOCl) was first discovered in the early 19th century, and other bismuth oxyhalides (e.g., BiOF, BiOBr, and BiOI) have been discovered since then. BiOX crystals contain a layered structure of [Bi2O2]2+, which results in them having highly asymmetric electrical, magnetic, and optical properties; thus, BiOX is frequently used in industrial chemicals, such as pharmaceuticals, pigments, and organic catalysts [12,13]. In BiOX crystals, four X and four O atoms surround each Bi atom to form a uniform asymmetric decahedral geometric structure [12]. [Bi2O2]2+ has a strong covalent bond, which connects to the [X]− layer through the van der Waals force along the c-axis direction. Weak van der Waals forces and strong covalent bonds lead to the formation of layered structures. Xnp (n = 3, 4, and 5 corresponding to X = Cl, Br, and I, respectively) and O2p occupy the top of the valence band of BiOX, and Bi6P occupies the conduction band of BiOX [14]. Due to the unique atomic structure of BiOX, it has inherently superior photocatalytic properties. However, many bottlenecks must still be overcome to improve its performance in practical applications.
BiOX with the aforementioned compositions is a heterogeneous compound. There are heterojunctions between BiOmCln/BiOpIq and g-C3N4. The first study to use g-C3N4 as a nonmetallic visible-light photocatalyst was published in 2008 [15]. However, because of the high electron–hole recombination rate of g-C3N4, its degradation efficiency is low; therefore, many studies have been conducted on composite photocatalysts containing g-C3N4 [16,17]. Studies have reported that heterojunctions associated with perovskite materials, including Bi2SiO5-g-C3N4 [18], SrFeO3-g-C3N4 [19], BiOI-g-C3N4 [20], PbBiO2Br/g-C3N4 [21], PbBiO2I/Bi5O7I/g-C3N4 [22], and PbBiO2Br/PbO/g-C3N4 [23], exhibit high photocatalytic activity.
When two or more different band gap photocatalysts are combined together, the heterojunction between their interfaces often has a synergistic effect on their photocatalysis. Many scholars have conducted a lot of research on this phenomenon in the past ten years. For example, Li et al. proposed the concept of a heterostructure of type II band alignment [22,24,25,26]. In addition, there are also newer descriptions of Z-scheme and S-scheme effects in the literature by Wang et al. [27], Xu et al. [28], and Wang et al. [29].
This study synthesized a BiOpClg/BiOxIy compound and composited BiOpClg/BiOxIy with g-C3N4 to separate photogenerated electron holes for achieving enhanced photocatalytic activity. The synthesized and composited photocatalyst materials were studied for the reduction of CO2 to CH4 and the degradation of CV dyes. At the same time, some discussions were made on the photocatalytic mechanism of prepared ternary nanocomposites.
2. Results and Discussion
2.1. Characterization of the Produced BiOmCln/BiOpIq/g-C3N4 Composites
The crystal phases of the 40 samples produced in this study were controlled by varying the sample synthesis ratio, solution pH, and reaction temperature. The hydrothermal time was 12 h; the molar ratio of Cl: I was 1:2 or 2:1; the solution pH was 1, 4, 7, 10, or 13; the reaction temperature was 100, 150, 200, or 250 °C. Table 1 presents the codes of the prepared samples.

Table 1.
Codes of the BiOmCln/BiOpIq samples produced under various reaction temperatures, different pH values, two KCl:KI molar ratios, and a reaction time of 12 h.
2.1.1. XRD Analysis
XRD analysis was conducted to identify the compounds present in the synthesized samples. Each compound has a unique diffraction spectrum, and an analysis of the diffraction spectrum of a sample can indicate its composition.
Figure 1 shows that materials with different weight percentages of g-C3N4 (0, 2, 5, 10, 12, 15, 18, 20, and 55 wt%) were composited with the compound at a reaction temperature of 150 °C in 4 h. The synthesized samples were used to degrade CV dye to identify the catalyst with the highest degradation efficiency after electron–hole recombination. The XRD results of the BC1I2-250-4 sample agreed with those of Bi3O4Cl (diffraction peaks at 2θ values of approximately 9.5°, 24.0°, 29.1°, 29.7°, 31.4°, 41.6°, and 45.2°), BiOCl (diffraction peaks at 2θ values of approximately 12.0°, 24.1°, 25.9°, 32.5°, 33.5°, 40.9°, 46.7°, 49.7°, 54.1°, 55.1°, and 58.6°), BiOI (diffraction peaks at 2θ values of approximately 9.7°, 29.7°, 31.7°, 45.5°, 51.3°, and 55.3°), Bi4O5I2 (diffraction peaks at 2θ values of approximately 29.6°, 31.6°, 37.0°, 37.3°, 39.3°, 45.4°, 51.3°, and 55.1°), and Bi4O5I2 (diffraction peaks at 2θ values of approximately 7.2°, 24.0°, 31.3°, 32.03°, 33.88°, 35.5°, 40.5°, and 41.1°). Thus, the aforementioned sample contains a crystalline phase comprising Bi3O4Cl, BiOI, BiOCl, Bi4O5Cl2, and Bi4O5I2. Pure g-C3N4 has a relatively strong diffraction peak at 27°. Small quantities of g-C3N4 were added into the samples, and the strength of the samples decreased with decreases in the weight percentage of the added g-C3N4. The aforementioned result verified the successful synthesis of heterogenous composite catalysts containing g-C3N4 in this study.
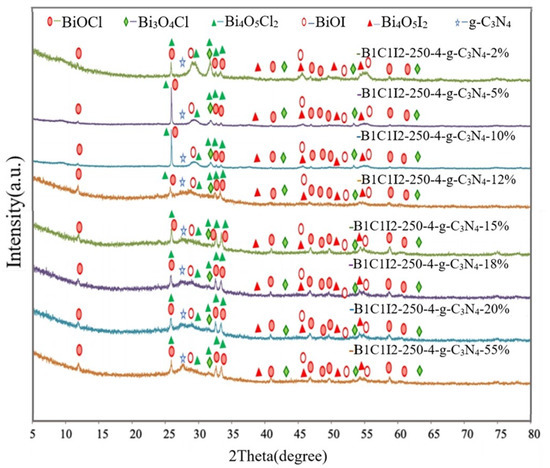
Figure 1.
X-ray diffraction (XRD) patterns of the BiOmCln/BiOpIq/g-C3N4 samples with g-C3N4 contents of 2%, 5%, 10%, 12%, 15%, 18%, 20%, and 55% that were prepared under a KCl:KI molar ratio of 1:2, a hydrothermal temperature of 250 °C, a pH of 4, and a reaction time of 12 h.
2.1.2. SEM and TEM
SEM and TEM mainly detect the morphology of samples. With the aid of their accessory equipment, functions such as detecting EDS, HR-TEM, and SAED can be added to determine the element composition and crystallinity of the sample. There are a lot of studies in the literature using SEM and TEM to detect the material properties of the bismuth oxyhalide photocatalyst [30,31,32,33,34,35]. With the different operating conditions for the synthesis of bismuth oxyhalide, the crystalline and morphology of the synthesized samples will also be different.
Figure 2a displays the bright-field TEM image of the BC1I2-4-250-g-C3N4-20% sample. The light part of this image represents g-C3N4 and the dark part of this image represents BiOCl and BiOI. The image analysis of the aforementioned composite indicated that BiOmCln/BiOpIq was embedded in the sheet structure of g-C3N4. This phenomenon has similar results to BiOBr/g-C3N4 [34]. It showed that g-C3N4 coats other substances to become a wrinkled two-dimensional structure. When C3N4 belongs to an amorphous structure, it becomes difficult to see the state of encapsulation [33]. Figure 2b depicts the HR-TEM image of the aforementioned sample. TEM and XRD analyses indicate that BC1I2-250-4-g-C3N4-20% was mainly composed of BiOCl (d = 0.368 nm) and BiOI (d = 0.281 nm). The aforementioned result is the result of comparing the HR-TEM image and the JCPDS crystallization parameters of XRD. This is good evidence for the crystallization condition of the sample. Figure 2c presents the SAED pattern of this sample. The light spots were arranged in an aperture; therefore, the aforementioned sample was speculated to have a polycrystalline nature, and from the comparison of the pattern with XRD results, it can be proved that the samples in the figure correspond to BiOCl (110) and BiOI (002), respectively. Compared with the result of [34], the crystallinity of our sample is slightly inferior to [34]. Figure 2d illustrates the EDS results of BC1I2-4-250-g-C3N4-20%, with the ratio of each element being presented in the inset. The EDS results indicated that the aforementioned sample contained Bi, Cl, I, O, C, and N, which evinced the successful synthesis of BC1I2-4-250-g-C3N4-20%.

Figure 2.
(a) FE-TEM image, (b) HR-TEM image, (c) SAD and (d) EDS of the BC1I2-250-4-g-C3N4-20% sample prepared using the hydrothermal autoclave method.
2.1.3. Analysis of XPS Spectra
In XPS, X-rays are used to excite electrons in the inner shells of atoms for quantitatively analyzing the electronic and chemical states of the elements in a material. Therefore, this method is also called electron spectroscopy for chemical analysis (ESCA). The electronic transition state in the principal quantum orbital can be quantitatively analyzed using XPS, and the electronic transition state in the angular quantum orbital can be examined through the deconvolution of the XPS spectrum. XPS also indicates whether the bonding energy of a substance has changed. An X-ray photoelectron spectrometer can be used to analyze the valence state and configuration of a sample. Moreover, the elemental composition of a sample can be determined from its XPS spectrum. Figure 3a displays the complete XPS spectra of BC1I2-250-4 and BC1I2-250-4-g-C3N4-20%. As depicted in the aforementioned figure, the photoelectrons used in XPS excited the I 3p, Bi 4p, I 3d, O 1s, Bi 4f, Bi 4d, N 1s, C 1s, Cl 2p, Bi 4f, I 4d, O 2s, and Bi 5d energy levels of the aforementioned samples. Our lab has performed XPS analysis on BiOxCly/BiOmBrn/g-C3N4 and determined its XPS pattern [31].
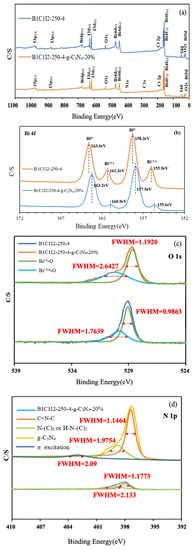
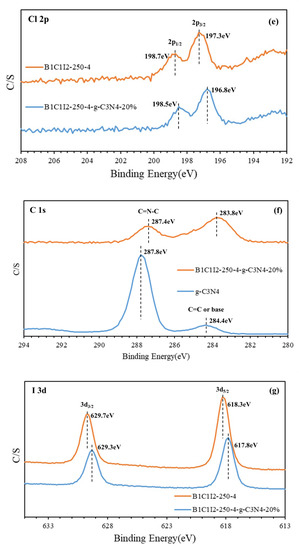
Figure 3.
High-resolution X-ray photoelectron spectroscopy spectra of the BiOmCln/BiOpIq/g-C3N4-20% photocatalyst prepared under a KCl:KI molar ratio of 1:2, a hydrothermal temperature of 250 °C, a pH of 4: (a) complete survey, (b) Bi-4f, (c) O-1s, (d) N-1s, (e) Cl-2p, (f) C-1s, and (g) I-3d spectra.
Figure 3b displays the Bi 4f diagram of BC1I2-250-4 and BC1I2-250-4-g-C3N4-20%. In this figure, peaks representing Bi3+ were located at 158.3 and 163.6 eV and the characteristic peak positions representing Bi+3−x were located at 155.9 and 161.3 eV. By contrast, Bi+3−x peaks were not observed in [31]. Subtle differences existed in the bonding electronic configurations of Bi in BiOmCln/BiOpIq and BiOxCly/BiOmBrn. However, the same trend was observed in the right displacement caused by the addition of g-C3N4 for both aforementioned composites. The aforementioned result was obtained because when Bi was partially synthesized with the iodine element using a high-pressure hydrothermal method, it would be reduced to a low valence state that corresponds to the signals of the 4d3/2, 4d5/2, 4f5/2, 4f7/2, and 5d states. Figure 3c shows the O1s peaks of BC1I2-250-4 and BC1I2-250-4-g-C3N4-20%. The full-width at half-maximum (FWHM) of Bi+3-O was 0.9863–1.1920 eV, and the FWHM of Bi+3−x-O was 1.7639–2.6427 eV. The BiOxCly/BiOmBrn spectrum obtained in [31] contained only a single peak, whereas the BiOmCln/BiOpIq spectrum obtained in this study contained two peaks. This observation was probably because the splitting of Bi into two valence states, namely Bi+3 and Bi+3−x, results in the splitting of O into two valence states. Figure 3d presents the N1s diagram of g-C3N4 and BC1I2-250-4-g-C3N4-20%. The FWHM of C=NC was 1.1464–1.1773 eV, and the FWHM of N-(C)3 and HN-(C)2 was 1.9754–2.133 eV. These results are consistent with those obtained in [31]. Thus, both BiOmCln/BiOpIq and BiOxCly/BiOmBrn can be composited with g-C3N4. Figure 3e displays the Cl 2p narrow spectrum of BC1I2-250-4 and BC1I2-250-4-g-C3N4-20%, whose Cl 2p peaks were located at 196.8 and 198.7 eV, respectively, which corresponded to 2p3/2 and 2p1/2. The aforementioned peaks are the characteristic peaks of Cl, which agrees with the results of [31]. Figure 3f illustrates the C 1s narrow spectra of BC1I2-250-4-g-C3N4-20% and g-C3N4. The C1s spectrum of BC1I2-250-4-g-C3N4-20% exhibited two peaks that corresponded to binding energies of approximately 284.4 and 287.8 eV. This result agrees with that in [31]. As displayed in Figure 3g, the binding energy of the characteristic positions of I was 617.8–629.7 eV, with the binding energies of 617.8 and 629.7 eV corresponding to I3d5/2 and I3d3/2. This result is in line with those obtained in previous studies for the BiOxIy [36] and BiOxCly/BiOmBrn/BiOpIq [32] composites. A system containing I in the form of PbBiO2I/Bi5O7I/g-C3N4 has a complex but consistent peak distribution in [22].
2.1.4. UV–Vis DRS Analysis
The energy bandgaps (Eg) of the samples were calculated from the data obtained using UV–vis DRS and the Tauc plot method [14,37]. Some of the results and discussion of this work are shown in the Supplementary Materials. All Eg were in the visible light range (400 nm < λ < 700 nm, or 1.77 eV < Eg < 3.1 eV). Therefore, it can be expected that the photocatalysts of this work are promising to utilize most of the energy of sunlight for photocatalysis.
Figure 4 displays the UV–vis spectra of BiOmCln/BiOpIq/g-C3N4 samples with 2%, 5%, 10%, 12%, 15%, 18%, 20%, and 100% g-C3N4 under a pH of 4 and a hydrothermal temperature of 250 °C. The aforementioned figure indicates that the sample color changed from orange to yellow as the g-C3N4 content in the samples increased; specifically, with such an increase from 0% to 10%, the absorption peak of the sample moved to the left and deviated from the visible light region. However, when the content of g-C3N4 increased to 20%, the absorption peak moved to the right. Thus, the addition of g-C3N4 considerably affected the absorption peaks in the DRS spectra. Similar results were observed in [6] for BC1B1I1 when graphene oxide was added to it. The formation of a heterojunction by using two photocatalysts in different ratios considerably affects the energy bandgap of a material. The Eg values of B1C1I2-250-4-g-C3N4-15%, B1C1I2-250-4-g-C3N4-18%, and B1C1I2-250-4-g-C3N4-20% (2.03, 1.89, and 2.01 eV, respectively) were less than that of g-C3N4 (2.71 eV). This result indicates that the prepared photocatalysts containing g-C3N4 can absorb more visible light than can pure g-C3N4.

Figure 4.
UV–vis absorption spectra of BiOmCln/BiOpIq/g-C3N4 photocatalysts with different g-C3N4 contents that were prepared under a KCl:KI molar ratio of 1:2, a hydrothermal temperature of 250 °C, and a pH of 4: (a) photocatalysts with g-C3N4 contents of 2%, 5%, 10%, and 12%; (b) photocatalysts with g-C3N4 contents of 15%, 18%, and 20%.
2.1.5. PL Analysis
We used a photo-excited fluorescence spectrometer (PL) to determine the electron–hole recombination rate of the samples because the hydroxyl radicals and oxygen radicals required for photocatalysis originated from the reduction and oxidation of electrons and holes in the photocatalysts. When the electron–hole recombination rate is excessively high, the generation rates of hydroxyl radicals and superoxide radicals affect the photocatalytic efficiency [38]. Therefore, the photocatalytic efficiency can be determined from the results of PL spectroscopy. As displayed in Figure 5, the electron–hole recombination rates of the uncomposited samples were lower than those of the composited samples. The scanning range of the spectrum was 350–600 nm, and the excitation wavelength of 300 nm was used. The electron–hole recombination rate of pure g-C3N4 was higher than those of all the uncomposited samples, and BC1I2-250-4-g-C3N4-20% had a lower electron–hole recombination rate than pure g-C3N4 did.
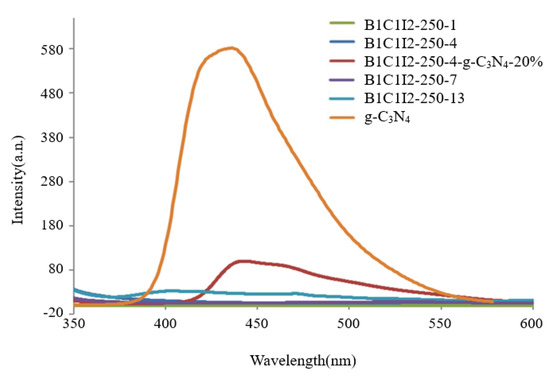
Figure 5.
Photoluminescence spectra of the BiOmCln/BiOpIq/g-C3N4−20% photocatalyst prepared under a KCl:KI molar ratio of 1:2, a hydrothermal temperature of 250 °C, and a pH of 4.
Pure g-C3N4 exhibited the highest electron–hole recombination rate in this study. Therefore, when electrons and holes were generated in pure g-C3N4 through photocatalysis, they recombined quickly. Consequently, free radicals that react with CV could not form. However, low electron–hole recombination rates were observed in samples with 0 wt% g-C3N4 (i.e., C1I2-250-1, C1I2-250-4, C1I2-250-7, and C1I2-250-13). The aforementioned result can be attributed to two possibilities: (1) the generated electrons and holes formed free radicals to react with CV, so the recombination of electron holes was very weak; (2) the generated electrons and holes were few in number; therefore, there was no recombination of electrons and holes.
The CV photodegradation efficiency of the samples with 20 wt% g-C3N4 was greater than that of the sample with pure g-C3N4 and those of the B1C1I2-250-1, B1C1I2-250-4, B1C1I2-250-7, and B1C1I2-250-13 samples because the numbers of electrons and holes generated through photocatalysis and the electron–hole recombination rate were higher in the samples with 20 wt% g-C3N4, which reached the better and more appropriate state.
2.1.6. BET Analysis
The nitrogen gas content in and nitrogen adsorption–desorption isotherm of the BiOmCln/BiOpIq/g-C3N4-20% sample were used to calculate its pore volume and BET-specific surface area, respectively. As the BET-specific surface area increased, the reaction area on the sample surface increased, which affected the reaction rate. As displayed in Figure 6, the nitrogen adsorption–desorption isotherm of the aforementioned sample was a type IV isotherm with an H3 hysteresis loop [39,40,41,42] (as defined by the International Union of Pure and Applied Chemistry). The hysteresis loop of this isotherm (P/P0 > 0.8) indicates that the aforementioned sample contained mesopores (size = 2–50 nm) and macropores (size ≥ 50 nm). Using the Barrett–Joyner–Halenda method, we computed the BET-specific surface area to be 17.4356 m2/g and the average pore size to be 27.76 nm. [43]
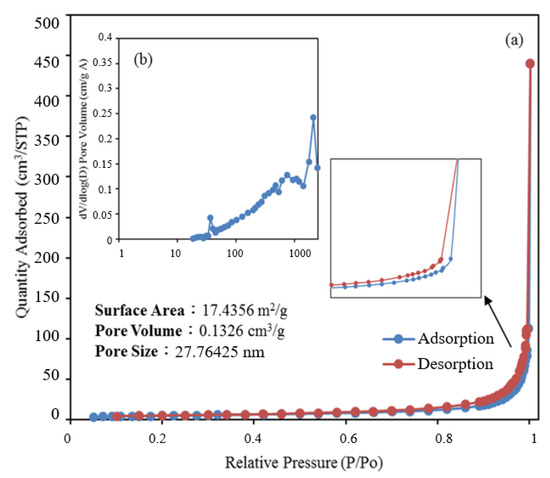
Figure 6.
(a) Nitrogen adsorption–desorption isotherms and (b) the corresponding pore-size distribution curve (inset) for BiOmCln/BiOpIq/g-C3N4−20% photocatalyst prepared under a KCl:KI molar ratio of 1:2, a hydrothermal temperature of 250 °C, and a pH of 4.
Samples with appropriate pore sizes and a large specific surface area contain numerous surface activation sites, which promote product and reactant transfer. An appropriate pore size and large specific surface area can result in high electron–hole separation and a high photoenergy yield, which result in improved photocatalysis.
2.2. Photocatalytic Activity
2.2.1. Photocatalytic Reduction of CO2
The application of semiconductor photocatalysts in carbon dioxide reduction, water splitting, and nitrogen fixation is an important topic at present. The mechanism for the above applications is that semiconductor photocatalysts have a tunable solar absorption range to support photo-excited electrons to reach feasible reduction potentials for the above applications [44,45,46]. Despite various strategies including the semiconductor heterojunction, heteroatom doping, defect engineering, new semiconductor synthesis, and morphology control that have been used to improve the segregation performance of photogenerated charges, the photocatalytic design to achieve efficient reduction, splitting, and fixation of extremely stable CO2, H2O, and N2 is still very challenging [47,48,49]. Generally, it is very difficult for a single catalyst to generate a sufficient number of photogenerated electrons or active species for CO2 conversion, so the photocatalytic CO2 reduction efficiency of the single catalyst is generally poor. Furthermore, it is also a challenge to utilize visible light or solar radiation and achieve efficient charge separation and robust redox capabilities [50,51].
Figure 7 shows the results of CO2 reduction by B1C1I2, B1C1I2/g-C3N4, and g-C3N4. This result shows that the CO2–CH4 conversion efficiency of the composite B1C1I2/g-C3N4 was much better than those of the individual B1C1I2 and g-C3N4. The conversion efficiency of CO2 reduction to CH4 of BiOmCln/BiOpIq of 4.09 μmol g−1h−1 can be increased to 39.43 μmol g−1 by compositing with g-C3N4. It had an approximately 9.64 times improvement.

Figure 7.
Photocatalytic reduction of CO2 as a function of irradiation time over B1C1I2, B1C1I2/g-C3N4, and g-C3N4.
2.2.2. Photocatalytic Degradation of CV
The photocatalytic effects of photocatalysts are key to the degradation of organic pollutants. In this study, CV dye was degraded using the prepared samples under different conditions to investigate their photocatalytic degradation effects. Moreover, the sample with the best photocatalytic degradation effect was identified. As displayed in Figure 8, the signal intensity of CV at 591 nm gradually weakened when it was degraded by using the prepared samples; thus, CV was successfully degraded by these samples. The original maximum absorption peak of CV dye was at 591 nm; however, the spectrum of this dye exhibited a hypsochromic shift as the irradiation time increased. CV may have undergone a structural change, which also indicates that this dye was successfully degraded by the prepared photocatalyst samples [52,53]. Jiang et al. [54] and Liao et al. [55] detailed the mechanism underlying the photocatalytic degradation of CV under visible-light irradiation. The aforementioned authors have indicated that photocatalysis enables CV dyes to form N-demethylated intermediates. Moreover, the conjugated chromophores of CV dyes can be cleaved through BiOmCln/BiOpIq/g-C3N4 photocatalysis [53].

Figure 8.
Temporal variations in the UV–vis adsorption of the aqueous BiOmCln/BiOpIq/g-C3N4-20% photocatalyst prepared under a KCl:KI molar ratio of 1:2, a hydrothermal temperature of 250 °C, and a pH of 4 during the photocatalytic degradation of CV on the photocatalyst under visible-light irradiation.
Figure 9 presents the CV degradation efficiency diagram of BiOmCln/BiOpIq for a Cl:I ratio of 1:2, a hydrothermal temperature of 250 °C, and different pH values. The degraded pollutant in this study was 100 mL of 10 ppm of CV dye. By using relevant first-order kinetic equations ((dCt/dt) = kCt and ln(C0/Ct) = kt, where Ct is concentration of the CV dye at time t and k is the reaction rate constant), we determined the k and R2 values for different pH values. Specifically, for the pH values of 1, 4, 7, 10, and 13, the k values were 0.017, 0.068, 0.035, 0.033, and 0.015 h−1, respectively, and the R2 values were above 0.90 (Table 2), BiOmCln/BiOpIq had a superior photocatalytic degradation effect at a pH of 4. It was also found from the literature that under similar synthesis conditions, a Cl: I (or Br) ratio of 1:2, a hydrothermal temperature of 250 °C, and pH = 4, BiOpIq (BC1I2-250-4, k = 0.068 h−1) gave slightly better results than for BiOxCly/BiOmBrn (BC1B2-250-4, k = 0.043 h−1) [31].
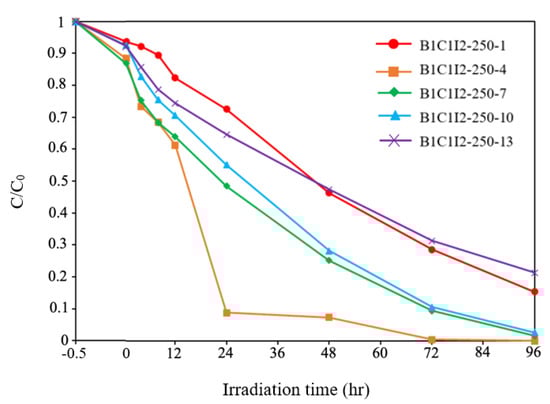
Figure 9.
Photodegradation of CV with the irradiation time on various BiOmCln/BiOpIq photocatalysts prepared under a KCl:KI molar ratio of 1:2, a pH of 1–13, and a hydrothermal temperature of 250 °C.
Table 2.
Rate constants for the pseudo-first-order degradation of CV on the prepared BiOmCln/BiOpIq photocatalysts under visible–light irradiation.
Figure 10 displays the degradation efficiency graph of the BiOmCln/BiOpIq/g-C3N4 samples with g-C3N4 contents of 20%, 40%, 60%, and 80% for a Cl:I ratio of 1:2, a pH of 4, and a reaction temperature of 250 °C. To ensure that the CV dye was completely adsorbed by the prepared catalysts, the first 30 min of the degradation reaction was conducted in a dark room. Figure 10 indicates that C1I2-250-4-g-C3N4-20% had a superior photocatalytic effect on the other adopted samples. By using relevant first-order kinetic equations (dCt/dt) = −kCt and ln(C0/Ct) = kt, we determined the k and R2 values for different g-C3N4 contents. For g-C3N4 contents of 20%, 40%, 60%, and 80%, the k values were determined to be 0.2456, 0.1943, 0.1041, and 0.0584 h−1, respectively, and the R2 values were determined to be above 0.9. Compared with the results of BiOxCly/BiOmBrn/g-C3N4 (k = 0.0282~0.0710 h−1) [4], the results of BiOmCln/BiOpIq/g-C3N4 were much better.

Figure 10.
Photodegradation of CV with the irradiation time on BiOmCln/BiOpIq/g-C3N4 samples with g-C3N4 contents of 20–80% that were prepared under a KCl:KI molar ratio of 1:2, a pH of 4, and a hydrothermal temperature of 250 °C.
The aforementioned results were in line with the PL results. When the proportion of g-C3N4 was 20%, optimal numbers of electrons and holes were generated through photocatalysis and an optimal electron–hole recombination rate was achieved. The photocatalytic efficiency at a g-C3N4 content of 80% was considerably lower than that at a g-C3N4 content of 20% (Figure 10). The reason can be inferred from the mechanism that when the content of g-C3N4 increased from 0.5% to 20%, the generation of •OH increased. However, when the content of g-C3N4 was further increased to 80%, the formation of •OH decreased. Equations (1) and (2) describe photocatalytic CV degradation by active substances over multiple cycles.
CV + •O2− → decomposed compounds
CV + •OH → decomposed compounds
Table 3 presents a summary of the results of all the irradiation experiments. Among the samples without g-C3N4, the BC2I1-100-4, BC1I2-250-4, and BC2I1-150-4 samples had the top three degradation efficiencies. Among all the samples, the C1I2-250-4-g-C3N4-20% sample had the highest degradation efficiency. The degradation efficiency of this sample exceeded that of the uncomposited C2I1-100-4 sample by more than three times.
Table 3.
Rate constants for the pseudo-first-order degradation of CV on the prepared BiOmCln/BiOpIq/g-C3N4 samples under visible-light irradiation.
We used fluorescent lamps with very weak light intensity to conduct experiments, which can prove that the new composite material produced by bismuth oxyhalide photocatalyst composite g-C3N4 can still exert the photodegradation effect under weak visible-light sources. (More “Photocatalytic degradation of CV” can be found in the Supplementary Materials).
2.2.3. Reuse of BiOCl/BiOI/g-C3N4
Reuse rate tests were conducted to determine the reuse rate and stability of the prepared catalysts. Each of the prepared photocatalysts was used to photodegrade 10 ppm of CV dye five times. Subsequently, we recovered the remaining catalyst, filtered it with distilled water, and dried it for 24 h in an oven. Figure 11a displays the reuse efficiency of the BiOmCln/BiOpIq/g-C3N4 catalyst with 20% g-C3N4 for the degradation of CV dye under a Cl:I ratio of 1:2, a pH of 4, and a hydrothermal temperature of 250 °C. The degradation efficiency of the aforementioned catalyst remained above 90.5% even after it was used three times for photodegradation; thus, this catalyst can be reused. The aforementioned result is similar to a result obtained in [52]. Figure 11b presents the XRD patterns of BC1I2-4-250-g-C3N4-20% before use and after five times of use. The aforementioned catalyst exhibited a similar crystal phase after five times of use, which indicates that this catalyst had satisfactory stability.

Figure 11.
(a) Cycling runs in the photocatalytic degradation of CV in the presence of the BiOmCln/BiOpIq/g-C3N4-20% photocatalyst prepared under a KCl:KI molar ratio of 1:2, a hydrothermal temperature of 250 °C, and a pH of 4. (b) XRD patterns of the aforementioned photocatalyst before use and after five times of use.
In terms of practicality, a re-usability of only three times represents that the stability of the material needs to be strengthened. However, from the perspective of innovative research, this does not deny the fact that the experiment is reproducible. There are some studies in the literature that used various surface modification or doping trace element methods to improve the stability of photocatalysts. The primary goal of this experiment was to confirm the reproducibility of this innovative photocatalyst. Its stability may be related to the bonding strength between the crystalline elements of its material, or it may also be related to its own crystalline stability. How to strengthen the stability of this innovative photocatalyst and improve its feasibility in practical application can be listed as a project for future work.
2.2.4. Verification of Active Species and EPR Analysis
Scavengers can be used to confirm the presence of main free radicals produced by catalysts during photocatalytic reactions. Different photocatalytic effects may occur when different radical scavengers are added during the photodegradation reaction. Studies have demonstrated that the main free radicals generated by the synthesized catalysts are trapped free radicals [56,57]. In this study, an experiment was conducted in which IPA, BQ, SA, and AO were used as the scavengers of hydroxyl radicals (•OH), superoxide radicals (•O2−), singlet oxygen (1O2), and holes (h+), respectively. Figure 12a displays the variations in the dye concentration changes for the BC1I2-250-4-g-C3N4-20% photocatalyst when different capture agents were used. In this figure, the Y-axis (1–η) represents (ΔC0 − ΔCs)/ΔC0 × 100%, where ΔC0 is the CV concentration change without scavenger illumination for 96 h, and ΔCs is the CV concentration change with scavenger illumination for 96 h. The higher the (1 − η), the more obvious the change in the CV degradation rate. This meant that the specified active species was captured obviously by the corresponding scavenger. This implied that the specified active species plays an increasingly important role in the photodegradation of CV solution. The proportions of BQ and AO in the aforementioned photocatalysts were 23.5% and 13.2%, respectively. Thus, the main active species produced by the photodegradation reaction of BC1I2-250-4-g-C3N4-20% was the •O2− superoxide radical; however, the h+, •OH, and 1O2 species also exerted an influence.

Figure 12.
(a) Variations in the dye concentration with the irradiation time on the BiOmCln/BiOpIq/g-C3N4-20% photocatalyst prepared under a KCl:KI molar ratio of 1:2, a hydrothermal temperature of 250 °C, and a pH of 4 when using different scavengers (i.e., sodium azide, p-benzoquinone, ammonium oxalate, and isopropanol). Electron paramagnetic resonance spectra for (b) DMPO-•O2− and (c) DMPO-•OH on the aforementioned catalyst under visible-light irradiation.
EPR spectroscopy can be used to detect the •OH and •O2− radicals produced through the reactions of photogenerated holes and electrons with H2O and O2 during the photocatalytic degradation process [57,58]. We used 5,5-dimethyl-1-pyrroline N-oxide (DMPO) as a free radical scavenger to produce photocatalytic degradation. DMPO when dissolved in an aqueous solution can be used to detect whether a catalyst produces •OH during a photocatalytic reaction. Moreover, DMPO dissolved in methanol solution can be used to identify the production of •O2− by a catalyst in a photocatalytic reaction.
Figure 12b displays the EPR spectrum of the BC1I2-4-250-g-C3N4-20% sample in a solution of DMPO in methanol. The results in the aforementioned figure indicate the absence of any detected EPR signal when the aforementioned sample was in the dark room, and the characteristic •O2− peak appeared after 5 min of illumination. Thus, the aforementioned catalyst contained the •O2− active species. Figure 12c depicts the EPR spectrum of the aforementioned sample in an aqueous solution containing DMPO. No EPR signal was observed in the dark room, and a characteristic 1:2:2:1 peak appeared after 5 min of illumination. These results indicate that the aforementioned catalyst contained the •OH active species.
A comparison of the results displayed in Figure 12a–c with the results presented in the literature [2,38] indicated that the EPR signal of •OH was relatively stable and had a more consistent trend with that of the scavenger method for measuring active species. The EPR signal of •O2− was relatively unstable. Although the EPR signal of •O2− appeared to be weak, •O2− was a dominant active species in the aforementioned photocatalyst [38].
2.3. Schematic of Bandgap Structures of BiOCl/BiOI/g-C3N4
Figure 13 depicts a schematic of a hypothetical mechanism of the photocatalytic effect of BiOmCln/BiOpIq/g-C3N4 in the reduction of CO2 (Figure 13a) and photocatalytic degradation of a CV aqueous solution dye (Figure 13b). Figure 13a clarifies the mechanism approach, which can optimize the overall CO2 conversion rate. Through thermodynamic or kinetic control, the selectivity of the whole product can be improved [59]. Figure 13b illustrates the photosensitization and photocatalytic processes of the aforementioned photocatalyst. When irradiating BiOmCln/BiOpIq/g-C3N4 with light, the electrons in the valence band of g-C3N4 are excited and move to the conduction band of g-C3N4. These electrons are transported first to the conduction band of BiOCl and then to the conduction band of BiOI. The aforementioned electrons generate •O2− when they react with O2 during transportation. If these electrons are transferred back to g-C3N4, the electron–hole recombination rate can be effectively reduced.
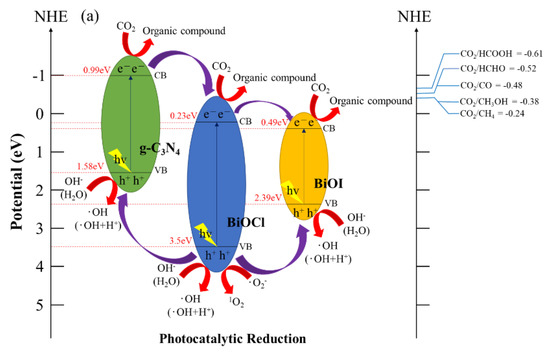
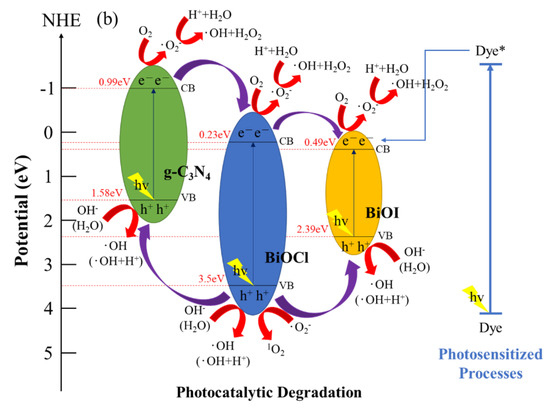
Figure 13.
Band structure diagram and possible charge separation processes of the BiOmCln/BiOpIq/g−C3N4−20% photocatalyst prepared under a KCl:KI molar ratio of 1:2, a hydrothermal temperature of 250 °C, and a pH of 4 for (a) photocatalytic reduction of CO2 and (b) photocatalytic degradation of dye.
The BiOCl/BiOI/g-C3N4 photocatalyst is a three-phase composite material. The experimental results showed that the photocatalytic activity of the derived composite BiOCl/BiOI/g-C3N4 exceeded the activity of the individual components of BiOCl/BiOI by about 9.64 times for CO2 reduction and 3.6 times for photocatalysis degradation of CV. Therefore, there may be a synergistic effect between BiOCl/BiOI and g-C3N4. In fact, many researchers have indicated that there is a synergistic effect in a composite material comprising two contacting semiconductors [49,60]. The above effect is ascribed to the effective charge transfer achieved at the interface of the two semiconductors. The described phenomenon may produce the effectiveness of photo-excited electron–hole separation, thereby increasing photocatalytic activity. The charge transfer process is driven by the corresponding relationship of the band potentials. Therefore, a suitable band potential constitutes a prerequisite related to the synergistic effect of the composite photocatalyst.
The prerequisite for decomposing CV dyes is that the electrons in the conduction band of BiOX (X = Cl, I) are transferred to the bulk solution, and react with the aqueous solution to form reactive oxygen species, so the photocatalysis and photosensitization processes can be carried out simultaneously. These photogenerated and photosensitive electrons leaving the material interface, after reaching the bulk solution, interact with the photocatalyst-surface-dwelling oxygen; then, •O2− radicals are generated. The •O2− radicals are very unstable. It quickly reacts with H+ ions to form hydroxyl radicals. The h+ holes will also enter the bulk solution after leaving the valence band interface, react with OH− ions (or H2O), and generate hydroxyl radicals [61]. The mechanism of 1O2 generation is also related to •O2−. Through the action of cationic substances (including h+) and superoxide •O2−, one electron in •O2− is transferred to the cationic substance to generate 1O2 active species [62]. Although 1O2 does not play any important role in CO2 reduction and CV degradation, we can still see its presence in active species detection experiments.
In the literature about the mechanism of degradation of CV dyes in the presence of photocatalysts by ultraviolet irradiation, it is believed that nitrogen-centered and carbon-centered free radicals are formed first. Then, there is the opportunity for N-dealkylation and disruption of the dye chromophore structure [35,54,60]. In this study, photocatalytic degradation was carried out with more practical visible light as the light source instead of UV irradiation to degrade the hydroxylated compounds of CV. It was confirmed by this study that the intermediates produced by the semiconductor photocatalyst we used under the catalysis of visible-light irradiation were the same as the intermediates produced by irradiation with ultraviolet light in the literature. In this study, it is believed that photosensitization and photocatalysis will proceed simultaneously during the reaction. The generation of •O2− radicals is caused by the reaction of photosensitive and photogenerated electrons e− on the surface of the photocatalyst. The generation of •OH radicals is caused by the reaction of h+-OH− (or H2O) and •O2−-H+. From the experiments of active species, we can see that the two main free radical oxidants (•OH and •O2−) in this work are dominated by •O2−.
In the electron transportation process, h+ oxidizes OH− and H2O to produce •OH. These free radicals further degrade and react with CV dyes, which results in the formation of mineralized products and the CV dyes absorbing light energy for photosensitization reactions to improve the photocatalytic effect. Because of their heterostructures, the prepared ternary nanocomposites possess the characteristics of heterostructures of type II band alignment [22,24]. Therefore, the Z-scheme effect [63] of improving photocatalytic degradation is achieved.
3. Experimental
3.1. Materials
Potassium chloride (KCl), potassium iodide (KI; Katayama, Osaka, Japan), Bi(NO3)3∙5H2O (Sigma-Aldrich, St. Louis, MO, USA), 2-hydroxybenzoic acid (2-HBA, Katayama, Osaka, Japan), CV dye (TCI;), p-benzoquinone (BQ; Alfa Aesar, Ward Hill, MA, USA), ammonium oxalate (AO; Osaka, Japan), sodium azide (SA; Sigma-Aldrich, St. Louis, MO, USA), and isopropanol (IPA; Merck, Rahway, NJ, USA) were used in the absence of further purification. Moreover, sodium hydroxide, reagent-grade nitric acid, and high-performance liquid-chromatography-grade methanol were from Merck.
3.2. Instruments and Analytical Methods
An MAC Science MXP18 instrument (MAC Science Co., Ltd., Tokyo, Japan), was used with Cu-Κα radiation at a current of 80 mA and a working voltage of 40 kV to obtain X-ray diffraction (XRD) spectra. A Scinco SA-13.1 spectrophotometer (Scinco Co., Ltd., Seoul, Republic of Korea) was adopted to measure ultraviolet UV-DRS (k = 300–800 nm) spectra at room temperature. A JEOL-2010 microscope (JEOL Ltd., Tokyo, Japan) with an accelerating voltage of 200 kV was used to perform high-resolution transmission electron microscopy (HR-TEM), field emission transmission electron microscopy (TEM), selected-area electron diffraction (SAED), and electron-dispersive X-ray spectroscopy (EDS). A JEOL JSM-7401F (JEOL Ltd., Tokyo, Japan) microscope with an accelerating voltage of 15 kV was adopted to conduct field emission scanning electron microscopy (FE-SEM)–EDS. Photoluminescence (PL) measurements were performed on a Hitachi F-7000 (Hitachi, Ltd., Tokyo, Japan) device. A Micromeritics Gemini (Gemini-V, Micromeritics, USA) automated system was used with the adsorbate being nitrogen gas at liquid nitrogen temperature for measuring the samples’ Brunauer–Emmett–Teller (BET) specific surface areas (SBET). An instrument manufactured by ULVAC-PHI (ULVAC PHI INC. Kanagawa, Japan) was adopted to conduct high-resolution X-ray photoelectron spectroscopy (HR-XPS). Finally, an Agilent 5310A frequency counter operating in the X band and a Brüker ER200D spectrometer (Bruker, Karlsruhe, Germany) were used to record the electron paramagnetic resonance (EPR) spectra.
3.3. Synthesis of Different BiOmCln/BiOpIq/g-C3N4 Composites
The method described as follows was used to produce BiOmCln/BiOpIq composites. In a 50 mL flask, we mixed 5 mmol Bi (NO3)3∙5H2O with 5 mL of 4 M HNO3. Then, we added 2 M NaOH dropwise to the aforementioned mixture to adjust its pH value to 1, 4, 7, 10, and 13. Subsequently, 3 M KI and 3 M KCl were added into the aforementioned mixture in a ratio of 2:1 or 1:2. We vigorously stirred the resulting solution for 30 min before transferring it into a 30 mL Teflon-lined autoclave, which we heated to 200, 150, or 100 °C over 30 min; then, we maintained the respective temperature for 24 h and finally left it to naturally cool to room temperature. The formulation of the aforementioned reaction parameters is based on the most appropriate operating conditions and intervals summed up by our laboratory for many years of research on hydrothermal methods [1,2,3,4,5,6]. After it was cooled to room temperature, we filtered the solution to collect the solid precipitate. During filtration, the precipitate was washed with deionized water for other ionic substances to be removed from it. The precipitate was subsequently dried at 60 °C until the next day. Different BiOmCln/BiOpBrq composites could be produced according to the reaction temperature and pH. Table 1 presents our coding of the samples prepared under various reaction temperatures, pH values, and molar ratios.
Melamine was calcined in a muffle furnace under atmospheric conditions to synthesize g-C3N4 powder directly. A total of 5 g of melamine was placed into an alumina crucible with a lid, which was subsequently heated to 520 °C in 4 h at a heating rate of 10 °C/min. After the crucible was cooled to room temperature, the powdered g-C3N4 was obtained.
The method described as follows was used to produce BiOmCln/BiOpIq/g-C3N4 composites. Binary Bi oxyhalide was composited with materials having different weight percentages of g-C3N4 (10, 20, 30, 40, 50, 60, 70, 80, and 90 wt%). First, BiOmCln/BiOpIq was dissolved in 10 mL of ethylene glycol to produce solution A. Second, g-C3N4 was dissolved in 10 mL of ethylene glycol to produce solution B. Third, solutions A and B were mixed, stirred for 30 min, autoclaved, and then heated in an oven to 150 °C over 4 h. The total amount of BiOmCln/BiOpIq and g-C3N4 in each batch was 0.2 g. Subsequently, we filtered the mixture before drying and ground it to obtain BiOmCln/BiOpBrq/g-C3N4.
3.4. Photocatalytic Experiments
3.4.1. Reduction of CO2
A three-necked flask was charged with 300 mL of an aqueous solution of 1 N NaOH and 0.1 g of photocatalyst. Then, we used a compressed steel cylinder containing CO2 (99.99%) with a mass flow controller at a delivery rate of 500 mL/min for 1 h to adjust the CO2 content of the aqueous solution to saturation. Photocatalyst reduction of CO2 was carried out under a light source. In the process of CO2 reduction, 1 mL of the gas above the solution was drawn out with a syringe needle every 24 h, and then injected into the GC. The concentration of CH4 reduced from CO2 was obtained from GC analysis.
3.4.2. Degradation of Dye
In the conducted photocatalytic experiments, 100 mL of 10 ppm of CV dye was used as the degradation product and 0.05 g of BiOmCln/BiOpIq/g-C3N4 was used as the photocatalyst. The solution was irradiated under a 15 W visible fluorescent light to produce a photocatalytic reaction. Prior to the beginning of the photocatalytic reaction, the solution was stirred in a dark room with a magnet for 30 min. After we confirmed the absorption–desorption equilibrium of the dye and catalyst at room temperature, stirring was continued and degradation occurred under irradiation with visible light. A 5 mL sample of the solution was obtained at different intervals (4, 8, 12, 24, 48, 72, and 96 h) and centrifuged at 4000 rpm for 30 min after which it became clear. The concentration of the CV aqueous solution was measured using a Scinco S-3000 spectrophotometer (Photo Diode Array UV–visible, UV–vis PDA). Absorption bands of the CV dye were located at 591.
4. Conclusions
In this study, the BiOmCln/BiOpIq/g-C3N4 photocatalyst was successfully produced using a high-pressure hydrothermal method, as verified by XRD results. The DRS results indicated that the addition of g-C3N4 effectively reduced the bandgap value of the aforementioned photocatalyst and made it easier for the photocatalyst to absorb visible light. The TEM analysis indicated that g-C3N4 was successfully composited with BiOmCln/BiOpIq. The BET analysis indicated that the adsorption–desorption isotherm of BiOmCln/BiOpIq/g-C3N4 was in agreement with those of mesoporous catalysts. In an analysis of the degradation rate of the prepared catalyst with and without g-C3N4, the addition of g-C3N4 increased the degradation rate of the photocatalyst by up to three times. In reuse tests, BiOmCln/BiOpIq/g-C3N4 had a degradation efficiency of 90.5% after its third use, which indicated that this catalyst was recyclable. Moreover, XRD results indicated that the aforementioned catalyst had the same crystal phase even after being used multiple times, which indicated that this catalyst had high stability. The conversion efficiency of CO2 reduction to CH4 of BiOmCln/BiOpIq of 4.09 μmol g−1 can be increased to 39.43 μmol g−1 by compositing with g-C3N4. It had an approximately 9.64 times improvement. The photodegradation rate constant for CV of BiOmCln/BiOpIq can be increased to 0.2456 by complexation with g-C3N4. It had an approximately 3.6 times improvement.
Supplementary Materials
The following supporting information can be downloaded at: https://www.mdpi.com/article/10.3390/catal13030522/s1, Figure S1: XRD patterns of the BiOmCln/BiOpIq samples prepared under a KCl:KI molar ratio of 1:2, a pH of 1–13, a reaction time of 12 h, and a hydrothermal temperature of 100 °C; Figure S2: XRD patterns of the BiOmCln/BiOpIq samples prepared under a KCl:KI molar ratio of 1:2, a pH of 1–13, a reaction time of 12 h, and a hydrothermal temperature of 150 °C; Figure S3: XRD patterns of the BiOmCln/BiOpIq samples prepared under a KCl:KI molar ratio of 1:2, a pH of 1–13, a reaction time of 12 h, and a hydrothermal temperature of 200 °C; Figure S4: XRD patterns of the BiOmCln/BiOpIq samples prepared under a KCl:KI molar ratio of 1:2, a pH of 1–13, a reaction time of 12 h, and a hydrothermal temperature of 250 °C; Figure S5: XRD patterns of the BiOmCln/BiOpIq samples prepared under a KCl:KI molar ratio of 2:1, a pH of 1–13, a reaction time of 12 h, and a hydrothermal temperature of 100 °C; Figure S6: XRD patterns of the BiOmCln/BiOpIq samples prepared under a KCl:KI molar ratio of 2:1, a pH of 1–13, a reaction time of 12 h, and a hydrothermal temperature of 150 °C; Figure S7: XRD patterns of the BiOmCln/BiOpIq samples prepared under a KCl:KI molar ratio of 2:1, a pH of 1–13, a reaction time of 12 h, and a hydrothermal temperature of 200 °C; Figure S8: XRD patterns of the BiOmCln/BiOpIq samples prepared under a KCl:KI molar ratio of 2:1, a pH of 1–13, a reaction time of 12 h, and a hydrothermal temperature of 250 °C; Figure S9: Scanning electron microscopy images of the BiOmCln/BiOpIq/g-C3N4-20% samples prepared using the hydrothermal autoclave method under a KCl:KI molar ratio of 1:2, different pH values, a reaction time of 12 h, and a hydrothermal temperature of 250 °C; Figure S10: UV–vis absorption spectra of the BiOmCln/BiOpIq photocatalysts prepared under a KCl:KI molar ratio of 1:2, a hydrothermal temperature of 250 °C, and various pH values; Figure S11: UV–vis absorption spectra of the BiOmCln/BiOpIq photocatalysts prepared under a KCl:KI molar ratio of 1:2, a pH of 1–13, and a hydrothermal temperature of 250 °C; Table S1: Chemical and physical properties of the BC1I2-4-250-g-C3N4-20% sample.
Author Contributions
Conceptualization, C.-C.C.; methodology, S.-H.C. and F.-Y.L.; software, H.-L.W.; validation, S.-H.C. and Y.-Y.L.; formal analysis, H.-L.W.; investigation, J.-M.J.; resources, J.-M.J.; data curation, H.-L.W. and J.-H.L.; writing—original draft preparation, Y.-M.D. and W.-T.W.; writing—review and editing, C.-C.C., Y.-M.D., W.-T.W. and Y.-Y.L.; visualization, S.-H.C.; supervision, C.-C.C.; project administration, Y.-M.D.; funding acquisition, C.-C.C. All authors have read and agreed to the published version of the manuscript.
Funding
This research was funded by the Ministry of Science and Technology (Grant No.: MOST-109-2113-M-142 -001), Taiwan.
Data Availability Statement
The data is included in the article or Supplementary Materials.
Acknowledgments
We thank the Ministry of Science and Technology of Taiwan (MOST-109-2113-M-142 -001) for financially supporting this study, and thank the Instrumentation Center of Chung Hsing University, Taiwan (MOST110-2731-M-005-001, EM022400, EPR000000400); Instrumentation Center at National Tsing Hua University, Taiwan (MOST110-2731-M-007-001, ESCA00002603); Precious Instrument Utilization Center at National Central University, Taiwan (MOST110-2731-M-008-001, ESCA00001005) for utilization of precious instruments.
Conflicts of Interest
The authors declare no conflict of interest.
References
- Lee, D.H.; Porta, M.; Jacobs, D.R.; Vandenberg, L.N., Jr. Chlorinated persistent organic pollutants, obesity, and type 2 diabetes. Endocr. Rev. 2014, 35, 557–601. [Google Scholar] [CrossRef] [PubMed]
- Chen, H.L.; Liu, F.Y.; Xiao, X.; Hu, J.; Gao, B.; Zou, D.; Chen, C.C. Visible-light-driven photocatalysis of carbon dioxide and organic pollutants by MFeO2 (M = Li, Na, or K). J. Colloid Interface Sci. 2021, 601, 758–772. [Google Scholar] [CrossRef] [PubMed]
- Liu, F.Y.; Dai, Y.M.; Chen, F.H.; Chen, C.C. Lead bismuth oxybromide/graphene oxide: Synthesis, characterization, and photocatalytic activity for removal of carbon dioxide, crystal violet dye, and 2-hydroxybenzoic acid. J. Colloid Interface Sci. 2020, 562, 112–124. [Google Scholar] [CrossRef] [PubMed]
- He, J.; Liu, J.; Hou, Y.; Wang, Y.; Yang, S.; Yang, H.G. Surface chelation of cesium halide perovskite by dithiocarbamate for efficient and stable solar cells. Nat. Commun. 2020, 11, 4237. [Google Scholar] [CrossRef] [PubMed]
- Ramirez, D.; Velilla, E.; Montoya, J.F.; Jaramillo, F. Mitigating scalability issues of perovskite photovoltaic technology through a p-i-n meso-superstructured solar cell architecture. Sol. Energy Mater. Sol. Cells 2019, 195, 191–197. [Google Scholar] [CrossRef]
- Zheng, J.; Lei, Z. Incorporation of CoO nanoparticles in 3D marigold flower-like hierarchical architecture MnCo2O4 for highly boosting solar light photo-oxidation and reduction ability. Appl. Catal. B Environ. 2018, 237, 1–8. [Google Scholar] [CrossRef]
- Yin, R.; Li, Y.; Zhong, K.; Yao, H.; Zhang, Y.; Lai, K. Multifunctional property exploration: Bi4O5I2 with high visible light photocatalytic performance and a large nonlinear optical effect. RSC Adv. 2019, 9, 4539–4544. [Google Scholar] [CrossRef]
- Chang, C.; Zhu, L.; Wang, S.; Chu, X.; Yue, L. Novel mesoporous graphite carbon nitride/BiOI heterojunction for enhancing photocatalytic performance under visible-light irradiation. Appl. Mater. Interfaces 2014, 6, 5083–5093. [Google Scholar] [CrossRef]
- Ye, L.; Su, Y.; Jin, X.; Xie, H.; Zhang, C. Recent advances in BiOX (X = Cl, Br and I) photocatalysts: Synthesis, modification, facet effects and mechanisms. Environ. Sci. Nano 2014, 1, 90–112. [Google Scholar] [CrossRef]
- Bai, Y.; Wang, P.Q.; Liu, J.Y.; Liu, X.J. Enhanced photocatalytic performance of direct Z-scheme BiOCl–g-C3N4 photocatalysts. RSC Adv. 2014, 4, 19456. [Google Scholar] [CrossRef]
- Bu, Y.; Xu, J.; Li, Y.; Liu, Q.; Zhang, X. Enhanced photocatalytic activity of BiOI under visible light irradiation by the modification of MoS2. RSC Adv. 2017, 7, 42398–42406. [Google Scholar] [CrossRef]
- Bhachu, D.S.; Moniz, S.J.A.; Sathasivam, S.; Scanlon, D.O.; Walsh, A.; Bawaked, S.M.; Mokhtar, M.; Obaid, A.Y.; Parkin, I.P.; Tang, J.; et al. Bismuth oxyhalides: Synthesis, structure and photoelectrochemical activity. Chem. Sci. 2016, 7, 4832–4841. [Google Scholar] [CrossRef]
- Singh, M.; Kumar, A.; Krishnan, V. Influence of different bismuth oxyhalides on the photocatalytic activity of graphitic carbon nitride: A comparative study under natural sunlight. Mater. Adv. 2020, 1, 1262–1272. [Google Scholar] [CrossRef]
- Zheng, M.; Ma, X.; Hu, J.; Zhang, X.; Duan, W. Novel recyclable BiOBr/Fe3O4/RGO composites with remarkable visible-light photocatalytic activity. RSC Adv. 2020, 10, 19961–19973. [Google Scholar] [CrossRef]
- Wang, X.; Maeda, K.; Thomas, A.; Takanabe, K.; Xin, G.; Carlsson, J.; Domen, K.; Antonietti, M. A metal-free polymeric photocatalyst for hydrogen production from water under visible light. Nat. Mater. 2008, 8, 76–80. [Google Scholar] [CrossRef]
- Jiang, D.; Chen, L.; Zhu, J.; Chen, M.; Shi, W.; Xie, J. Novel p-n heterojunction photocatalyst constructed by porous graphite-like C3N4 and nanostructured BiOI: Facile synthesis and enhanced photocatalytic activity. Dalton Trans. 2013, 42, 15726–15734. [Google Scholar] [CrossRef]
- Zhao, Z.; Sun, Y.; Dong, F. Graphitic carbon nitride based nano composites: A review. Nanoscale 2015, 7, 15–37. [Google Scholar] [CrossRef]
- Yang, C.T.; Lee, W.W.; Lin, H.P.; Dai, Y.M.; Chi, H.T.; Chen, C.C. A novel heterojunction photocatalyst, Bi2SiO5/g-C3N4 synthesis, characterization, photocatalytic activity, and mechanism. RSC Adv. 2016, 6, 40664. [Google Scholar] [CrossRef]
- Lin, H.P.; Chen, C.C.; Lee, W.W.; Lai, Y.Y.; Chen, J.Y.; Chen, Y.Q.; Fu, J.Y. Synthesis of a SrFeO3-x/g-C3N4 heterojunction with improved visible-light photocatalytic activities in chloramphenicol and crystal violet degradation. RSC Adv. 2016, 6, 2323. [Google Scholar] [CrossRef]
- Chou, S.Y.; Chen, C.C.; Dai, Y.M.; Lin, J.H.; Lee, W.W. Novel synthesis of bismuth oxyiodidegraphitic carbon nitride nanocomposites with enhanced visible-light photocatalytic activity. RSC Adv. 2016, 6, 33478–33491. [Google Scholar] [CrossRef]
- Wang, B.; Di, J.; Liu, G.; Yin, S.; Xia, J.; Zhang, Q.; Li, H. Novel mesoporous graphitic carbon nitride modified PbBiO2Br porous microspheres with enhanced photocatalytic performance. J. Colloid Interface Sci. 2017, 507, 310–322. [Google Scholar] [CrossRef] [PubMed]
- Lee, A.H.; Wang, Y.C.; Chen, C.C. Composite photocatalyst, tetragonal lead bismuth oxyiodide/bismuth oxyiodide/graphitic carbon nitride synthesis, characterization, and photocatalytic activity. J. Colloid Interface Sci. 2019, 533, 319–332. [Google Scholar] [CrossRef] [PubMed]
- Wang, Y.C.; Lee, A.H.; Chen, C.C. Perovskite-like photocatalyst, PbBiO2/BrPbO/g-C3N4 synthesis, characterization, and visible-light-driven photocatalytic activity. J. Taiwan Inst. Chem. Eng. 2018, 93, 315–328. [Google Scholar] [CrossRef]
- Li, Z.; Feng, J.; Yan, S.; Zou, Z. Solar fuel production: Strategies and new opportunities with nanostructures. Nano Today 2015, 10, 468–486. [Google Scholar] [CrossRef]
- Huang, H.; Pradhan, B.; Hofkens, J.; Roeffaers, M.B.J.; Steele, J.A. Solar-driven metal halide perovskite photocatalysis: Design, stability, and performance. Energy Lett. 2020, 5, 1107–1123. [Google Scholar] [CrossRef]
- Chen, S.; Huang, D.; Cheng, M.; Lei, L.; Chen, Y.; Zhou, C.; Deng, R.; Li, B. Surface and interface engineering of two-dimensional bismuth-based photocatalysts for ambient molecule activation. J. Mater. Chem. A 2021, 9, 196–233. [Google Scholar] [CrossRef]
- Wang, B.; Zhao, J.; Chen, H.; Weng, Y.X.; Tang, H.; Chen, Z.; Zhu, W.; She, Y.; Xia, J.; Li, H. Unique Z-scheme carbonized polymer dots/Bi4O5Br2 hybrids for efficiently boosting photocatalytic CO2 reduction. Appl. Catal. B Environ. 2021, 293, 120128. [Google Scholar] [CrossRef]
- Xu, Q.; Zhang, L.; Cheng, B.; Fan, J.; Yu, J. S-scheme heterojunction photocatalyst. Chem 2020, 6, 1543–1559. [Google Scholar] [CrossRef]
- Wang, Y.; Wang, K.; Wang, J.; Wu, X.; Zhang, G. Sb2WO6/BiOBr 2D nanocomposite S-scheme photocatalyst for NO removal. J. Mater. Sci. Technol. 2020, 56, 236–243. [Google Scholar] [CrossRef]
- Chen, C.C.; Fu, J.Y.; Chang, J.L.; Huang, S.T.; Yeh, T.W.; Huang, J.T.; Huang, P.H.; Liu, F.Y.; Chen, L.W. Bismuth oxyfluoride/bismuth oxyiodide nanocomposites enhance visible-light-driven photocatalytic activity. J. Colloid Interface Sci. 2018, 532, 375–386. [Google Scholar] [CrossRef]
- Chou, Y.C.; Lin, Y.Y.; Lu, C.S.; Liu, F.Y.; Lin, J.H.; Chen, F.H.; Chen, C.C.; Wu, W.T. Controlled hydrothermal synthesis of BiOxCly/BiOmBrn/g-C3N4 composites exhibiting visible-light photocatalytic activity. J. Environ. Manag. 2021, 297, 113256. [Google Scholar] [CrossRef]
- Siao, C.W.; Lee, W.L.W.; Dai, Y.M.; Chung, W.H.; Hung, J.T.; Hung, P.H.; Lin, W.Y.; Chen, C.C. BiOxCly/BiOmBrn/BiOpIq/GO quaternary composites syntheses and application of visible-light-driven photocatalytic activities. J. Colloid Interface Sci. 2019, 544, 25–36. [Google Scholar] [CrossRef]
- Wang, X.J.; Wang, Q.; Li, F.T.; Yang, W.Y.; Zhao, Y.; Hao, Y.J.; Liu, S.J. Novel BiOCl–C3N4 heterojunction photocatalysts: In situ preparation via an ionic-liquid-assisted solvent-thermal route and their visible-light photocatalytic activities. Chem. Eng. J. 2013, 234, 361–371. [Google Scholar] [CrossRef]
- Ye, L.; Liu, J.; Jiang, Z.; Peng, T.; Zan, L. Facets coupling of BiOBr-g-C3N4 composite photocatalyst for enhanced visible-light-driven photocatalytic activity. Appl. Catal. B Environ. 2013, 142–143, 1–7. [Google Scholar] [CrossRef]
- Jiang, Y.R.; Lin, H.P.; Chung, W.H.; Dai, Y.M.; Lin, W.Y.; Chen, C.C. Controlled hydrothermal synthesis of BiOxCly/BiOmIn composites exhibiting visible-light photocatalytic degradation of crystal violet. J. Hazard. Mater. 2015, 283, 787–805. [Google Scholar] [CrossRef]
- Lee, W.W.; Lu, C.S.; Chuang, C.W.; Chen, Y.J.; Fu, J.Y.; Siao, C.W.; Chen, C.C. Synthesis of bismuth oxyiodides and their composites: Characterization, photocatalytic activity, and degradation mechanisms. RSC Adv. 2015, 5, 23450–23463. [Google Scholar] [CrossRef]
- Xiao, X.; Liu, C.; Hu, R.; Zuo, X.; Nan, J.; Li, L.; Wang, L. Oxygen-rich bismuth oxyhalides: Generalized one-pot synthesis, band structures and visible-light photocatalytic properties. J. Mater. Chem. 2012, 22, 22840–22843. [Google Scholar] [CrossRef]
- Chen, C.C.; Chen, T.T.; Shaya, J.; Wu, C.L.; Lu, C.S. Bi12SiO20/g-C3N4 heterojunctions: Synthesis, characterization, photocatalytic activity for organic pollutant degradation, and mechanism. J. Taiwan Inst. Chem. Eng. 2021, 123, 228–244. [Google Scholar] [CrossRef]
- Li, T.B.; Chen, G.; Zhou, C.; Shen, Z.Y.; Jin, R.C.; Sun, J.X. New photocatalyst BiOCl/BiOI composites with highly enhanced visible light photocatalytic performances. Dalton Trans. 2011, 40, 6751–6758. [Google Scholar] [CrossRef]
- Song, L.; Zhang, S.; Wei, Q. Porous BiOI sonocatalysts: Hydrothermal synthesis, characterization, sonocatalytic, and kinetic properties. Ind. Eng. Chem. Res. 2012, 51, 1193–1197. [Google Scholar] [CrossRef]
- Zhu, L.P.; Liao, G.H.; Bing, N.C.; Wang, L.L.; Yang, Y.; Xie, H.Y. Self-assembled 3D BiOCl hierarchitectures: Tunable synthesis and characterization. CrystEngComm 2010, 2, 3791–3796. [Google Scholar] [CrossRef]
- Sing, K.S.W.; Everett, D.H.; Haul, R.A.W.; Moscou, L.; Pierotti, R.A.; Rouquerol, J.; Siemieniewska, T. Reporting physisorption data for gas/solid systems with special reference to the determination of surface area and porosity (Recommendations 1984). Pure Appl. Chem. 1985, 57, 603–619. [Google Scholar] [CrossRef]
- Tian, Z.; Yang, X.; Chen, Y.; Huang, H.; Hu, J.; Wen, B. Fabrication of alveolate g-C3N4 with nitrogen vacancies via cobalt introduction for efficient photocatalytic hydrogen evolution. Int. J. Hydrog. Energy 2020, 45, 24792–24806. [Google Scholar] [CrossRef]
- Xu, S.; Carter, E.A. Theoretical insights into heterogeneous (photo) electrochemical CO2 reduction. Chem. Rev. 2019, 119, 6631–6669. [Google Scholar] [CrossRef] [PubMed]
- Huang, J.; Mensi, M.; Oveisi, E.; Mantella, V.; Buonsanti, R. Structural sensitivities in bimetallic catalysts for electrochemical CO2 reduction revealed by Ag-Cu nanodimers. J. Am. Chem. Soc. 2019, 141, 2490–2499. [Google Scholar] [CrossRef]
- Parvanian, A.M.; Sadeghi, N.; Rafiee, A.; Shearer, C.J.; Jafarian, M. Application of porous materials for CO2 reutilization: A review. Energies 2022, 15, 63. [Google Scholar] [CrossRef]
- Xie, C.; Niu, Z.; Kim, D.; Li, M.; Yang, P. Surface and interface control in nanoparticle catalysis. Chem. Rev. 2020, 120, 1184–1249. [Google Scholar] [CrossRef]
- Gao, C.; Low, J.; Long, R.; Kong, T.; Zhu, J.; Xiong, Y. Heterogeneous single-atom photocatalysts: Fundamentals and applications. Chem. Rev. 2020, 120, 12175–12216. [Google Scholar] [CrossRef]
- Wei, X.; Akbar, M.U.; Raza, A.; Li, G. A review on bismuth oxyhalide based materials for photocatalysis. Nanoscale Adv. 2021, 3, 3353–3372. [Google Scholar] [CrossRef]
- Wang, L.; Chen, W.; Zhang, D.; Du, Y.; Amal, R.; Qiao, S.; Wu, J.; Yin, Z. Surface strategies for catalytic CO2 reduction: From two-dimensional materials to nanoclusters to single atoms. Chem. Soc. Rev. 2019, 48, 5310–5349. [Google Scholar] [CrossRef]
- Yang, L.; Peng, Y.; Luo, X.; Dan, Y.; Ye, J.; Zhou, Y.; Zou, Z. Beyond C3N4 π-conjugated metal-free polymeric semiconductors for photocatalytic chemical transformations. Chem. Soc. Rev. 2021, 50, 2147–2172. [Google Scholar] [CrossRef]
- Siao, C.W.; Chen, H.L.; Chen, L.W.; Chang, J.L.; Yeh, T.W.; Chen, C.C. Controlled hydrothermal synthesis of bismuth oxychloride-bismuth oxybromide-bismuth oxyiodide composites exhibiting visible-light photocatalytic degradation of 2-hydroxybenzoic acid and crystal violet. J. Colloid Interface Sci. 2018, 526, 322–336. [Google Scholar] [CrossRef]
- Li, K.L.; Lee, W.W.; Lu, C.S.; Dai, Y.M.; Chou, S.Y.; Chen, H.L.; Lin, H.P.; Chen, C.C. Synthesis of BiOBr, Bi3O4Br, and Bi12O17Br2 by controlled hydrothermal method and their photocatalytic properties. J. Taiwan Inst. Chem. Eng. 2014, 45, 2688–2697. [Google Scholar] [CrossRef]
- Jiang, Y.R.; Chou, S.Y.; Chang, J.L.; Huang, S.T.; Lin, H.P.; Chen, C.C. Hydrothermal synthesis of bismuth oxybromide–bismuth oxyiodide composites with high visible light photocatalytic performance for the degradation of CV and phenol. RSC Adv. 2015, 5, 30851–30860. [Google Scholar] [CrossRef]
- Liao, Y.H.B.; Wang, J.X.; Lin, J.S.; Chung, W.H.; Lin, W.Y.; Chen, C.C. Synthesis, photocatalytic activities and degradation mechanism of Bi2WO6 toward crystal violet dye. Catal. Today 2011, 174, 148–159. [Google Scholar] [CrossRef]
- Oppong, S.O.B.; Opoku, F.; Govender, P.P. Remarkable Enhancement of Eu–TiO2–GO Composite for Photodegradation of Indigo Carmine: A Design Method Based on Computational and Experimental Perspectives. Catal. Lett. 2020, 151, 1111–1126. [Google Scholar] [CrossRef]
- Chen, L.W.; Chen, H.L.; Lu, C.S.; Huang, S.T.; Yeh, T.W.; Chen, C.C. Preparation of perovskite-like PbBiO2I/g-C3N4 exhibiting visible-light-driven activity. Catal. Today 2021, 375, 472–483. [Google Scholar] [CrossRef]
- Dimitrijevic, N.M.; Vijayan, B.K.; Poluektov, O.G.; Rajh, T.; Gray, K.A.; He, H.; Zapol, P. Role of water and carbonates in photocatalytic transformation of CO2 to CH4 on titania. J. Am. Chem. Soc. 2011, 133, 3964–3971. [Google Scholar] [CrossRef]
- Gandhi, R.; Moses, A.; Sundar Baral, S. Fundamental study of the photocatalytic reduction of CO2: A short review of thermodynamics, kinetics and mechanisms. Chem. Process Eng. 2022, 43, 223–228. [Google Scholar]
- Li, H.; Zhou, Y.; Tu, W.; Ye, J.; Zou, Z. State-of-the-art progress in diverse heterostructured photocatalysts toward promoting photocatalytic performance. Adv. Funct. Mater. 2015, 25, 998–1013. [Google Scholar] [CrossRef]
- Fan, H.J.; Lu, C.S.; Lee, W.L.; Chiou, M.R.; Chen, C.C. Mechanistic pathways differences between P25-TiO2 and Pt-TiO2 mediated CV photodegradation. J. Hazard. Mater. 2011, 185, 227–235. [Google Scholar] [CrossRef] [PubMed]
- He, W.; Jia, H.; Wamer, W.G.; Zheng, Z.; Li, P.; Callahan, J.H.; Yin, J.-J. Predicting and identifying reactive oxygen species and electrons for photocatalytic metal sulfide micro–nano structures. J. Catal. 2014, 320, 97–105. [Google Scholar] [CrossRef]
- Wang, Y.; Huang, H.; Zhang, Z.; Wang, C.; Yang, Y.; Li, Q.; Xu, D. Lead-free perovskite Cs2AgBiBr6@g-C3N4 Z-scheme system for improving CH4 production in photocatalytic CO2 reduction. Appl. Catal. B Environ. 2021, 282, 119570. [Google Scholar] [CrossRef]


Disclaimer/Publisher’s Note: The statements, opinions and data contained in all publications are solely those of the individual author(s) and contributor(s) and not of MDPI and/or the editor(s). MDPI and/or the editor(s) disclaim responsibility for any injury to people or property resulting from any ideas, methods, instructions or products referred to in the content. |
© 2023 by the authors. Licensee MDPI, Basel, Switzerland. This article is an open access article distributed under the terms and conditions of the Creative Commons Attribution (CC BY) license (https://creativecommons.org/licenses/by/4.0/).