Abstract
In this paper, the features of catalytic cracking of propane with a step-wise change in the composition of the catalyst from Pr2Zr2O7 to Yb2Zr2O7 were considered. For the research, samples of catalysts Pr2Zr2O7, (Pr0.75Yb0.25)2Zr2O7, (Pr0.5Yb0.5)2Zr2O7, (Pr0.25Yb0.75)2Zr2O7 and Yb2Zr2O7 were synthesized and analyzed. Analysis of the results from catalytic experiments showed that for the catalyst (Pr0.25Yb0.75)2Zr2O7, at a temperature of 700 °C, the conversion of propane reaches values of 100%, but for Yb2Zr2O7, this indicator decreases to 84%. The selectivity for ethylene is consistently reduced from 85% to 28% in several catalysts (Pr0.75Yb0.25)2Zr2O7 > Pr2Zr2O7 > (Pr0.5Yb0.5)2Zr2O7 >(Pr0.25Yb0.75)2Zr2O7 > Yb2Zr2O7. An increase in the number of surface adsorption centers leads to a predominant rupture of the C–C bond in the propane molecule with the formation of ethylene. When ytterbium ions are introduced into the catalyst, the amount of ethylene in the reaction products decreases, but the selectivity for propylene increases in the series Pr2Zr2O7 < (Pr0.75Yb0.25)2Zr2O7 < (Pr0.5Yb0.5)2Zr2O7 < Yb2Zr2O7 < (Pr0.25Yb0.75)2Zr2O7, which is associated with a decrease in the binding energy of carbon atoms in propane with the catalytic center during adsorption.
1. Introduction
Catalytic cracking of propane is one of the promising methods for obtaining “light” olefins (ethylene and propylene) [1,2,3]. For a more selective production of propylene, this process is carried out using industrial catalysts containing chromium oxides CrOx or platinum Pt and supported on an Al2O3 carrier. However, compounds containing chromium in their composition are highly toxic and endanger human health and the environment. Platinum-based catalysts are less dangerous and more promising for industrial use. However, the technology of using platinum-based catalysts for the synthesis of propylene has several disadvantages associated with their production. For example, to ensure high catalytic activity and propylene selectivity, it is necessary to obtain Pt particles of a certain size, as well as to use additional surface treatment to remove carbon deposits [4]. The high price of platinum is another disadvantage of these catalysts. Therefore, obtaining a catalyst based on the oxides of other metals using an inert, highly porous support is an urgent task. At the same time, the synthesized catalyst should have a lower cost compared to known materials and have high catalytic activity.
Currently, the most active catalysts of dehydrogenation processes are Pt-containing systems [5]. For example, UOP has developed the Oleflex process, in which propane dehydrogenation occurs in the presence of a catalyst, which is metallic platinum and tin deposited on inert aluminum oxide (Pt/Sn/Al2O3). The process is carried out in an adiabatic reactor with a moving catalyst layer at atmospheric pressure and a temperature of 580–650 °C. The addition of inert gas to the raw materials somewhat complicates the technology but contributes to an increase in the conversion of propane into the final reaction products. An example of an industrial process of propane dehydrogenation using catalysts, where chromium (III) oxide is used as an active component, is the “CATOFIN” process of ABB Lummus Crest/United Catalysts [6], as well as the “FBD” process of ABB Lummus Crest/United Catalysts [7,8]. The main disadvantage of such catalysts, as noted earlier, is the high toxicity of chromium (III) oxide and their short service life. A dehydrogenation catalyst is known, which is an aluminum oxide carrier modified with silicon oxide, on which the active component chromium oxide and the promoter potassium oxide are distributed [9]. The catalyst is used for the dehydrogenation of C4-C5 paraffin hydrocarbon and has high activity, selectivity and thermal stability. The disadvantages are the rapid deactivation of the catalyst and the presence of environmentally unsafe chromium compounds in its composition. A hydrocarbon dehydrogenation catalyst consists of platinum, tin and potassium deposited on theta modifications of aluminum oxide [10]. The disadvantage is a large amount of coke formed on aluminum oxide substrates.
It is known that coordinatively unsaturated Zr cations are active sites for the dehydrogenation of various hydrocarbons [11]. The use of pure zirconium dioxide as a catalyst is complicated by the fact that the monoclinic structure of this oxide, which has a high degree of crystallinity and a low specific surface area, is often used for these purposes [12]. Of greatest interest for catalysis are low-temperature metastable phases of ZrO2 (amorphous, cubic, tetragonal), characterized by high dispersion and a developed surface. The stabilization of such low-temperature phases of zirconium dioxide is promoted by the inclusion of various anions or cations in its structure. The propane catalytic cracking process is a set of chemical transformations that lead to the production of propylene, ethylene, hydrogen, methane, ethane, and other products (Equations (1)–(5)):
C3H8 ⇆ C3H6 + H2 (ΔH298 = 124.3 kJ/mol)
C3H8 ⟶ C2H4 + CH4 (ΔH298 = 98.9 kJ/mol)
C3H8 + H2 ⇆ C2H6 + CH4 (ΔH298 = −37.7 kJ/mol)
C2H4 + H2 ⇆ C2H6 (ΔH298 = −136.6 kJ/mol)
C3H8 ⇆ 3C + 4H2 (ΔH298 = 119.5 kJ/mol)
The most important reactions for producing propylene (Equation (1)) and ethylene (Equation (2)) are endothermic and proceed with an increase in the number of gas molecules. Therefore, an increase in the reaction temperature and a decrease in pressure contribute to higher conversions of propane into the final products. Indeed, the process of propane dehydrogenation at a pressure of 1 bar is usually carried out at a temperature of 550–750 °C. With a further increase in the process temperature, a simultaneous increase in the rate of the dehydrogenation reaction with the C–H bond cleavage (Equation (1)) and competitive reactions with C–C bond cleavage with the formation of ethylene and methane (Equation (2)) is observed. Therefore, the cracking conditions and the properties of the catalyst should affect the reduction in the proportion of side reactions and the increase in propylene selectivity.
It has been suggested that the coordination of unsaturated Zr and oxygen adjacent to the lattice participate in the dehydrogenation reaction. Yet, the promoter used to purposefully create unsaturated Zr increased the activity [13,14]. The presence of unsaturated Zr in the lattice of zirconium oxide ZrO2 lowers the activation barrier for the formation of hydrogen and propylene from propane (Equation (1)). The conditions of catalyst synthesis make it possible to influence the particle size of ZrO2 and its crystal structure while simultaneously controlling the number of unsaturated Zr [15,16]. The conditions of catalyst synthesis make it possible to influence the particle size of ZrO2 and its crystal structure while simultaneously controlling the number of unsaturated Zr [17,18]. In addition, doping of zirconium compounds and treatment of the material in a reducing agent are effective methods for obtaining unsaturated Zr. Rare-earth metal oxides can be used for doping.
However, despite the high activity achieved for some of the listed catalysts, their stability was often insufficient due to the leaching of the active component in an aggressive oxidizing water environment. The addition of lanthanides to catalytic systems or the creation of complex oxide oxides are among the most promising catalysts for cracking processes due to their high activity and stability in an aggressive environment [19,20]. That is why research is currently being conducted to study the possibility of using complex oxides in catalytic conversion processes. The reason catalytic versatility of such oxides—along with their high stability at a high temperature and in an aggressive environment—consists in the stabilization of transition metal cations at unusual degrees of oxidation, as well as in the high mobility of oxygen in the structure of pyrochlore.
Therefore, complex oxides of the composition Ln2Zr2O7 are significant as materials for the manufacture of catalysts for the dehydrogenation of hydrocarbons. They have high thermal stability, high ionic conductivity, and chemical resistance [21,22,23,24]. All zirconates of rare earth metals change their properties upon alloying due to the formation of defects in their structure [25,26]. The study of the catalytic properties of materials with a step-wise change in composition from Pr2Zr2O7 to Yb2Zr2O7 in the process of catalytic propane dehydrogenation can lead to very interesting and practically important results.
2. Results
2.1. Catalyst Characteristics
2.1.1. Catalyst Synthesis
Samples of rare earth element zirconates Ln2Zr2O7 (Ln = Pr, Yb) were synthesized by the well-known method [27,28] from ZrOCl2 and rare earth metal nitrates (Figure 1). To do this, solutions of the initial reagents were mixed at room temperature. A solution of ammonium hydroxide was added to the resulting solution at a pH = 9.0 ± 0.5. The resulting precipitate was filtered and dried at a temperature of 100 °C for 5 h. Then the synthesis was carried out at a temperature of 1000 °C for 3 h. Synthesized rare earth metal zirconate was analyzed and used as a catalyst for propane cracking.
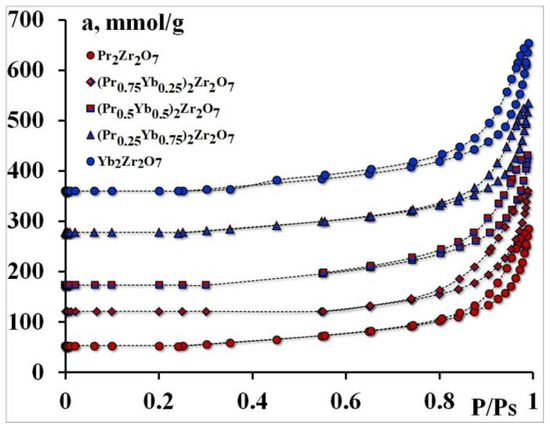
Figure 1.
Adsorption isotherms.
Inductively coupled plasma atomic emission spectroscopy (ICP-AES) was used to quantify the concentration of elements in all synthesized catalysts. ICP-AES measurements were carried out on a Vista-PRO spectrometer (Varian, Agilent Technologies Inc., Santa Clara, CA, USA) operating in a simultaneous mode. All selected spectral lines were free from interference. The background emission was compensated by preparing samples and calibration solutions under the same condition.
2.1.2. Catalyst Surface
In the work, the specific BET surface (SBET) of the samples, as well as the parameters of the porous structure (Table 1), are calculated.

Table 1.
Textural properties of Ln2Zr2O7 catalysts.
It can be seen from the table that the gradual substitution of ytterbium for praseodymium in the A position leads to an increase in the adsorption volume. The specific surface calculated by the BET method decreases.
All samples belong to low-porosity samples, and substitution in the A-position of the metal, both partial and complete, does not lead to a sharp change in the surface of the catalytic systems.
In a row Pr2Zr2O7 ≈ (Pr0.75Yb0.25)2Zr2O7 < (Pr0.5Yb0.5)2Zr2O7 < (Pr0.25Yb0.75)2Zr2O7 < Yb2Zr2O7 an increase in the characteristic energy from 17.7 to 34.7 kJ/mol is observed. The step-wise change of the metal leads to a decrease in the amount of substance adsorbed in monolayers attributable to the primary, most advantageous catalytic centers.
The textural properties of Ln2Zr2O7 catalysts were also analyzed using N2 (Figure 1) adsorption–desorption with isotherms and pore size distribution profiles.
At the same time, (Pr0.5Yb0.5)2Zr2O7, (Pr0.25Yb0.75)2Zr2O7, and Yb2Zr2O7 have much higher pore volumes than Pr2Zr2O7, (Pr0.75Yb0.25)2Zr2O7.
2.1.3. Catalytic Centers
It is known that the activity of catalysts is affected by the acid–base properties of their surface. During the research, a series of experiments were carried out to test the electron-withdrawing centers of the surface of the synthesized compounds (Figure 2). The efficiency of acid sites was determined from the rate of adsorption of pyridine molecules.
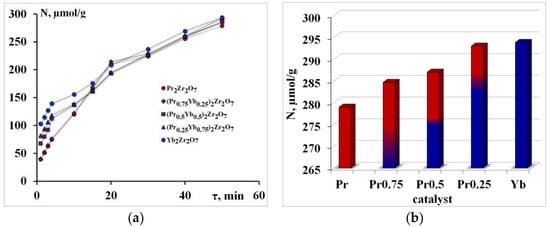
Figure 2.
Pyridine adsorption isotherms—(a), the number of electron-withdrawing centers—(b).
The initial section of these curved lines corresponds to adsorption on “strong” acids. The next section of the curve represents adsorption in the “weaker” adsorption centers. The slope tangent of the first section determines the rate of “fast” adsorption W1 in the adsorption centers of type 1, respectively; the slope tangents of the following sections of the curve determine the rate W2 (that is, “slow” adsorption) (Figure 2a).
The number of electron-withdrawing centers increases in the order Pr2Zr2O7 < (Pr0.75Yb0.25)2Zr2O7 < (Pr0.5Yb0.5)2Zr2O7 < (Pr0.25Yb0.75)2Zr2O7 < Yb2Zr2O7 (Figure 2b).
Primary adsorption centers (PACs) were identified to establish the preferred mechanism for the catalytic conversion of propane. The number of primary adsorption centers and the total number of oxygen-containing centers were determined by the adsorption of water from the gas phase (Figure 3).
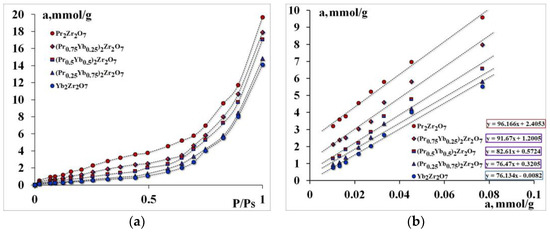
Figure 3.
Isotherms of Water adsorption—(a), comparative adsorption isotherms at low pressures—(b).
It was found that Pr2Zr2O7 has the highest absorption of water; substitution of a rare-earth metal cation in the A-position leads to a decrease in water capacity. The number of primary adsorption centers decreases from 96 mmol/g for Pr2Zr2O7 to 76 mmol/g for Yb2Zr2O7.
2.2. Catalytic Tests
Catalytic cracking of propane is a complex process that consists of several series-parallel reactions (Equations (1)–(5)). The selection of the process conditions and the catalyst makes it possible to shift the equilibrium towards the formation of ethylene or propylene.
It is known that during the thermal cracking of propane, the formation of products begins at a temperature above 700 °C with a further increase in temperature to 800 °C, and the conversion of propane reaches 20%. The main reaction products under these conditions are methane and ethane [25].
As a result of the studies, it was shown that when using catalysts based on synthesized REM zirconates, propane conversion also significantly depends on the cracking temperature. At a temperature of 700 °C, the propane conversion value increases in the series Pr2Zr2O7 ⤏ (Pr0.75Yb0.25)2Zr2O7 ⤏ (Pr0.5Yb0.5)2Zr2O7 ⤏ (Pr0.25Yb0.75)2Zr2O7. At the same time, to connect the composition (Pr0.25Yb0.75)2Zr2O7 under such temperature conditions, the maximum value of propane conversion is observed, which is about 100%, which sharply decreases to 84% when switching to unalloyed Yb2Zr2O7. The minimum value of propane conversion at a temperature of 700 °C was registered for the compound of the composition Pr2Zr2O7 (Figure 4). A further increase in the cracking temperature to 800 °C makes it possible to eliminate the observed differences in the propane conversion for all the studied catalysts except for Pr2Zr2O7. Thus, the step-wise composition change from Pr2Zr2O7 to Yb2Zr2O7 allows you to adjust the value of the degree of propane conversion depending on the cracking temperature. As a result of the analysis of the composition of the final products of cracking, it was shown that when using the studied catalysts, not only does the high values of propane conversion shift to lower temperatures, but also the selectivity for “light” olefins changes (Figure 5 and Figure 6).
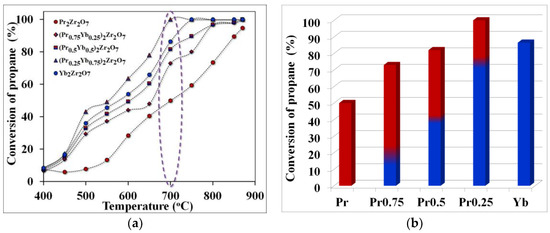
Figure 4.
Temperature dependence of propane conversion (purple highlights the temperature of optimal technological conditions)—(a), propane conversion rates at the optimum cracking temperature—(b).
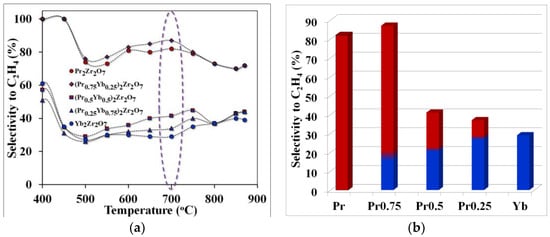
Figure 5.
Temperature dependence of selectivity for ethylene (purple highlights the temperature of optimal technological conditions)—(a), selectivity for ethylene at the optimum cracking temperature—(b).
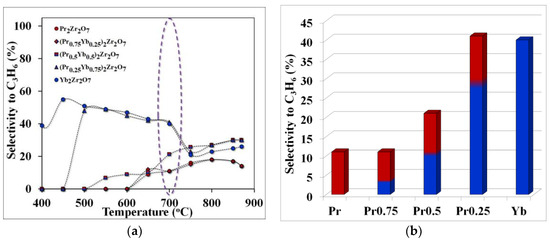
Figure 6.
Temperature dependence of selectivity for propylene (purple highlights the temperature of optimal technological conditions)—(a), selectivity for propylene at the optimum cracking temperature—(b).
The observed effect can be explained by comparing the values of selectivity for ethylene and propylene in the considered temperature range. For example, the maximum yield of ethylene was obtained using the catalyst (Pr0.75Yb0.25)2Zr2O7 or when the selectivity value for ethylene, at a temperature of 700 °C, was 86%. When replacing praseodymium with ytterbium in the series Pr2Zr2O7 ⤏ (Pr0.75Yb0.25)2Zr2O7 ⤏ (Pr0.5Yb0.5)2Zr2O7 ⤏ (Pr0.25Yb0.75)2Zr2O7 ⤏ Yb2Zr2O7, the ethylene yield decreases significantly (Figure 6) and the propylene selectivity value increases (Figure 5).
Thus, a step-wise change in the composition of the catalyst in the direction of increasing the ytterbium content in the series Pr2Zr2O7 ⤏ (Pr0.75Yb0.25)2Zr2O7 ⤏ (Pr0.5Yb0.5)2Zr2O7 ⤏ (Pr0.25Yb0.75)2Zr2O7 ⤏ Yb2Zr2O7 changes the direction of the process toward the formation of propylene by accelerating the propane dehydrogenation reaction. The maximum propylene selectivity value of 40% is observed for (Pr0.25Yb0.75)2Zr2O7, and the transition to the non-ligated compound Yb2Zr2O7 leads to a slight decrease in this indicator to 38%.
After cracking at a temperature of 700 °C for 72 h, no change in activity was observed for all the studied catalysts. Table 2 shows the correlation between the decrease in activation energy and the value of the increase in the TOF value.
Table 2.
Catalytic characteristics of complex oxide systems in the process of propane cracking.
On the positive side, the TOF value tends to increase with the conversion rate, which makes it possible to design catalytic systems that are more productive and efficient with existing industrial catalysts.
Studies have shown that during the operation of the catalyst, the accumulation of carbon on its surface is negligible. Table 2 shows the results from calculating the carbon balance of the process, which shows the presence of minor deviations. The increase in carbon deposition increases in the series Pr2Zr2O7 < (Pr0.75Yb0.25)2Zr2O7 < (Pr0.5Yb0.5)2Zr2O7 < (Pr0.25Yb0.75)2Zr2O7 ≈ Yb2Zr2O7. These data correlate with catalytic activities, where the highest activity contributes to a greater accumulation of carbon on the catalyst surface.
The regeneration of catalytic systems occurs with airflow at 400 °C for 10 h. The amount of remaining carbon does not exceed 2 wt.% and does not affect the catalytic activity of these systems.
3. Discussion
An analysis of the results of catalytic experiments showed that the selectivity of ethylene with the used synthesized catalysts is not sensitive to cracking temperatures. As shown in Figure 5, the C2H4 selectivity achieved on the catalysts follows the sequence (Pr0.75Yb0.25)2Zr2O7 > Pr2Zr2O7 > (Pr0.5Yb0.5)2Zr2O7 >(Pr0.25Yb0.75)2Zr2O7 > Yb2Zr2O7. Among all catalysts, Pr2Zr2O7 demonstrates the best characteristics associated with high selectivity for C2H4 (about 86%) at a temperature of 700 °C. At the same time, propane conversion was 48%. The catalyst (Pr0.25Yb0.75)2Zr2O7 showed the highest conversion of propane into reaction products at this temperature. This fact indicates that the change in the specific surface area of catalytic systems does not make a decisive contribution to the process of catalytic cracking of propane (Figure 7a). Of considerable interest is the establishment of the relationship between the structure and catalytic properties of compounds with a step-wise change in their composition in the series Pr2Zr2O7 ⤏ (Pr0.75Yb0.25)2Zr2O7 ⤏ (Pr0.5Yb0.5)2Zr2O7 ⤏ (Pr0.25Yb0.75)2Zr2O7 ⤏ Yb2Zr2O7 with a fixed Zr4+ center in the B-position and various centers of rare-earth elements in the A-position.
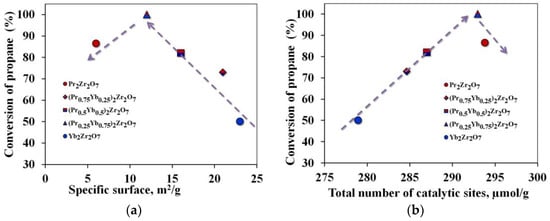
Figure 7.
Propane conversion rates depending on: (a)—specific surface area, (b)—number of electron-withdrawing centers.
It is known that compounds of the A2B2O7 type have high thermal stability, intrinsic oxygen vacancies 8a, and the presence of acid–base sites, which meets the requirements for promising materials for use as propane cracking catalysts. A detailed analysis of the properties of these materials makes it possible to determine the correlations between the presence of active electrophilic oxygen and acid–base centers in the material under study and its catalytic activity. The conducted studies on the adsorption of pyridine show a clear influence of the number of acid centers on the degree of conversion of propane (Figure 7b). According to Hund’s rule, electron shells are stable when they are empty, full, or half full.
When studying the properties of the surface, all synthesized compounds of the Ln2Zr2O7 series showed the presence of a combined variant of isotherms of types IV–V with a hysteresis loop of type H2. This fact points to close textural characteristics of the investigated samples of materials. However, the results of the quantitative determination of the specific surface area show that its decrease is observed in the series Pr2Zr2O7 > (Pr0.75Yb0.25)2Zr2O7 > (Pr0.5Yb0.5)2Zr2O7 > (Pr0.25Yb0.75)2Zr2O7 ≈ Yb2Zr2O7. In this case, (Pr0.5Yb0.5)2Zr2O7, (Pr0.25Yb0.75)2Zr2O7, and Yb2Zr2O7 have much higher pore volumes than Pr2Zr2O7, (Pr0.75Yb0.25)2Zr2O7. A decrease in the ratio rA/rB or a decrease in the unit cell volume in the crystal structure in the series Pr2Zr2O7 > (Pr0.75Yb0.25)2Zr2O7 > (Pr0.5Yb0.5)2Zr2O7 > (Pr0.25Yb0.75)2Zr2O7 > Yb2Zr2O7 leads to a change in the position reflections for Ln2Zr2O7 towards larger angles 2θ. This is described in detail in Article [28], which studies our catalytic systems. This indicates the presence of the effect of compression of the unit cell caused by a decrease in the cation radii in the A-position.
The regions are characterized by the presence of a gradually filling shell 4f, located under a layer of outer shells 5s, 5p, and 6s. In general, the electronic configuration of lanthanides can be written as follows: [Xe](4fn)(5dx)(6s2). Valence electrons are 6s24f, the separation of which corresponds to the formation of ions in the state of charge +3, that is, TR3+. According to Hund rule a, electronic enclosures are stable when they are empty, full, or half full. Pr3+ has two more electrons (4f2) than required for stable electronic configurations, and Yb3+ has one electron less (4f13) than required for a stable electronic configuration. A sequential increase in the number of electrons at the 4f level increases the acidity of compounds containing REM.
Regarding the selectivity of ethylene, the opposite is observed. This pattern is in good agreement with the presence of available surface oxygen. Surface oxygen properties associated with intrinsic oxygen vacancies 8a.
The general formula Ln23+Zr24+O6O’ can be described as a defective solid solution of fluorite, in which cations form a face-centered cubic matrix, and one-eighth of the anions is unoccupied, which ensures charge neutrality. From this point of view, five unique crystallographic positions (Wyckoff symbols) are available: 16d for Ln cations, 16c for Zr cations, 48f for O and 8b (3/8, 3/8, 3/8) are stable and tetrahedrally coordinated cations Ln, for O’, and eight positions a (1/8, 1/8, 1/8) are free and shifted towards the neighboring empty eight a-sites and are associated with two Ln cations and two Zr cations.
The Ln–O and Zr–O bonds have a strong covalent character, and the calculated overlap populations are positive. The Ln–O bonds are divided into O8b–Ln and O48f–Ln, whereas for Zr–O, only one type of bond, O8b–Zr, is characteristic. A decrease in the lengths of the O–Ln bonds in the series Pr2Zr2O7 > (Yb2Zr2O7) is mainly due to the contraction of the 4f shell. These changes entail changes in the mechanisms of the catalytic conversion of propane. Since the distances between the catalytic centers change, the interatomic interactions between atoms decrease in the sequence OO’ < OO < Ln–O < Zr–O. This leads to the appearance of various types of defects (Figure 8), and this means the appearance of additional catalytic sites.
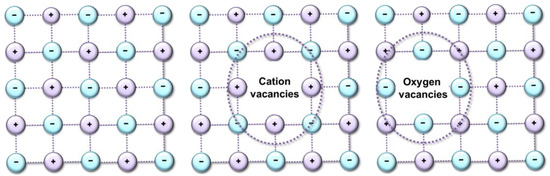
Figure 8.
Scheme of formation of type of defects.
Due to the deformations of the crystal structure that occur during a step-wise change in the samples’ composition, the geometric dimensions of the propane adsorption site, and the properties of the catalyst surface, change and the process of breaking the C–C bond is replaced by breaking the C–H bond. Crystal lattice distortions are the result of the replacement of Pr ions by Yb, and oxygen vacancies are not formed in this case. This result corresponds to a change in the reactivity of this series of catalysts in reactions proceeding according to the dehydrogenation mechanism C3H8 ⇆ C3H6 + H2. However, if all changes in the catalytic activity of the synthesized catalysts are associated with a change in the geometric dimensions of the crystal lattice, then a single dependence of the selectivity of “light” olefins on the number of primary adsorption centers should be observed. However, when passing to the Yb2Zr2O7 compound, this dependence is disrupted (Figure 9). In this case, the shape of the dependence of propane conversion on the number of catalytic sites of the catalyst (Figure 7a) repeats the shape of the dependence of ethylene selectivity on the number of primary adsorption centers (Figure 9a).
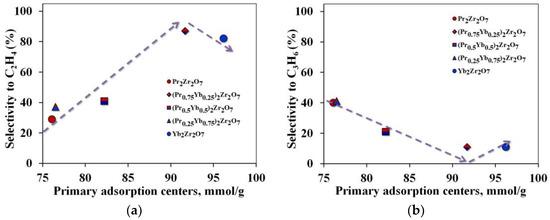
Figure 9.
Dependence of selectivity for target products on the number of primary adsorption centers (a)—for ethylene, (b)—for propylene.
It is reasonable to believe that the amount of surfactant oxygen sites may be an important factor in controlling the direction of the reaction to form ethylene. Depending on the surface concentration of PAC, the adsorption of propane molecules will be completed with the formation of either isolated clusters in equilibrium with saturated steam or a continuous adsorption layer in the form of a film on the catalyst surface.
In the first case, the distance between the PACs must be greater than the limiting size of the propane cluster on the surface. In the second case, the minimum distance between PACs (lmin) should be less than the limiting size of clusters. The distance between PACs was calculated, assuming their uniform distribution over the catalyst surface. Based on the results of our calculations, a continuous adsorption layer is not formed on the surface since the distance between PACs is greater than 5 nm, which exceeds the limiting value. Such a distribution of PAC makes the C–C bond less strong during the adsorption of a propane molecule, which leads to the formation of predominantly ethylene.
Another important influence is exerted by the interaction strength of the propane molecule with the catalytic site, which depends on the value of the characteristic adsorption energy (Figure 10).
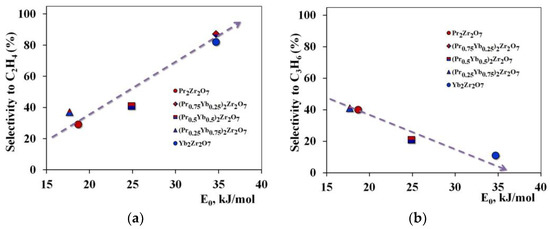
Figure 10.
Dependence of selectivity for target products on the strength of the interaction of the reactant with the catalytic center (a)—for ethylene, (b)—for propylene.
The decrease in selectivity for ethylene and the increase in the amount of propylene in the reaction products observed in the series of propane cracking Pr2Zr2O7 ⤏ (Pr0.75Yb0.25)2Zr2O7 ⤏ (Pr0.5Yb0.5)2Zr2O7 ⤏ (Pr0.25Yb0.75)2Zr2O7 ⤏ Yb2Zr2O7 catalysts are associated with an increase in the interaction of propane carbon atoms with catalytic sites.
4. Materials and Methods
4.1. Synthesis Details
In the first stage, an ammonia solution was added to a solution of a mixture of Ln(NO3)3 and ZrOCl2 salts (atomic ratio Ln:Zr = 1:1) with vigorous stirring. The resulting suspensions (pH = 9.0 ± 0.5) were filtered, and the precipitates were washed and dried at 100 °C. This technique provides the most uniform distribution of cations over the volume of precursor particles. The details of the synthesis procedure are described in [27]. In the second stage, a sample of powders was prepared from each type of the synthesized precursor by isothermal annealing in air for 6 h at a temperature of 1000 °C.
4.2. Physical Characteristics of Catalyst
4.2.1. X-ray Diffraction
The X-ray diffraction (XRD) of the Ln2O3 e ZrO2 powder samples annealed at various temperatures was carried out using a Rigaku MiniFlex 600 diffractometer (CuKa-radiation, Tokyo, Japan). The patterns were recorded at room temperature in the Bragg–Brentano reflection geometry for 2Θ = 10°–110° using a step angle of 0.05°, with an exposure time of 3 sec. per step [28].
4.2.2. Specific Surface Area
The parameters of the porous structure of the samples were determined from nitrogen vapor adsorption isotherms at 77 K, measured on an ASAP 2020-MR Micromeritics, Norcross, GA, USA, automatic high-vacuum setup in the relative pressure range from 0.001 to 0.98. The samples were preliminarily evacuated to a residual vacuum of less than 10–7 mmHg at 400 °C.
To do this, when processing experimental data, the BET Equation:
To determine the porosity of the sample, the model proposed by Barrett, Joyner, and Halenda (BJH) was used, which allows you to calculate the pore volume and plot the pore size distribution. The calculation was made according to the Equation:
In this formula, w is the pore volume (cm3/g), rmn—pore radius (nm), rpn—adsorbate molecule radius (nm), V—adsorbate volume (cm3/g), t—adsorption layer thickness, and ACj—empty pore area.
4.2.3. Analysis of Catalytic Sites
Comparative evaluation of the number of primary adsorption centers of the samples obtained. Water adsorption isotherms were measured at 293 K on a vacuum weighing unit with McBain quartz spring balances with a sensitivity of 10 μg with a weight of up to 100 mg.
The determination of acid sites was controlled by UV absorption spectra of catalytic systems of pyridine molecules. The concentration was determined using a single-beam scanning spectrophotometer Agilent Cary 60 UV-Vis (Santa Clara, CA, USA).
The formula by which the Gibbs adsorption was determined (g × mol/g):
where V is the volume of the solution (4 mL); m is the mass of the sample (0.01 g); D0 and D—optical density at the absorption maximum Py (Bac) before and during adsorption; l is the cell thickness (1 cm); ε—molar absorption coefficient (extinction, εPy = 2 × 10⁶ L/(mol·cm), εBac = 1 × 10⁴ L/(mol·cm)).
The analytical absorption bands λmax(Bac) = 230 nm and λmax(Py) = 253 nm did not change in the presence of the adsorbent.
4.3. Catalytic Studies
Catalytic cracking of propane was carried out in a temperature range of 100–900 °C with a step of 50 °C on a bench-top unit with a flow reactor. The reaction was monitored at each temperature point using a Kristall 5000M chromatograph (Yoshkar-Ola, Russia) equipped with a flame ionization detector and a thermal conductivity detector.
The calculation of the atomic rate of formation of the main components (value w) is performed according to the Equation:
where K is the correction factor of the detector sensitivity to analytes; wout—is the rate of exit of the reaction mixture, referred to as the mass of the catalyst µmol/(g·s); s—is the area of the chromatographic peak; Vsample is the volume of the injected mixture.
Selectivity for each component is calculated by the formula:
where ai is the number of carbon atoms in the product (i), nx is the molar flow of product (i) at the reactor outlet, nin and nres are the molar flow of C3H8 at the inlet to the reactor and the molar flow of C3H8 at the outlet of the reactor.
The degree of propane conversion was determined when the steady state was reached by the amount of propane that reacted:
Since the number of active centers is not known for certain, the surface turnover frequency (TOFsurf) was calculated; the number of catalytic conversion events per unit time per unit surface was measured by nitrogen adsorption by the BET method.
the number of reacted propane molecules on the catalyst surface per unit of time.
The carbon balance (“carbon balance”, %), which makes it possible to estimate the proportion of formed amorphous carbon involved in the process of surface deactivation, was calculated by the formula:
Using the dependence of the reaction rate on temperature:
where Ea is the observed activation energy of the process (kJ/mol).
5. Conclusions
In the course of the study, catalysts with a step-wise measurement of the composition of Pr2Zr2O7; (Pr0.75Yb0.25)2Zr2O7; (Pr0.5Yb0.5)2Zr2O7; (Pr0.25Yb0.75)2Zr2O7 and Yb2Zr2O7 for propane cracking were synthesized. Inductively coupled plasma atomic emission spectroscopy (ICP-AES) was used to quantify the concentration of elements in all synthesized catalysts. In order to estimate the number of primary adsorption centers of the obtained samples, water adsorption isotherms were measured at a temperature of 293 K. It is shown that an increase in the number of primary adsorption centers leads to the predominance of the destruction mechanism. The location of the catalytic centers becomes closer, which contributes to the alignment of the propane molecule with the localization of all carbon atoms on the surface and the breaking of the C–C bond. The formation of propylene decreases in the series Yb2Zr2O7 > (Pr0.25Yb0.75)2Zr2O7 > (Pr0.5Yb0.5)2Zr2O7 > (Pr0.75Yb0.25)2Zr2O7 ≈ Pr2Zr2O7 with an increase in the binding energy of the C-catalytic center. The parameters of the porous structure of the samples were determined by nitrogen vapor adsorption isotherms at 77 K, measured at the automatic high-vacuum installation ASAP 2020-MP Micromeritics, USA, in the range of relative pressures from 0.001 to 0.98. It was found that the change in the specific surface area does not significantly contribute to the catalytic activity and selectivity in the process of catalytic cracking of propane. Acid catalytic centers on the surface of the catalysts were determined by the method of pyridine adsorption. A clear effect of an increase in the number of acid centers on an increase in the degree of propane conversion has been established. Analysis of the results of catalytic experiments showed that for the catalyst (Pr0.25Yb0.75)2Zr2O7 at a temperature of 700 °C, the conversion of propane reaches a value of 100%, but for Yb2Zr2O7 this indicator decreases to 84%. The selectivity for ethylene is consistently reduced from 85% to 28% in several catalysts (Pr0.75Yb0.25)2Zr2O7 > Pr2Zr2O7 > (Pr0.5Yb0.5)2Zr2O7 > (Pr0.25Yb0.75)2Zr2O7 > Yb2Zr2O7. When ytterbium ions are introduced into the catalyst, the amount of ethylene in the reaction products decreases, but the selectivity for propylene increases in the series Pr2Zr2O7 < (Pr0.75Yb0.25)2Zr2O7 < (Pr0.5Yb0.5)2Zr2O7 < Yb2Zr2O7 < (Pr0.25Yb0.75)2Zr2O7, which is associated with a decrease in the binding energy of carbon atoms in propane with the catalytic center during adsorption and breaking of the C–H bond.
Author Contributions
Conceptualization and methodology, E.B.M. and A.G.C.; investigation, E.B.M. and S.S.S.; data curation, E.B.M. and T.F.S.; writing—original draft, E.B.M. and S.S.S. and T.A.K.; writing—review and editing, E.B.M. and A.G.C. and T.F.S.; supervision, A.G.C.; project administration, A.G.C. All authors have read and agreed to the published version of the manuscript.
Funding
This publication has been supported by the RUDN University Scientific Projects Grant System, project No. 021521-2-174.
Data Availability Statement
The original data are available from E.B.M. and T.F.S.
Acknowledgments
The authors are also grateful to Popov V.V. for X-ray diffraction studies.
Conflicts of Interest
The authors declare no conflict of interest. The funders played no role in the design of the study; in the collection, analysis, or interpretation of data; in the writing of the manuscript or in the decision to publish the results.
References
- McFarland, E. Unconventional Chemistry for Unconventional Natural Gas. Science 2012, 338, 340–342. [Google Scholar] [CrossRef] [PubMed]
- Tang, P.; Zhu, Q.; Wu, Z.; Ma, D. Methane activation: The past and future. Energy Environ. Sci. 2014, 7, 2580–2591. [Google Scholar] [CrossRef]
- Caspary, K.J.; Gehrke, H.; Heinritz-Adrian, M.; Schwefer, M. Dehydrogenation of alkanes. In Handbook of Heterogeneous Catalysis; Wiley-VCH: Weinheim, Germany, 2008; pp. 3206–3228. [Google Scholar] [CrossRef]
- Sattler, J.J.H.B.; Ruiz-Martinez, J.; Santillan-Jimenez, E.; Weckhuysen, B.M. Catalytic Dehydrogenation of Light Alkanes on Metals and Metal Oxides. Chem. Rev. 2014, 114, 10613–10653. [Google Scholar] [CrossRef]
- Mian, M.I.; Heinritz-Adrian, M.; Wenzel, S.; Knoll, O.; Schwefer, M.; Gercke, H. Method for Dehydrogenation of Alkanes and Catalysts. International Patent Application EA023151B1, 29 April 2016. [Google Scholar]
- Ponomarev, A.B.; Smirnov, A.V.; Shostakovsky, M.V.; Pisarenko, E.V. Propane Dehydration Catalyst and Its Method for Producing Propylene Using. International Patent Application RU2751701C1, 15 July 2021. [Google Scholar]
- Sami, A.I. The British Petroleum Co. PLC Barry, Dehydrogenation Process and Catalyst. International Patent Application EP0212850A1, 4 March 1987. [Google Scholar]
- Alerasul, S.; Harold, E. Manning, Paraffin Dehydrogenation Catalyst. U.S. Patent Application US7012038B2, 12 June 2002. [Google Scholar]
- Busygin, V.M.; Nesterov, O.N.; Gilmanov, K.K.; Romanov, V.G.; Lamberov, A.A.; Egorova, S.R.; Bekmukhamedov, G.E. Catalyst for Dehydrogenation of Paraffin Hydrocarbons C4–C5. International Patent Application RU 2538960C1, 10 January 2015. [Google Scholar]
- Voskoboynikov, T.V.; Daniel, H.; Wei, J.W.; Sachtler, A.; Vora, B.V. Composition of a Dehydrogenation Catalyst. U.S. Patent Application US 6756340B2, 29 June 2004. [Google Scholar]
- Solinas, V.; Rombi, E.; Ferino, I.; Cutrufello, M.G.; Colon, G.; Navio, J.A. Preparation, characterization and activity of CeO2–ZrO2 catalysts for alcohol dehydration. J. Mol. Catal. 2003, 204–205, 629–635. [Google Scholar] [CrossRef]
- Wang, G.; Zhu, X.; Li, C. Recent Progress in Commercial and Novel Catalysts for Catalytic Dehydrogenation of Light Alkanes. Chem. Rec. 2020, 20, 604–616. [Google Scholar] [CrossRef]
- Chen, S.; Chang, X.; Sun, G.; Zhang, T. Propane dehydrogenation: Catalyst development, new chemistry, and emerging technologies. Chem. Soc. Rev. 2021, 50, 3315–3354. [Google Scholar] [CrossRef]
- Otroshchenko, T.; Sokolov, S.; Stoyanova, M.; Kondratenko, V.A.; Rodemerck, U.; Linke, D.; Kondratenko, E.V. ZrO2-Based Alternatives to Conventional Propane Dehydrogenation Catalysts: Active Sites, Design, and Performance. Angew. Chem. 2015, 54, 15880–15883. [Google Scholar] [CrossRef] [PubMed]
- Otroshchenko, T.; Kondratenko, V.A.; Rodemerck, U.; Linke, D.; Kondratenko, E.V. ZrO2-based unconventional catalysts for non-oxidative propane dehydrogenation: Factors determining catalytic activity. J. Catal. 2017, 348, 282–290. [Google Scholar] [CrossRef]
- Zhang, Y.; Zhao, Y.; Otroshchenko, T.; Lund, H.; Pohl, M.M.; Rodemerck, U.; Linke, D.; Jiao, H.; Jiang, G.; Kondratenko, E.V. Control of coordinatively unsaturated Zr sites in ZrO2 for efficient C–H bond activation. Nat. Commun. 2018, 9, 3794. [Google Scholar] [CrossRef] [PubMed]
- Zhang, Y.; Zhao, Y.; Otroshchenko, T.; Han, S.; Lund, H.; Rodemerck, U.; Linke, D.; Jiao, H.; Jiang, G.; Kondratenko, E.V. The effect of ZrO2 crystallinity in CrZrOx/SiO2 on non-oxidative propane dehydrogenation. J. Catal. 2019, 371, 313–324. [Google Scholar] [CrossRef]
- Kuznetsova, T.G.; Sadykov, V.; Lunin, V. Nanocomposite structure and reactivity of perovskites based on lanthanum manganites. J. Phys. Chem. A 2012, 86, 606–620. [Google Scholar] [CrossRef]
- Bazhenov, A.S.; Kauppinen, M.M.; Honkala, K.; Phys, J. DFT Prediction of Enhanced Reducibility of Monoclinic Zirconia upon Rhodium Deposition. J. Phys. Chem. C 2018, 122, 6774–6778. [Google Scholar] [CrossRef] [PubMed]
- Zhang, Y.; Zhao, Y.; Otroshchenko, T.; Perechodjuk, A.; Kondratenko, V.A.; Bartling, S.; Rodemerck, U.; Linke, D.; Jiao, H.; Jiang, G.; et al. Structure–Activity–Selectivity Relationships in Propane Dehydrogenation over Rh/ZrO2 Catalysts. ACS Catal. 2020, 10, 6377–6388. [Google Scholar] [CrossRef]
- Ma, L.; Ma, W.; Sun, X.; Liu, J.; Ji, L.; Song, H. Structure properties and sintering densification of Gd2Zr2O7 nanoparticles prepared via different acid combustion methods. J. Rare Earths 2015, 33, 195–201. [Google Scholar] [CrossRef]
- Zhou, H.; Yi, D. Effect of rare earth doping on thermo-physical properties of lanthanum zirconate ceramic for thermal barrier coatings. J. Rare Earths 2008, 26, 770–774. [Google Scholar] [CrossRef]
- Cao, X.; Vassen, R.; Jungen, W.; Schwartz, S.; Tietz, F.; Stöver, D. Thermal stability of lanthanum zirconate plasma-sprayed coating. J. Am. Ceram. Soc. 2001, 84, 2086–2090. [Google Scholar] [CrossRef]
- Cao, X.; Vassen, R.; Stoever, D. Ceramic materials for thermal barrier coatings. J. Eur. Ceram. Soc. 2004, 24, 1–10. [Google Scholar] [CrossRef]
- Markova, E.B.; Lyadov, A.S.; Kurilkin, V.V. Features of propane conversion in the presence of SmVO3 and SmVO4. J. Phys. Chem. A. 2016, 90, 1754–1759. [Google Scholar] [CrossRef]
- Feng, J.; Xiao, B.; Wan, C.L.; Qu, Z.X.; Huang, Z.C.; Chen, J.C.; Zhou, R.; Pan, W. Electronic structure, mechanical properties and thermal conductivity of Ln2Zr2O7 (Ln = La, Pr, Nd, Sm, Eu and Gd) pyrochlore. Acta Mater. 2011, 59, 1742–1760. [Google Scholar] [CrossRef]
- Popov, V.V.; Menushenkov, A.P.; Ivanov, A.A.; Gaynanov, B.R.; Yastrebtsev, A.A.; D’Acapito, F.; Puri, A.; Castro, G.R.; Shchetinin, I.V.; Zheleznyi, M.V.; et al. Comparative analysis of long- and short-range structures features in titanates Ln2Ti2O7 and zirconates Ln2Zr2O7 (Ln = Gd, Tb, Dy) upon the crystallization process. J. Phys. Chem. Solids 2019, 130, 144–153. [Google Scholar] [CrossRef]
- Yastrebtsev, A.A.; Popov, V.V.; Menushenkov, A.P.; Beskrovnyi, A.I.; Neov, D.S.; Shchetinin, I.V.; Ponkratov, K.V. Comparative neutron and X-ray diffraction analysis of anionic and cationic ordering in rare-earth zirconates (Ln = La, Nd, Tb, Yb, Y). J. Alloy. Compd. 2020, 832, 154863. [Google Scholar] [CrossRef]


Disclaimer/Publisher’s Note: The statements, opinions and data contained in all publications are solely those of the individual author(s) and contributor(s) and not of MDPI and/or the editor(s). MDPI and/or the editor(s) disclaim responsibility for any injury to people or property resulting from any ideas, methods, instructions or products referred to in the content. |
© 2023 by the authors. Licensee MDPI, Basel, Switzerland. This article is an open access article distributed under the terms and conditions of the Creative Commons Attribution (CC BY) license (https://creativecommons.org/licenses/by/4.0/).