2.1. N2 Physisorption
N
2 physisorption was carried out to estimate the pore structure of the synthesized metal oxide catalyst systems. Information on the textural parameters of the γ-Al
2O
3 support after the deposition of the components is listed in
Table 1.
γ-Al
2O
3 is a typical mesoporous support with a sorption isotherm of type IV and a passing hysteresis loop of the H2 type related to an interconnected network of pores of different sizes and shapes [
19,
20]. This type of isotherm was preserved after the consecutive deposition of Re, Co, Mo, and K components (
Figure S1). Adsorption isotherms, being identical in shape and position for both groups of samples, namely CoRe and K-CoRe, and Mo-containing CoReMo and K-CoReMo, were the first indication and a definite proof that they have the same structure and component dispersion on the γ-Al
2O
3 support after the multistep exact soaking impregnation.
The specific surface area (SBET) of the γ-Al2O3 support decreased by 22% for CoRe and 23% for CoReMo after the component deposition. After potassium addition, the changes were also interesting: namely, the specific surface area of K-CoRe decreased by 8% compared to that of CoRe, while that of K-CoReMo was diminished by 10% relative to that of CoReMo. A logical reason for this is the presence of molybdenum and the formation of other structures. The total pore volume (Vtot) was also the same for all the compositions.
The constant C in the BET equation is a fundamental parameter in the analysis of adsorption isotherms, which provides information on the magnitude of the adsorbent–adsorbate interaction strength on the surface of solids. Compared to γ-Al2O3, the C values for CoRe and K-CoRe were lower: 106 and 105, respectively. However, with CoReMo, this value increased from 138 to 148, and after K insertion, it decreased to 130.
Changes in the polarity of the surface may affect the interaction between a quadrupole N
2 molecule and a surface, which leads to changes in the value of the parameter C. For mesoporous materials with a type IV isotherm, this value is in the interval of 20 < C < 200 [
21,
22]. An increased value of the C parameter in CoReMo was associated with the presence of molybdenum, which apparently contributed to an increase in the surface polarity. Compared to CoRe and K-CoRe, the higher surface polarity due to the half replacement of Re by Mo in the CoReMo and K-CoReMo samples was due to the increased abundance of oxygen structures on the surface of the O
2− and OH
− species from newly formed molybdenum oxide structures.
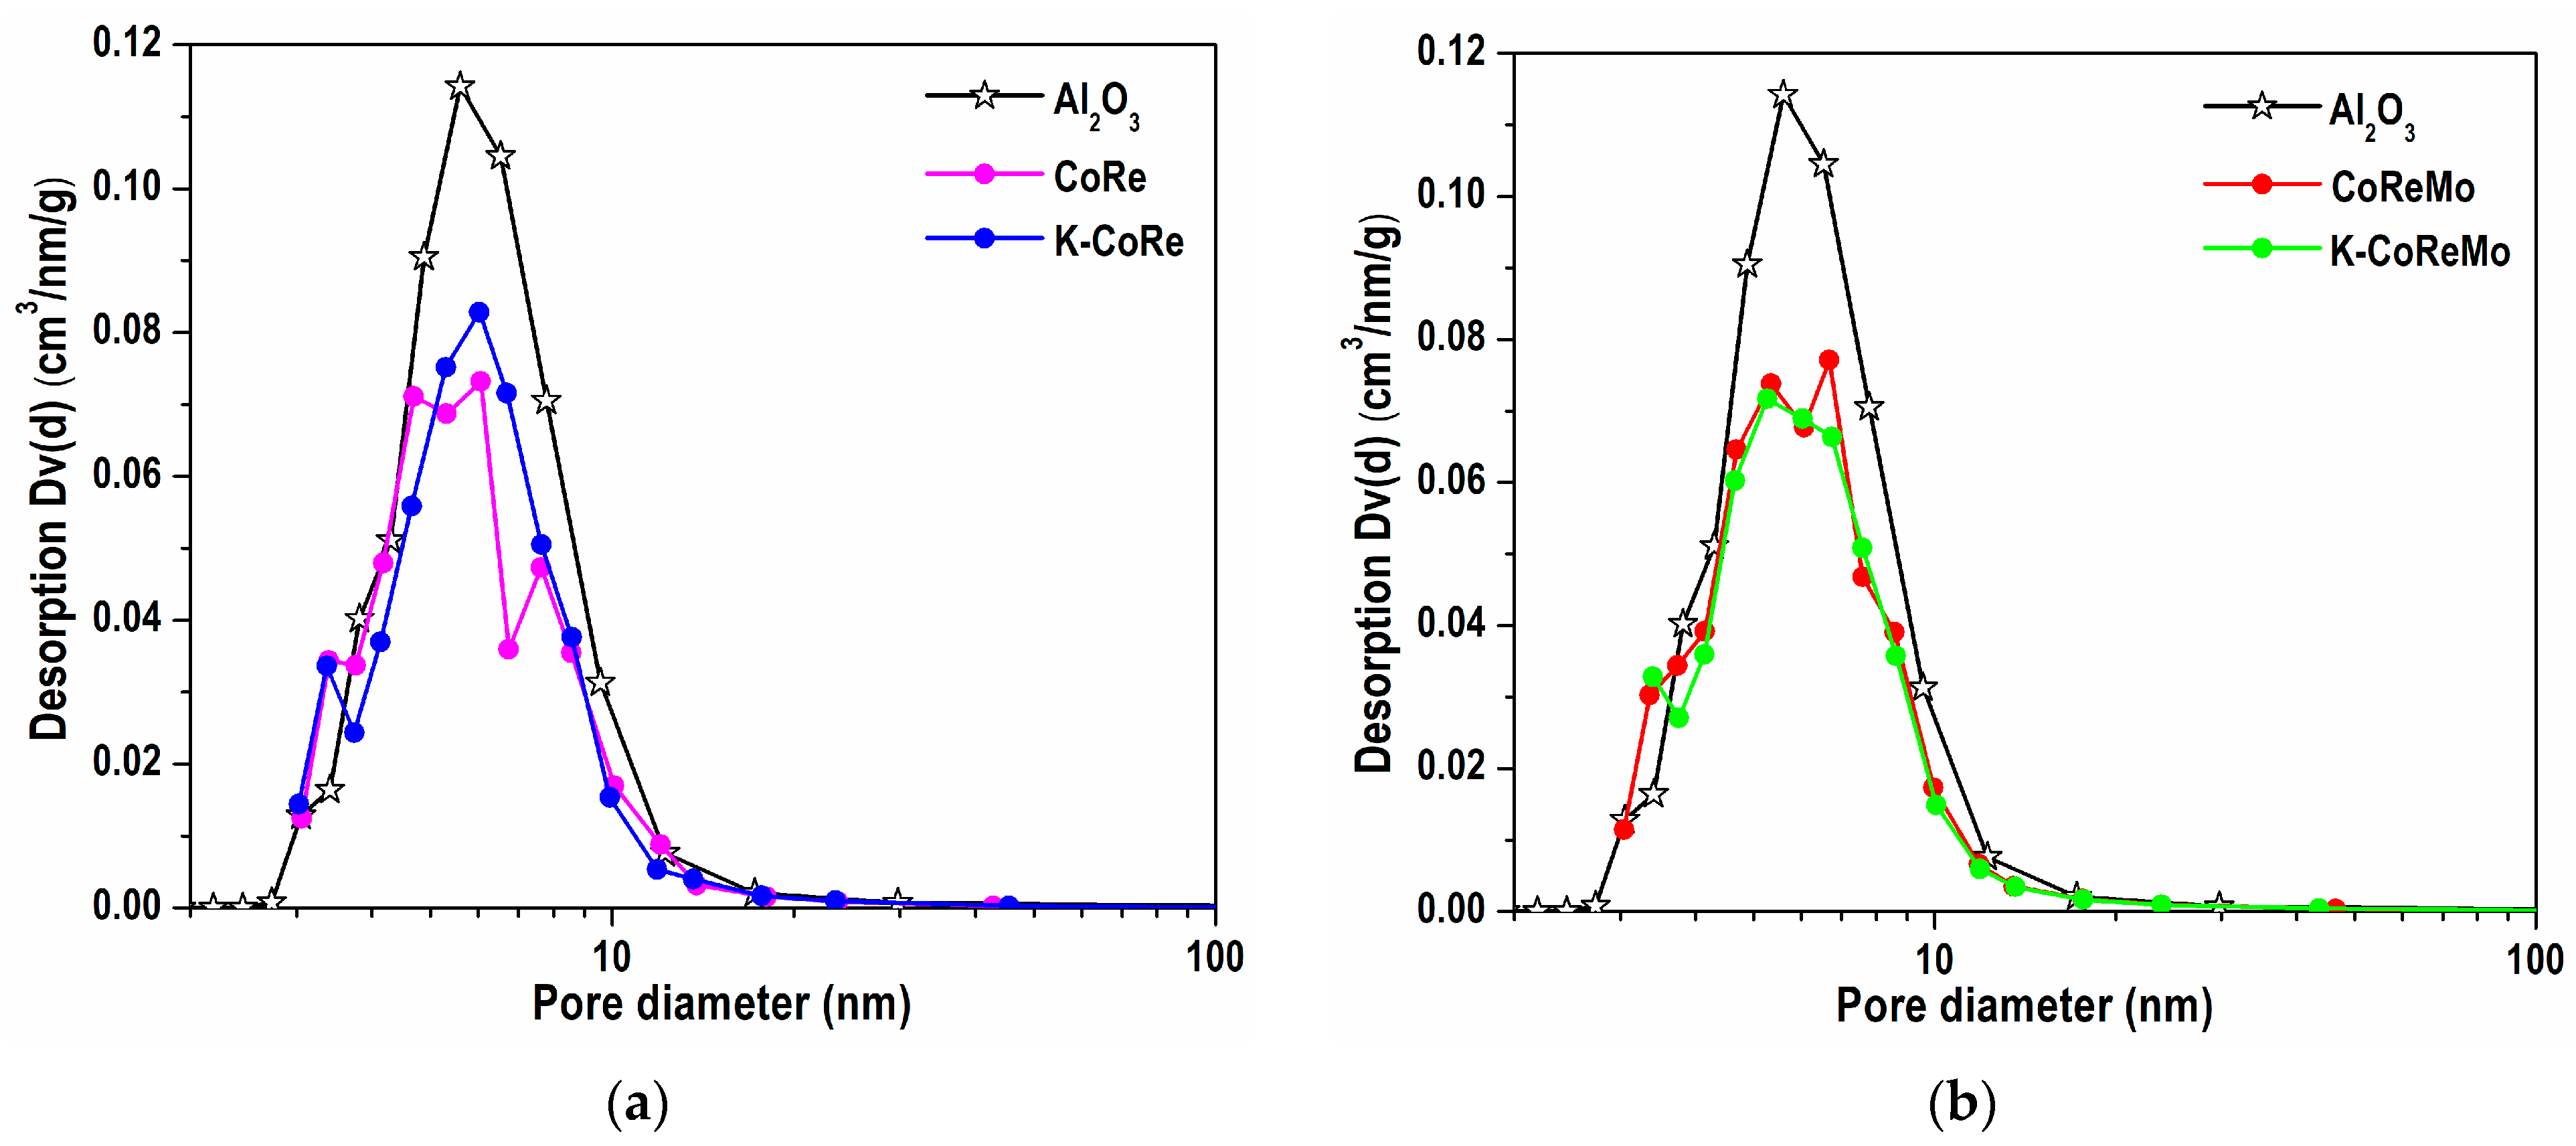
The pore size distribution (PSD) of the mesopores was also evaluated. The γ-Al
2O
3 support possessed a uniform character of pore distribution in the range of 3–20 nm, which transforms to a poly-dispersed character for metal oxide samples (
Figure 1).
The pore filling/blocking of γ-Al2O3 for the calcined CoRe and CoReMo samples was observed in the range of 4.5–12 and 3.7–17 nm, respectively. Potassium deposition (K-CoRe and K-CoReMo) caused a weak redistribution, being more pronounced with K-CoRe.
The distribution pattern was the same for the four samples and showed a homogeneous uniform allocation of the oxide species after component impregnation and subsequent temperature treatment (calcination) following each impregnation step of the matching component.
Summarizing, the metal oxide catalysts prepared via multistep ES impregnation possess analogous pore structures.
Structural information about the formed metal oxide species was provided by a volumetric analysis through powder X-ray diffraction and with a surface analysis via UV-Vis diffuse reflectance spectroscopy.
2.2. PXRD Analysis
The phase composition was analyzed after the calcination treatment. The PXRD patterns of all the samples are presented in
Figure 2a,b. The pattern of the bare γ-Al
2O
3 support is also shown (
Figure 2a).
The recorded PXRD patterns of the CoRe and CoReMo samples (
Figure 2a) display reflections that could be attributed to a cubic Al
2O
3 phase (ICDD PDF file 00-010-0425). The calculation of the alumina mean particle size indicated a 4.56 nm size in CoRe (
Table 2), which slightly increases to 4.86 nm in CoReMo due to the presence of Mo. Furthermore, the sample diffraction lines manifest a lower intensity relative to those of the support, implying the partial amorphization of the Al
2O
3 phase owing to surface interaction with the deposited components. No peaks indexed to the Co and Re oxide structures were detected in either sample, regardless of the large percentage of loaded Re, 15.3 wt.% of Re
2O
7, to ensure a rhenium monolayer-like coverage on the alumina, and the 3 wt.% of CoO deposited above in the CoRe catalyst. Oxidic Mo-containing species after the co-deposition of 7.65 wt.% of Re
2O
7 and 7.65 wt.% of MoO
3, followed by 3 wt.% of CoO in the case of CoReMo configuration, were not registered either. This was a clear indication of the nano-dimensionality of the structures that were formed in a highly dispersed state, indirectly implied by small crystallite sizes below the detection limit of the instrument.
The potassium deposition on the CoRe and CoReMo samples, along with the subsequent thermal treatment, caused the formation of another well-defined single tetragonal K(ReO
4) phase (ICDD PDF file 01-070-0043), as is disclosed in the PXRD patterns of the K-CoRe and K-CoReMo samples, together with reflections of the alumina phase (
Figure 2b). No other crystalline phases were identified.
The calculated crystal lattice parameters of the dominant K(ReO
4) phase in the K-CoRe and K-CoReMo samples and their conformity with the K(ReO
4) reference values prove the existence of very well-formed structures (
Table 2). This finding and the K(ReO
4) high crystallinity were in accordance with the determined K(ReO
4) mean particle size of 182 and 176 nm for K-CoRe and K-CoReMo, respectively. It is evident that the K(ReO
4) phase was better organized in the K-CoRe sample. The existence of Mo in the K-CoReMo sample, which replaced half of the Re, induced the formation of a slightly amorphized K(ReO
4) phase due to the lower Re content and a possible interaction between potassium and molybdenum upon the formation of the K
2MoO
4 structure.
Despite the fact that potassium was deposited last, the creation of the K(ReO
4) structure revealed how the components were redistributed during consecutive impregnation. Generally, there were 23 wt.% of oxide species, and only a K(ReO
4) phase could be registered in the bulk. It seems that its formation did not provoke a phase appearance from the oxide structures of the other components, Re, Mo, and Co, of detectable size. Only small changes in the crystal size of the alumina phase are further evidence for component deposition. The SEM-EDXS measurements confirmed the results provided by PXRD (
Figures S2 and S3).
2.3. UV-Vis DRS Analysis
Diffuse reflectance spectroscopy was used to study the coordination and surface electronic state of the components. Bearing in mind amorphous structures, the DRS analysis provided information about the metal oxide species formed on the γ-Al2O3 surface in the initial calcined two-, three-, and four-component samples.
A color analysis of the metal oxide catalytic systems was the initial indication of the different structures formed due to interactions among the components as well as with γ-Al
2O
3 (
Table 1 and
Figure S4).
The color change from the light gray–green of the CoRe sample to the dark gray–green of the KCoRe sample was reliable evidence of the formation of the K(ReO4) structure registered by PXRD. The molybdenum introduction into the CoRe system by replacing half of the Re resulted in a color transformation from the light gray–green of the CoRe sample to the gray–beige of the CoReMo sample. The latter color changed to gray–green after potassium deposition on the CoReMo sample.
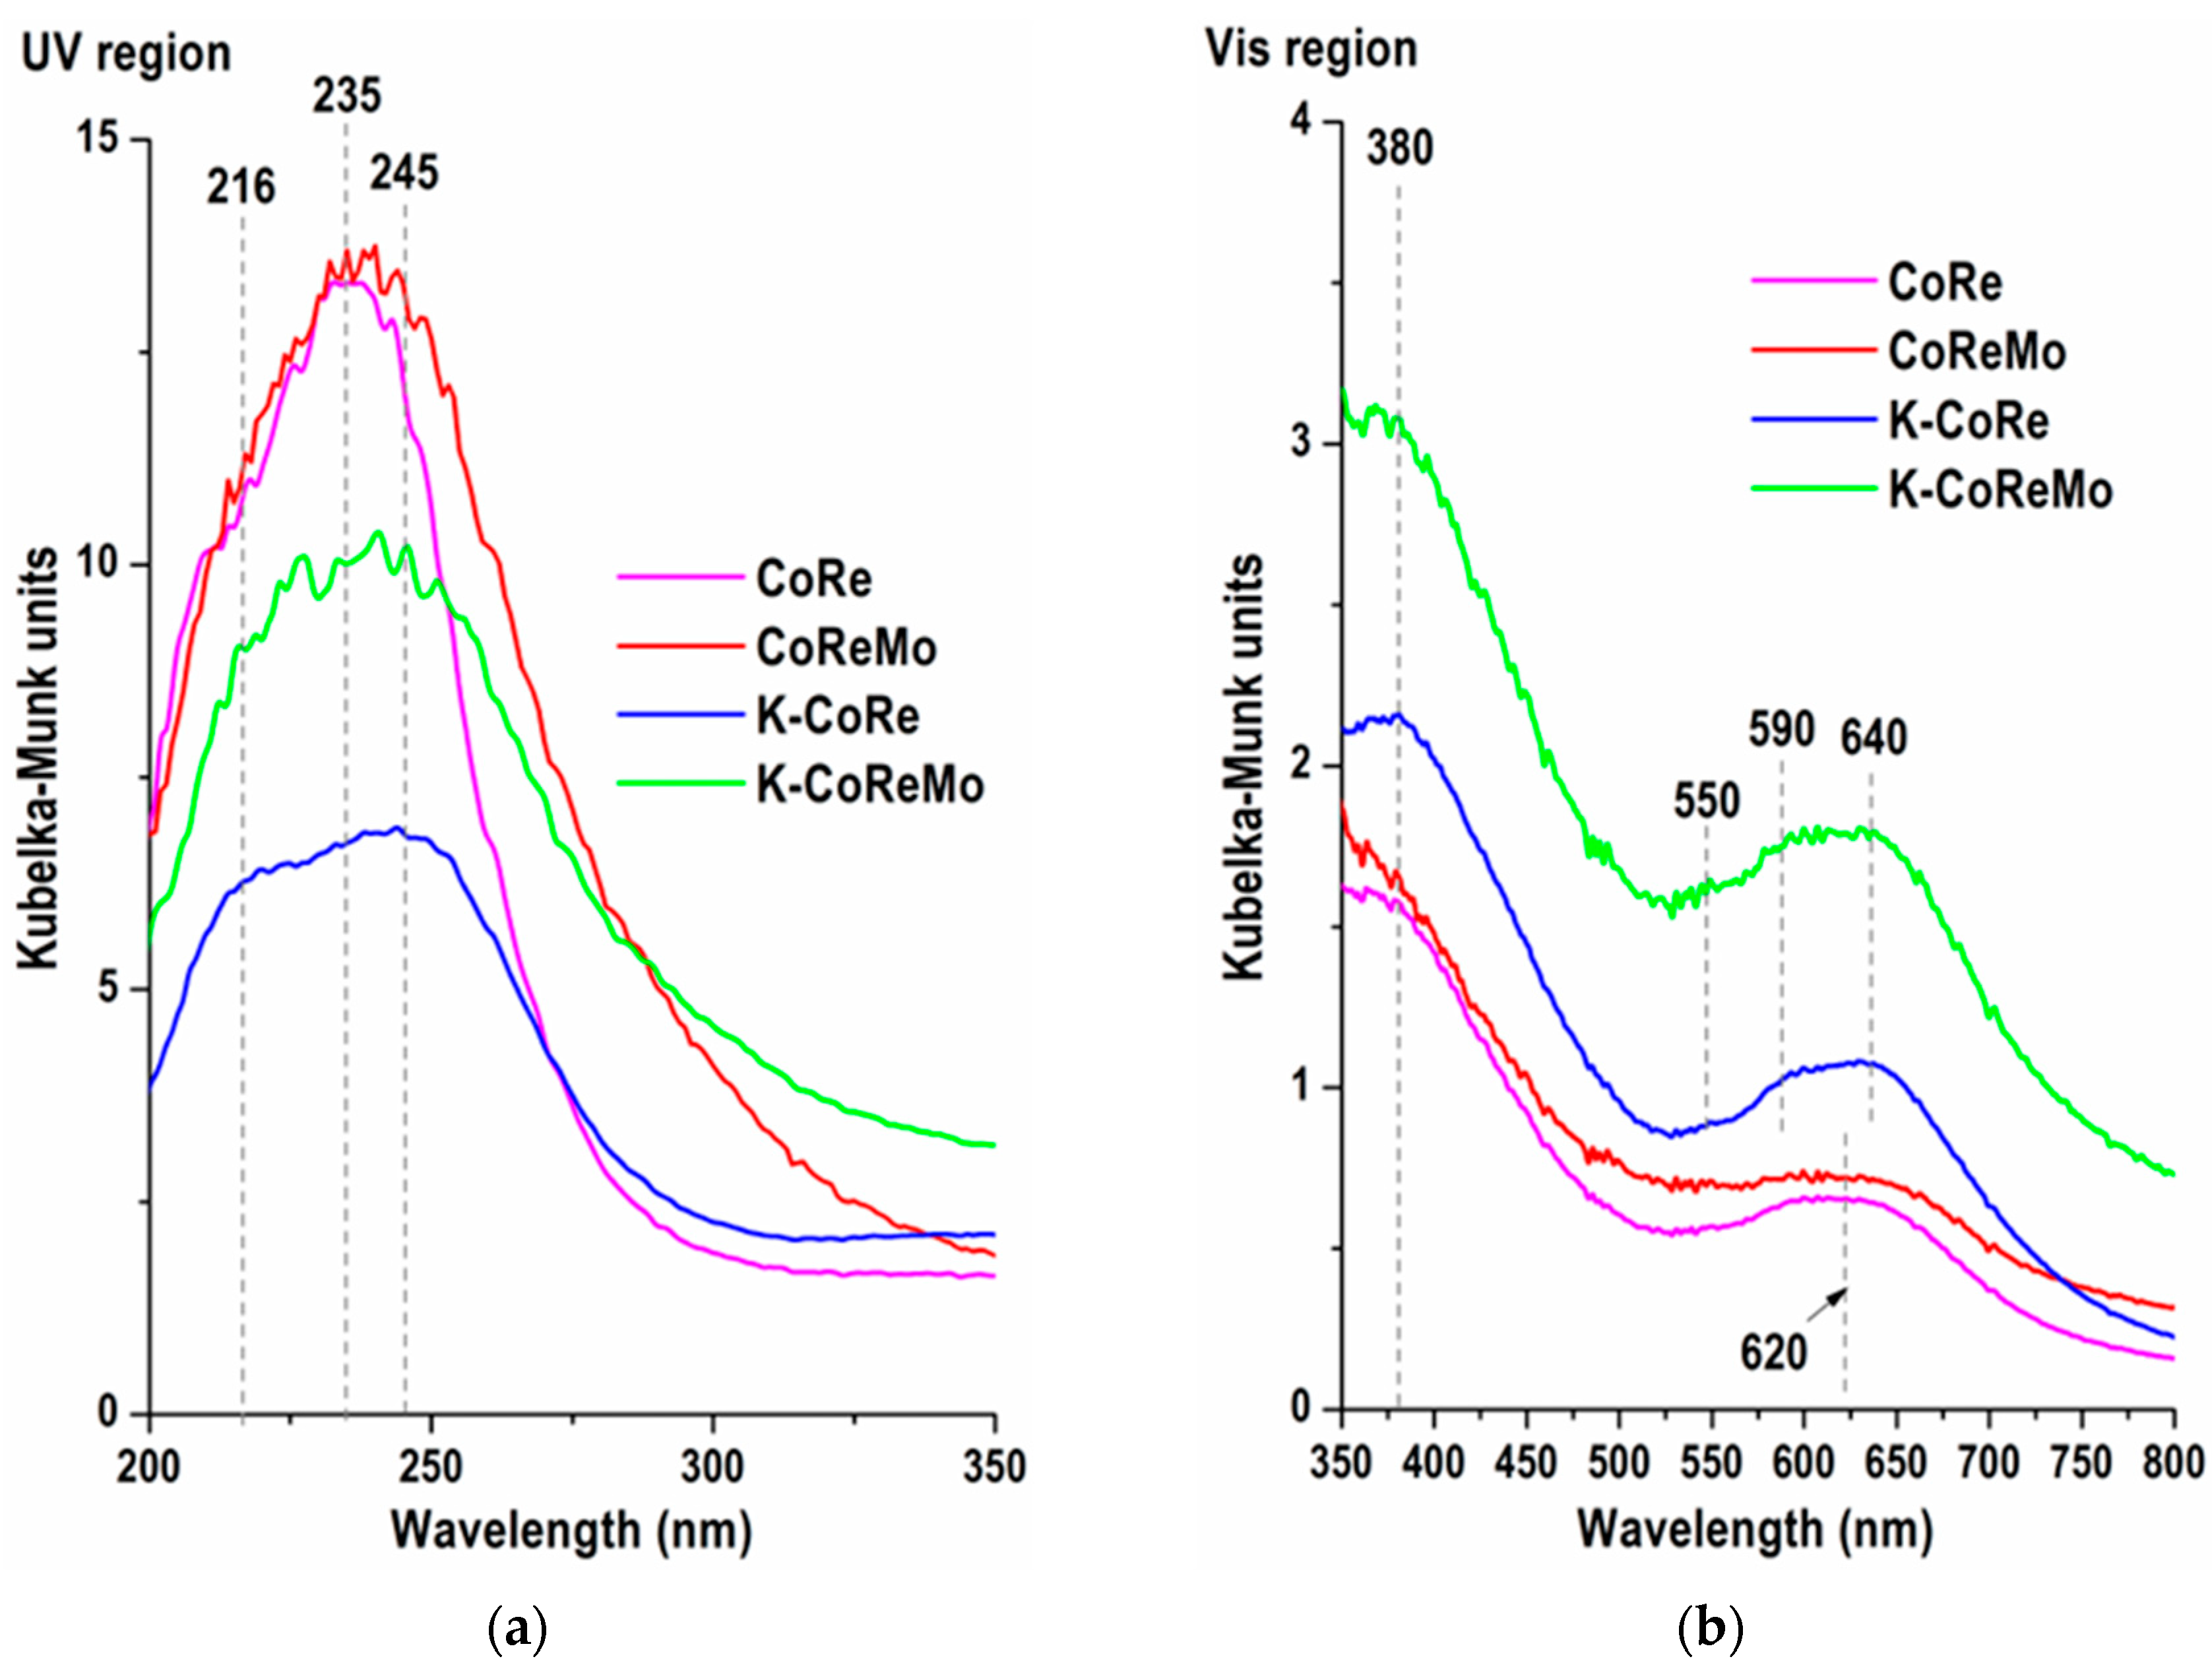
An analysis of the surface coordination and electronic state was made by inspecting the ultraviolet (200–400 nm) and visible (400–800 nm) regions. The ultraviolet (UV) spectral region (
Figure 3a) provided information on the ligand-to-metal charge transfer [
23] due to the electronic transition from the ligand, in this case oxygen (O
2−), to the transition metal ion, which, in the studied catalysts, is Re
7+, Co
2+, Co
3+, or Mo
6+.
CoRe: A shoulder at 216 nm was registered together with an intense absorption band at 235 nm, characterizing a charge transfer from the ligand to the metal for rhenium and cobalt: O2− → Re7+ charge transfer, O2− → Co2+ charge transfer, and O2− → Co3+ charge transfer. The formed oxide structures were
- -
An ReO
4− structure in which the Re
7+ ions are in tetrahedral (Td) coordination as well as the formation of ReO
3–O–ReO
3 species at the surface of the γ-Al
2O
3 carrier [
16,
17];
- -
A non-stoichiometric spinel-like mixed oxide, Co
2+(Co
3+,Al
2+)
2O
4, at a temperature of 300 °C. A completely formed spinel structure containing only Co
2+ ions (Co
2+Al
3+2O
4) was formed at high temperatures of about 1000 °C. It is also known that Co
2+ ions were incorporated into the lattice of γ-Al
2O
3, and a spinel structure was formed for cobalt concentrations within 2 wt.% of CoO [
24] (and references herein);
- -
A deposited CoO amount of 3 wt.% generated another spinel structure, Co3O4 (CoO.Co2O3), in which Co2+ and Co3+ ions occupy octahedral (Oh) positions;
- -
Based on previous studies of this system [
16,
17], an interaction between Co and Re to form weakly bonded Co–Re–O–(Al) surface species is also possible.
K-CoRe: As a third component, the potassium added to the CoRe changed the absorbance in the 200–270 nm region. The K presence also altered the spectrum shape. A shoulder at 216 nm was transformed into a shaped band together with a red shift of the absorption band at 235 nm to 245 nm. As proved by PXRD analysis, one of the reasons for this change was related to the formation of a K(ReO
4) phase. Along with this, the existence of K–Re–O species on the surface, where the Re
7+(Td) state is also dominant, could not be excluded. The increase in the absorption intensity above 270 nm points to an interaction between potassium and other components and the appearance of new K–Co–Re–O–(Al) species on the surface, which could not be identified by PXRD [
16,
17].
CoReMo: The introduction of molybdenum into the CoRe system caused substantial transformations, not only a color transformation to gray–beige (
Table 1 and
Figure S4) but also a shift of the entire absorption band to longer wavelengths. These changes were informative about the presence of Mo
6+ ions surrounded by O
2− ions together with cobalt and rhenium. At the current molybdenum concentration of 7.65 wt.% of MoO
3, a mixture of Mo
6+(Td) in tetrahedral coordination (isolated molybdate MoO
4− ions) and Mo
6+(Oh) in octahedral coordination (polymolybdate—MoO
6—structures) was present on the alumina surface. A Co–Re–Mo–O–(Al) surface interaction and the formation of surface CoMoO
4 species are also possible [
16,
25]. The introduction of Mo species increased the absorption of the catalyst in the region above 250 nm, denoting that part of the Mo species was in the form of polymeric Mo species in octahedral symmetry.
K-CoReMo: The existence of potassium lowered the intensity of the whole absorption band, as in the case of the CoRe and K-CoRe samples, and meanwhile increased the absorption above 285 nm. The increase was lower than that with the CoReMo sample. This could be attributed to the basicity of the K species, which might depolymerize the Mo phase and transform it into a monomeric species [
25]. In addition to afore-described metal oxide species on the CoReMo surface, the change in the K-CoReMo spectrum is due to the K(ReO
4) phase registered by PXRD and the expected formation of a K
2MoO
4 surface analogue as well as K–Co–Re–Mo–O–(Al) interactions.
Concerning the visible (Vis) region (
Figure 3b), the information given in the DR spectra was about the d–d transitions of Co
2+(d
7) and Co
3+(d
6) ions in the Oh coordination of O
2− ions.
Two bands at 380 and 620 nm were recorded for the CoRe and CoReMo samples. These bands were attributed to d–d transitions in the presence of cobalt, which are characteristic of Co
3+ (Oh) ions in a Co
3O
4 structure. Usually, a triplet of bands within 520–640 nm also appeared in this region due to Co
2+ (Td) ions interacting with the carrier to form a surface CoAl
2O
4 spinel structure. The latter structure was not clearly registered in this case due to the low-enough temperature of calcination (300 °C), at which it was only possible for a non-stoichiometric spinel to occur. However, a broadband width at 620 nm comprising the 520–750 nm region was an indication of the formation of both metal oxides. The absorption intensity of CoReMo was higher because of the presence of the molybdenum species. The interactions between Co and Mo species in the oxidic phase are well known [
26,
27]. In addition, the increased absorbance in the 400–600 nm range of the CoReMo Vis-DRS spectrum at the 525 nm minimum led to the formation of the Mo
5+ species owing to the mixed Re-Mo oxide species in this catalyst [
28]. Moreover, both components were selected to satisfy a Re
2O
7-to-MoO
3 ratio of 1:1. Based on this result, it can be stated that the MoO
x species were able to electronically modify ReO
4− entities.
The introduction of potassium caused changes in the intensity and appearance of the bands in the visible region. In the DR spectrum of K-CoRe, the triplet of bands at 550, 590, and 640 nm assigned to Co
2+ (Td) in the CoAl
2O
4 spinel structure was clearly outlined. The explanation for this is that potassium induced a strong interaction between Co and Al
2O
3. Furthermore, the better-defined band at 390 nm compared to the CoRe spectrum was evidence of the increasing presence of Co
3+ ions originating from Co
3O
4. K(ReO
4) formed a phase together with K
2MoO
4, and the K–Co–Re–Mo–O–(Al) interaction also contributed to a higher absorption intensity in the whole visible region. The color change from the light gray–green of CoRe to the dark gray–green of K-CoRe was another proof of this. In the four-component K-CoReMo system, the absorption increased very strongly, and the formation of additional structures such as K
2MoO
4 and K–Co–Re–Mo–O–(Al) also led to poorly resolved bands of the triplet of Co
2+ (Td) ions. All of this contributed to the brighter color of the metal oxide sample becoming grey–green (
Table 1 and
Figure S4).
The supported metal oxide surface structures formed in the calcined catalysts are listed in
Table S2 for convenience. Their nature determines the reduction properties of the four Re-based systems and generates active species for the WGS reaction.
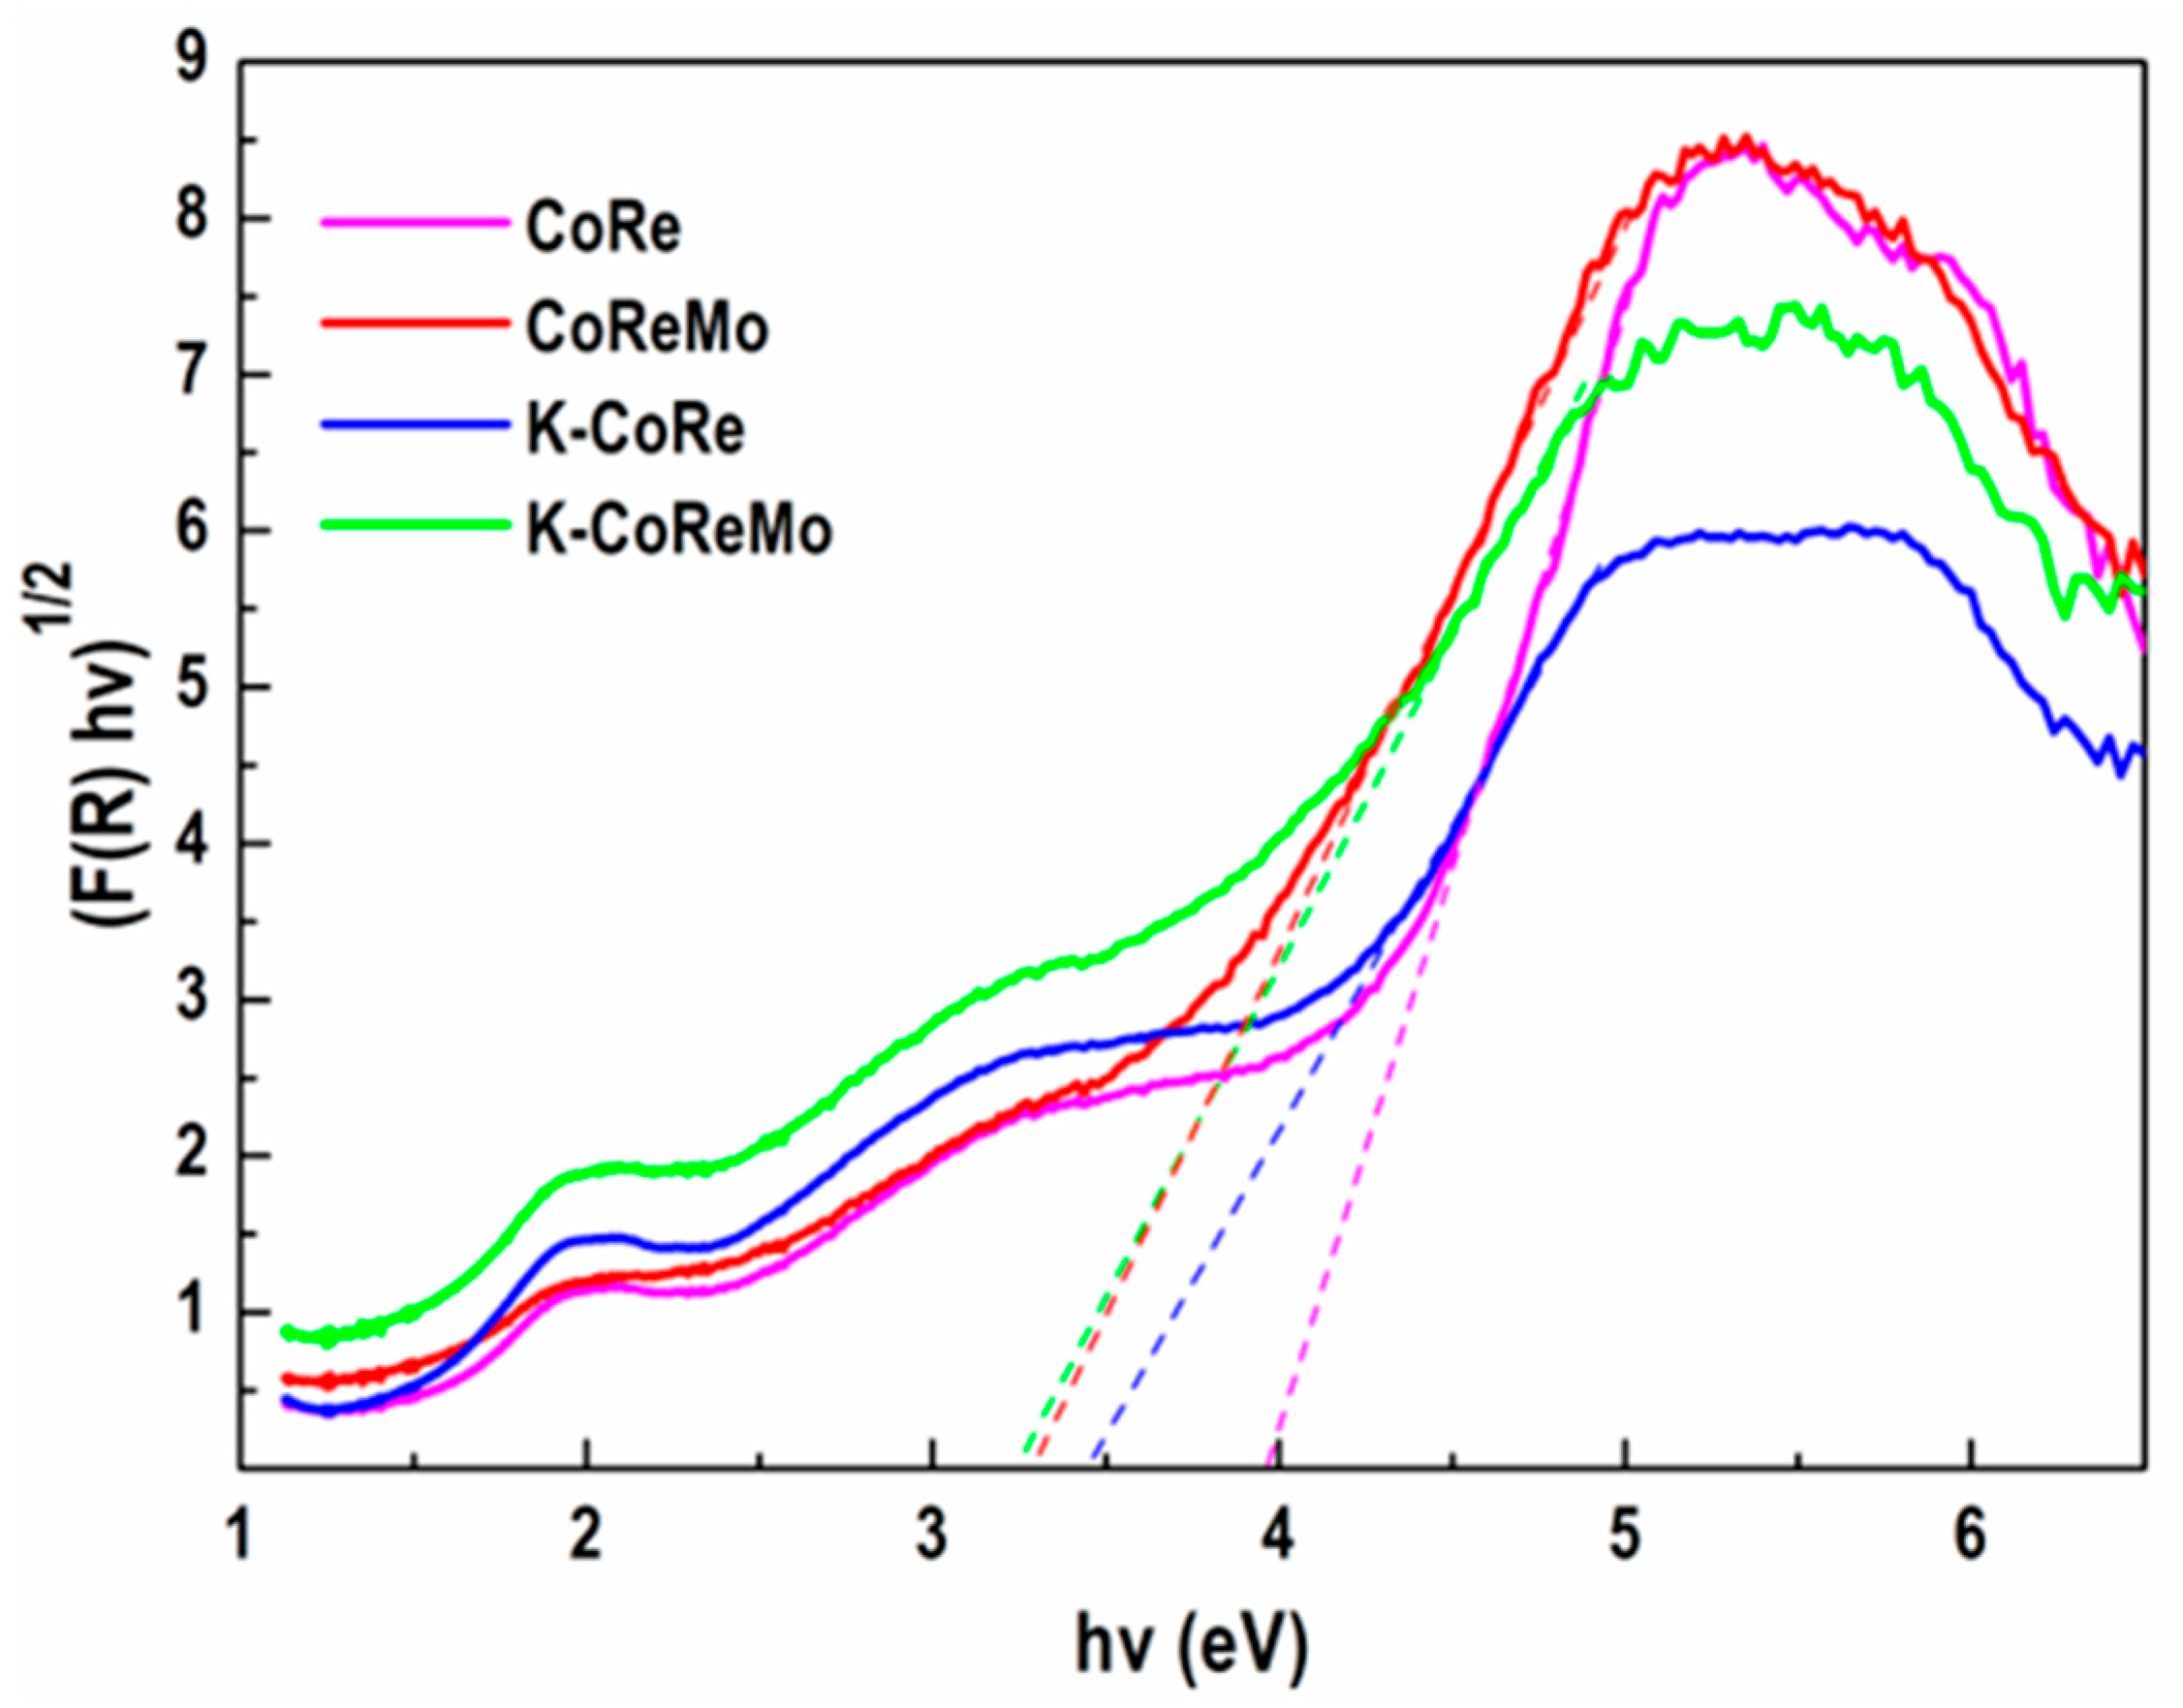
The band gap values of the samples were calculated using Tauc’s plots for indirect band gap materials. The energy of the band gap could be calculated by extrapolating a straight line to the abscissa axis when the (F(R) × hν)
1/2 versus energy was plotted. Tauc’s plots for the studied samples are displayed in
Figure 4.
As can be seen in
Figure 4, the Eg values of the four samples are quite different. Generally, it could be claimed that the introduction of another metal ion lowered the sample Eg. The CoRe composition demonstrated a higher value of Eg equal to 3.97 eV, while the added potassium diminished this value to 3.43 eV. The Mo species had an even higher influence. The CoReMo version showed an Eg value equal to 3.29 eV. Finally, the addition of both Mo and K gave the K-CoReMo sample a lower Eg (Eg = 3.26 eV), although its value was very close to that of the CoReMo sample. These changes proved that the introduction of the third and fourth metal ions provoked significant changes in the nature of the supported phase, and, thus, differences in catalyst activity could be expected.
Since these samples are not photocatalysts, one may argue that this information is not relevant to the catalytic tests. On the other hand, the Eg value is not limited to photocatalytic studies, but it can be related to particle size. It is widely accepted that Eg increases with decreasing particle size. The reason for this is variation in the surface/volume ratio and the relaxation effects of the surface atoms [
29]. Therefore, Eg depends on the sample size and composition. In our case, the introduction of different metal ions in the form of cations like K
+ or oxo-anions like MoOx
− alter the composition and particle size of the supported phase.
2.4. Temperature-Programmed Reduction
The reducibility of the formed metal oxide structures in the initially calcined two-, three-, and four-component samples (CoRe, K-CoRe, CoReMo, and K-CoReMo) was evaluated through a temperature-programmed reduction with hydrogen (H2-TPR). Based on the analyzed information, the temperature and duration for the preliminary activation/reduction of the starting oxide structures in the investigated catalyst systems would be selected.
A primary comparative assessment of the H
2-TPR profiles’ shapes revealed a variety of formed metal oxide species depending on temperature (
Figure S5). The profile of the CoRe sample (
Figure S5a) was characterized by only two maxima: a very low intense peak at 235 °C and a highly intense and narrow peak at 374 °C. The highest H
2 uptake was recorded for this sample in comparison with the other three K-CoRe, CoReMo, and K-CoReMo compositions. The potassium deposition stimulated a strong change in the reduction profile of K-CoRe (
Figure S5b). Four peaks of H
2 consumption were observed: (i) at 285 °C accompanied by a shoulder at 304 °C; (ii) a main temperature maximum (T
max) at 392 °C shifted by 18 grad to higher temperatures compared to the CoRe sample; (iii) at 458 and 533 °C. A comparison between the H
2-TPR profiles of the CoRe and CoReMo (
Figure S5c) samples indicated that the presence of Mo caused a decreased H
2 consumption and shifted the T
max position to higher temperatures by 9 grad in comparison with the CoRe sample. A hydrogen consumption above 490 °C was also observed. The potassium deposition also changed the reduction profile of the K-CoReMo sample (
Figure S5c). New reduction peaks appeared at temperatures of 308, 427, and 540 °C, and the main reduction maximum was displaced to higher temperatures by 44 grad. A reduction above 584 °C was also found for the K-CoReMo sample.
The deconvolution of the H
2-TPR profiles into several peaks was performed for a detailed analysis of the reduction properties of the formed metal oxide structures upon component interactions. A variety of component constituent parts confirmed the diversity of oxide structures formed in the synthesis process, as disclosed during the surface analysis by DRS. The data are presented in
Figure 5 and
Table 3 and
Table 4. Actually, the percentage of the total area in both tables represents the percentage of the reduced portion of the sample at the corresponding temperature.
CoRe: Five reduction peaks characterized the H
2-TPR profile of the CoRe sample after deconvolution (
Figure 5a). During the reduction in the low-temperature region of 230–360 °C, only 9.2% were reduced in the CoRe sample. A narrow peak at 374 °C included three components at 362, 386, and 454 °C related to a reduction of various types of Re and Co structures. The maxima located at different temperatures are focused on the variation in the metal–oxygen bond strength and the degree of reduction, as shown in
Table 3. The reduction of the CoRe sample at 374 °C was led to a 59.3% reduction. A subsequent increase in the temperature was associated with a decrease in reduction degree at 386 °C, achieving 10.8%, and the final temperature at 454 °C increased this up to 20.6%.
According to the literature, a narrow sharp peak at about 350 °C [
30] characterizes the H
2-TPR profile of pure Re
2O
7. An intense, narrow peak at 280 °C described the TPR profile of the supported Re
2O
7/Al
2O
3 system obtained through calcination at 300 °C [
31]. Obviously, the low-temperature peak at 233.5 °C in the profile of the CoRe sample corresponded to a reduction in small amounts of the Re
7+-O
4 structures and ReO
3–O–ReO
3 surface species weakly bonded to alumina.
The reduction of unsupported cobalt oxide (Co
3O
4) is well known to proceed in two stages, which could be ascribed to the successive reduction of Co
3O
4 to CoO at about 350 °C and CoO → Co
0 at around 600 °C [
32,
33]. According to the authors, the first stage of cobalt oxide reduction is attributed to the reduction of Co
3+ species in the non-stoichiometric Co
3O
4 spinel to divalent Co
2+ (CoO). This step is fast, giving a sharp low-temperature peak. The second stage involves Co
2+ reduction to metallic cobalt. The CoO reduction step is slow, resulting in a broad profile up to 730 °C.
It is also known that the addition of Re to Co, even 0.5 wt.% of Re, promotes the first step of reduction very slightly but significantly decreases the reduction temperature of the second step. A shift of the second-high temperature peak to lower temperatures has been detected, which is transformed into a sharp peak [
31,
34]. This finding is not surprising since the reduction of rhenium ions proceeded at nearly the same temperature as the first stage of cobalt oxide reduction (Co
3O
4 → CoO). In this temperature range, a reduction of the surface ReO
3–O–ReO
3 and Co–Re–O–(Al) structures also occurred. The three TPR peaks in the interval 328–418 °C obtained after deconvolution illustrate a reduction of the different oxide structures.
Apart from the Co
3O
4 spinel structure, another kind of spinel-type mixed oxide Co
2+(Co
3+,Al)
2O
4 phase could be formed as a result of a strong interaction between Co and alumina, which can also hinder cobalt reduction. The selected synthesis calcination temperature (300 °C) facilitated the reduction of Co
2+(Co
3+,Al)
2O
4 mixed oxide and CoAl
2O
4 spinel due to poor formation at this temperature [
33]. This was verified by the presence of a broad low-intensity temperature peak at 453.7 °C (
Figure 5a and
Table 3).
Reducibility data about the CoRe sample confirmed the promoting effect of rhenium to facilitate CoO reduction to metallic cobalt. Jacobs et al. [
31] have established that Re remains on the surface as isolated Re atoms in close contact with Co metal clusters. A hydrogen spillover away from Re to cobalt oxide was widely believed to promote cobalt oxide reduction. An electron density transfer between Re and Co ions may occur, which facilitates the reduction of the CoRe catalyst by analogy with studies of the Re effect on Co/CeO
2 catalysts [
13].
K-CoRe: The deconvolution of the K-CoRe TPR profile (
Figure 5b) indicates that the low temperature peak was registered at a higher temperature and has grown significantly in intensity. Apparently, the presence of potassium provokes an easier reduction of part of Re
2O
7 to ReO
2 together with Co
3O
4 → CoO. A hypothetical cause could be structural disorder induced by potassium. On the other hand, the main reduction peak at 374 °C in the TPR profile of CoRe was transformed into three reduction peaks located at higher temperatures, showing reductions to different extents. This altered profile points to a dual effect of potassium, namely, the partial promotion of CoRe reduction and a possible hindering effect. However, simultaneous reduction proceeded of the structures formed in potassium pres-ence as K(ReO4) and surface K–Co–Re–O–(Al). As reported, perrhenate salt is converted to rhenium oxides at 350 °C [
35]. Nevertheless, the reduction ends at 620 °C, analogous to the CoRe system.
CoReMo and K-CoReMo: The picture becomes much complicated by the partial replacement of rhenium with molybdenum in CoReMo (
Figure 5c). The lowest temperature peak is considerably more intense for a reduced part of 5.9% compared to 3.5% for CoRe due to the initiated reduction of weakly bonded Mo
6+ ions in the polymolybdate –MoO
6− structures. It is detectible that the main sharp reduction peak of the CoRe sample manifests lower intensity and is displaced to higher temperatures by 10 grad after Mo introduction in the CoReMo system. Such a change is associated with reduction of not only rhenium and cobalt structure but also polymolybdate, –MoO
6−, species and surface Co–Re–Mo–O–(Al) entities, as specified by the UV-Vis diffuse reflectance spectroscopy analysis. There is no doubt that Mo made the reduction of CoRe more difficult. In addition, this detailed analysis of the main peak shows changes in the peak areas and positions relative to the CoRe reduction profile.
A significantly increased area of the peak at 382.2 °C was observed, along with a shifted position by 20 grad of the peak at 362.2 °C in the CoRe profile. Considering the above-mentioned comment, the increased area of the lower temperature peak at 232.4 °C confirmed the specified Re-Mo oxide interaction seen in the Vis-DRS spectra.
An enhanced reduction of additionally formed high-temperature structures such as isolated molybdate MoO4− ions and CoMoO4 was detected above 460 °C.
The analysis of the H
2-TPR profiles showed that reduction above 420 °C proceeded to a 31.8% degree with CoReMo vs. 70.6% for K-CoReMo (
Table 4). Similar to K-CoRe, potassium presence further shifted the profile to higher temperatures. The shape of the K-CoReMo profile (
Figure 5d) was similar to that of K-CoRe; however, an overall shifting to higher temperatures was observed. In addition, an increased consumption of hydrogen over 590 °C compared with CoReMo was registered due to the presence of structures such as K
2MoO
4.
An examination of the calcined samples using the TPR method revealed that the presence of Mo hampered the reduction process of the cobalt and rhenium ions. A simultaneous molybdenum effect on the reducibility and creation of small-sized and better-dispersed reduced species is well documented in the literature [
29,
36]. The presence of potassium in K-CoRe and K-CoReMo also complicated the reduction profile through changes in both the reduction steps and reduction level.
One would expect that molybdenum and potassium might not only help to reach higher degrees of CO conversion for obtaining larger amounts of H2, but could also affect the structural properties of the investigated catalysts during the activation/reduction stage for each combination of the studied elements.
2.5. Water–Gas Shift Catalytic Activity Assessment
2.5.1. Exploration of WGS Reaction Capacity
Based on analyzed data on the conducted temperature-programmed reduction with hydrogen (H
2-TPR) and the reducibility assessment of the formed metal oxide structures upon starting annealing, the conditions for preliminary reduction/activation were selected using a CO/Ar reaction mixture as the reducing agent (
Section 3.4).
On exploring WGS capability, CO-reduced catalysts started work through an analysis of the temperature dependence on CO conversion by applying a water vapor pressure of 31.16 kPa and a GHSV of 4000 h
−1. The WGS activity of all the samples during the three consecutive days of operation with equal amounts of charged catalysts is illustrated in
Figure 6.
The WGS activity data during the first testing day indicate that the CoRe catalyst showed an almost equilibrium CO conversion of 93–94% in the interval of 350–260 °C (
Figure 6a). The activity rapidly decreased as the reaction temperature diminished. All the other catalysts attained an activity below 50% CO conversion.
The behavior changed during the second day (
Figure 6b). The catalytic run with CoRe was different when examined with a temperature increase from 140 to 350 °C. Showing a lower CO conversion degree compared to day 1, the CoRe reached equilibrium only at a high temperature of 350 °C (97%). The CoReMo activity was also diminished. On the other hand, the capability of the potassium-promoted K-CoRe and K-CoReMo catalysts to enhance their activity for the WGS reaction increased and attained an 87% and 69% conversion at 350 °C, respectively.
The measurements during testing day 3 (
Figure 6c, black curves) disclosed that when the temperature-increasing method was repeated, the activity of the CoRe catalyst decreased significantly after staying overnight under argon. However, the activity was almost recovered to 93% CO conversion at the high temperature of 350 °C. On the other hand, K-CoRe demonstrated a tendency to be little more active at lower temperatures (140–260 °C) and had a completely recovered activity at 350 °C. The CoReMo and K-CoReMo molybdenum-containing catalysts retained their activity from the second day.
A comparative assessment was carried out by applying the criteria for the maximum sensitivity of an activity measurement of around a 50% conversion, as this is more informative about a catalyst’s performance [
37,
38]. The behavior of the CoRe catalyst was characterized through raising the reaction temperature at a 50% CO conversion by 16 grad to 219 °C on the second testing day (
Figure 6a,b). During day 3 (
Figure 6c), the conversion degree was moved to a higher temperature of 240 °C by 21 grad, thus a slight deactivation of the CoRe system was confirmed. The potassium-promoted K-CoRe and K-CoReMo catalysts (
Figure 6a–c) achieved a 50% conversion at 292 and 318 °C during the second testing day, respectively. The same happened on day 3: 287 °C for K-CoRe and 320 °C with K-CoReMo. It should be noted that the temperature at which there was a 50% conversion for K-CoRe dropped by 5 grad. Obviously, the observed tendency towards higher activity in the 180–260 °C interval should not be considered an experimental error. This statement clearly indicates an elaboration of the K-CoRe system during the testing period. Under this condition, only the CoReMo configuration did not reach a 50% CO conversion.
An additional estimation of the catalytic WGS efficiency was carried out on testing day 4 by performing a further detailed examination via two consecutive experiments for the stability of the catalytic behavior after the 3-day testing period with equal catalyst charges for each composition while keeping the reaction temperature at 350 °C.
- (1)
The express estimation of the catalyst’s deactivation behavior started with a variation in water vapor pressure in the order of 31.16 < 47.34 > 19.92 kPa with a GHSV of 4000 h
−1 (
Figure 7). The increase in the partial pressure of the water from 31.16 to 47.3 kPa in the reaction mixture did not notably affect the activity of the four catalytic compositions. This is indicative of the tolerance of the formed structures toward high water concentrations. On the other hand, the WGS reaction stoichiometry requires increased concentrations of the reaction products. Thus, a higher vapor pressure should improve CO conversion. However, only very small deviations in the CO conversion degree were observed, which indicated that a vapor pressure of 31.16 kPa was appropriate to conduct the WGS reaction.
Differences that are more significant appeared when the H2O partial pressure was lowered to 19.92 kPa, which creates a strongly reducing environment. Only the CoRe and CoReMo potassium-free samples were stable. The impact of a lower amount of steam was observed for the potassium-containing samples, and the K-CoReMo configuration exhibited a significantly decreased activity of CO conversion by 16%. It is important to note that the CoRe composition was independent of the amount of steam in the reaction mixture, which is an important feature for the stability of the formed active structures during operation within a three-day period. Evidently, the CoRe catalyst retained the highest activity at 350 °C during day 4, showing the same CO conversion level achieved on the third day. Therefore, it is clear that the re-oxidized CoRe structures after the CO reduction stage have stable active behavior during the WGS reaction.
The effect of the water steam amount on the catalytic activity is debatable; however, the composition of the catalytic system is determinative.
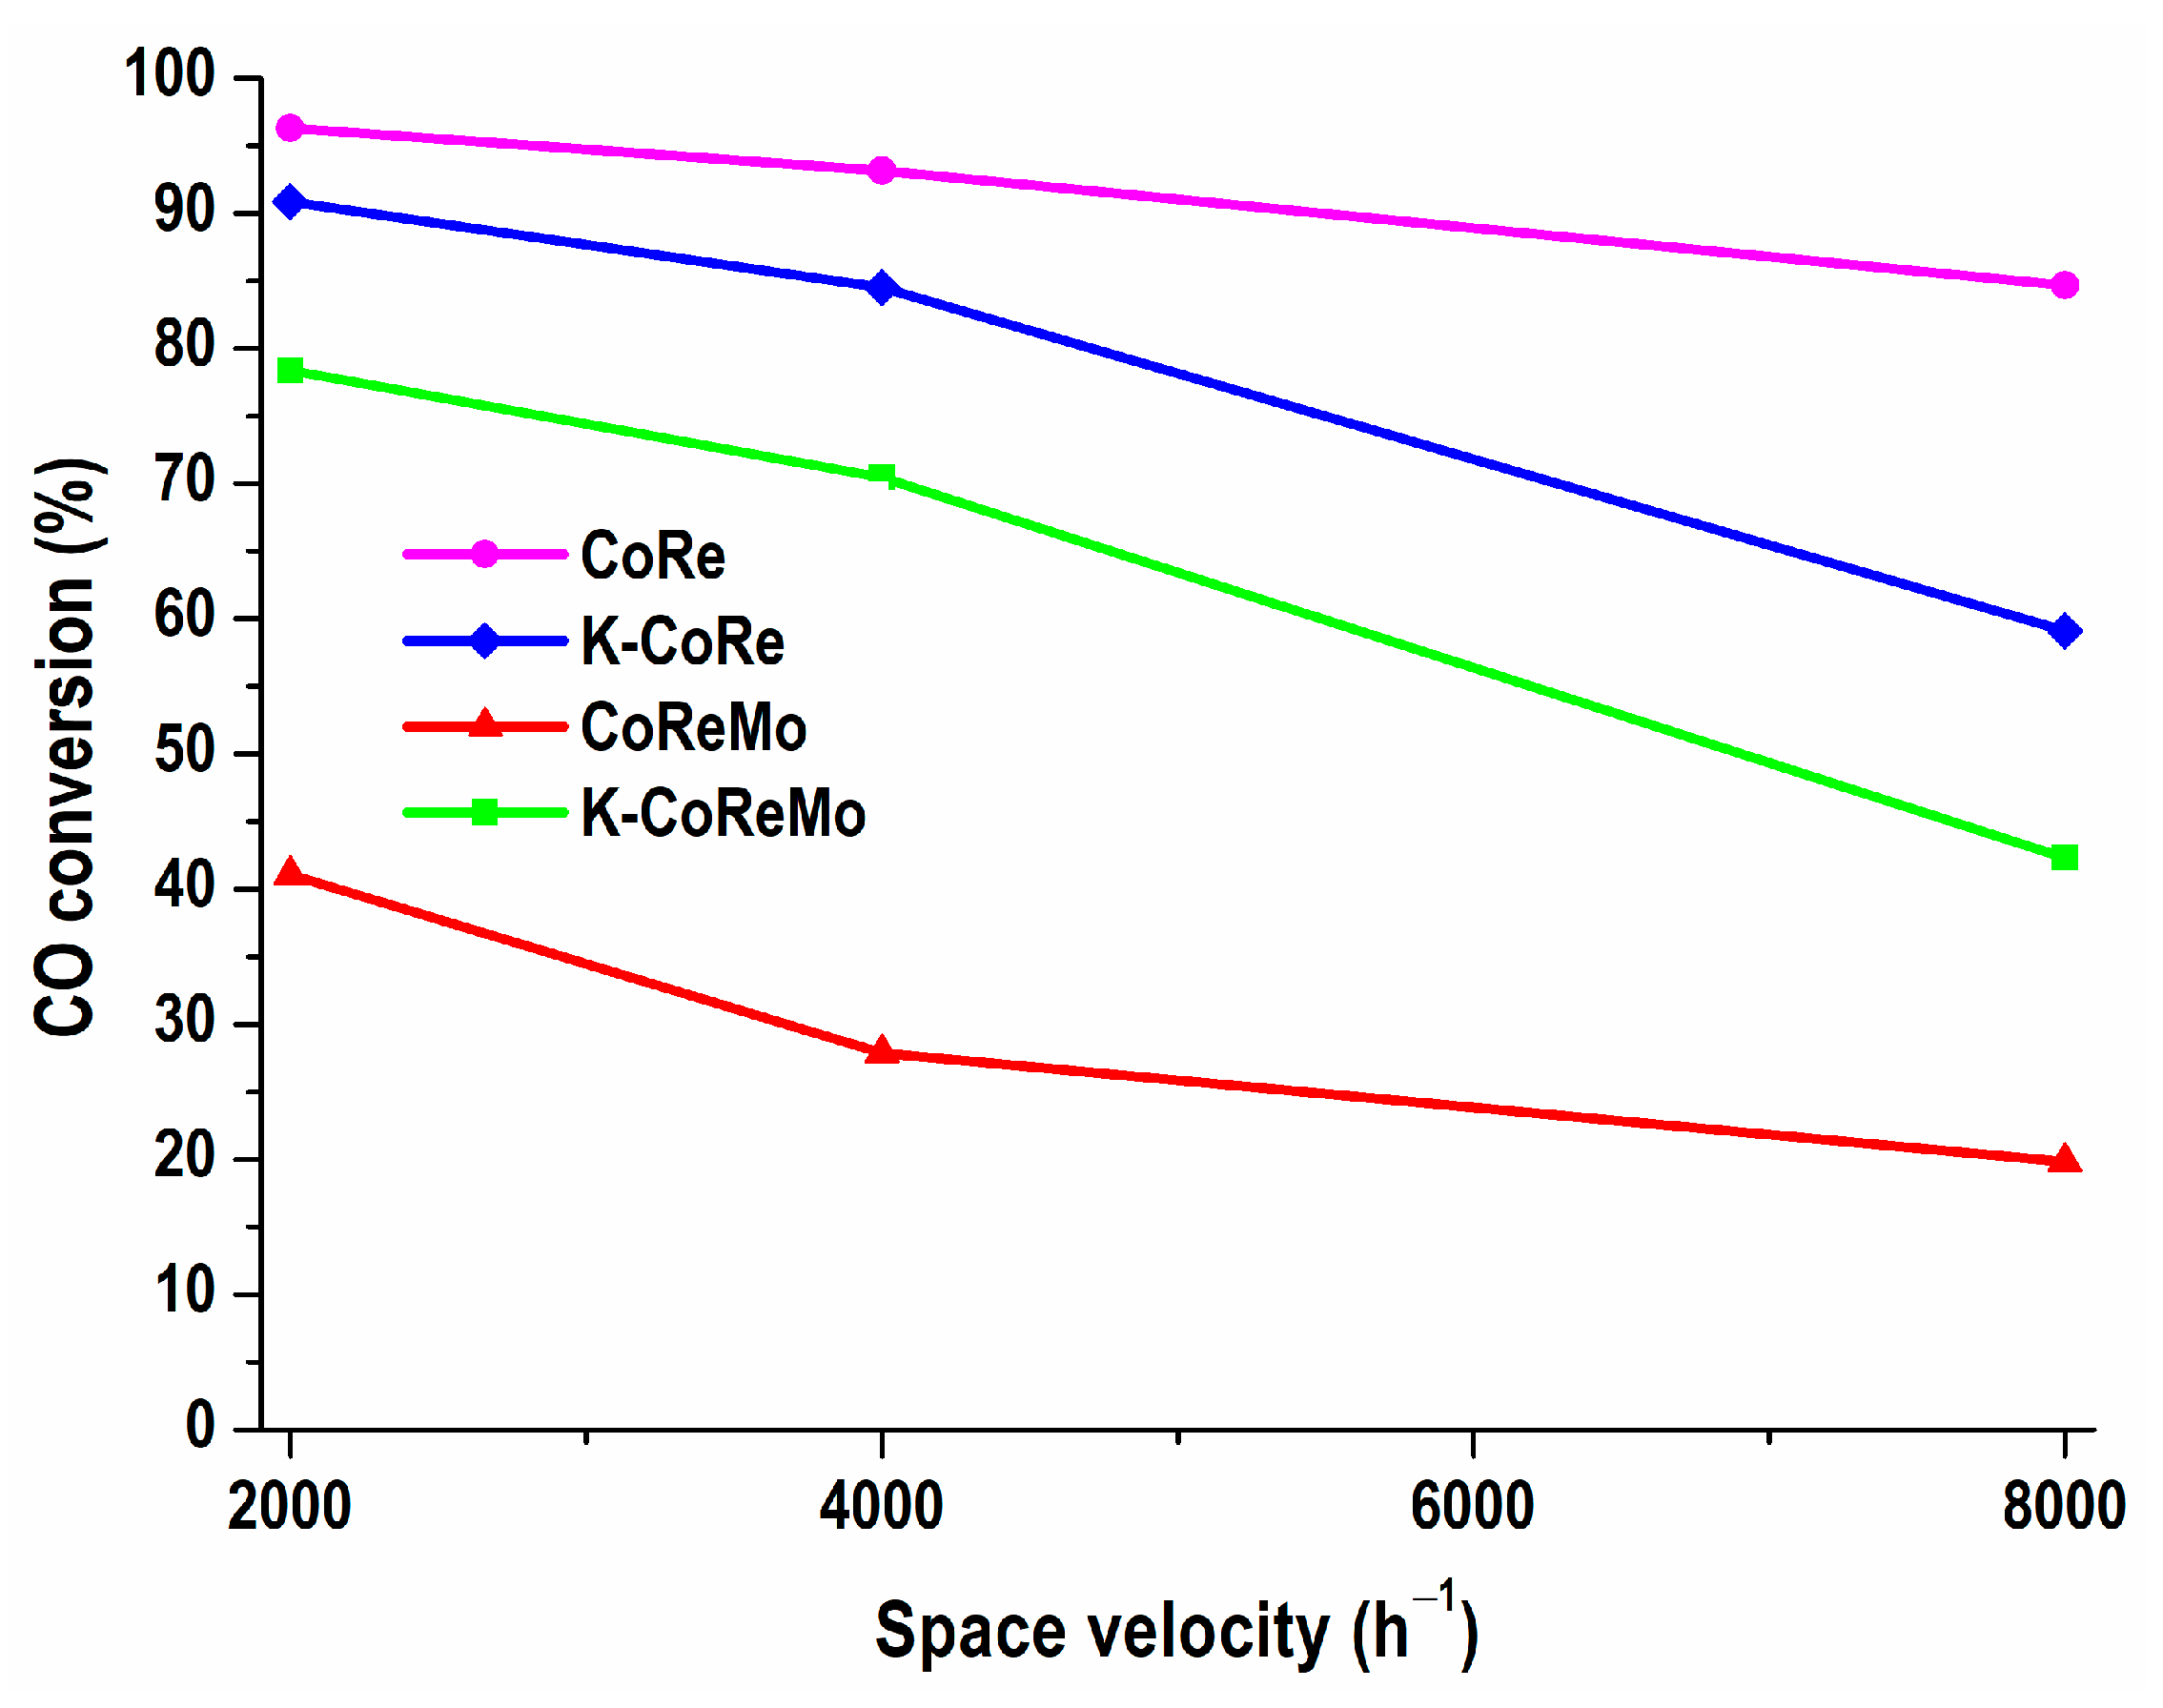
- (2)
The second step in the express estimation of the deactivation behavior included extreme conditions of a high GHSV, as 2000 > 4000 > 8000 h
−1 (
Figure 8). Increasing the space velocity to 8000 h
−1 did not greatly affect the CoRe activity (only by 9%), while the CO conversion of the K-CoRe and K-CoReMo samples was diminished by 30% and 40%, respectively. The relative stability of CoReMo was noticeable because a two-fold change increase to 8000 h
−1 did not cause complete inactivity. This composition was relatively less active but manifested a decrease in the CO conversion level to the same extent of 29%.
Undoubtedly, the catalytic behavior of the Co-Re species in the studied two-component CoRe system was preserved at a reaction temperature of 350 °C and remained independent of the increasing amount of oxidizing reagent and decreasing contact time of the catalyst with the CO and H2O steam reactants. This accelerated test assessment showed the stable deactivation performance of the CoRe catalysts under different reaction conditions at a high reaction temperature of 350 °C, where the kinetic advantage of the CO conversion was favored for a high reaction rate, thus implying high catalytic activity. In contrast, the K-promoted catalysts were not stable under deactivation.
The fifth testing day was dedicated to checking the stability of the formed structures after a severe treatment of water vapor with significantly varying concentrations and mass transfers. The estimation of the catalytic behavior was carried out by going back to the reaction conditions of the third day: a temperature rise from 140 °C to 350 °C at a GHSV of 4000 h
−1 and a water vapor pressure of 31.16 kPa. The data shown in
Figure 6c disclose that the CoRe catalyst’s activity was identical to that registered on the third day. The CoReMo and K-CoReMo catalysts also recovered their activities. Only the K-CoRe system was an exception due to again showing some deviation, as evident in its remarked tendency toward increased CO conversion values at lower reaction temperatures in the 200–260 °C interval. The temperature evaluation for a 50% CO conversion confirmed lower reaction temperature compared to day 3, namely 280 °C vs. 287 °C. Apparently, these small differences, which are within the accepted average experimental error of about ±5%, could be considered an indication of the improved activity of the K-CoRe structures in the 200–260 °C temperature range. Evidently, the data indicate an elaboration of this configuration under redox conditions during the testing period due to the potassium presence.
Finally, a PXRD analysis of all the samples after the 5-day catalytic tests was performed. Alumina was registered in all the tested catalysts, and the K(ReO4) phase was registered in the K-CoRe and K-CoReMo catalysts. The catalyst activation procedure, via a reduction in the CO/Ar reaction mixture and the WGS reaction run, caused a decrease in the K(ReO4) crystallite size to 107 and 133 nm for K-CoRe and K-CoReMo, respectively, owing to the partial reduction of the K(ReO4) structure. The analysis provided evidence that no agglomeration or sintering might occur.
Despite their very low CoO content, the outlet gaseous mixtures of all the catalysts were analyzed to check for methane formation due to methanation, which is a side reaction and should be avoided. A chromatographic analysis showed that methane was not produced, and all catalysts manifested 100% CO2 selectivity. The results confirmed that only the WGS reaction took place over the studied catalysts within the whole investigated temperature range.
2.5.2. Summarized Analysis of the Catalysts’ Structure and Performance
A combination of N
2 physisorption and PXRD techniques gives a primary assessment of homogeneity during component impregnation and the dispersion degree of the obtained oxidic catalyst precursors. Practically the same PSDs, characterized only by the mesoporous internal as well as terminal deposition on bare alumina centered at 5.5–6 nm, along with the formation of nano-dimensional structures, in all the calcined CoRe, CoReMo, K-CoRe, and K-CoReMo compositions are a clear indication of the highly dispersed oxide species formed during the drying and calcination stages over the carrier pore structure. Moreover, the K(ReO
4) guest phase of a large crystal size, formed due to an interaction between the Re and K components, was situated on an entity that did not expose its own pore structure. The same profile of PSD curves for K-CoRe and K-CoReMo was preserved, thus confirming the same dispersion enabled by the applied procedure of ES impregnation. Obviously, the K(ReO
4) guest phase existed as a layer [
39] and thus practically did not change the primary dispersion of the CoRe and CoReMo oxide structures. It is important that the network formed by the interaction between the impregnated components and alumina support, as well as among the components themselves, as evidenced by UV-Vis DRS, is only mesoporous in agreement with the formation of nanosized Re, Co, and Mo metal oxide structures. The variation in the band gap energies within a very small interval of Eg = 3.36–3.97 eV also confirmed the absence of a large size change provoked by the K(ReO
4) crystal size and the preservation of nanosized metal oxide structures. In addition, practically no size differences between the CoReMo and K-CoReMo oxide structures were found. The Eg values showed the absence of a great variation in the particle size.
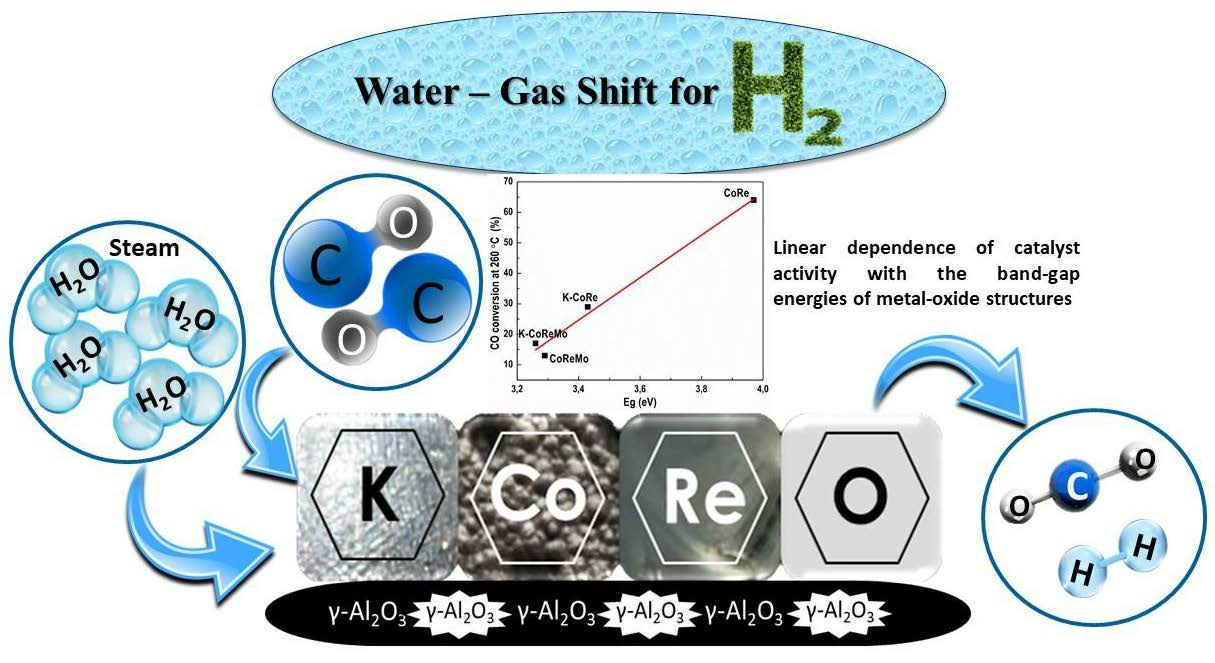
The CO conversion degree at 260 °C was selected for the activity evaluation. Under this condition, on the one hand, the differences between the catalyst composition and conversion were more pronounced. On the other hand, the mass transfer processes are determinative because of a specific feature of the WGS reaction. From this connection, a correlation between the Eg and catalyst activity was found, as displayed in
Figure 9. The latter reveals that the particle size of the supported oxide phase affects the performance of the (K)CoRe and (K)CoReMo catalysts. In addition, the reported band gap energy diminution with an increasing number of components reflects changes in the electronic properties of the multicomponent catalysts. When the dopant density is high, dopant states generate a band close to the valence or conduction band edge, which ultimately decreases the band gap. The band gap value drops upon the addition of potassium and molybdenum, showing a strong metal–support electronic interaction. The working structures should be a combination of the three redox couples of metal oxides like the Re
4+–Re
7+, Co
2+–Co
3+, and Mo
4+–Mo
6+ structures, thus assuming that the initial electronic properties may affect the catalytic ability in the WGS reaction.
The catalyst activation stage, due to the reduction in the CO/Ar reaction mixture of the weaker bonds in the oxide structures formed via a mild thermal treatment at 300 °C, plays a more decisive role in activity than component dispersion, which is an essential factor for facilitating the transport of reagent molecules to and from active sites.
The WGS reaction, which was explored via various routes, revealed that the optimal balance between the Re4+ and Re7+, as well as the Co2+ and Co3+, redox structures is more a determining cause with the CoRe and K-CoRe catalysts. Obviously, the presence of potassium favored better reducibility, leading to the formation of predominately Re4+ and Co2+ structures, which resulted in the lower activity of the K-CoRe catalyst compared to its CoRe counterpart. Also, the formation of the KReO4 crystal phase was not in favor of activity, either due to the crystal phase itself or just because this formation is related to weaker interactions between the Cox+ ions and Re-oxo species. These interactions increased when oxidizing agents were introduced into the feed. Indeed, the H2O steam and CO2 oxidizing agents induced hydrolysis and thus enhanced the K-CoRe activity during the WGS reaction. A clear dependence of the K-CoRe catalyst’s ability on the H2O/CO ratio was also evidence that potassium increased the reduced catalyst interface due to increased CO content in the reaction mixture when the amount of steam decreased. Thus, the reactivity of active species was decreased. The same was observed with the more complicated CoReMo and K-CoReMo compositions owing to an existing Mo4+/Mo6+ redox balance.
The stable and active behavior in the WGS reaction with a CoRe configuration, independent of the oxidizing reagent amount, confirmed that the Re and Co oxygen-containing structures exist at an appropriate ratio. Moreover, the CoRe catalyst has the highest activity even at lower contact times with the reactants. In agreement with Voronov et al. [
40], who claim that there is structure distortion due to intimate contact between the Co
x+- and Re-oxo species, we consider a change in electronic properties, leading to the highest surface reactivity during the WGS reaction. The DFT calculations showed that the adsorption affinity of both H
2O and CO toward cobalt oxide was found to be similar [
41]. The authors proposed that CO preferably chemisorbs on Co
3+ sites than Co
2+ sites, while in the presence of H
2O, a competitive adsorption between H
2O and CO molecules occurs. The Co-doping has its own contribution to WGS ability of the CoRe system through facilitating mechanism operation by Co
2+ and Co
3+ redox structures.
On the other hand, potassium promotes the stability of rhenium and cobalt oxygen-containing species to oxidation. Thus, potassium presence is a key factor in designing a durable K-CoRe catalyst under redox conditions. The potassium affects not only the structural, electronic, and reduction properties of the CoRe and CoReMo systems, but its introduction may also increase the synergism between Co and Re as well as between Co and Mo, as established in reports of the beneficial application of KCoRe and KCoMo systems in a sour WGS reaction [
16,
17]. Consequently, the H
2 yield and CO conversion degree would be positively affected. The synergetic effect would also cause an increase in the components’ dispersion of the redox Re
4+–Re
7+, Co
2+–Co
3+, and Mo
4+–Mo
6+ structures. The enhanced WGS activity of the potassium-modified catalysts during a long testing period is a convincing indication that synergism does exist. The optimization of the CoRe and CoReMo catalysts’ reducibility promoted by potassium is target-induced for improved performance in redox WGS conditions. It should be noted that alkali modifications suppress the methanation affinity of reduced catalysts, thus increasing the chemisorption of electron acceptors, such as CO, and impeding the chemisorption of electron donors, such as hydrogen. In this regard, a study by Singh et al. [
42] has shown that a K additive affects the surface electron density of the Pt/Co
3O
4–ZrO
2 catalyst and, in such a way, increases methanation selectivity.
Obviously, under the redox conditions of the WGS reaction, the reduction properties and formation of active metal oxide species of different reactivities are principal factors for the catalytic capability of potassium-modified and non-modified CoRe and CoReMo formulations.
Evidently, the experimental data indicate two important requirements for catalyst structure design to enhance WGS activity: optimized balance in redox structures and potassium modification. Finding appropriate reduction conditions, such as verifying the reducing agent, the optimal duration, and the temperature, is considered necessary for further development to increase catalytic activity.


 ,
, 


