Article

The Evolution of Hexagonal Cobalt Nanosheets for CO2 Electrochemical Reduction Reaction

State Key Laboratory of Applied Organic Chemistry, College of Chemistry and Chemical Engineering, Lanzhou University, Lanzhou 730000, China
*
Authors to whom correspondence should be addressed.
Catalysts 2023, 13(10), 1384; https://doi.org/10.3390/catal13101384
Submission received: 31 August 2023 / Revised: 18 October 2023 / Accepted: 19 October 2023 / Published: 21 October 2023

Abstract

:
The CO2 electrochemical reduction reaction (CO2RR) is one of the most promising methods to reduce carbon dioxide emissions and store energy. At the same time, the pathways of CO2 reduction reaction are diverse and the products are abundant. Converting carbon dioxide to C2+ products, a critical feedstock, requires a C–C coupling step with the transfer of more than 10 electrons per molecule and, hence, is kinetically sluggish. The production of some key adsorptions is conducive to the formation of C2+ products. In this work, we used in situ techniques to figure out the reason why hexagonal-close-packed (hcp) Co nanosheets (NSs) have high activity in CO2RR to ethanal. According to the in situ Raman spectra, the high local pH environment on the catalyst surface is favorable for CO2RR. The high pH at low potentials not only suppresses the competing hydrogen evolution reaction but also stimulates the production of COCO* intermediate. The isotopic labeling experiment in differential electrochemical mass spectrometry (DEMS) provides a possible sequence of the products. The 13CO is generated when we replace 12CO2 with 13CO2, which identifies the origin of the products. Besides, in situ electrochemical impedance spectroscopy (EIS) shows that the hcp Co at −0.4 V vs. RHE boosts the H2O dissociation and proton transfer, feeding sufficient H* for CO2 to *COOH. In the end, by analyzing the transmission electronic microscopy (TEM), we find that the Co (002) plane may be beneficial to the conversion of CO2 and the adsorption of intermediates.

Graphical Abstract

1. Introduction

With the continuous development of economy and society, the process of industrialization has been accelerated, and the continuous consumption of traditional energy has led to a series of environmental problems such as acid rain, global temperature rise, and land desertification [1,2,3]. In recent years, in order to reduce the harm caused by carbon dioxide emissions to the environment and society, researchers have paid more and more attention to the capture and conversion of CO2 and other related technologies [4]. Carbon dioxide can be converted into carbon monoxide, methane, formic acid, and other valuable chemical resources through thermal reduction, photoreduction, electrochemical reduction, and biological conversion [5]. Among them, the reaction of electrochemical reduction of carbon dioxide has many advantages, such as environmental protection, mild reaction operating conditions, and easy control of the reaction process, and has attracted a lot of attention from researchers [6,7]. Under the condition of controlling the catalyst and the catalytic reaction, the electrocatalytic reduction reaction of carbon dioxide can produce various chemical raw materials with economic value such as carbon monoxide, formic acid, methane, and ethanol [8,9]. In the electrocatalytic CO2 reduction process, simple carbon compounds such as CO and formic acid can be directly obtained through electron transfer and proton transfer. And, by forming adsorption intermediates (such as *CO), ethylene, ethanol, and other multi-carbon compounds can be further obtained through the C–C coupling step.
However, there are quite a few challenges or bottleneck issues that need to be addressed before this technology is deployed extensively in the industry, such as low reaction rate, energy efficiency (proportional to the total cell voltage), and product selectivity (Faradaic efficiency, FE) [10,11]. Carbon dioxide has a stable linear structure, and the stable carbon–oxygen double bond leads to the difficult reaction of electrocatalytic carbon dioxide reduction, which requires an efficient catalyst to drive the reaction. Based on our previous work [12], we found that the hcp Co has good activity for electrocatalytic carbon dioxide reduction.
With the development of electrocatalysis, exploring the mechanism of electrocatalysis and clarifying the structure–activity relationship are the key methods to solve the bottleneck of electrocatalysis development [13]. However, the previous test methods have not been able to monitor the catalytic intermediates and show the reaction path in real time. Therefore, it is very important to monitor the dynamic evolution process of catalyst intermediates in real time by using in situ characterization technology. The in situ characterization technique is an important means to determine the active site, chemical reaction mechanism, and the relationship between catalysts structure and performance and provides theoretical guidance for the design and development of efficient and stable catalysts.
In this work, we further analyze the production of good activity of Co in combination with the development of in situ techniques. Using in situ Raman spectroscopy to monitor the reaction process, we find that the high pH on the catalyst surface is beneficial for suppressing the HER and promoting the production of COCO* intermediate. Conclusions from our DEMS data challenge and refine our current mechanistic understanding of the mechanistic link from CO2 to ethanal by conducting isotope-labelled (12C/13C) experiments. Additionally, in situ electrochemical impedance spectroscopy (EIS) reveals that hcp Co at −0.4 V vs. RHE enhances water dissociation and proton transfer, providing ample H* for CO2 to *COOH. Moreover, transmission electronic microscopy (TEM) analysis indicates that the Co (002) plane may aid in CO2 conversion and intermediate adsorption.

2. Results

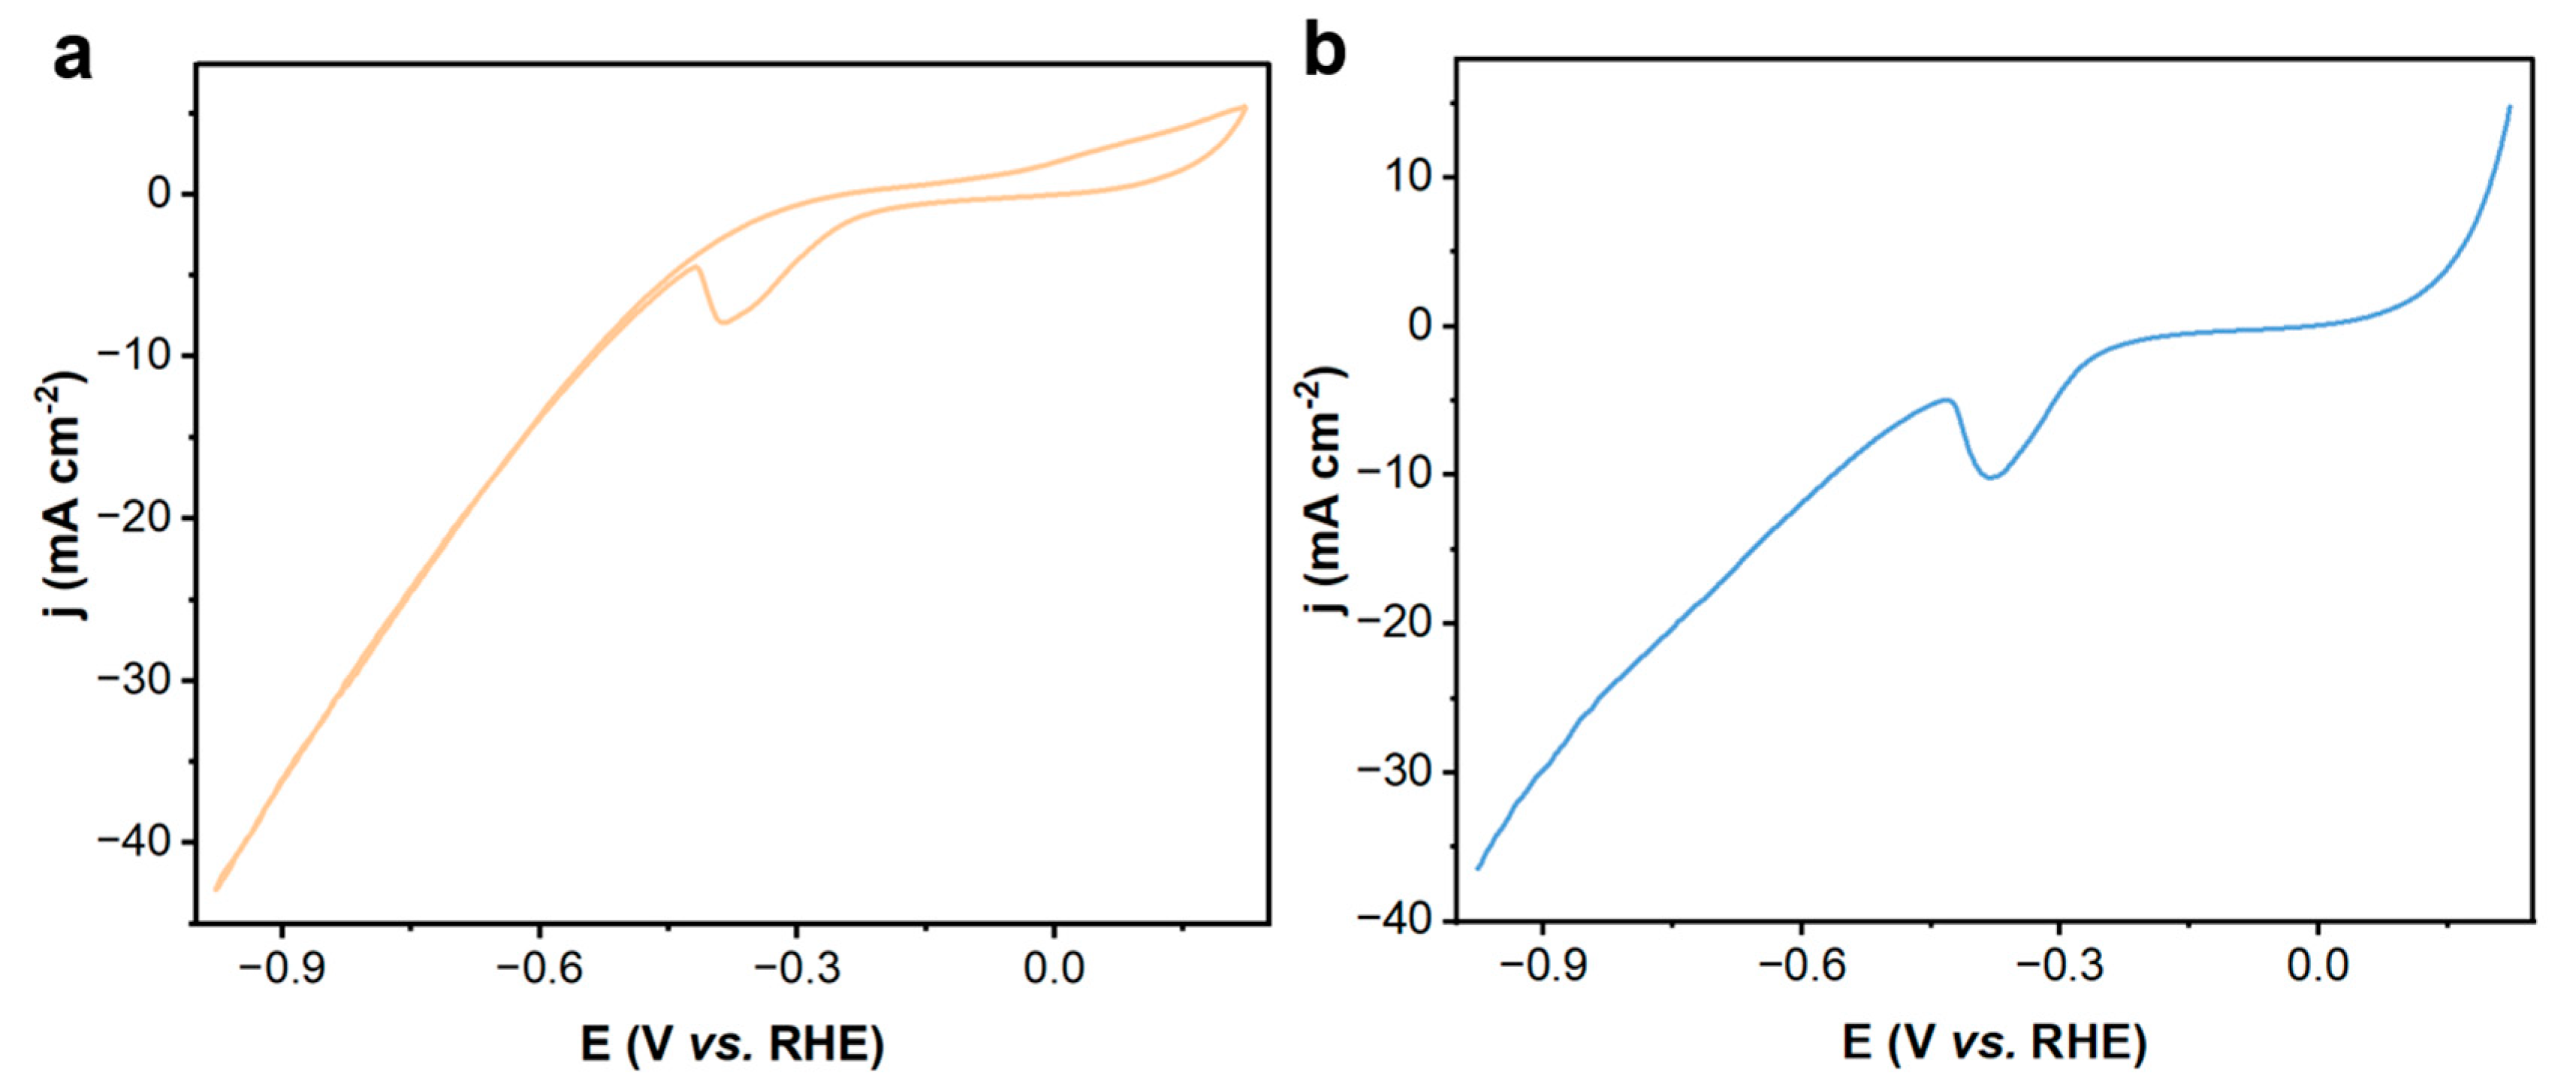
2.1. The Catalytic Properties

The cyclic voltammetry (CV) curve and linear sweep voltammetry (LSV) curve are shown in Figure 1. The hcp Co NSs was tested in CO2-saturated 0.5 M KHCO3 aqueous solution. The CV and LSV curves have obvious reduction peaks at −0.4 V, which is attributed to the reduction in CO2 on the Co surface. From −0.2 V to −1 V, the carbon dioxide reduction reaction occurs on the hcp Co NSs.

2.2. In Situ Raman Spectra

Raman spectroscopy is characterized by the frequency shift caused by interactions of matter and photons, which can reflect the microstructure information of matters, such as crystal lattice vibration as well as molecular rotation and vibration [14]. Electrochemical in situ Raman spectroscopy combines the characteristics of Raman spectroscopy and electrochemistry, which allows for the characterization of catalyst surface evolution and reaction intermediates present at the electrode/electrolyte interface during electrochemical reactions. Raman spectroscopy is a valuable analytical tool for the study of molecular and condensed matter systems, especially when coupled with electrochemistry. Hence, it offers a comprehensive evaluation of electrochemical reaction mechanisms at the molecular level. Low signal intensity, sample damage, and fluorescence disturbance are the main technical difficulties of electrochemical in situ Raman spectroscopy. Some solutions have been adopted, such as optimizing the wavelength, power, and exposure time of the incident laser; selecting proper optical windows; and reducing the distance between the optical window and working electrode. The Raman enhancement phenomenon plays a crucial role in amplifying the signal intensity of adsorbed reaction intermediates within complex electrochemical settings.
The study of the CO2 reduction reaction (CO2RR) pathways largely relies on theoretical calculations such as density functional theory (DFT), conducted on catalytically active nanostructures, which are subsequently confirmed by physicochemical characterization [15]. Currently, the proposed reaction pathways for CO, formate, and C2+ products such as ethylene and ethanol are the focus of research [5,16,17]. However, the presence and stability of the proposed reaction intermediates on the catalyst surface is not yet clearly understood. Electrochemical in situ Raman spectroscopy has been utilized to identify some of these intermediates, such as *CO, HCOO*, HOCCO*, and CH3CH2O*. In order to further advance the field, additional studies should aim to fully elucidate the mechanisms of CO2RR, in order to develop more efficient and effective catalysts.
Based on the previous CO2RR electrochemical window [12], a potential range from −0.18 to −0.88 V vs. reversible hydrogen electrode (RHE) was selected for in situ Raman spectral acquisitions of the hcp Co surface in CO2-saturated 0.5 M KHCO3 aqueous solution (Figure 2a). In situ Raman spectroscopy measurements were performed in a custom-made flow cell to explore how local pH values changed during the reaction. For the hcp Co surface, two broad Raman peaks appear around 1010 cm−1 and 1072 cm−1 assigned to absorbed carbonate (νCO32−) and bicarbonate (νHCO3) peaks, respectively. The wave numbers of HCO3 and CO32− peaks change as potential increases and their trends are different. As it is known, the local pH environment could greatly affect the product selectivity of CO2RR [18,19,20]. The integrated Raman peak area ratios for dissolved HCO3 and CO32− could be used to calculate the relative ratio of [HCO3] to [CO32−], which was related to the surface pH values near the electrode based on the Henderson−Hasselbach equation for a CO32−/HCO3 system. According to research, the higher the ratio of CO32−/HCO3, the higher the Ph [21]. So the pH for the hcp Co surface increases at the beginning and then decreases. As shown in Figure 2b,c, the wave number of peaks for HCO3 increases with increasing potential, while the wave number of the peaks for CO32− decreases. The C=O stretching range can be subdivided into three peaks based on adsorption configurations. Specifically, the range of 1800–1900 cm−1 pertains to *CO adsorption on hollow sites, while 1900–2000 cm−1 relates to *CO on bridge sites. Additionally, *CO on top sites (linearly *CO) corresponds to the range of 2000–2120 cm−1. The peak corresponding to *CO around 2095 cm−1 is classified as *CO on top sites and exhibits Stark shifts with potential and further shifts to 2085 cm−1 (Figure 2d). The intensity of this peak decreases with potential increases, and the peak is most evident in the low potential region. At the same time, the key carbon–carbon coupling intermediates such as COCO* and OCHO* appear in the low potential region from −0.2 to −0.5 V vs. RHE (Figure 2e,f). The wave number of the peak of COCO* decreases from 1453 cm−1 to 1436 cm−1 and the wave number of the peak of CCHO* decreases from 1520 cm−1 to 1497 cm−1, which is consistent with Stark shift. Usually, there are two recognized pathways for CO2 activation. The first method is to generate *CO2 via electron transfer at the interface, and the other way is to generate *COOH via concerted proton–electron transfer (CPET) (Equations (1) and (2)).
* + CO2 + e → *CO2
* + CO2 + e + H+ → *COOH
According to the in situ Raman spectra (Figure 2a), the *COOH is mainly generated on the hcp Co surface. To summarize, the elevated pH levels in the local environment act not only to suppress the competing hydrogen evolution reaction but also to create an imbalance of carbon atoms in the adsorbed COCO* intermediate. This imbalance is advantageous for the following proton–electron transfer step, leading to an acceleration in the production of C2+ products. These findings provide important insights into the mechanisms that control this reaction and may have significant implications for future research in this area [22,23]. This is why the Faraday efficiency of C2+ products is higher and it is easier to observe the peaks of key intermediates such as *CO, COCO*, and OCHO* at low potentials.

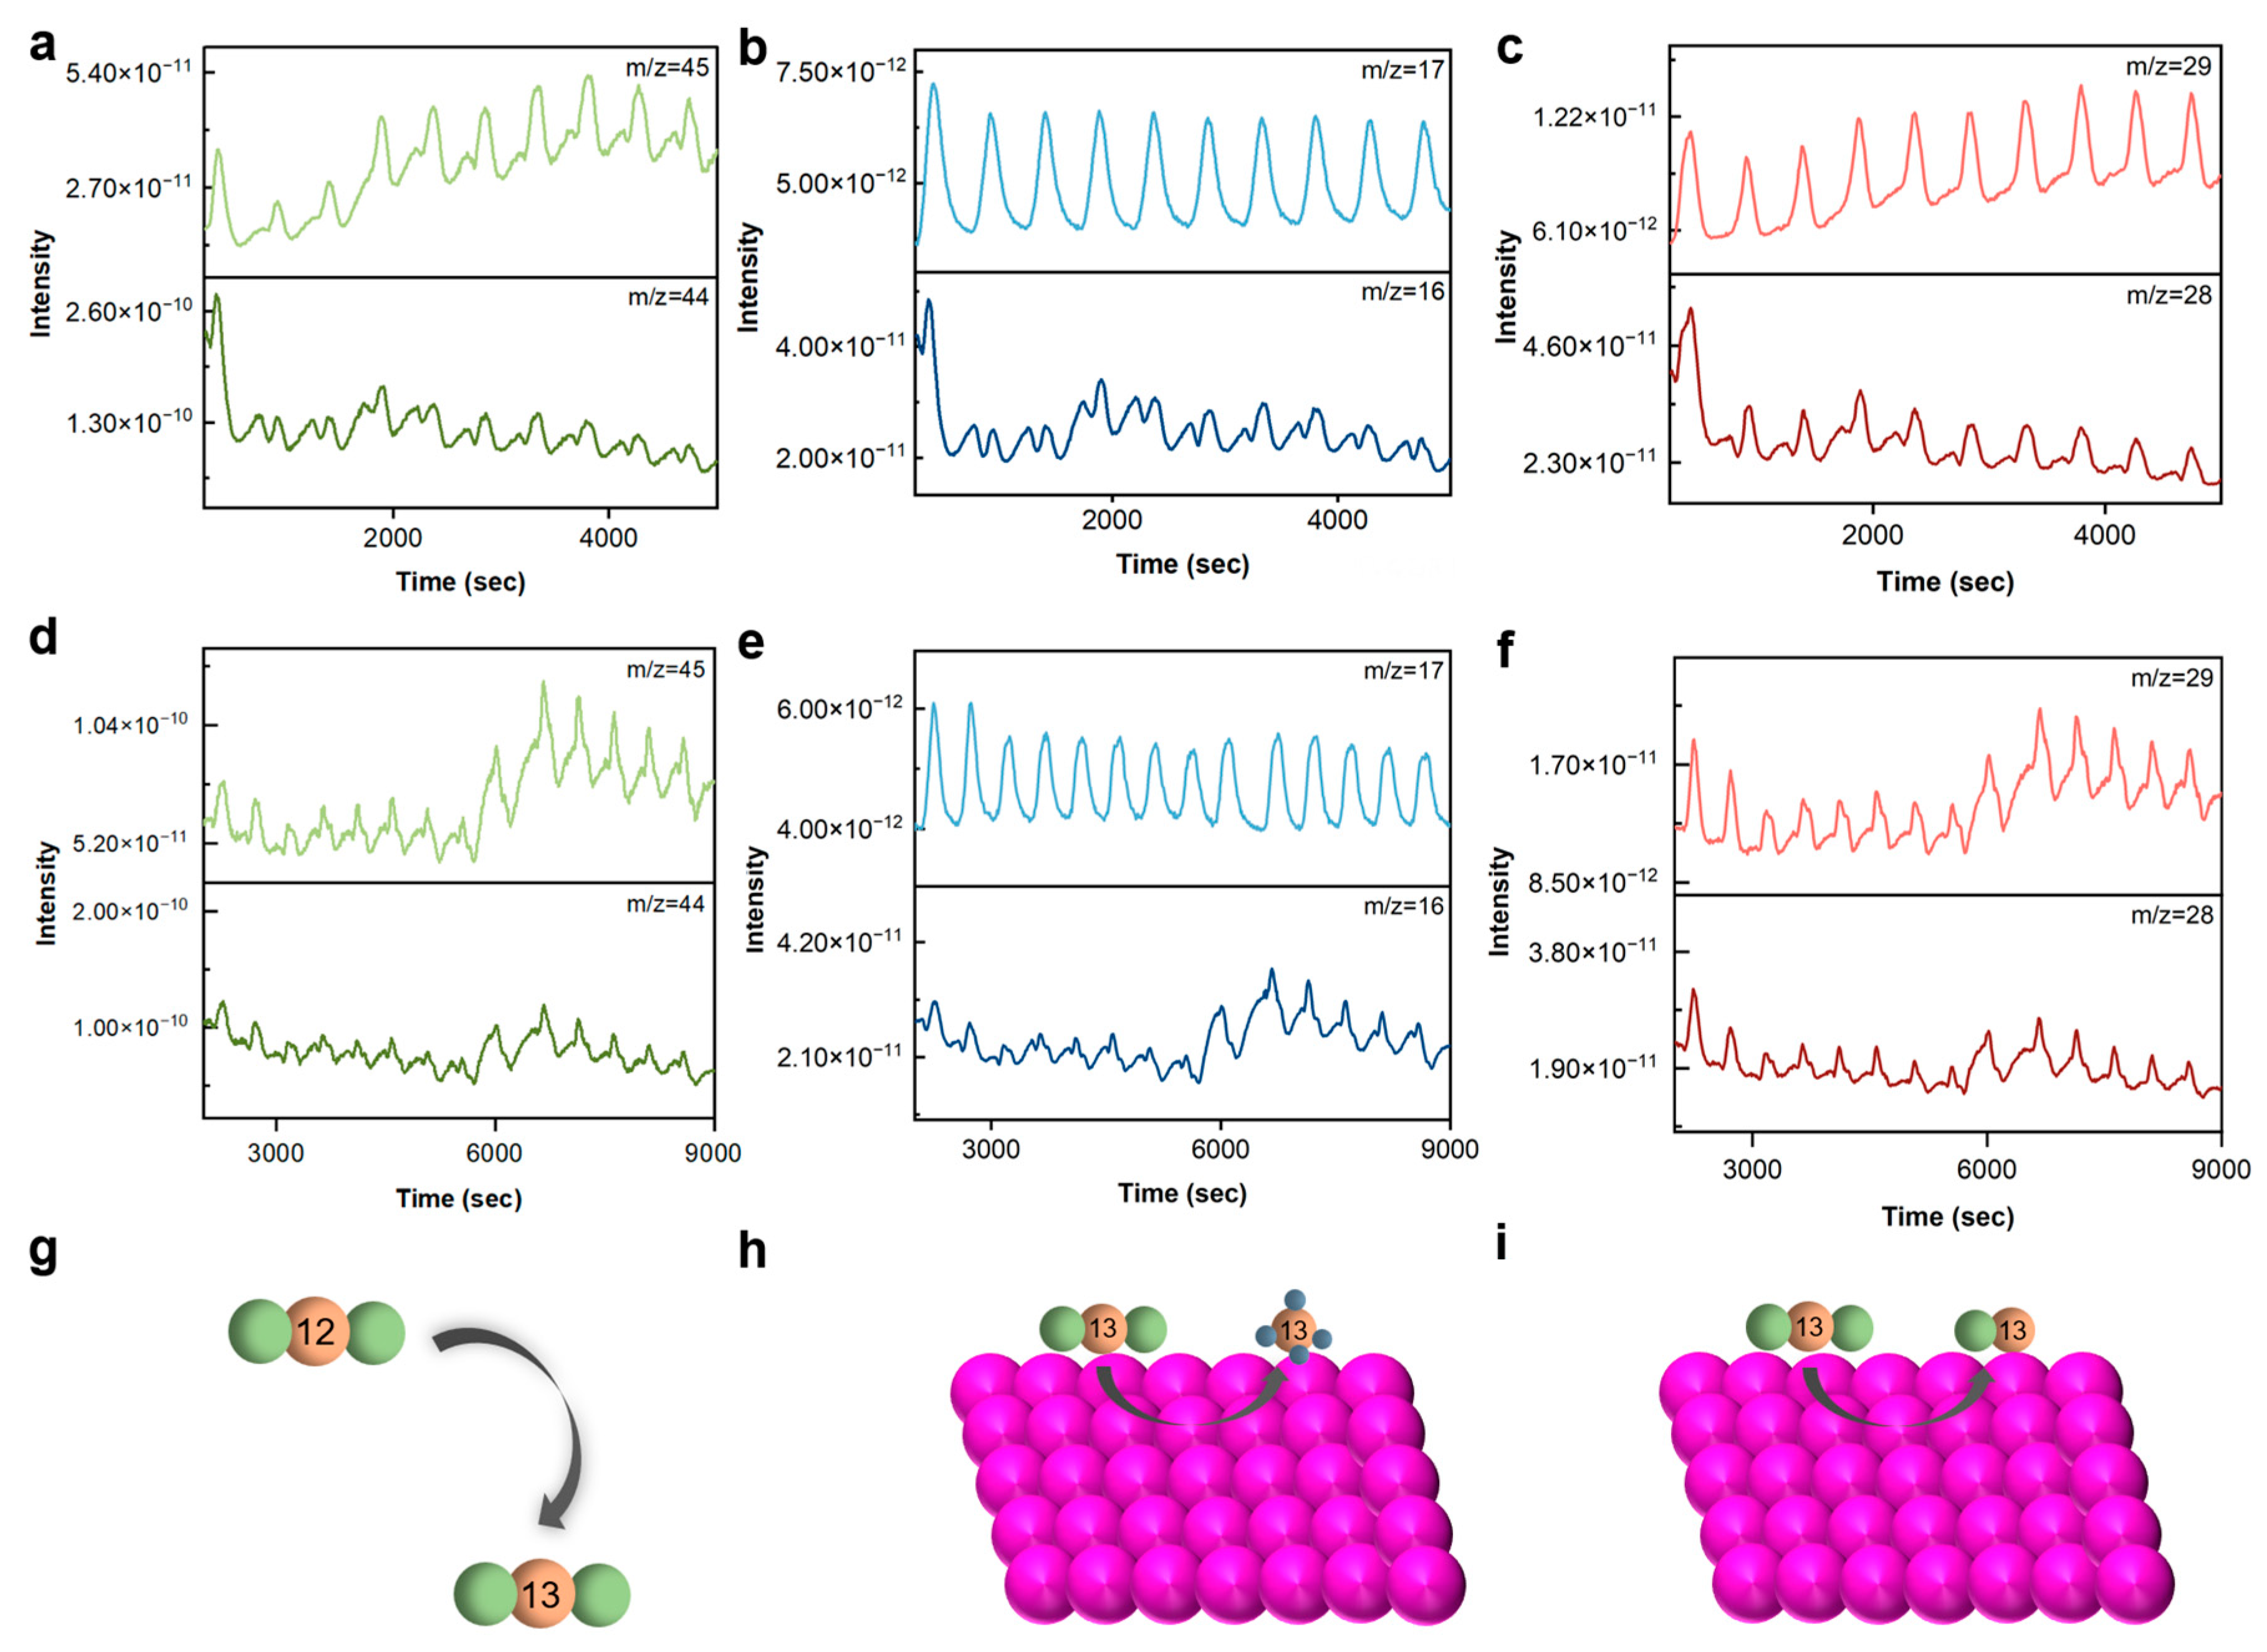
2.3. Differential Electrochemical Mass Spectrometry (DEMS)

DEMS measurements determine the selectivity for electrocatalysts to produce specific CO2 reaction products [24]. The DEMS technique has been employed to analyze the reaction products on the working electrode surface by determining the mass-to-charge ratio (m/z). This in situ method has been proven to be an effective tool in studying electrocatalytic surface modification and selectivity of solid-solutions electrocatalysts towards the conversion of CO2. In order to detect volatile and gas species generated at the catalyst surface during an applied potential, an electrochemical cell coupled to DEMS was used to monitor the products generated during the CO2 reduction reaction (CO2RR). The generated species from the cell reactor were defragmented at the quadrupole array in an HV chamber, which operates at an approximate pressure of 4 × 10⁻⁵ mbar. The defragmented species were then identified through the mass spectrometer detector and their perturbation were modulated as a current, named the ionic current or mass signal, based on the molecular weight determined using the mass-to-charge ratio (m/z). As part of the experimental procedure, cyclic voltammetry (CV) was employed to record the mass-to-charge ratio for key species such as methane (m/z = 16), carbon monoxide (m/z = 28), and carbon dioxide (m/z = 44) during cathodic polarization. The electrolyte used during the experiment was a saturated 0.5 M KHCO3 solution of CO2.
At first, we electrolyzed a CO2-saturated solution to detect the reaction products. The hcp Co present the signals m/z = 2, 16, 28, and 44, corresponding to H2, CH4, CO, and CO2, when applying a cyclic voltammetry of 0 to −1 V vs. RHE. Moreover, for the hcp Co electrocatalysts, it is important to note that the magnitude of the ionic current related to CO (m/z = 28) is an order of magnitude higher than CH4 (m/z = 16), suggesting that CO generation and the intrinsic properties of the catalyst, in turn, modulate the selectivity and conversion of the CO2RR. Then, we replace 12CO2 with 13CO2. As the number of cycles increases, the signal of m/z = 44 corresponding to 12CO2 decreases and the signal of m/z = 45 corresponding to 13CO2 increases (Figure 3a,d). At the same time, the signal of m/z = 28 corresponding to 12CO decreases and the signal of m/z = 29 corresponding to 13CO increases (Figure 3c,f), confirming that CO was produced during the reaction.
DEMS suggests that a potential product sequence resulting from electrochemical CO2 reduction is illustrated in Equations (3)–(5), with hydrogen creation as a secondary reaction.
CO2 + 2H+ + 2e →CO + H2O
CO2 + 8H+ + 8e → CH4 + 2H2O
2H+ + 2e → H2

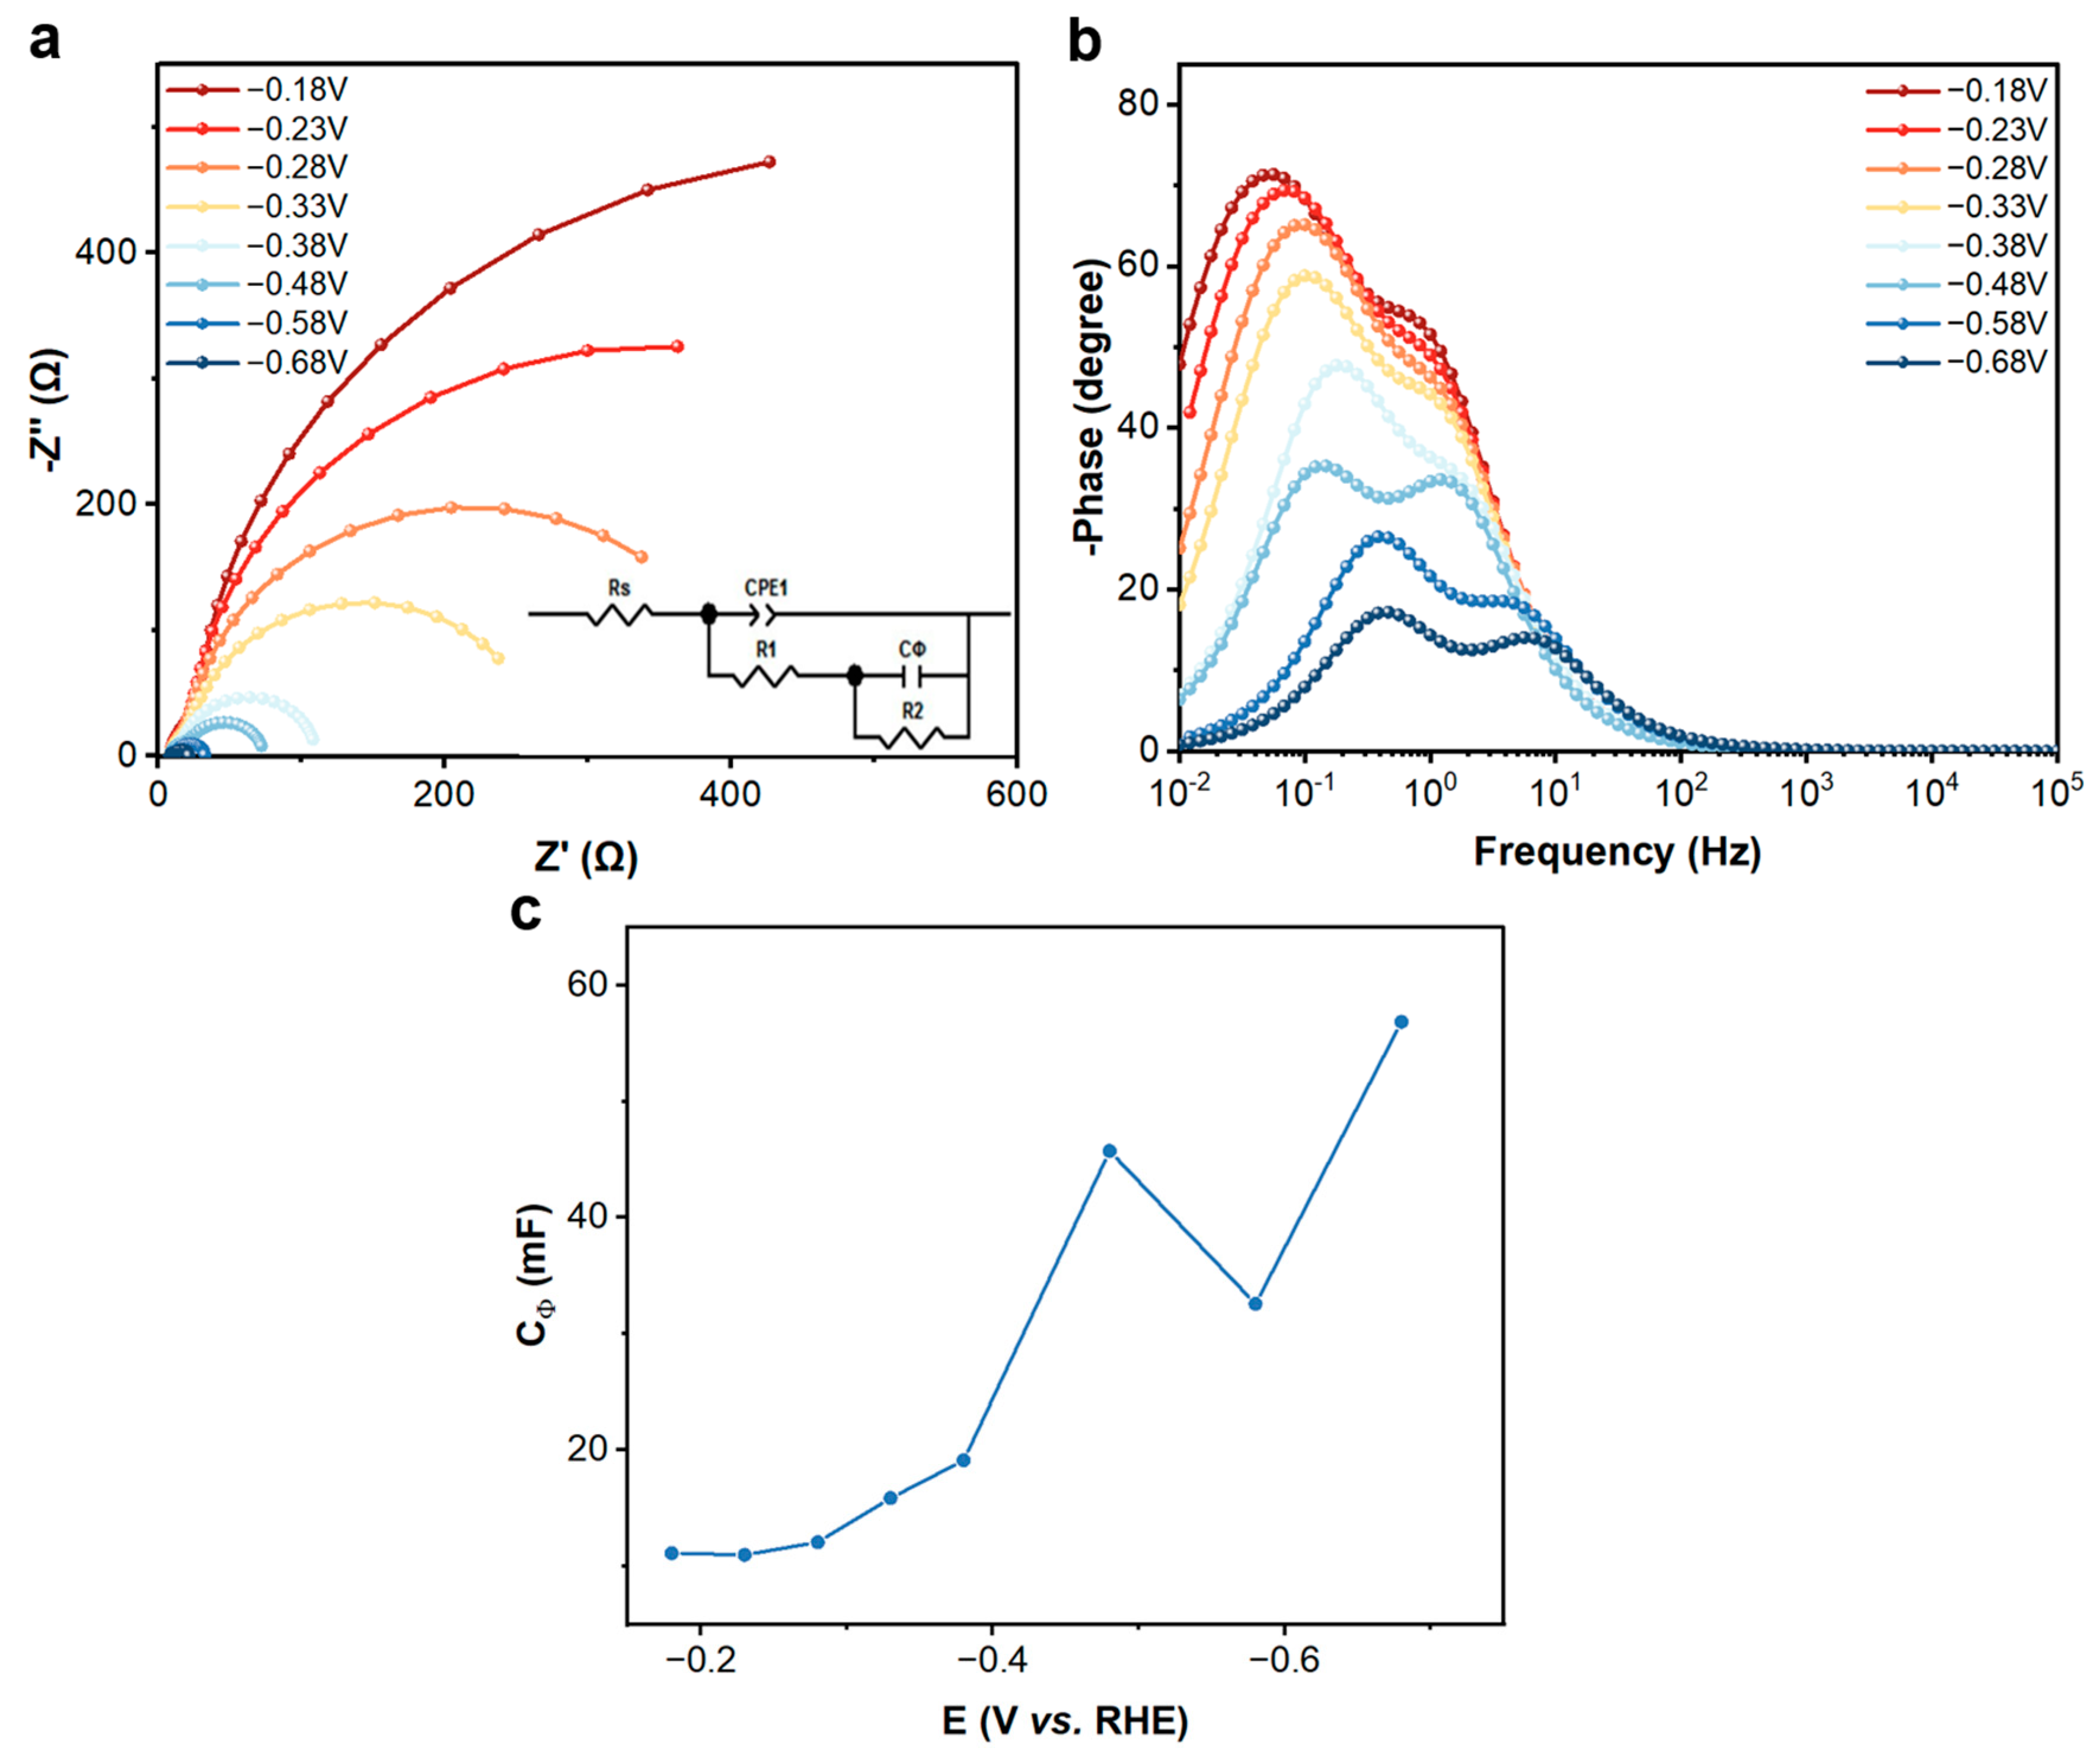
2.4. In Situ Electrochemical Impedance Spectroscopy (EIS)

Electrochemical impedance spectroscopy (EIS) can help overcome this information gap by accurately quantifying the resistances of microscopic processes (such as charge transfer, mass transport of reactants, and species adsorption) reflected in the impedance spectrum [25]. The primary challenge is to accurately identify the specific processes exhibited within the impedance spectrum and correctly attribute these characteristics to the corresponding physical phenomena.
Electrochemical impedance spectroscopy (EIS) was conducted using a CHI760 electrochemical workstation from Chenhua, China. During the EIS experiment, a sine wave AC signal was applied to the reactor, and the resulting response signal generated by the reactor system was observed. This allowed for the analysis of the electrode impedance. By introducing a series of sine wave signals that transition from high frequency to low frequency, an impedance spectrum was generated, which is known as electrochemical impedance spectroscopy. Typically, EIS data are analyzed through an equivalent electrical circuit that is made up of various elements, such as resistances and capacitances. This circuit is designed to mimic the electrical behavior of the system under study and provides quantitative information about the processes involved in the reaction. By analyzing the circuit, it is possible to identify the internal resistance of the system and the transmission resistance of electrons from the catalyst surface to the reaction interface. These parameters can be utilized to evaluate the strengths and weaknesses of the reaction system. In this study, specific parameters were set at a high frequency of 105 Hz and a low frequency of 0.01 Hz while varying the reaction potential. During the experiment, the frequency was decreased from high to low, the corresponding signal values were recorded, and a series-parallel circuit was fitted. The Nyquist curve was then plotted using the real part Z′ of the complex impedance Z as the abscissa and the opposite number of the imaginary part -Z″ as the ordinate.
EIS is a valuable tool in investigating charge transfer and transport processes involved in electrocatalytic reactions, such as CO2 reduction reactions (CO2RR) [26]. In CO2RR, the method provides mechanistic indications for processes controlling reactivity. In a study conducted by Bienen et al. [27,28], they identified four main features in the EIS curves of a gas diffusion electrode (GDE) with tin-based electrocatalysts supported on carbon for CO2RR to formate and CO. These features include ionic and electronic conductivity in the porous system, the reaction of CO2 with OH to form bicarbonate, charge transfer converting CO2 (aq) to CO2, and liquid phase diffusion of CO2 (aq). The reaction dominating the shape of the EIS curve varies with different temperatures, CO2 volume fraction, current density, and electrolytes. Overall, EIS provides excellent insight into the dominant processes based on electrode characteristics and operating conditions.
Given that both the HER and CO2RR take place simultaneously on the same electrode, it is critical to accurately determine which reaction dominates the processes depicted in the impedance spectrum before using the EIS results to assess catalysts. Based on our knowledge, there are no detailed EIS investigations on cobalt foil for CO2RR in aqueous KHCO3 solution or for CO2RR on the whole. As such, a comprehensive examination, outlined in this article, is imperative to gain a deeper understanding of the processes exhibited in the impedance spectrum. This technical document is aimed at our peers in the field and emphasizes the importance of unequivocally establishing the prevailing reaction before interpreting and drawing conclusions from EIS analyses.
The utilization of hcp Co catalyst in CO2 hydrogenation has been found to enhance the mass transfer properties, as confirmed through electrochemical impedance spectroscopy (EIS) analysis. The results of this study are presented in Figure 4. The improved kinetics of H2O activation and the subsequent protonation step led us to investigate the adsorption of hydrogen (H*) over the surface of the catalyst, using in situ EIS measurements [29,30,31]. The double-parallel equivalent circuit model was used to simulate the Nyquist plots (Figure 4a). The adsorption pseudo-capacitance (Cφ) referring to the H* adsorption charge can be applied to depict the H* coverage [29,32,33]. The intersection of the semicircle and the X-axis represents the internal resistance of the electrolyte and electrode, known as the solution ohmic resistance (Rs), which remained relatively constant throughout the measurements [27,34,35]. The radius of the semicircle in the Nyquist plot reflects the charge transfer resistance (Rct). At −0.4 V vs. RHE, we observed that the hcp Co catalyst exhibited a lower interface charge transfer resistance, which indicated that electrons could more easily transfer from the electrode to the adsorbed CO2 molecules, facilitating the formation of the reduced intermediate carboxylate *CO2 (* denotes the surface-coordinated state of the ligand and is the rate-determining step of CO2RR). Since the high-frequency process displays a charge transfer reaction affected by CO2, the hcp Co at −0.4 V vs. RHE has the modest condition for charge transfer reaction. That is to say, the hcp Co at −0.4 V vs. RHE boosts the H2O dissociation and proton transfer, feeding sufficient H* for CO2 to *COOH.

2.5. Quasa In Situ Transmission Electronic Microscopy (TEM)
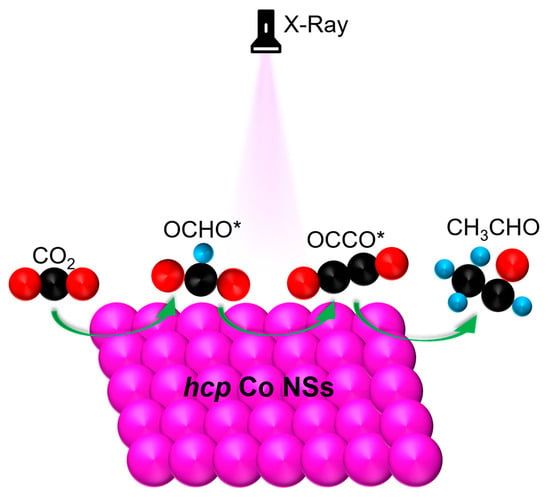
Figure 5 represents TEM images and inverse Fast Fourier Transform (FFT) representations to determine the lattice distance. Comparing the morphologies of the three samples after the CO2RR tests at −0.28 V (Figure 5a), −0.38 V (Figure 5b), and −0.48 V (Figure 5c), there is no significant difference among them. The blue frame was processed to obtain the FFT image and determine the interplanar distance. The inverse FFT exhibits an interplanar distance of 0.206 nm attributed to the Co (002) plane, which is obtained after CO2RR at −0.38 V vs. RHE (Figure 5d). The inverse FFT exhibits an interplanar distance of 0.212 nm attributed to the Co (100) plane, which is obtained after CO2RR at −0.48 V vs. RHE (Figure 5e). The inverse FFT exhibits an interplanar distance of 0.205 nm attributed to the Co (002) plane, which is obtained after CO2RR at −0.58 V vs. RHE (Figure 5f). Such analysis indicates that the Co (002) plane may be beneficial for the conversion of CO2 and the adsorption of intermediates.

3. Discussion

According to the in situ Raman spectra on hcp Co surface especially at low potentials, the high local pH environment not only suppresses the competing hydrogen evolution reaction but also induces the charge imbalance of the carbon atoms in the adsorbed COCO* intermediate, which is beneficial for the subsequent proton–electron transfer step, thus accelerating the C2+ product generation. DEMS provided access to the evolution of the product. The concerted shift of CO2 and CO demonstrated their close mechanistic link. Those of CO2 and CH4, by contrast, remained unaffected. In situ EIS revealed that the catalyst at −0.4 V vs. RHE exhibited a lower interface charge transfer resistance and a modest charge transfer reaction condition, boosting the H2O dissociation and proton transfer. The TEM and HRTEM suggested that the main exposed plane Co (002) at −0.4 V vs. RHE is favorable for CO2 conversion and adsorption of intermediates. Therefore, the hcp Co is a promising catalyst for CO2RR to ethanal.

4. Materials and Methods

4.1. Materials

Preparation was carried out using standard procedures and commercially available reagents. Cobalt (II) chloride hexahydrate (CoCl2·6H2O, ≥99%), ethylenediamine tetra-acetic acid (EDTA, ≥99.9), sodium hydroxide (NaOH, ≥98%), hydrazine hydrate (H2NNH2·H2O, ≥80%), ethanol (C2H5OH, ≥99.7%), polyvinylidene fluoride (PVDF), carbon black (Kejen EC 600J, Japan), potassium bicarbonate (KHCO3, ≥99.5%), N-methylpyrrolidone (NMP, ≥99%), Nafion solution, carbon paper, and 13CO2 gas were all purchased from Sigma Aldrich (Germany). Deionized water (18.2 MΩ) was used in the experiments.

4.2. Synthesis of Materials

4.2.1. Synthesis of hcp Co NSs

A total of 1.44 g CoCl2·6H2O and 3.52 g EDTA were mixed in 48 mL water and stirred for 15 min to form a CoCl2 solution. Then, 6 g NaOH was dissolved in 10 mL water and added to the stirred CoCl2 solution. A further 15 min later, 20 mL H2NNH2·H2O and 75 mL C2H5OH were added into the solution which was stirred for another 5 min. Then, the solution was transferred into the Teflon-lined stainless-steel autoclave and maintained at 160 °C for 5 h. After being cooled to room temperature, the product was washed with water/ethanol followed by centrifugation at 9000 rpm for 10 min.

4.2.2. Preparation of Working Electrodes

The preparation procedure for the working electrode was described as follows: 10 mg catalyst as-prepared was mixed with 2.5 mg carbon black, 2 mg PVDF, and a few drops of NMP to produce catalyst paste. The paste was coated on a 0.5 cm × 1.0 cm carbon paper (TGP-H-060, Toray, Japan), which was dried in a vacuum oven overnight and served as a working electrode. For in situ Raman tests, it was painted a 2 cm × 2 cm carbon paper. For DEMS (Linglu, Shanghai, China) tests, 3 mg of dried catalyst powder was mixed with 3 mg carbon black, 2940 μL mixture solution (EtOH: H2O = 1:1), and 60 μL Nafion under sonication for 2 h to make sure the concentration of the catalyst was 2 mg/mL. Then, the above obtained ink (50 µL) was dispersed on the gold film.

4.3. Electrochemical Measurements

Electrochemical measurements were conducted within H-type electrolytic cells using a CHI760E (CH Instruments, Inc., Shanghai, China) electrochemical workstation, and a three-electrode test was carried out in an H-cell that was separated by a Nafion-117 membrane (Dupont, DE, USA). A Pt plate served as a counter electrode, and Ag/AgCl (saturated KCl) acted as the reference electrode. The experiment was conducted in CO2-saturated 0.5 M KHCO3, and CO2 gas was injected for 30 min before the tests. All the potentials in this work were calibrated to RHE by the E (vs. RHE) = E (vs. Ag/AgCl) + 0.197 V + 0.0592 × pH. The EIS measurements were performed in CO2-saturated 0.5 M KHCO3 solutions with an amplitude of 5 Mv of 0.01 Hz to 10 kHz at different potentials.

4.4. In-Situ Raman Spectra Measurements

Raman spectra (LabRam HR Evolution, Japan) were obtained in a custom-built Raman flow cell in a 532 nm excitation laser. Before the experiments, calibration was carried out based on the peak at 520 cm−1 of a silicon wafer standard. The measurements were carried out in a three-electrode cell. Typically, Ag/AgCl and Pt wire were used as the reference electrode and counter electrode, respectively, while the working electrode was prepared by the catalyst coated on carbon paper. A 0.5 M CO2-saturated KHCO3 was taken as the electrolyte. To acquire the information about the Co electroreduction process, in situ Raman was taken on the Raman spectrometer equipped using a 532 nm excitation laser. The applied potential was held at −0.2 V to −1 V versus RHE and the Raman signals were recorded at different potentials for 100 s.

4.5. Differential Electrochemical Mass Spectrometry (DEMS) Measurement

DEMS was performed using a custom-built electrolytic cell. The measurements were carried out in a three-electrode cell. Typically, Ag/AgCl and Pt wire were taken as the reference electrode and counter electrode, respectively, while the working electrode was prepared using the catalyst dried on gold film. A 0.5 M CO2-saturated KHCO3 was taken as the electrolyte. We performed a continuous DEMS measurement while cycling the potential between −0.2 V versus RHE and −1.0 V versus RHE.

4.6. Quasa In Situ Transmission Electronic Microscopy (TEM) Measurement

More detailed morphology and structure of the product were analyzed using transmission electron microscopy (TEM) and high resolution transmission electron microscopy (HRTEM) at an acceleration potential of 300 kV with a FEI Tecnai G2 F30 (FEI, OR, USA). The samples were produced after applying the potentials at −0.2 V, −0.3 V, −0.4 V, and −0.5 V using a three-electrode cell. Typically, Ag/AgCl and Pt wire were used as the reference electrode and counter electrode, respectively, while the working electrode was prepared using the catalyst painted on carbon paper. The samples were dispersed in mixture solution (EtOH: H2O = 1:1), ultrasonicated, and dried on Cu grids with a holey carbon film.

5. Conclusions

In this work, we have studied the reason why the hcp Co NSs has high activity in CO2RR. Due to the optimal conditions for proton–electron transfer concluded from in situ Raman spectra and in suit EIS, the catalyst at −0.4 V vs. RHE exhibits the highest Faraday efficiency of ethanal. The DEMS measurement provides the evidence for CO2RR, which can be a promising method to explore the mechanisms of CO2RR. Combining the in situ techniques is more conducive to inferring reaction pathways and, thus, establishing structure-effective relationships to guide the synthesis of catalysts.

Author Contributions

Q.L.: Investigation, methodology, formal analysis, data curation, and writing—original draft preparation; J.Y.: methodology, data curation and editing, and funding acquisition; Y.H.: writing—review and editing; P.X.: writing—review and editing, and funding acquisition. All authors have read and agreed to the published version of the manuscript.

Funding

This work was funded by the National Natural Science Foundation of China (NSFC) (22201115), the Fundamental Research Funds for the Central Universities (lzujbky-2023-eyt03). J.Y. acknowledges the support of the Natural Science Foundation of Gansu Providence (22JR5RA540) and Gansu Province Youth Science and Technology Talent Promotion Project (GXH202220530-02).

Data Availability Statement

Data are contained within the article.

Conflicts of Interest

There are no conflicts to declare.

References

  1. Zhu, D.D.; Liu, J.L.; Qiao, S.Z. Recent Advances in Inorganic Heterogeneous Electrocatalysts for Reduction of Carbon Dioxide. Adv. Mater. 2016, 28, 3423–3452. [Google Scholar] [CrossRef] [PubMed]
  2. Duan, X.; Xu, J.; Wei, Z.; Ma, J.; Guo, S.; Wang, S.; Liu, H.; Dou, S. Metal-Free Carbon Materials for CO2 Electrochemical Reduction. Adv. Mater. 2017, 29, 1701784. [Google Scholar] [CrossRef] [PubMed]
  3. Kerimkulova, A.R.; Azat, S.; Velasco, L.; Mansurov, Z.A.; Lodewyckx, P.; Tulepov, M.I.; Makpal, R.; Berezovskaya, B.; Imangazy, A. Granular rice husk-based sorbents for sorption of vapors of organic and inorganic matters. J. Chem. Technol. Metall. 2019, 54, 578–584. [Google Scholar]
  4. Wang, G.; Chen, J.; Ding, Y.; Cai, P.; Yi, L.; Li, Y.; Tu, C.; Hou, Y.; Wen, Z.; Dai, L. Electrocatalysis for CO2 conversion: From fundamentals to value-added products. Chem. Soc. Rev. 2021, 50, 4993–5061. [Google Scholar] [CrossRef]
  5. Ma, W.; He, X.; Wang, W.; Xie, S.; Zhang, Q.; Wang, Y. Electrocatalytic reduction of CO2 and CO to multi-carbon compounds over Cu-based catalysts. Chem. Soc. Rev. 2021, 50, 12897–12914. [Google Scholar] [CrossRef]
  6. Tan, X.; Yu, C.; Ren, Y.; Cui, S.; Li, W.; Qiu, J. Recent advances in innovative strategies for the CO2 electroreduction reaction. Energy Environ. Sci. 2021, 14, 765–780. [Google Scholar] [CrossRef]
  7. Zhang, B.; Jiang, Y.; Gao, M.; Ma, T.; Sun, W.; Pan, H. Recent progress on hybrid electrocatalysts for efficient electrochemical CO2 reduction. Nano Energy 2021, 80, 105504. [Google Scholar] [CrossRef]
  8. Kortlever, R.; Shen, J.; Schouten, K.J.P.; Calle-Vallejo, F.; Koper, M.T.M. Catalysts and Reaction Pathways for the Electrochemical Reduction of Carbon Dioxide. J. Phys. Chem. Lett. 2015, 6, 4073–4082. [Google Scholar] [CrossRef]
  9. Wang, Y.; Liu, J.; Wang, Y.; Al-Enizi, A.M.; Zheng, G. Tuning of CO2 Reduction Selectivity on Metal Electrocatalysts. Small 2017, 13, 1701809. [Google Scholar] [CrossRef]
  10. Jouny, M.; Luc, W.; Jiao, F. General Techno-Economic Analysis of CO2 Electrolysis Systems. Ind. Eng. Chem. Res. 2018, 57, 2165–2177. [Google Scholar] [CrossRef]
  11. Shin, H.; Hansen, K.U.; Jiao, F. Techno-economic assessment of low-temperature carbon dioxide electrolysis. Nat. Sustain. 2021, 4, 911–919. [Google Scholar] [CrossRef]
  12. Yin, J.; Yin, Z.; Jin, J.; Sun, M.; Huang, B.; Lin, H.; Ma, Z.; Muzzio, M.; Shen, M.; Yu, C.; et al. A New Hexagonal Cobalt Nanosheet Catalyst for Selective CO2 Conversion to Ethanal. J. Am. Chem. Soc. 2021, 143, 15335–15343. [Google Scholar] [CrossRef] [PubMed]
  13. Lv, J.J.; Yin, R.; Zhou, L.; Li, J.; Kikas, R.; Xu, T.; Wang, Z.J.; Jin, H.; Wang, X.; Wang, S. Microenvironment Engineering for the Electrocatalytic CO2 Reduction Reaction. Angew. Chem. Int. Ed. 2022, 61, e202207252. [Google Scholar] [CrossRef]
  14. Hess, C. New advances in using Raman spectroscopy for the characterization of catalysts and catalytic reactions. Chem. Soc. Rev. 2021, 50, 3519–3564. [Google Scholar] [CrossRef]
  15. Li, H.; Wei, P.; Gao, D.; Wang, G. In situ Raman spectroscopy studies for electrochemical CO2 reduction over Cu catalysts. Curr. Opin. Green Sustain. Chem. 2022, 34, 100589. [Google Scholar] [CrossRef]
  16. Chen, L.D.; Urushihara, M.; Chan, K.; Nørskov, J.K. Electric Field Effects in Electrochemical CO2 Reduction. ACS Catal. 2016, 6, 7133–7139. [Google Scholar] [CrossRef]
  17. Zhi, X.; Vasileff, A.; Zheng, Y.; Jiao, Y.; Qiao, S.-Z. Role of oxygen-bound reaction intermediates in selective electrochemical CO2 reduction. Energy Environ. Sci. 2021, 14, 3912–3930. [Google Scholar] [CrossRef]
  18. Yoon, Y.; Hall, A.S.; Surendranath, Y. Tuning of Silver Catalyst Mesostructure Promotes Selective Carbon Dioxide Conversion into Fuels. Angew. Chem. Int. Ed. 2016, 55, 15282–15286. [Google Scholar] [CrossRef] [PubMed]
  19. Hall, A.S.; Yoon, Y.; Wuttig, A.; Surendranath, Y. Mesostructure-Induced Selectivity in CO2 Reduction Catalysis. J. Am. Chem. Soc. 2015, 137, 14834–14837. [Google Scholar] [CrossRef]
  20. Varela, A.S.; Kroschel, M.; Reier, T.; Strasser, P. Controlling the selectivity of CO2 electroreduction on copper: The effect of the electrolyte concentration and the importance of the local pH. Catal. Today 2016, 260, 8–13. [Google Scholar] [CrossRef]
  21. Zhao, Y.; Zu, X.; Chen, R.; Li, X.; Jiang, Y.; Wang, Z.; Wang, S.; Wu, Y.; Sun, Y.; Xie, Y. Industrial-Current-Density CO2-to-C2+ Electroreduction by Anti-swelling Anion-Exchange Ionomer-Modified Oxide-Derived Cu Nanosheets. J. Am. Chem. Soc. 2022, 144, 10446–10454. [Google Scholar] [CrossRef]
  22. Goyal, A.; Marcandalli, G.; Mints, V.A.; Koper, M.T.M. Competition between CO2 Reduction and Hydrogen Evolution on a Gold Electrode under Well-Defined Mass Transport Conditions. J. Am. Chem. Soc. 2020, 142, 4154–4161. [Google Scholar] [CrossRef]
  23. Zhang, F.; Co, A.C. Direct Evidence of Local pH Change and the Role of Alkali Cation during CO2 Electroreduction in Aqueous Media. Angew. Chem. Int. Ed. 2020, 59, 1674–1681. [Google Scholar] [CrossRef] [PubMed]
  24. Mora-Hernandez, J.M.; González-Suárez, W.I.; Manzo-Robledo, A.; Luna-Trujillo, M. A comparative differential electrochemical mass spectrometry (DEMS) study towards the CO2 reduction on Pd, Cu, and Sn -based electrocatalyst. J. CO2 Util. 2021, 47, 101504. [Google Scholar] [CrossRef]
  25. Reitz, W. A Review of: “Impedance Spectroscopy, Theory, Experiment, and Applications”. Mater. Manuf. Process. 2006, 21, 425. [Google Scholar] [CrossRef]
  26. Ampelli, C.; Tavella, F.; Giusi, D.; Ronsisvalle, A.M.; Perathoner, S.; Centi, G. Electrode and cell design for CO2 reduction: A viewpoint. Catal. Today 2023, 421, 114217. [Google Scholar] [CrossRef]
  27. Bienen, F.; Kopljar, D.; Geiger, S.; Wagner, N.; Friedrich, K.A. Investigation of CO2 Electrolysis on Tin Foil by Electrochemical Impedance Spectroscopy. ACS Sustain. Chem. Eng. 2020, 8, 5192–5199. [Google Scholar] [CrossRef]
  28. Bienen, F.; Kopljar, D.; Löwe, A.; Geiger, S.; Wagner, N.; Klemm, E.; Friedrich, K.A. Revealing Mechanistic Processes in Gas-Diffusion Electrodes During CO2 Reduction via Impedance Spectroscopy. ACS Sustain. Chem. Eng. 2020, 8, 13759–13768. [Google Scholar] [CrossRef]
  29. Li, J.; Liu, H.-X.; Gou, W.; Zhang, M.; Xia, Z.; Zhang, S.; Chang, C.-R.; Ma, Y.; Qu, Y. Ethylene-glycol ligand environment facilitates highly efficient hydrogen evolution of Pt/CoP through proton concentration and hydrogen spillover. Energy Environ. Sci. 2019, 12, 2298–2304. [Google Scholar] [CrossRef]
  30. Damian, A.; Omanovic, S. Ni and NiMo hydrogen evolution electrocatalysts electrodeposited in a polyaniline matrix. J. Power Sources 2006, 158, 464–476. [Google Scholar] [CrossRef]
  31. Krstajić, N.V.; Grgur, B.N.; Mladenović, N.S.; Vojnović, M.V.; Jakšić, M.M. The determination of kinetics parameters of the hydrogen evolution on TiNi alloys by ac impedance. Electrochim. Acta 1997, 42, 323–330. [Google Scholar] [CrossRef]
  32. Chen, S.; Wang, S.; Hao, P.; Li, M.; Zhang, Y.; Guo, J.; Ding, W.; Liu, M.; Wang, J.; Guo, X. N,O-C Nanocage-mediated high-efficient hydrogen evolution reaction on IrNi@N,O-C electrocatalyst. Appl. Catal. B Environ. 2022, 304, 120996. [Google Scholar] [CrossRef]
  33. Chen, S.; Li, X.; Kao, C.W.; Luo, T.; Chen, K.; Fu, J.; Ma, C.; Li, H.; Li, M.; Chan, T.S.; et al. Unveiling the Proton-Feeding Effect in Sulfur-Doped Fe-N-C Single-Atom Catalyst for Enhanced CO2 Electroreduction. Angew. Chem. Int. Ed. 2022, 61, e202206233. [Google Scholar] [CrossRef]
  34. Ge, W.; Chen, Y.; Fan, Y.; Zhu, Y.; Liu, H.; Song, L.; Liu, Z.; Lian, C.; Jiang, H.; Li, C. Dynamically Formed Surfactant Assembly at the Electrified Electrode–Electrolyte Interface Boosting CO2 Electroreduction. J. Am. Chem. Soc. 2022, 144, 6613–6622. [Google Scholar] [CrossRef] [PubMed]
  35. Fan, S.; Cheng, H.; Feng, M.; Wu, X.; Fan, Z.; Pan, D.; He, G. Catalytic hydrogenation performance of ZIF-8 carbide for electrochemical reduction of carbon dioxide. Chin. J. Chem. Eng. 2021, 39, 144–153. [Google Scholar] [CrossRef]
Figure 1. Catalytic performance of hcp Co NSs for CO2RR: (a) CV curve; (b) LSV curve.
Catalysts 13 01384 g001
Figure 2. In situ Raman Spectra of hcp Co from OCP to −0.88 V vs. RHE (a), the wave number’s change at different potentials from −0.18 V to −0.88 V vs. RHE of HCO3 (b), CO32− (c), CO (d), OCHO* (e), and COCO* (f).
Catalysts 13 01384 g002
Figure 3. Differential electrochemical mass spectrometry (DEMS) sweep data obtained during CO2RR on hcp Co catalysts. DEMS-derived mass charges for various products formed in the process of 13CO2 replacing 12CO2 (a,d) such as 12CH4, 13CH4 (b,e), 12CO, and 13CO (c,f). (ac) are the mass-to-charge ratios changes when the 13CO2 replaces 12CO2 at the beginning. (df) are the mass-to-charge ratios changes when the 13CO2 replaces 12CO2 mostly. (gi) are the reaction sketch maps.
Catalysts 13 01384 g003
Figure 4. EIS data and fitting results of hcp Co at different potentials (a). Bode plots of the system at different potentials (b). Calculated Cφ of hcp Co at different potentials (c).
Catalysts 13 01384 g004
Figure 5. Transmission electron microscopy (TEM) images and high resolution TEM (HR-TEM) images with measured lattice distance, their corresponding fast Fourier transformation, and inverse fast Fourier transformation after the CO2RR tests at −0.28 V (a,d,g,h), −0.38 V (b,e,i,j), and −0.48 V (c,f,k,l).
Catalysts 13 01384 g005
Disclaimer/Publisher’s Note: The statements, opinions and data contained in all publications are solely those of the individual author(s) and contributor(s) and not of MDPI and/or the editor(s). MDPI and/or the editor(s) disclaim responsibility for any injury to people or property resulting from any ideas, methods, instructions or products referred to in the content.

