Author Contributions
Methodology, I.F., M.J.N.C. and M.M.; Validation, M.J.N.C., J.B., D.M.C. and M.M.; Formal analysis, I.F. and J.C.; Investigation, I.F. and M.J.N.C.; Data curation, J.C.; Writing—original draft, M.J.N.C., D.M.C. and M.M.; Supervision, M.J.N.C.; Project administration, M.M. All authors have read and agreed to the published version of the manuscript.
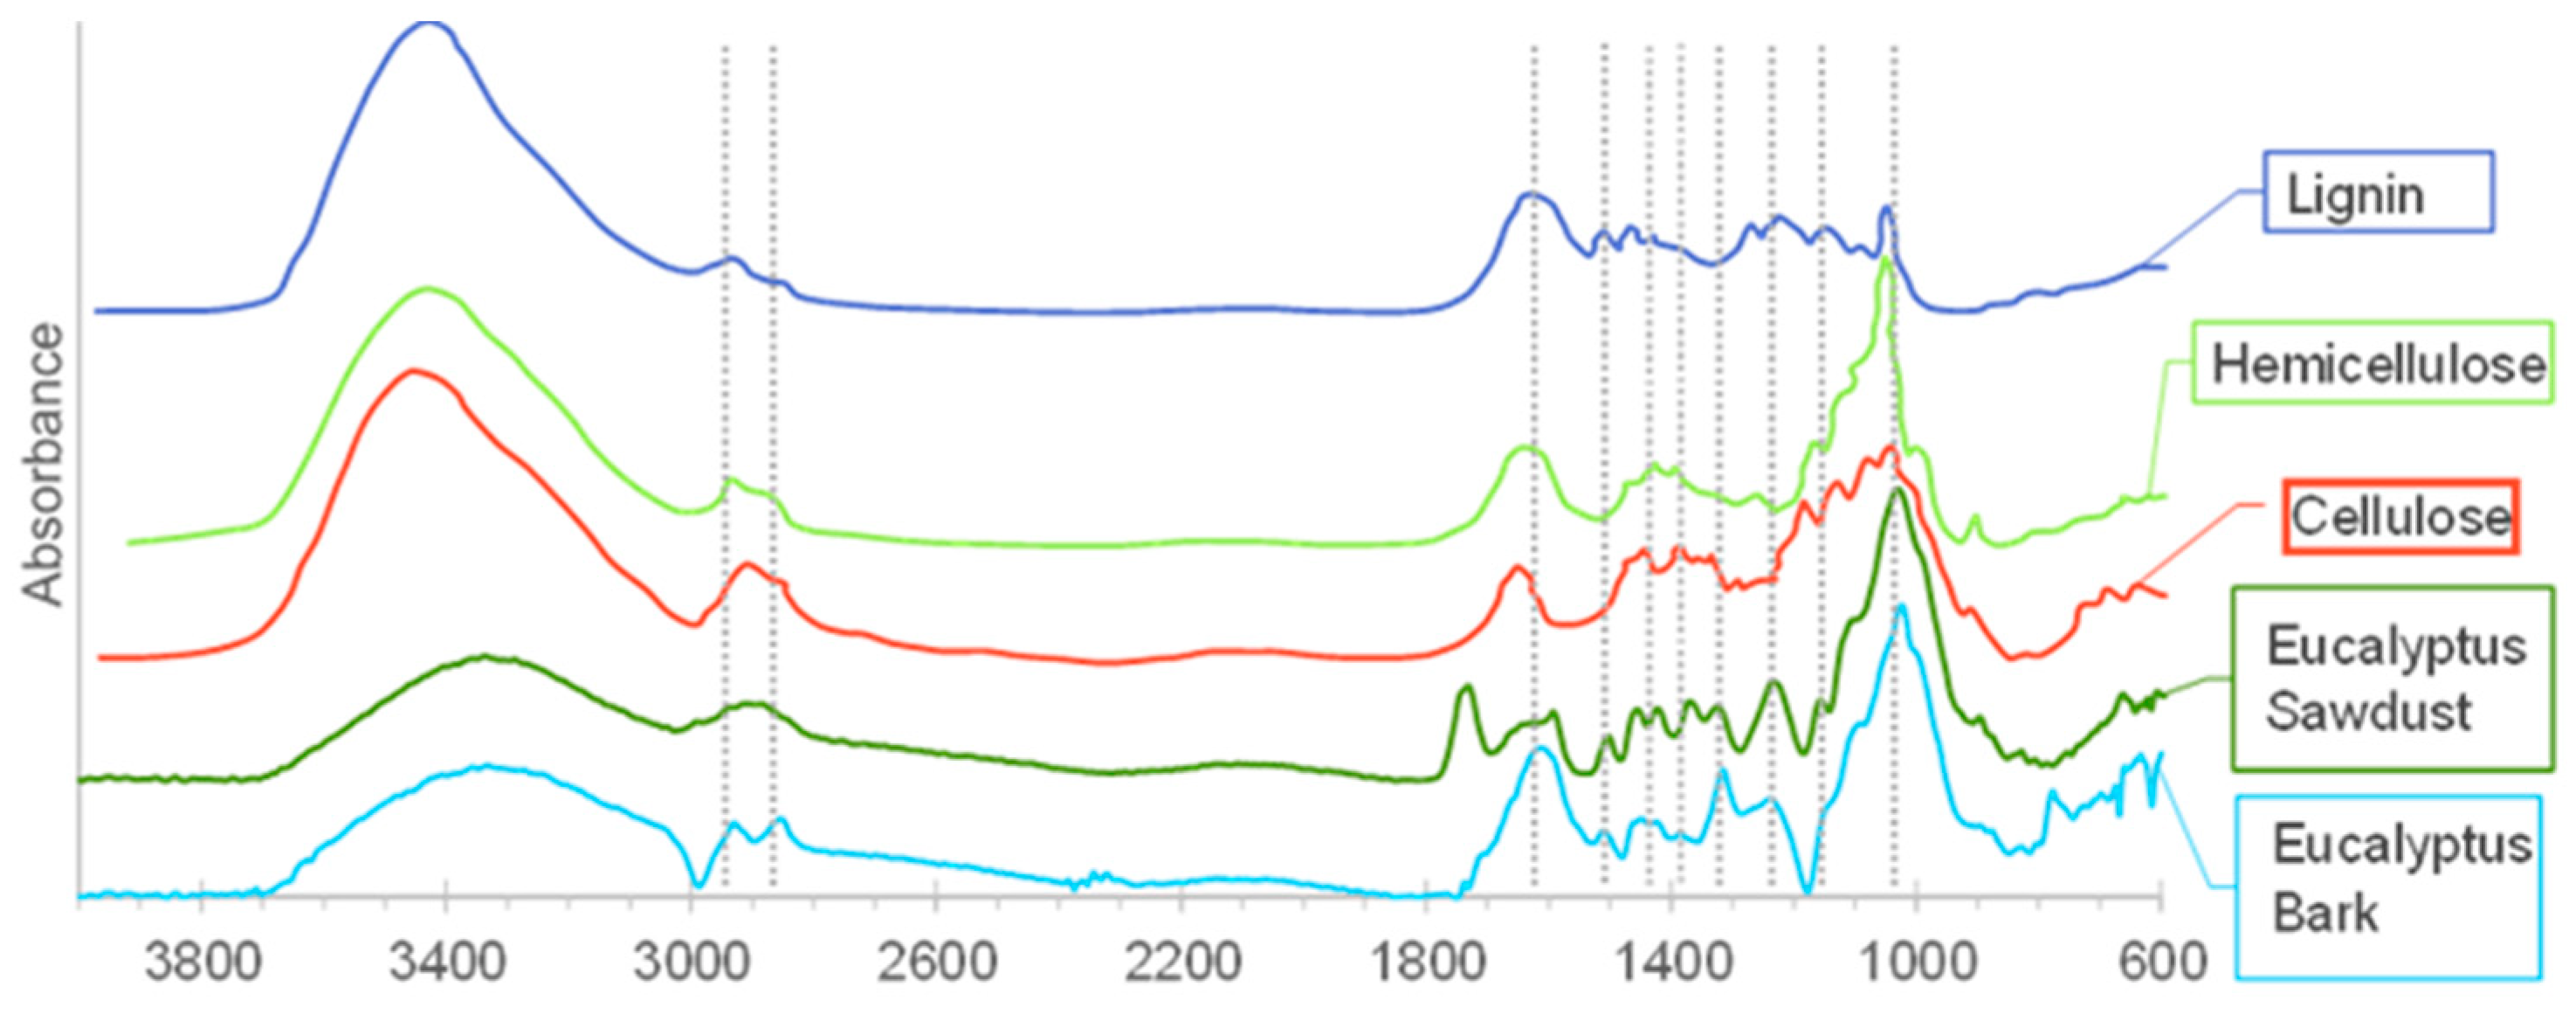
Figure 1.
FTIR spectra of the biomasses and cellulose, hemicellulose, and lignin standards.
Figure 1.
FTIR spectra of the biomasses and cellulose, hemicellulose, and lignin standards.
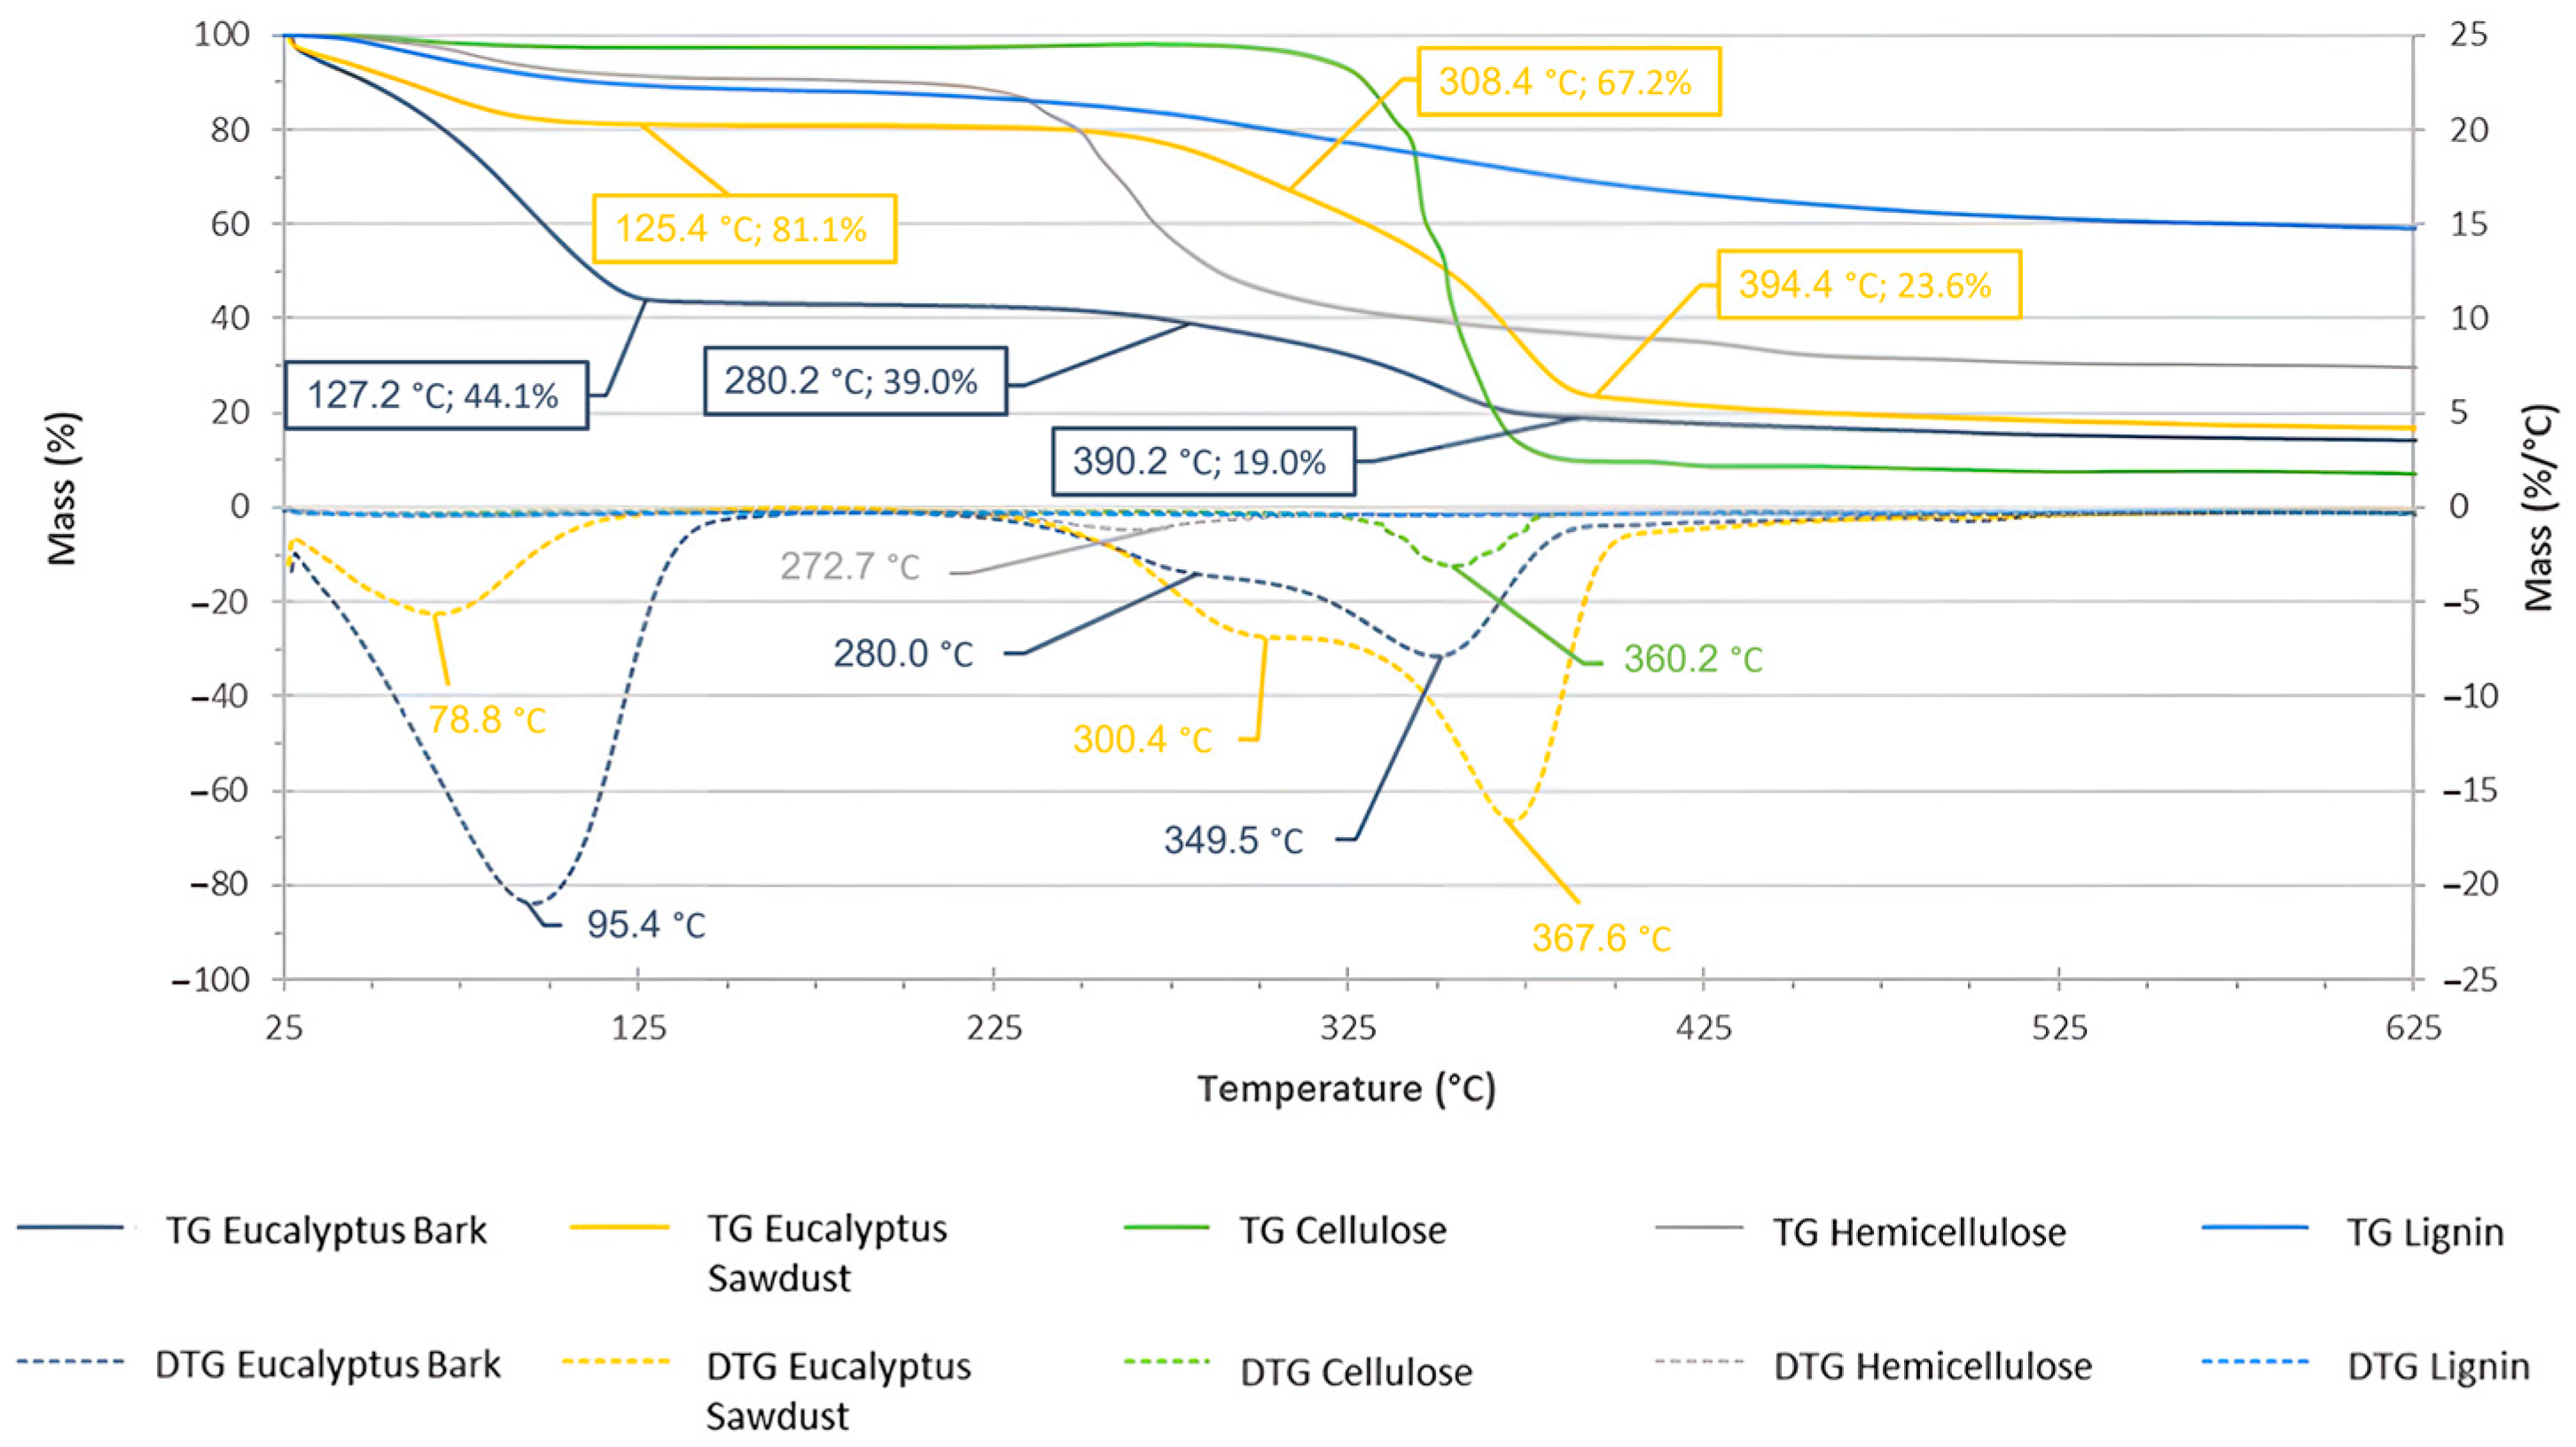
Figure 2.
TGA (continuous line) and DTG (dotted line) analyses of the biomasses and standards.
Figure 2.
TGA (continuous line) and DTG (dotted line) analyses of the biomasses and standards.
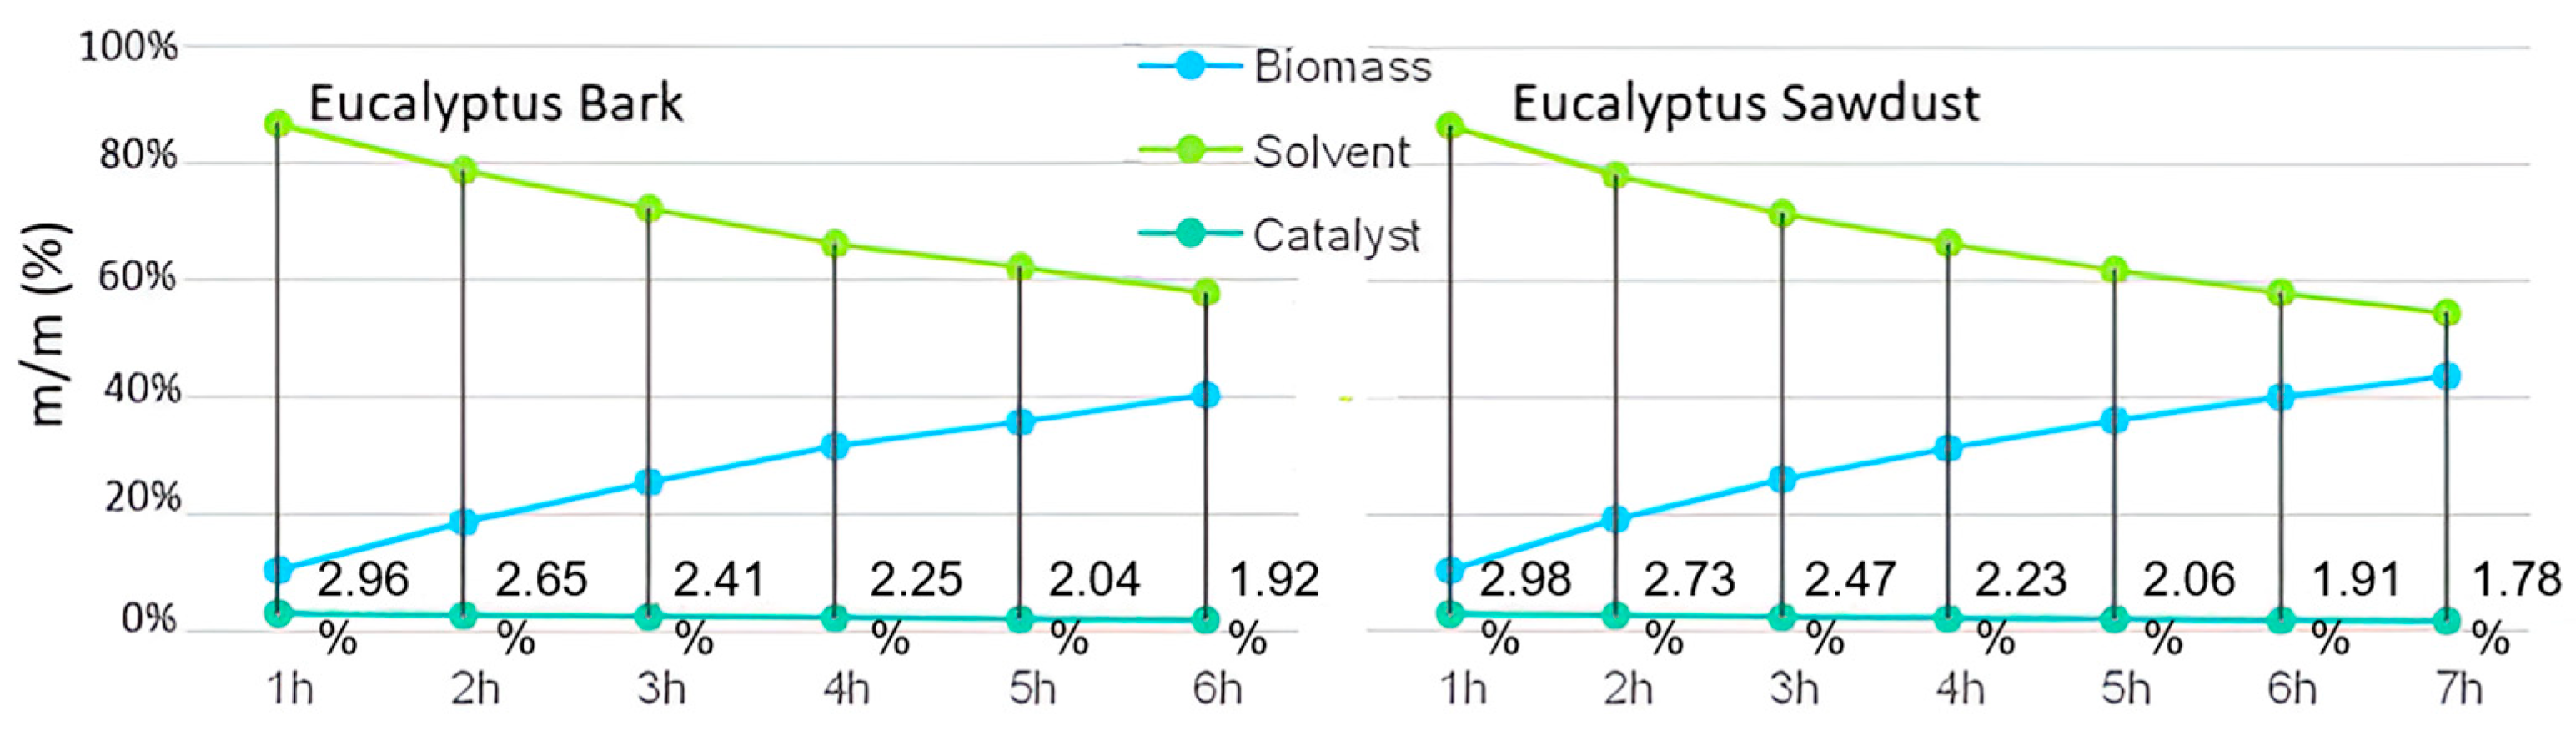
Figure 3.
Biomass, solvent, and catalyst contents in the liquefaction of E. globulus bark and sawdust with sequential biomass additions.
Figure 3.
Biomass, solvent, and catalyst contents in the liquefaction of E. globulus bark and sawdust with sequential biomass additions.
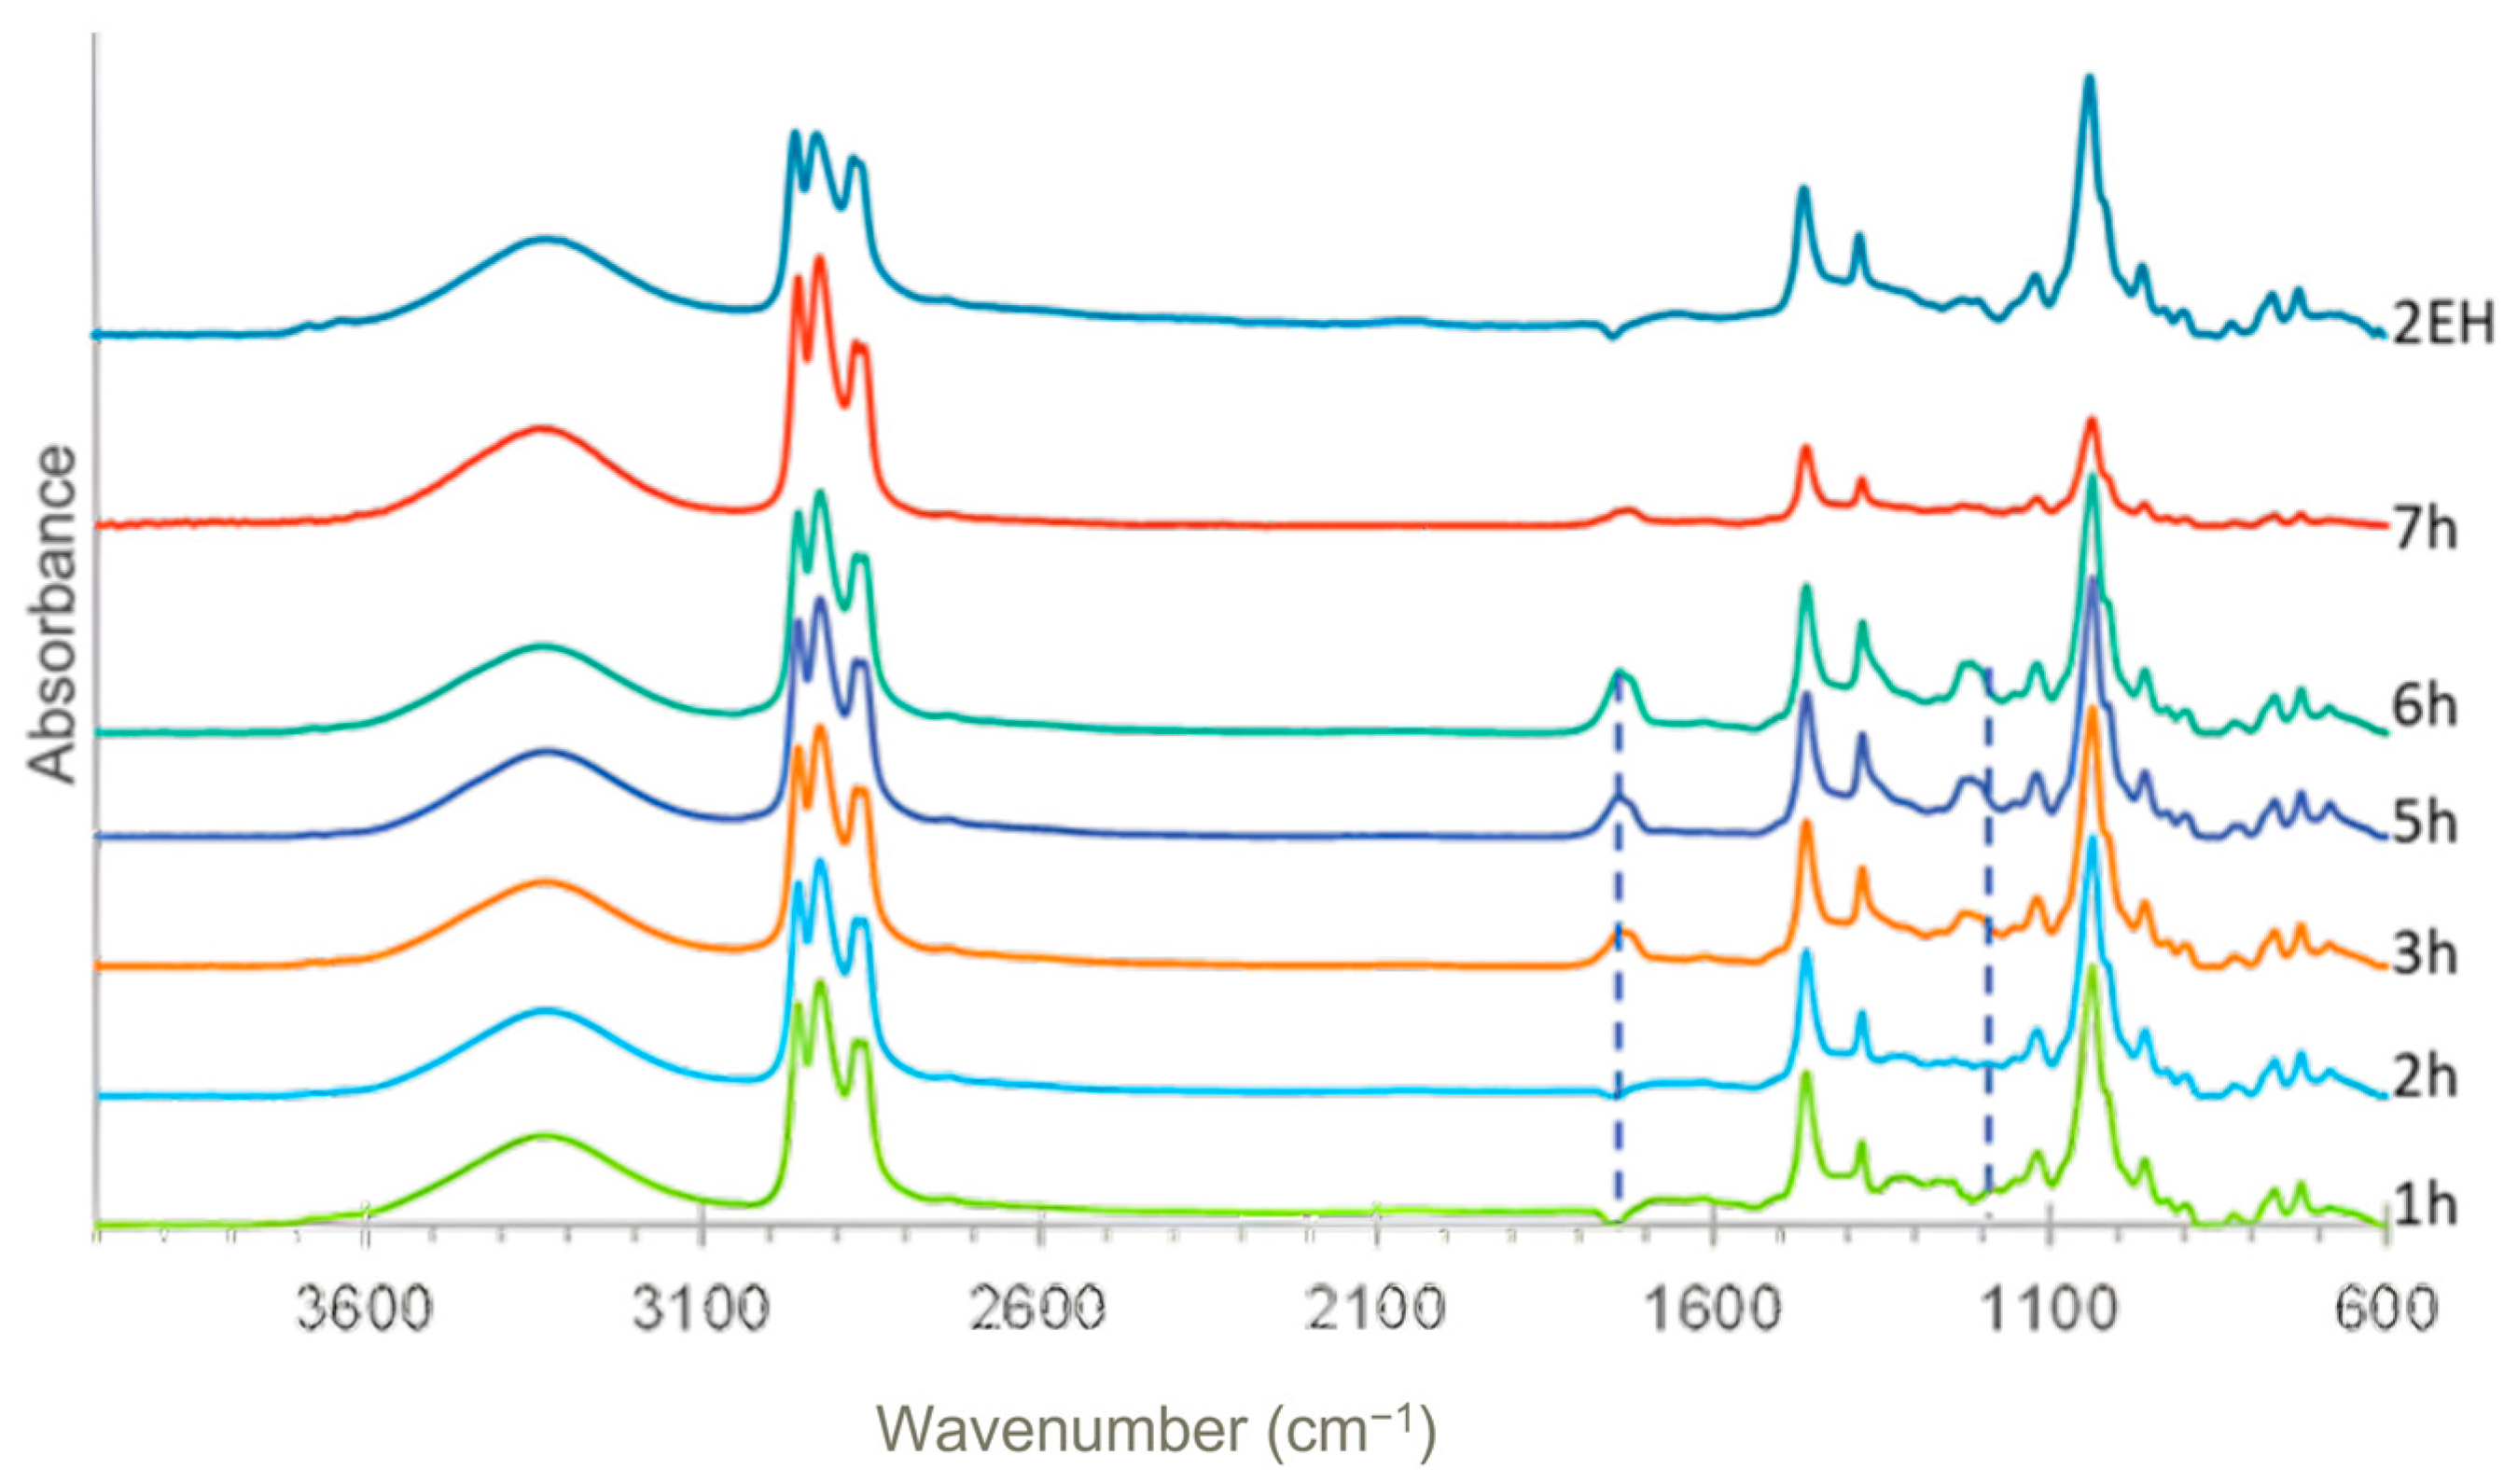
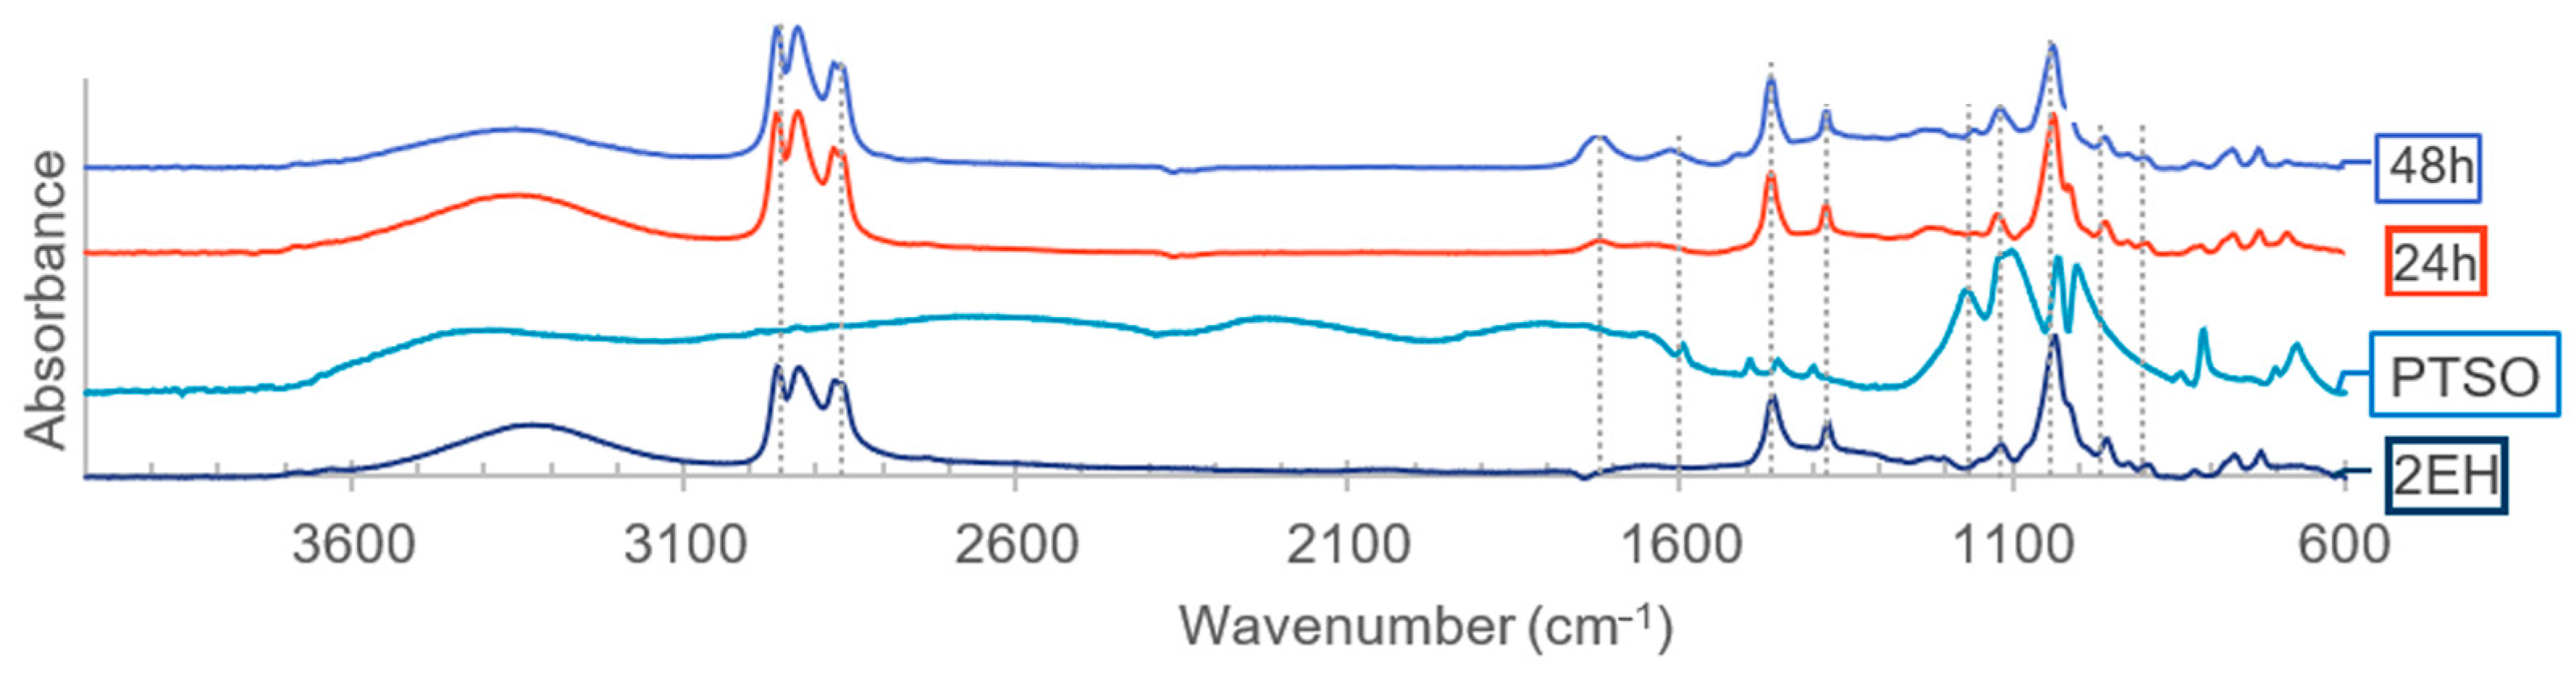
Figure 4.
FTIR spectra of the liquefied product before each incremental addition of E. globulus bark.
Figure 4.
FTIR spectra of the liquefied product before each incremental addition of E. globulus bark.
Figure 5.
FTIR spectra of the polyols and pure and condensed solvent from the liquefaction reaction of E. globulus bark and sawdust.
Figure 5.
FTIR spectra of the polyols and pure and condensed solvent from the liquefaction reaction of E. globulus bark and sawdust.
Figure 6.
FTIR analysis of the 2-EH, catalysts, and first liquefaction bio-oils (solvent: 2EH).
Figure 6.
FTIR analysis of the 2-EH, catalysts, and first liquefaction bio-oils (solvent: 2EH).
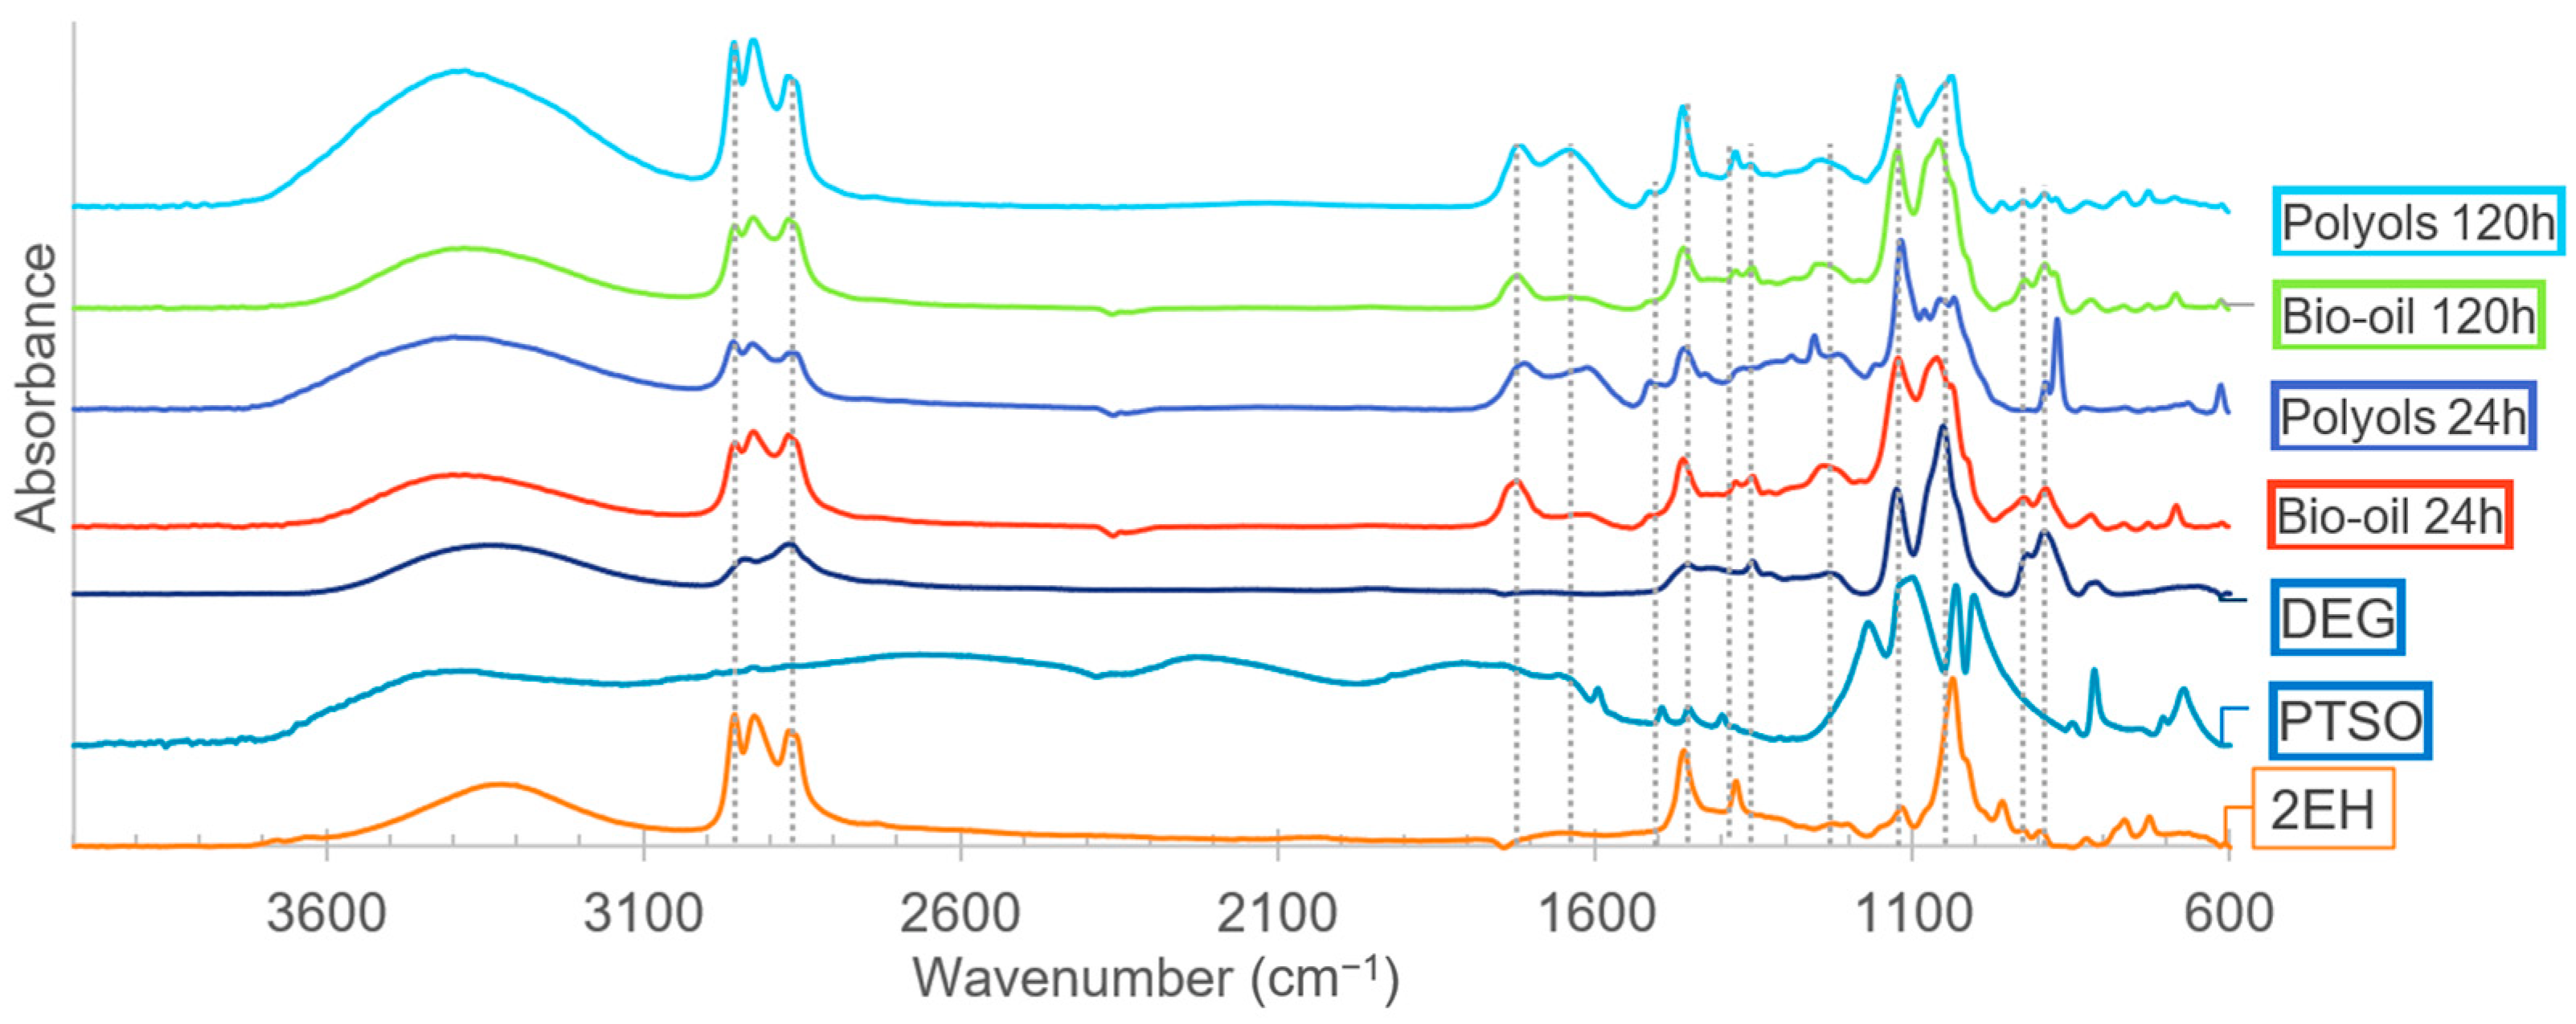
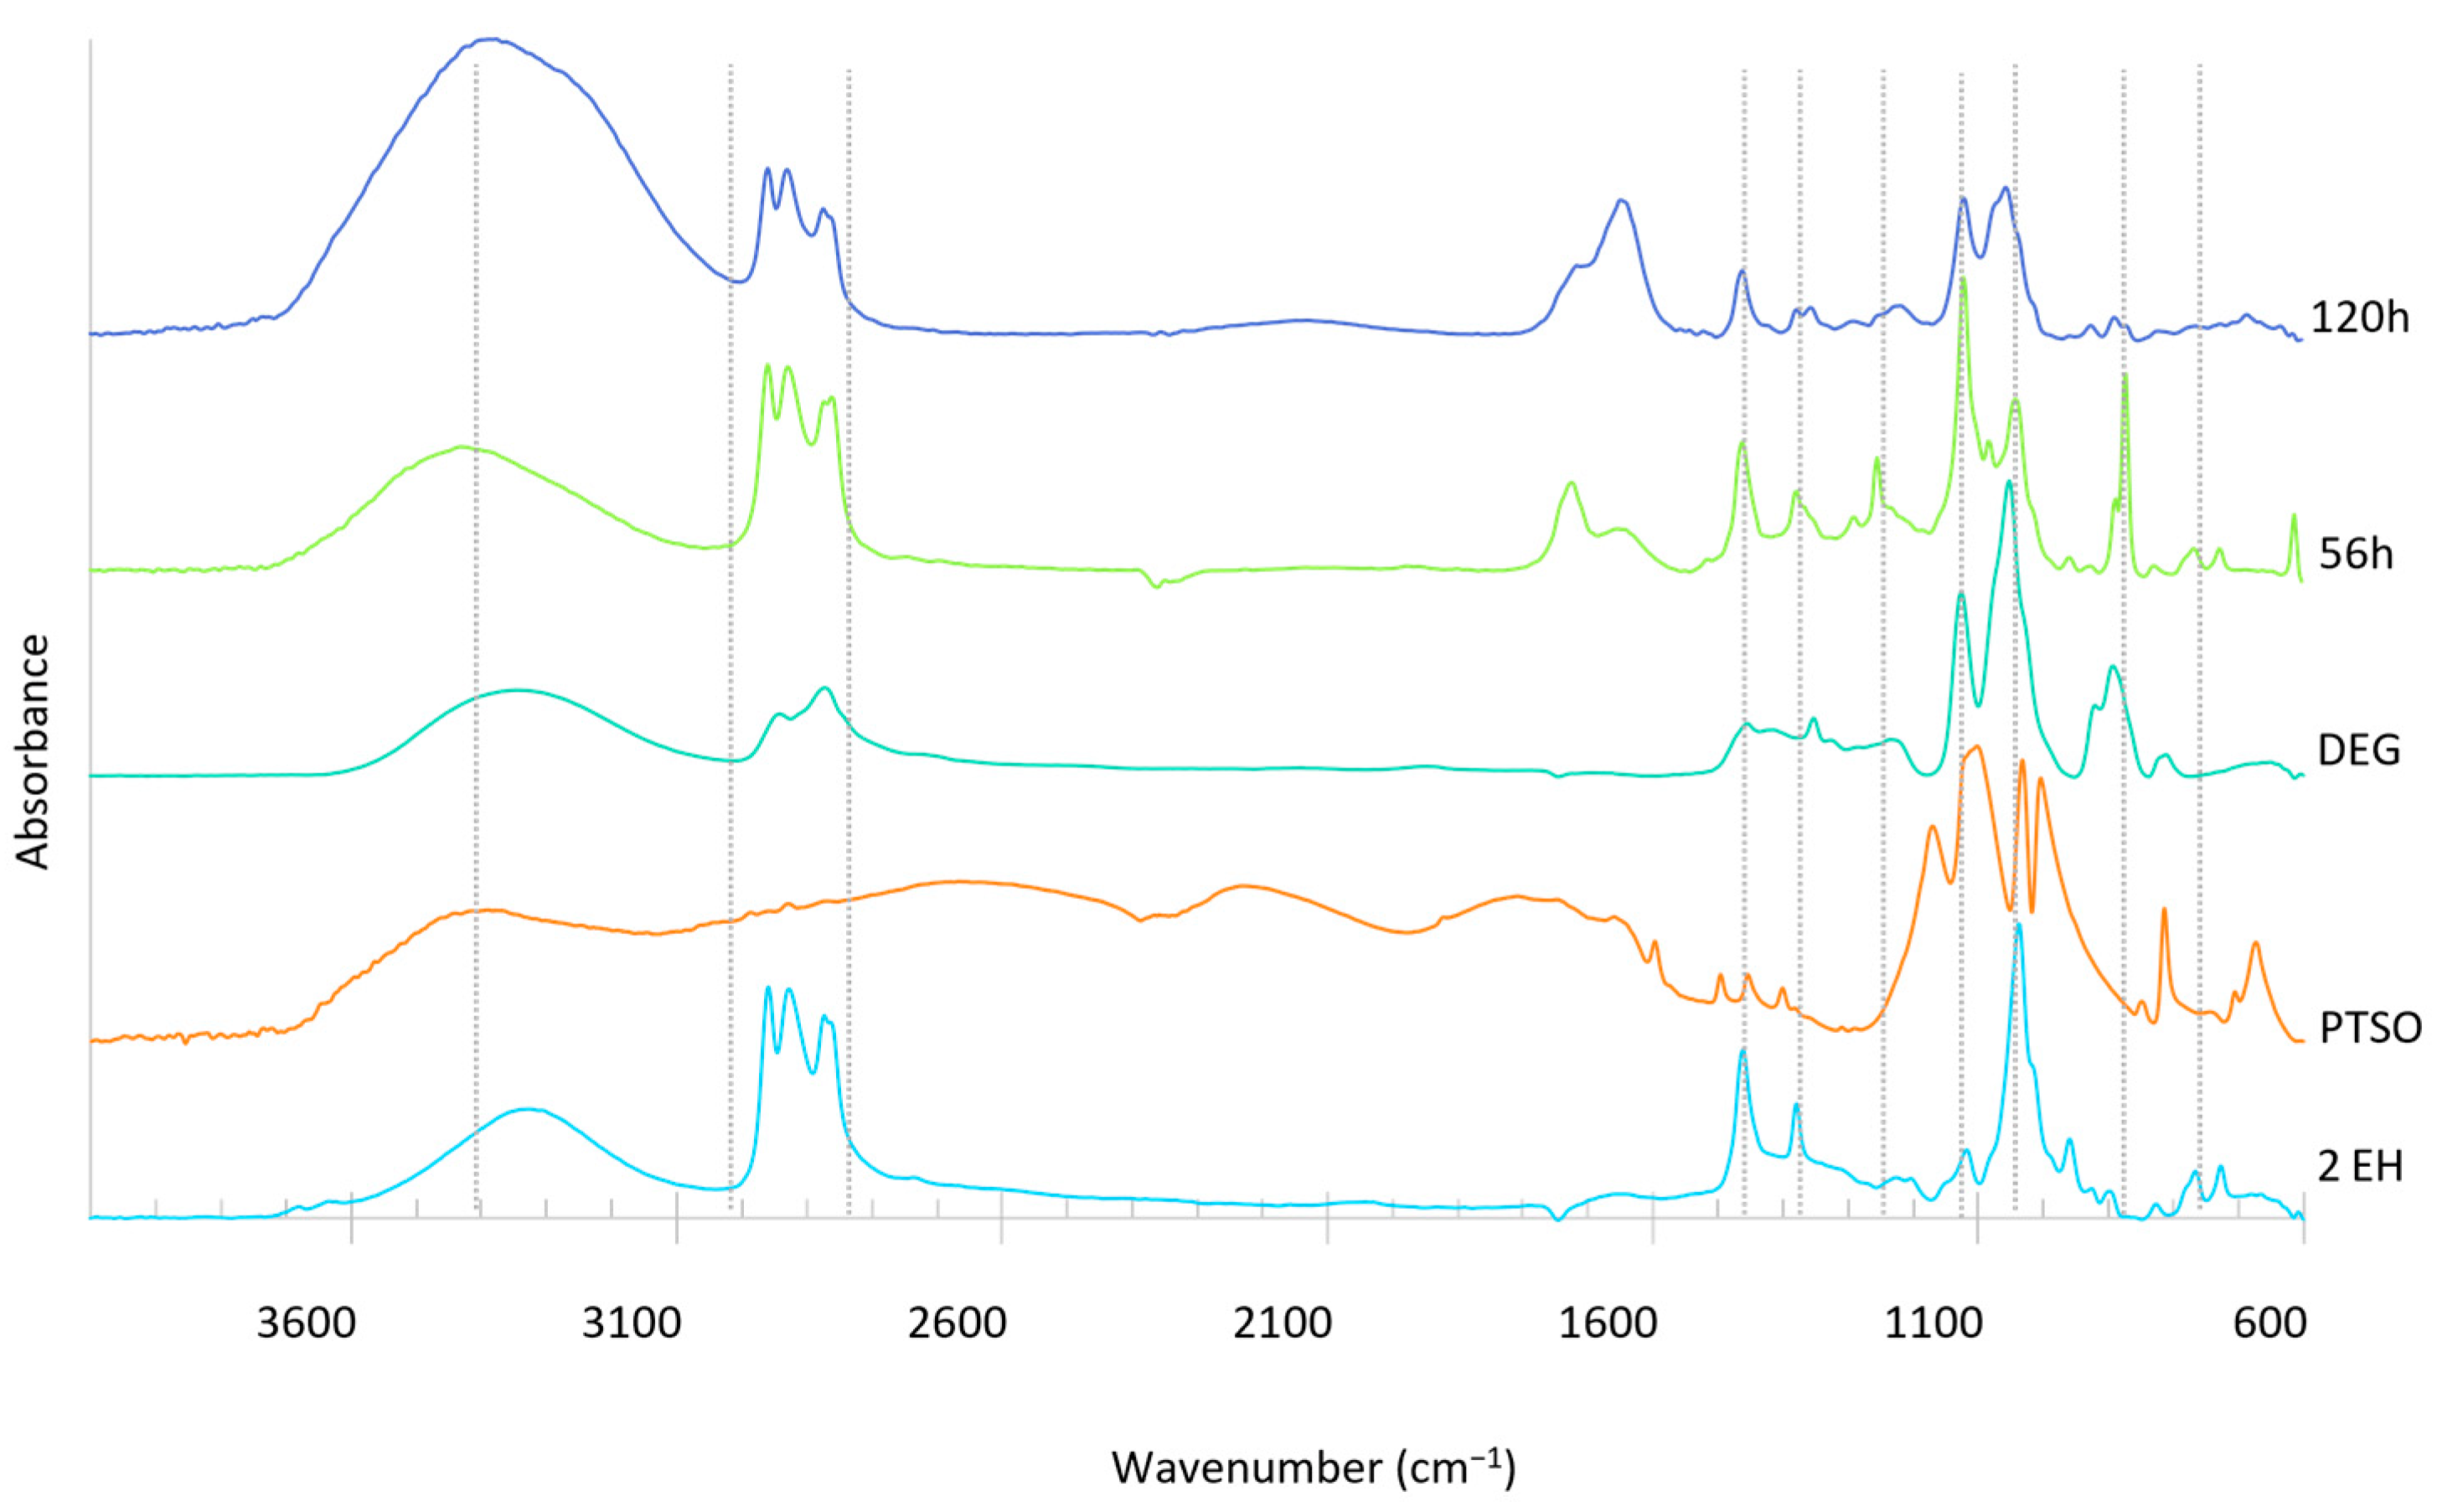
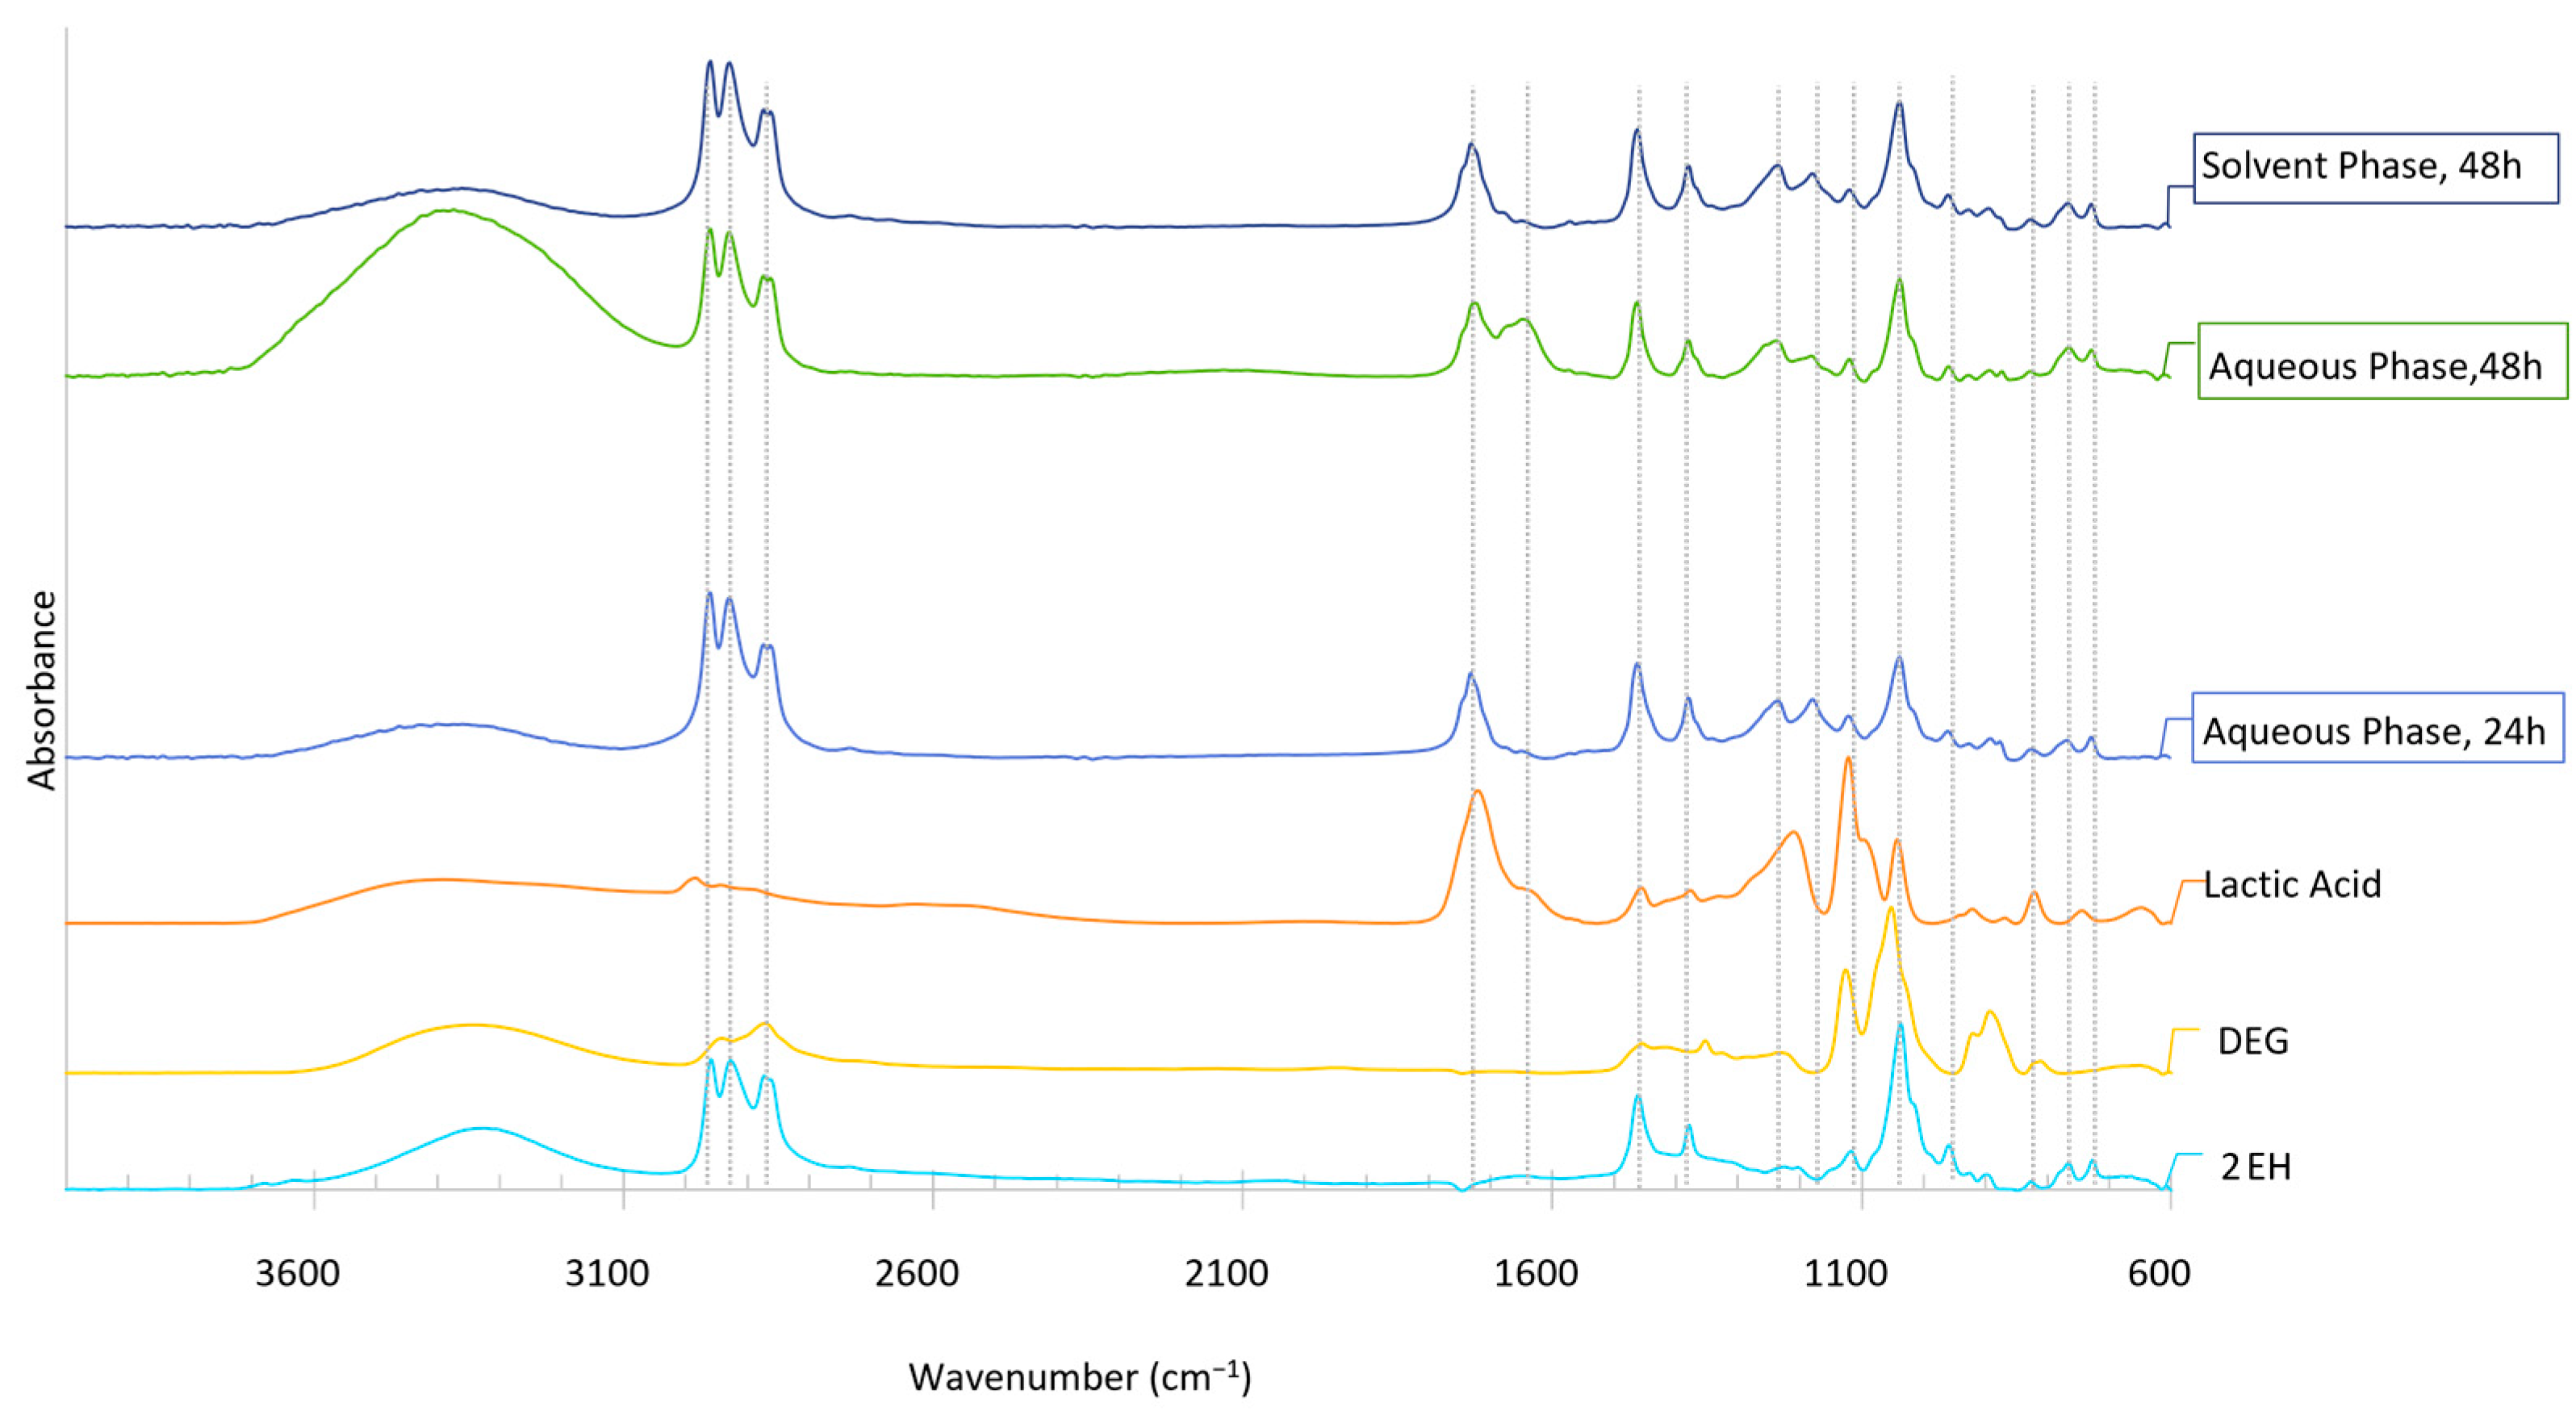
Figure 7.
FTIR analysis of the solvents, catalysts, bio-oils, and polyols produced in the third liquefaction reaction (solvents: 2EH and DEG).
Figure 7.
FTIR analysis of the solvents, catalysts, bio-oils, and polyols produced in the third liquefaction reaction (solvents: 2EH and DEG).
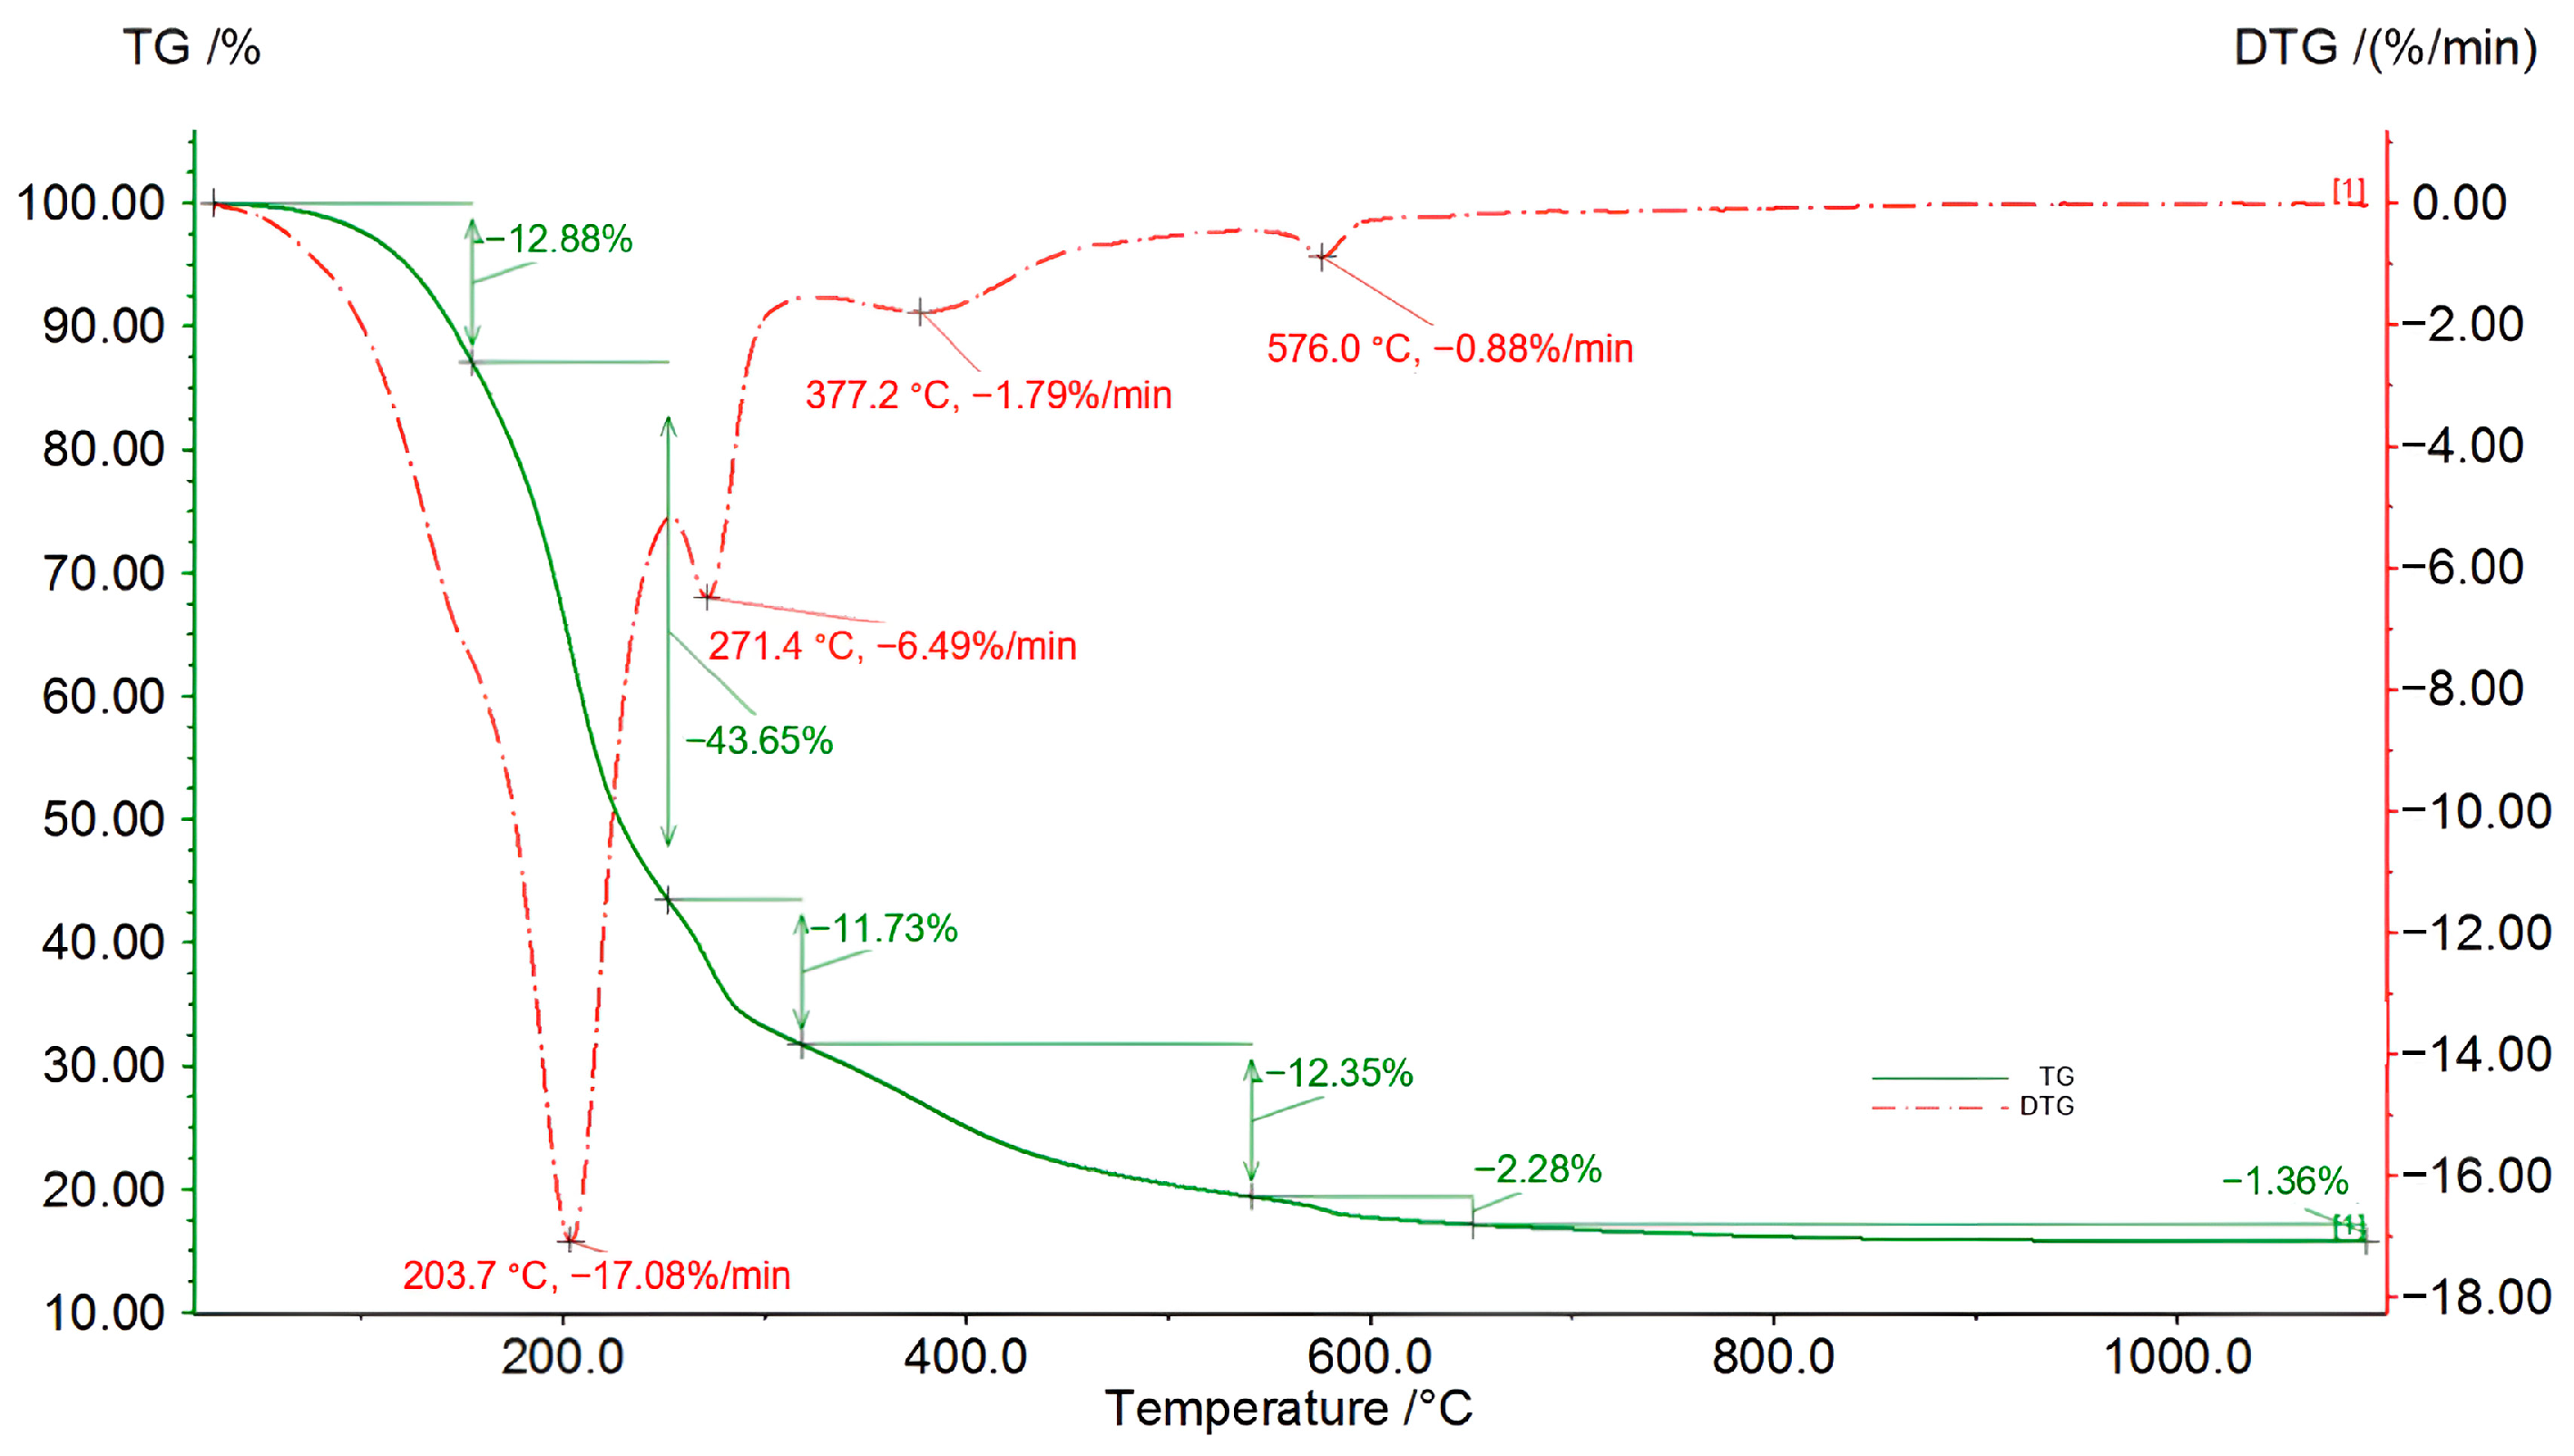
Figure 8.
TG/DSC/DTG curves of the bio-oil produced after 56 h of the second liquefaction reaction (solvents: 2EH and DEG).
Figure 8.
TG/DSC/DTG curves of the bio-oil produced after 56 h of the second liquefaction reaction (solvents: 2EH and DEG).
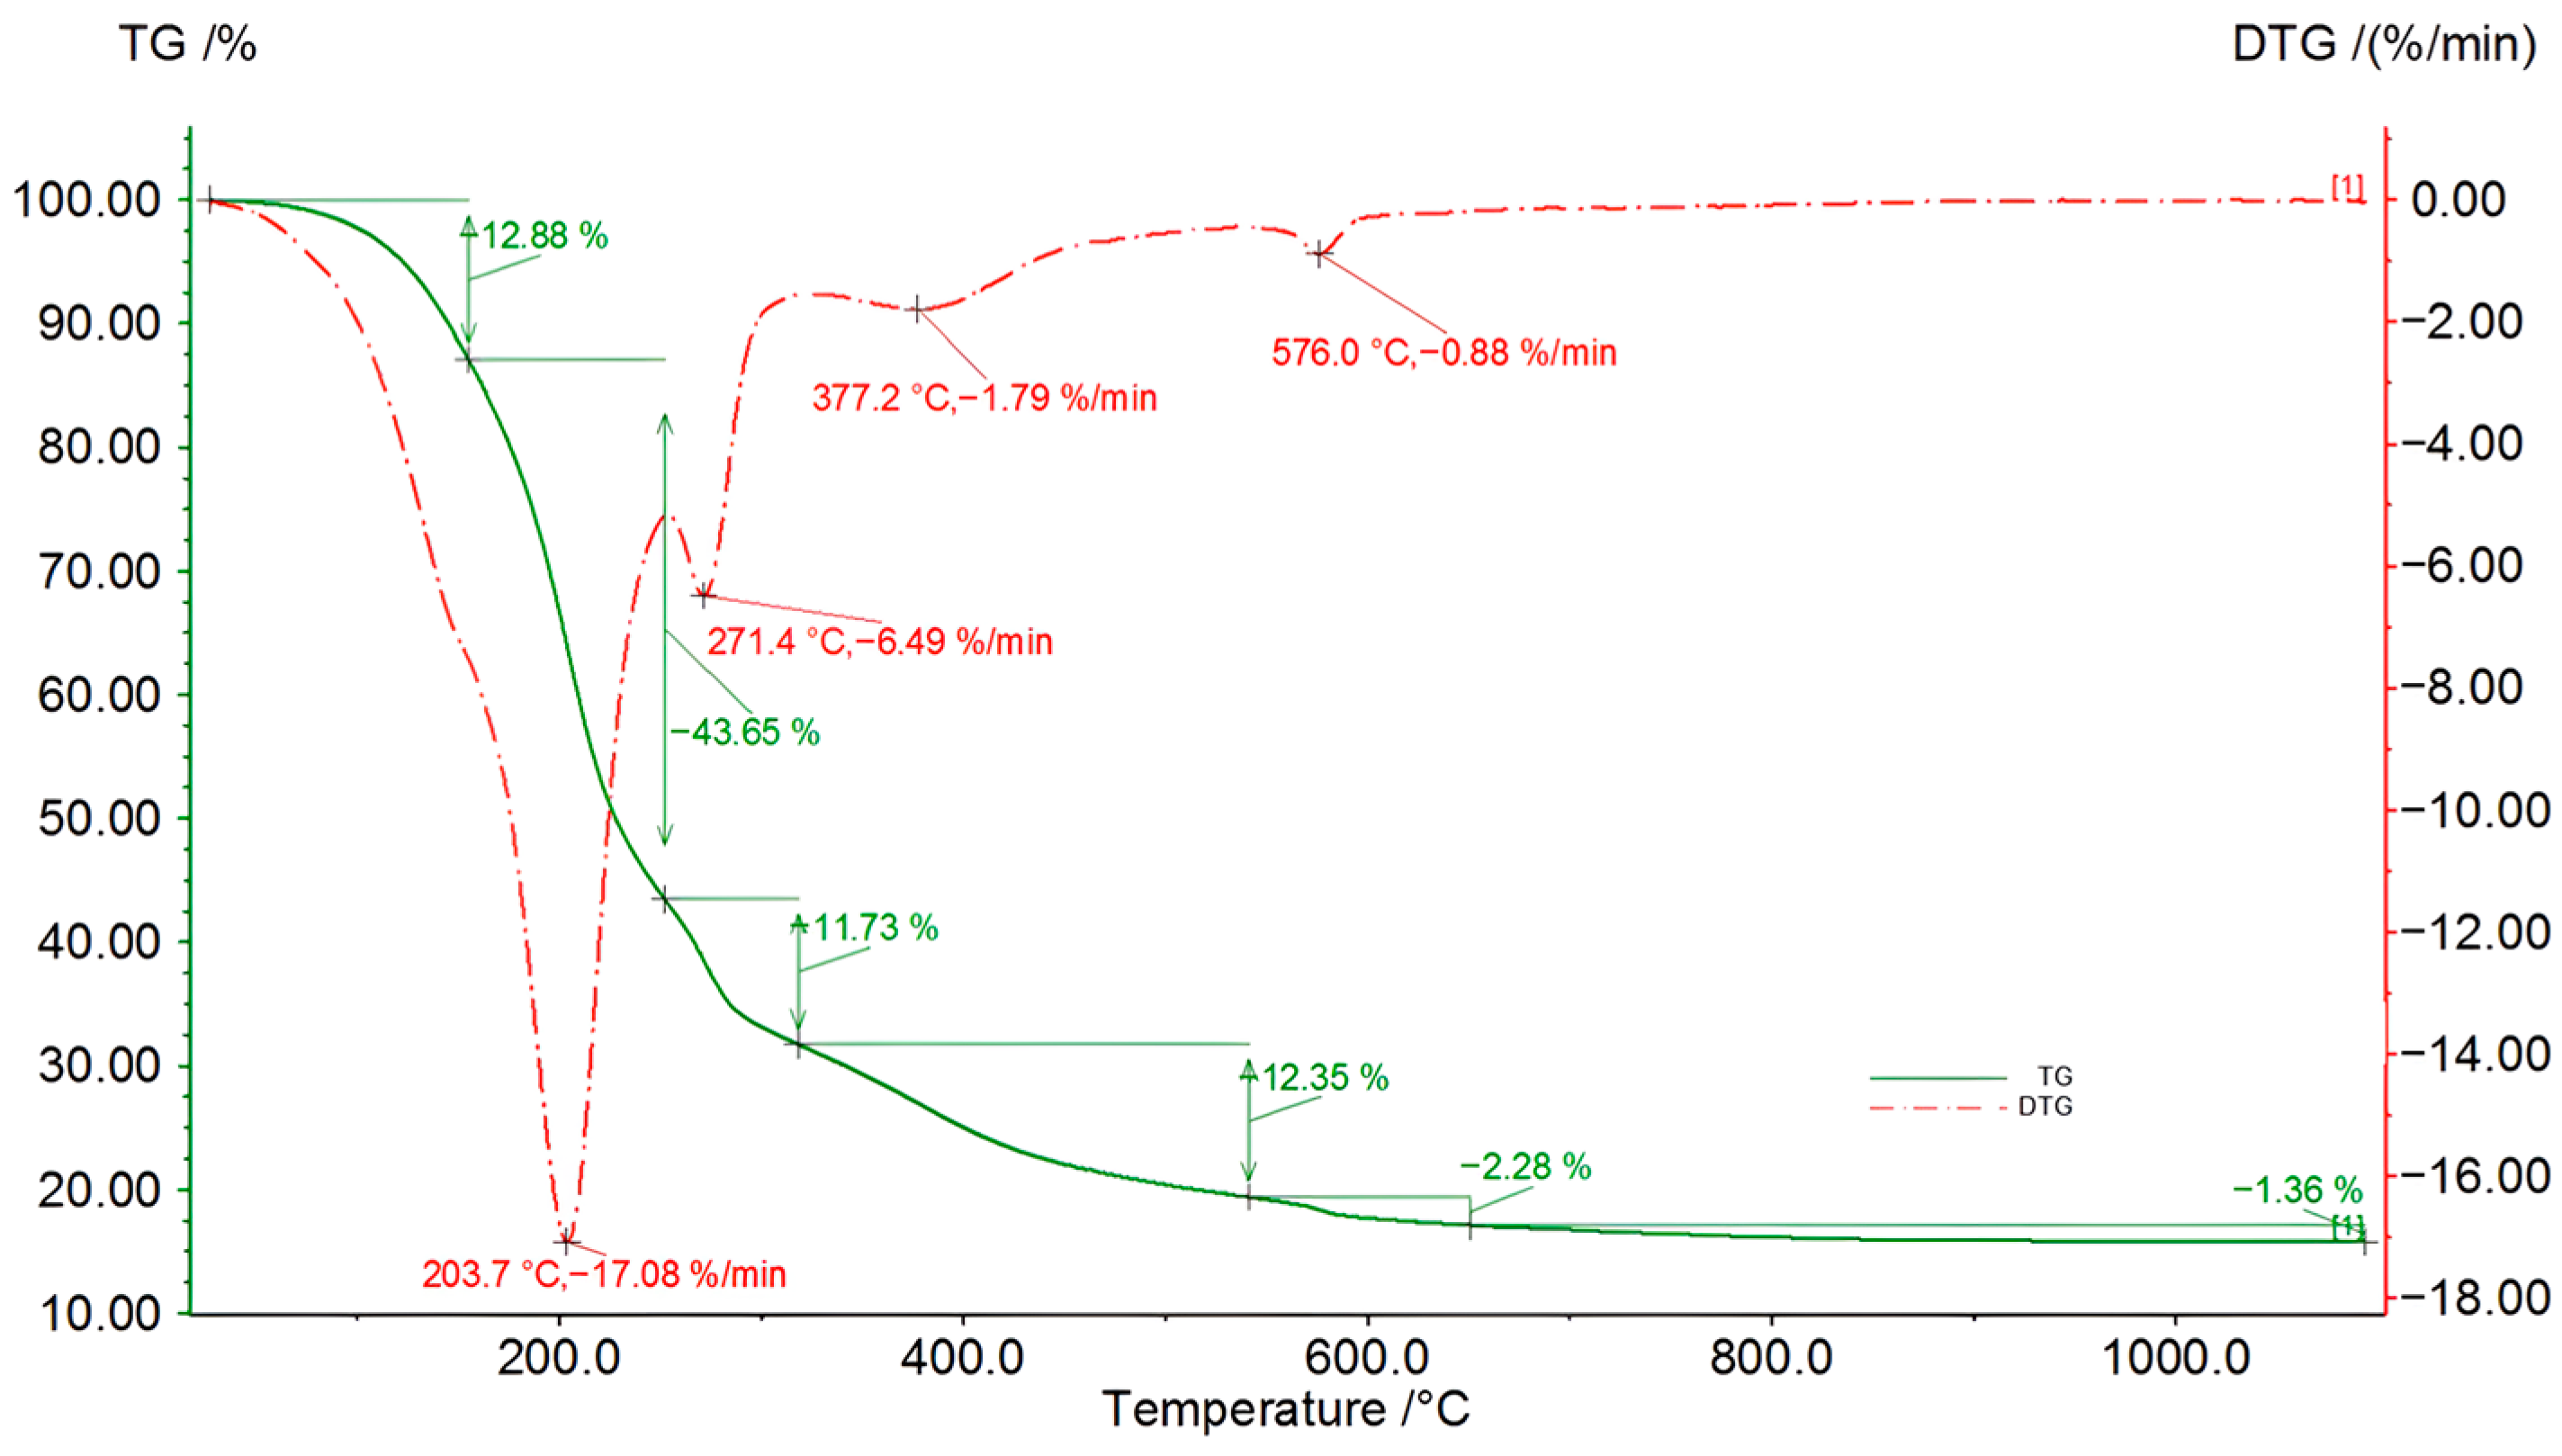
Figure 9.
TG/DSC/DTG curves for an 8 h sample of the third liquefaction reaction (solvents: 2EH and DEG).
Figure 9.
TG/DSC/DTG curves for an 8 h sample of the third liquefaction reaction (solvents: 2EH and DEG).
Figure 10.
FTIR analysis of the extraction waters of the second liquefaction reaction (solvents: 2EH and DEG).
Figure 10.
FTIR analysis of the extraction waters of the second liquefaction reaction (solvents: 2EH and DEG).
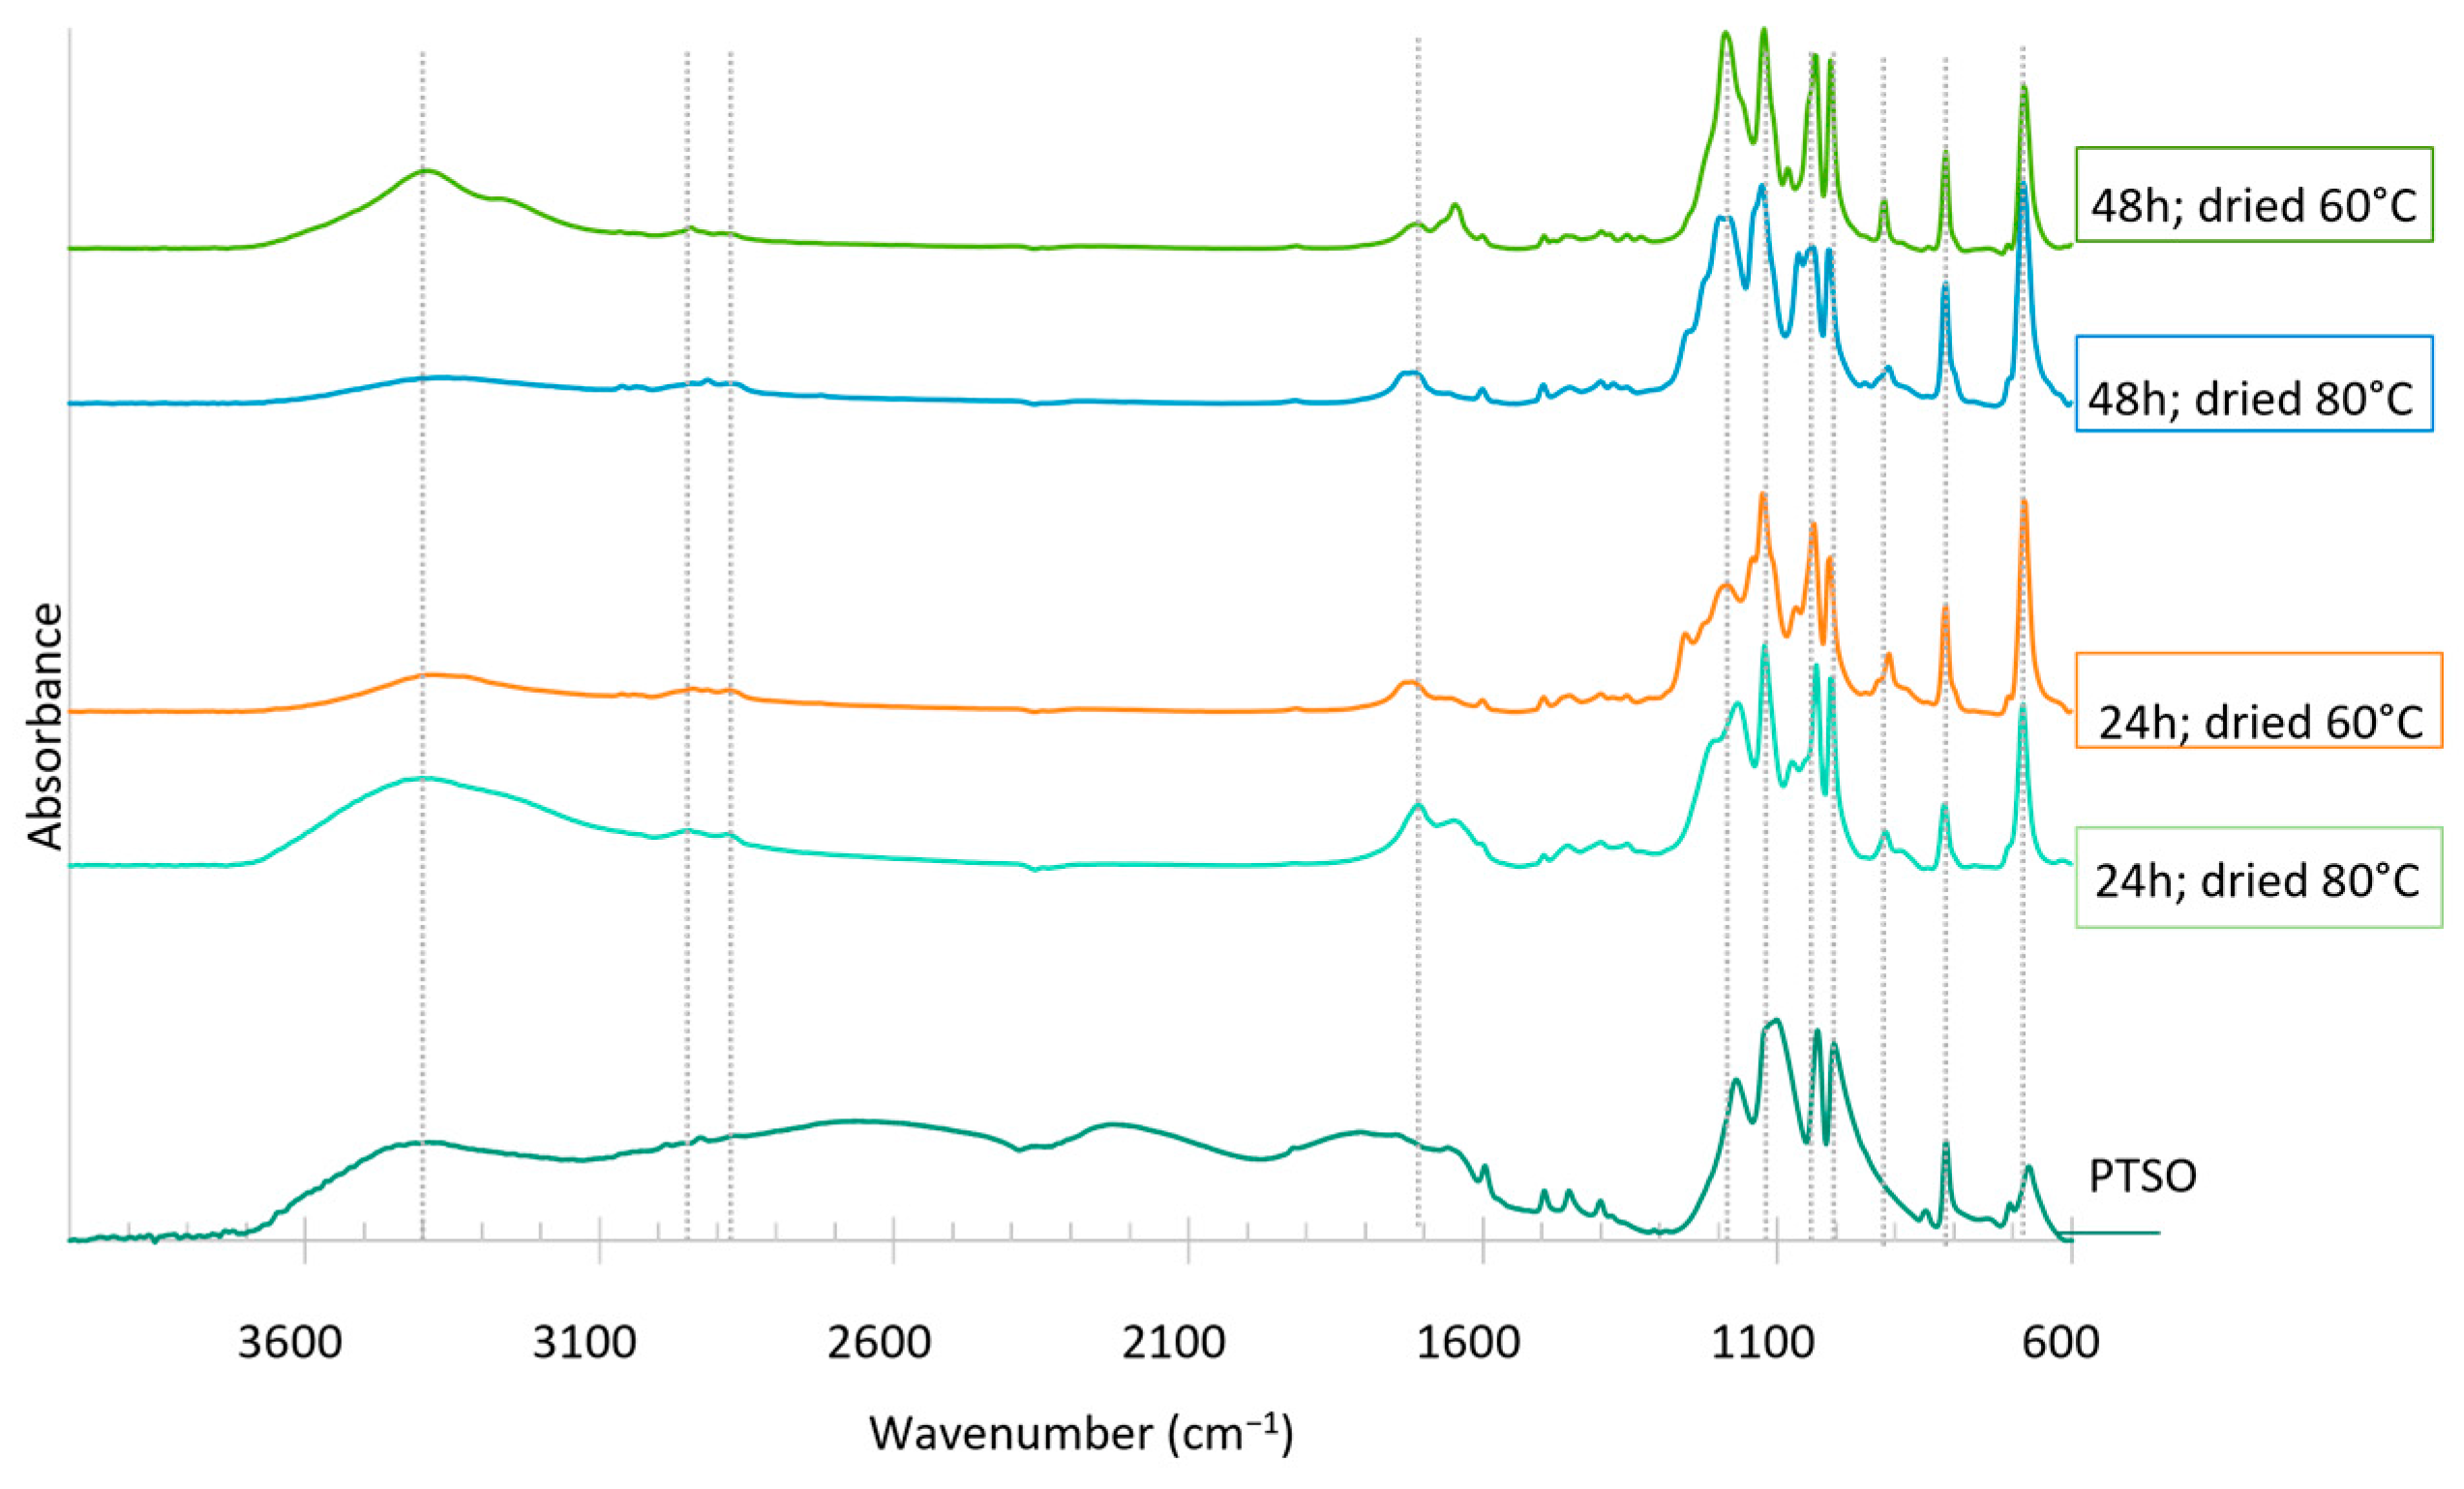
Figure 11.
FTIR analysis of the dried sugars extracted from bio-oils produced in the first liquefaction after 24 h and 48 h of reaction (solvent: 2EH).
Figure 11.
FTIR analysis of the dried sugars extracted from bio-oils produced in the first liquefaction after 24 h and 48 h of reaction (solvent: 2EH).
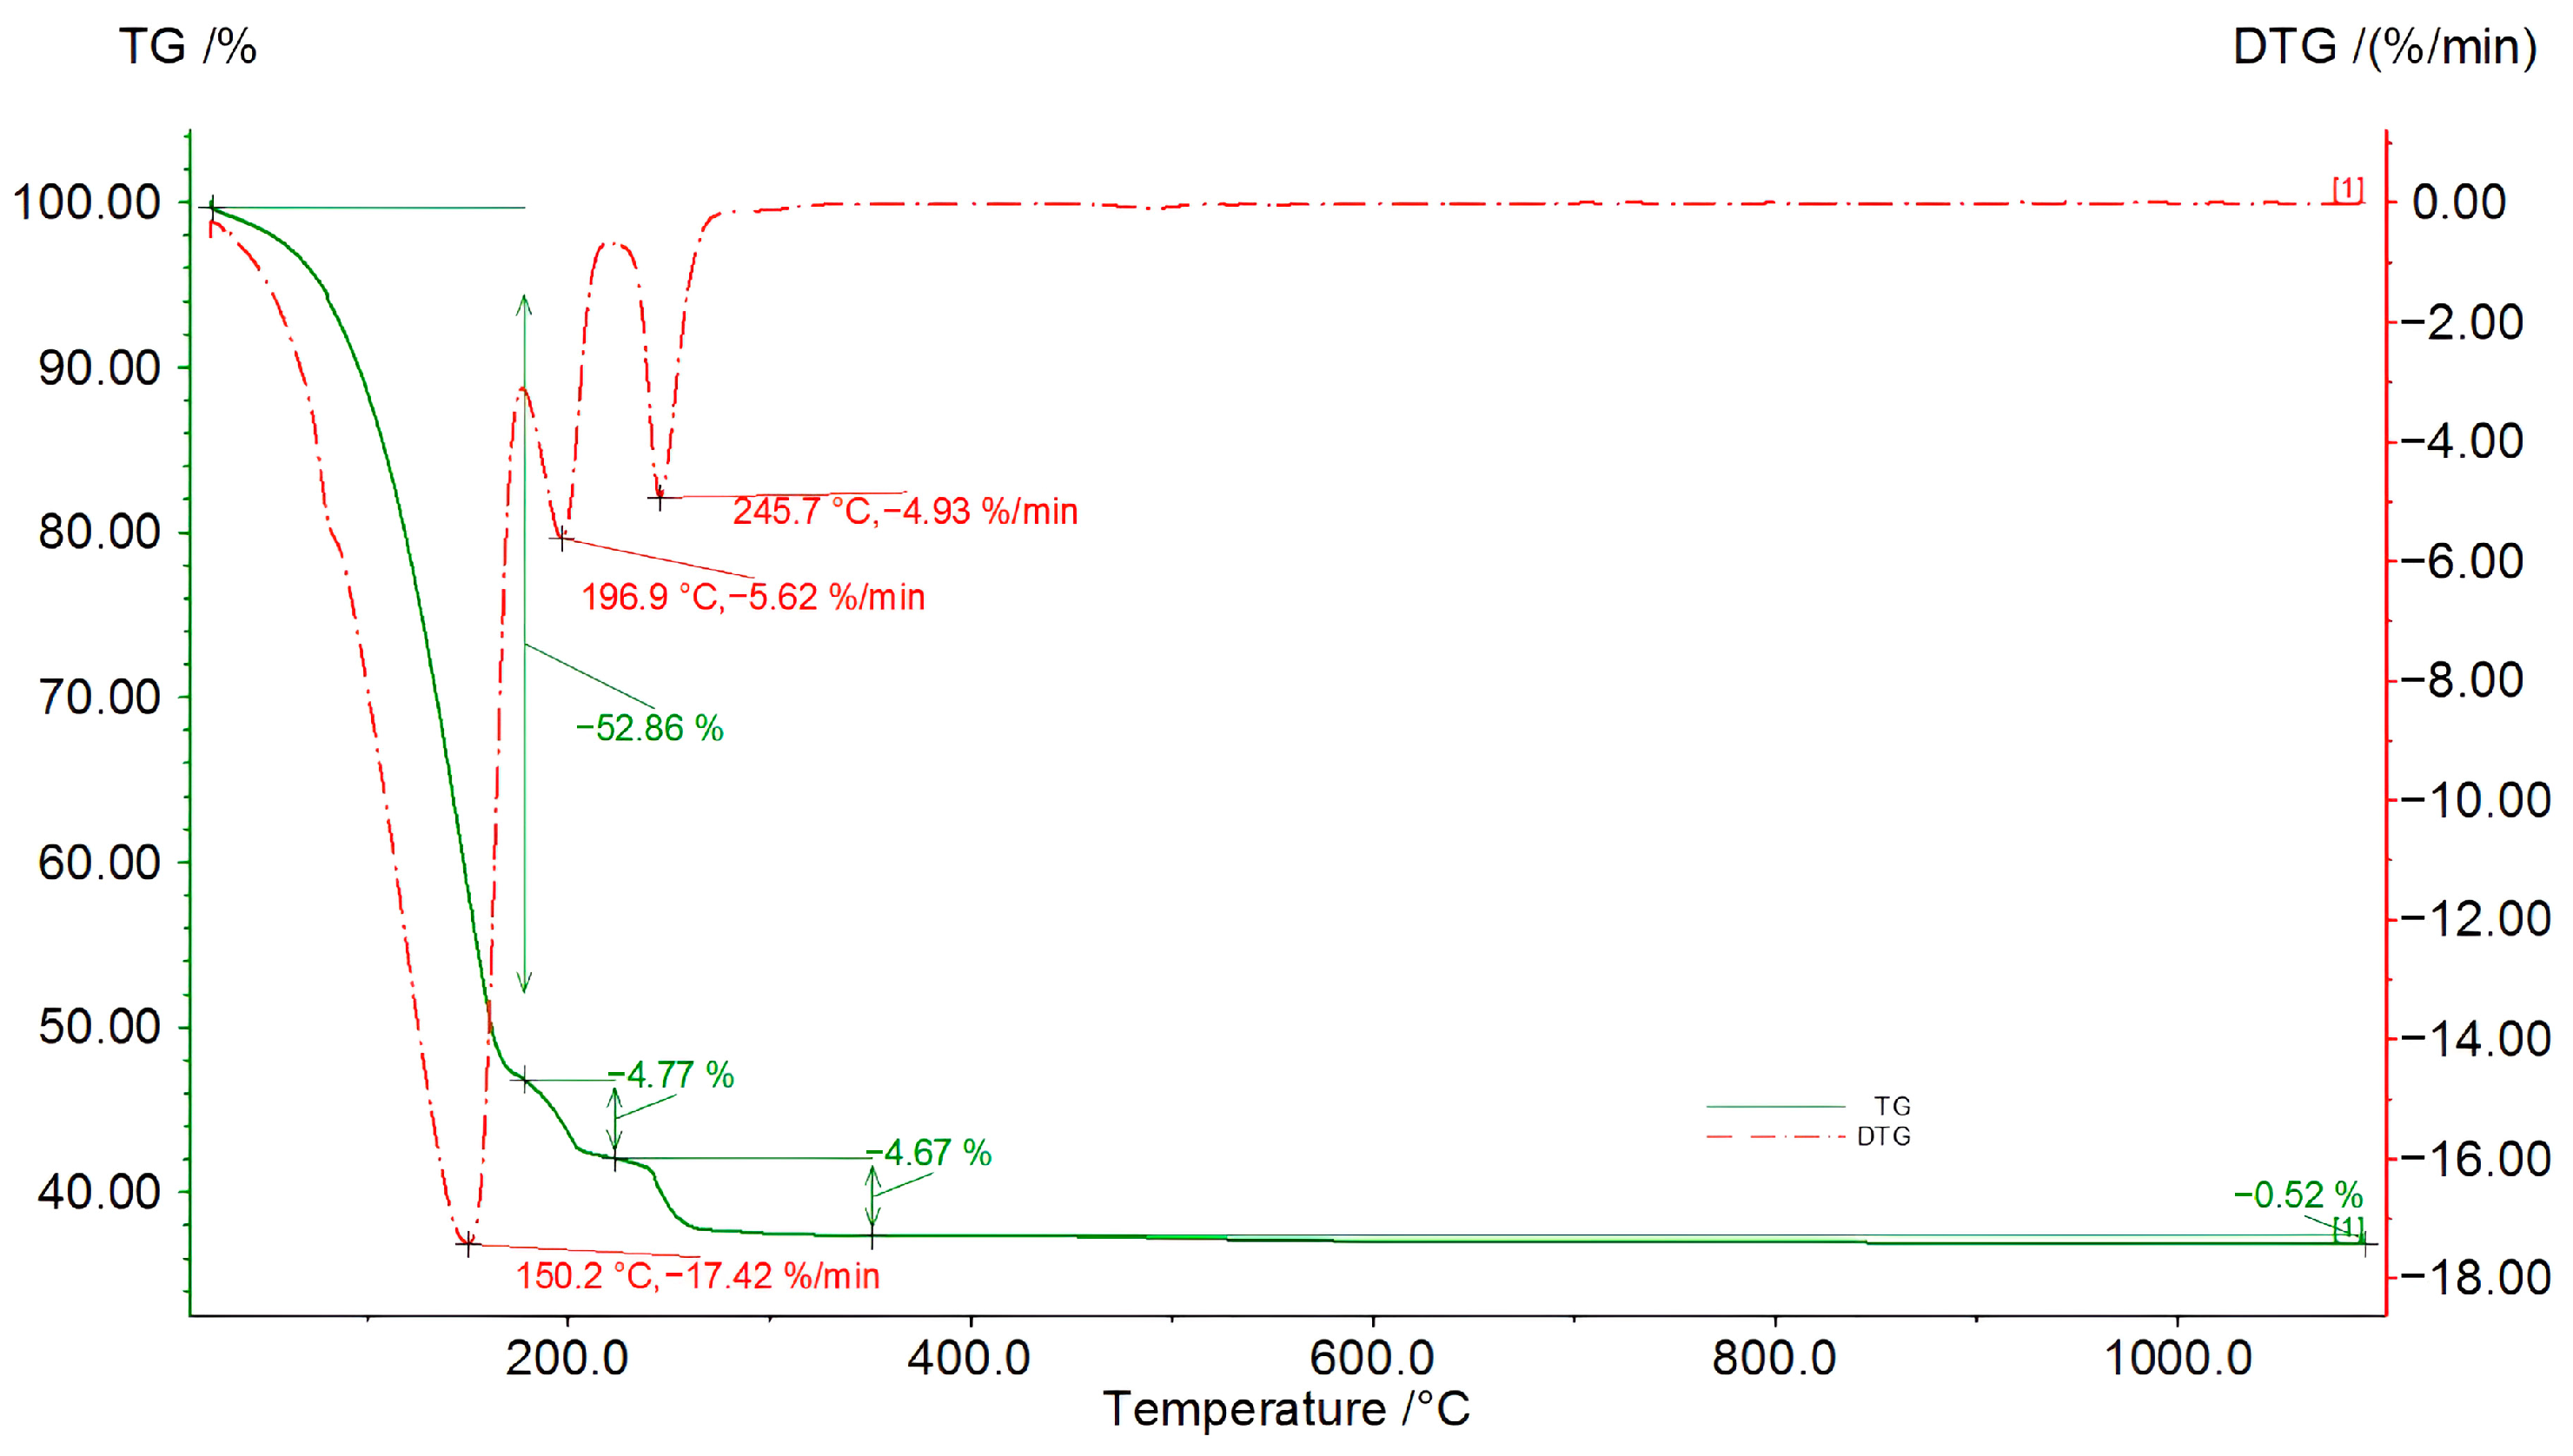
Figure 12.
TG/DSC/DTG curves of the aqueous phase after water extraction of the bio-oil produced in the first liquefaction after 24 h of reaction (solvent: 2EH).
Figure 12.
TG/DSC/DTG curves of the aqueous phase after water extraction of the bio-oil produced in the first liquefaction after 24 h of reaction (solvent: 2EH).
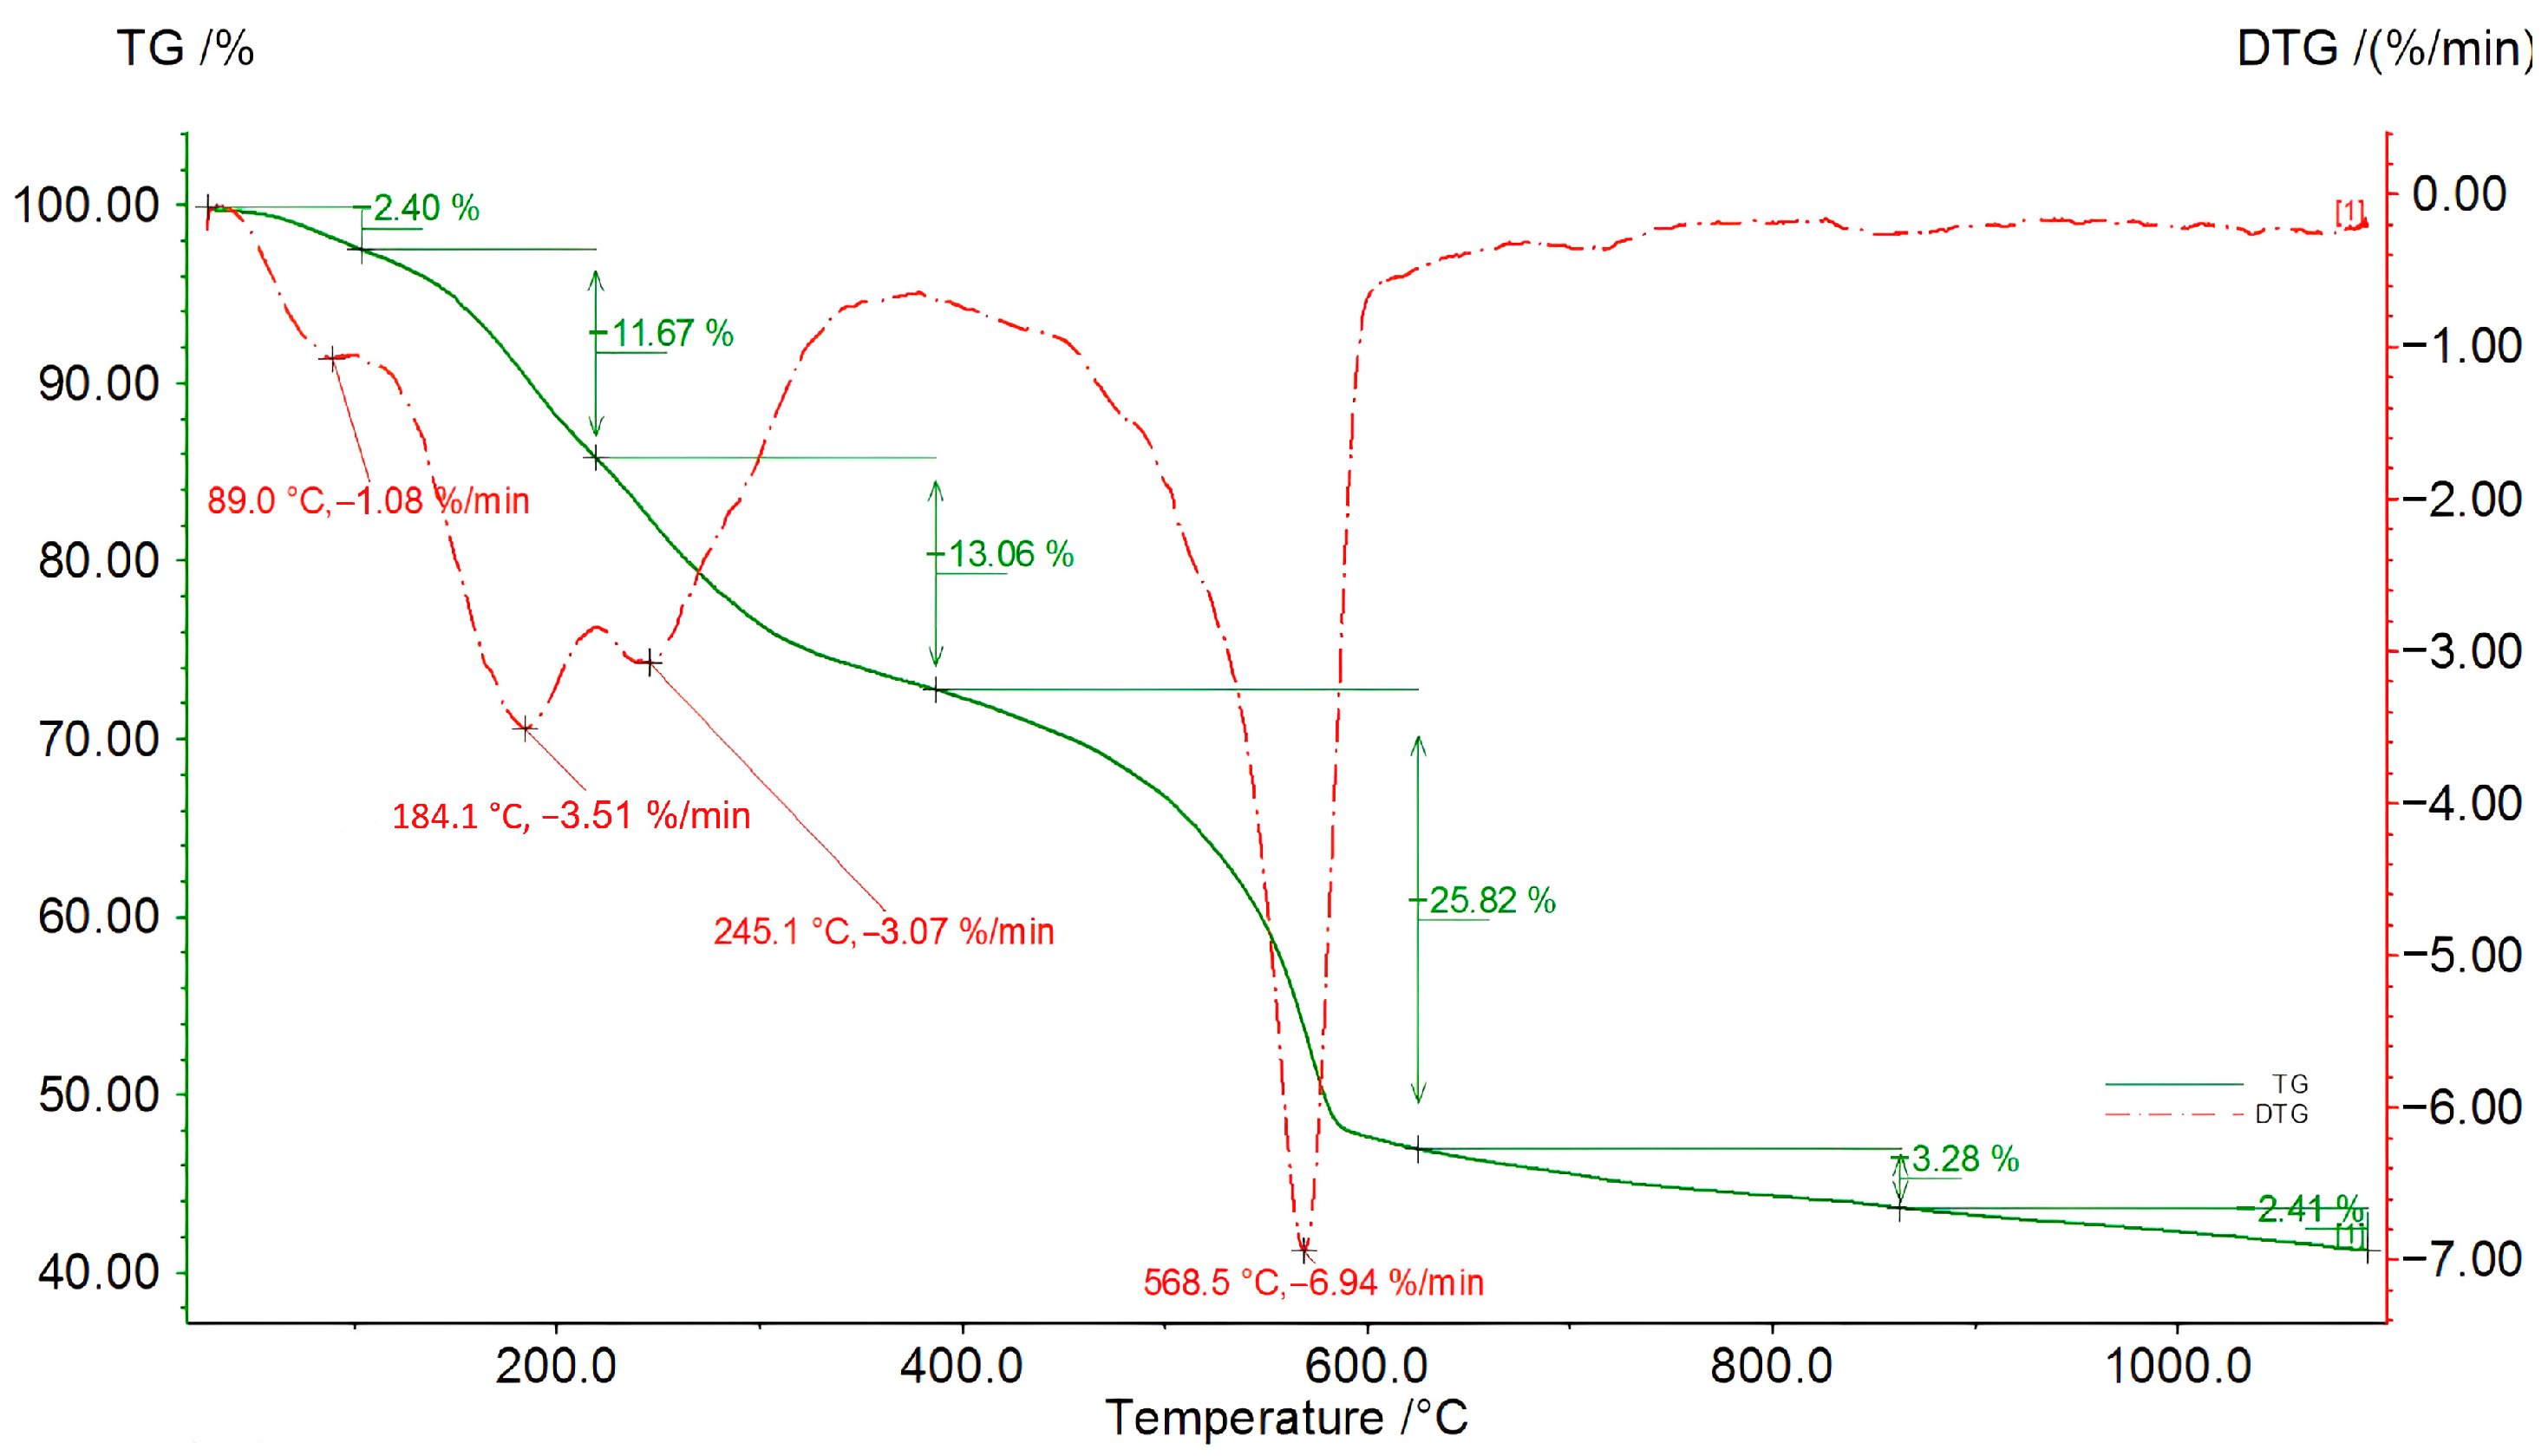
Figure 13.
TG/DSC/DTG curves of the dried sugars recovered from the aqueous phase of water extraction of the bio-oil produced in the first liquefaction after 24 h of reaction (solvent: 2EH).
Figure 13.
TG/DSC/DTG curves of the dried sugars recovered from the aqueous phase of water extraction of the bio-oil produced in the first liquefaction after 24 h of reaction (solvent: 2EH).
Figure 14.
FTIR spectrum of the third liquefaction condensates.
Figure 14.
FTIR spectrum of the third liquefaction condensates.
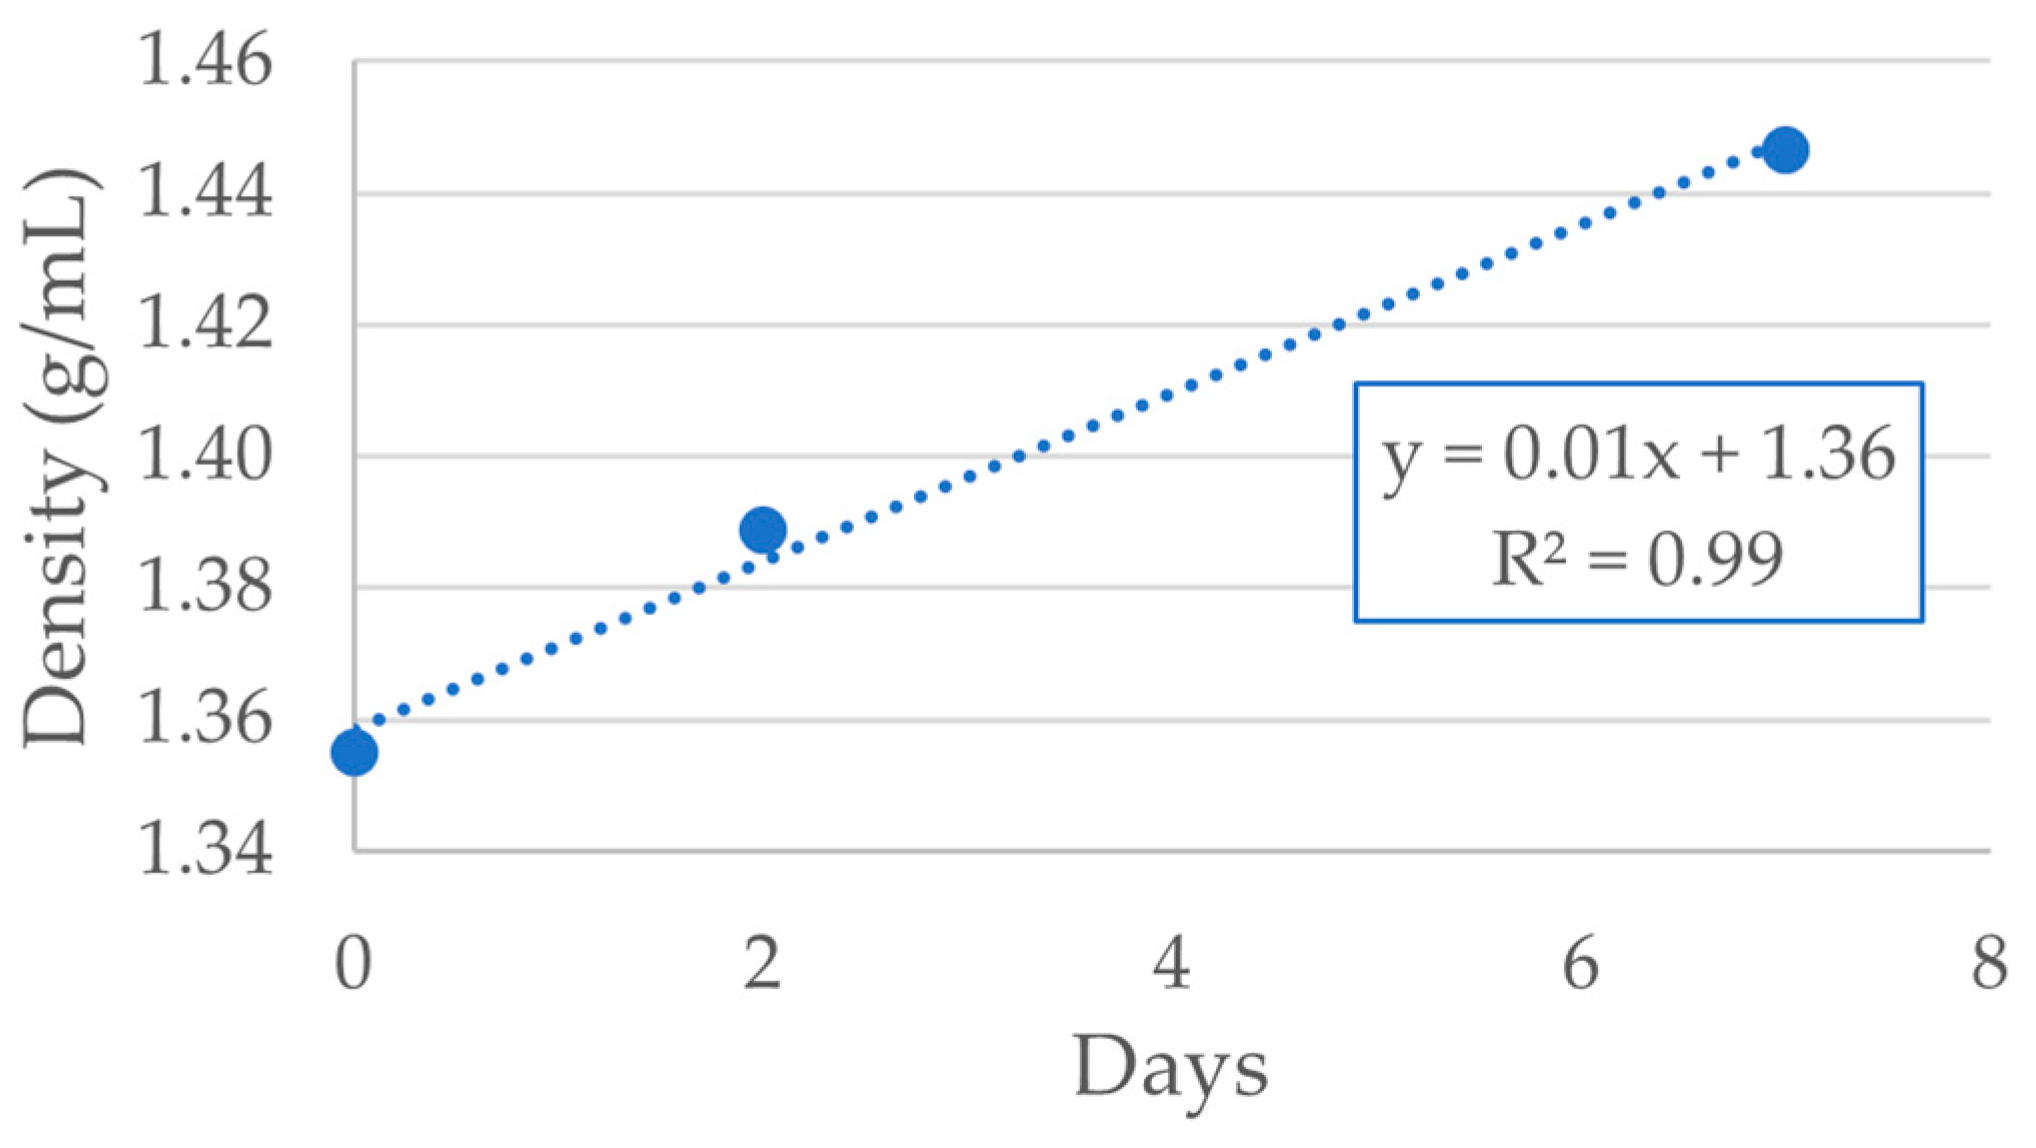
Figure 15.
Evolution of bio-oil density with time (third reaction, 10 h).
Figure 15.
Evolution of bio-oil density with time (third reaction, 10 h).
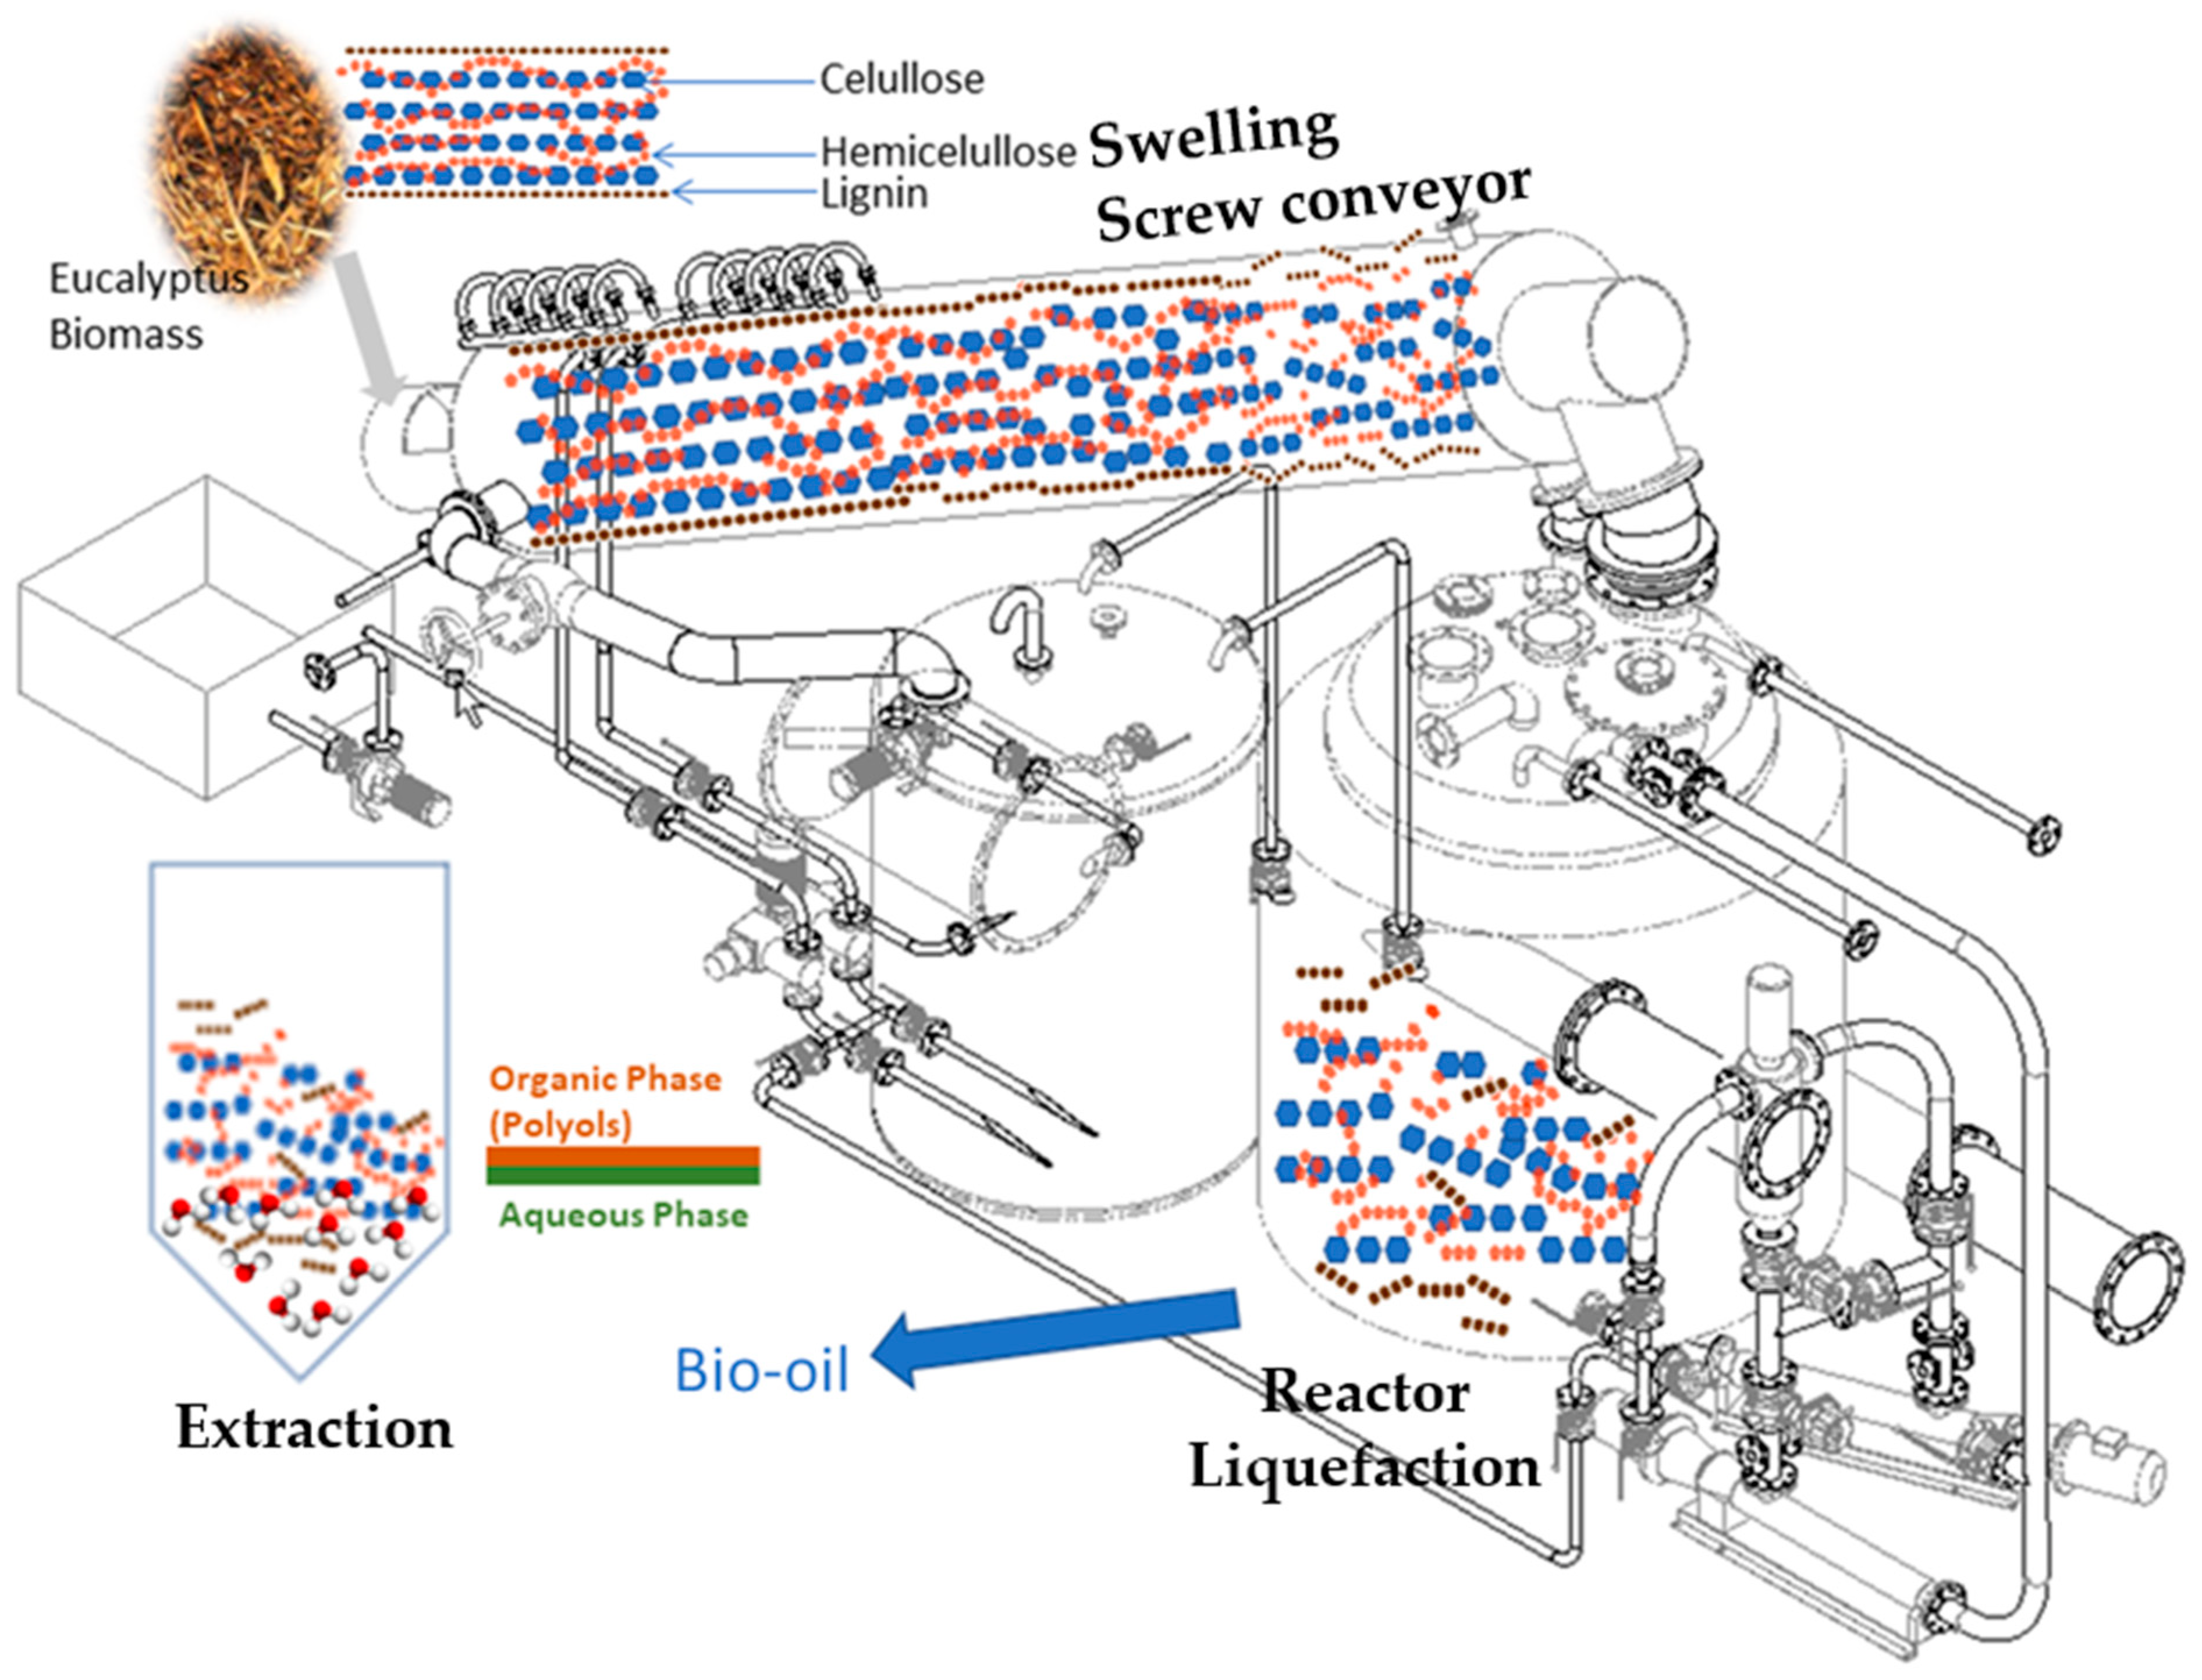
Figure 16.
Flowsheet of the biomass liquefaction process and sugar extraction stage (polyols: hydrophobic compounds (blue and orange chains); aqueous phase (water and hydrophilic compounds (brown chains).
Figure 16.
Flowsheet of the biomass liquefaction process and sugar extraction stage (polyols: hydrophobic compounds (blue and orange chains); aqueous phase (water and hydrophilic compounds (brown chains).
Table 1.
Biomass elemental composition (w:w) and HHV.
Table 1.
Biomass elemental composition (w:w) and HHV.
| Biomass Analysis | E. globulus Bark | E. globulus Sawdust |
|---|
| Weight loss at 105 °C (%) | 53.4 | 44.4 |
| Ash (%) | 6.4 | 1.7 |
| C (%) * | 46.0 | 49.3 |
| H (%) * | 5.3 | 5.7 |
| N (%) * | 1.2 | 1.0 |
| S (%) * | 0.1 | 0.1 |
| Cl (%) * | 0.2 | 0.1 |
| O (%) ** | 47.2 | 43.8 |
| HHV (kJ/kg) | 17,730 | 19,460 |
Table 2.
Biomass dry basis composition based on TGA (under N2 atmosphere).
Table 2.
Biomass dry basis composition based on TGA (under N2 atmosphere).
| Composition | E. globulus Bark | E. globulus Sawdust |
|---|
| Hemicellulose | 11.6% | 17.1% |
| Cellulose | 45.3% | 53.8% |
| Lignin | 12.7% | 10.5% |
| Residue | 30.4% | 18.6% |
Table 3.
Elemental analysis, weight loss at 105 °C, and calorific values of the liquefied product and polyols of E. globulus bark and sawdust.
Table 3.
Elemental analysis, weight loss at 105 °C, and calorific values of the liquefied product and polyols of E. globulus bark and sawdust.
| Analysis | E. globulus Bark | E. globulus Sawdust |
|---|
| Bio-Oil | Polyols | Bio-Oil | Polyols |
|---|
| Weight loss at 105 °C (%) | 7.0 | 62.9 | 46.8 | 53.6 |
| C (%) * | 62.4 | 45.2 | 65.3 | 56.3 |
| H (%) * | 11.7 | 9.3 | 9.7 | 9.8 |
| N (%) * | 1.8 | 1.2 | 1.3 | 1.2 |
| S (%) * | 0.3 | 0.1 | 0.4 | 0.3 |
| O (%) ** | 23.8 | 44.2 | 23.3 | 32.4 |
| HHV (kJ/kg) | 32,915 | 21,585 | 32,405 | 27,685 |
Table 4.
Elemental analysis, weight loss at 105 °C, calorific value, and density of bio-oils produced in the first liquefaction reaction. (Solvent: 2EH).
Table 4.
Elemental analysis, weight loss at 105 °C, calorific value, and density of bio-oils produced in the first liquefaction reaction. (Solvent: 2EH).
| Reaction Time (h) | 24 h | 48 h |
|---|
| Weight loss at 105 °C % (m/m) | - | 40.0 |
| C (%) * | 70.3 | 44.1 |
| H (%) * | 12.9 | 11.1 |
| N (%) * | 2.3 | 1.1 |
| S (%) * | 0.3 | 0.9 |
| O (%) ** | 14.2 | 42.8 |
| HHV (kJ/kg) | 38,790 | 22,880 |
| LHV (kJ/kg) | 36,065 | 20,525 |
| Density (kg/dm3) | 0.80 (25 °C) | 0.92 (25 °C) |
Table 5.
Elemental analysis, weight loss at 105 °C, moisture content, calorific value, and density of the liquefied product produced in the second liquefaction reaction. (Solvent: 2EH and DEG 1:1).
Table 5.
Elemental analysis, weight loss at 105 °C, moisture content, calorific value, and density of the liquefied product produced in the second liquefaction reaction. (Solvent: 2EH and DEG 1:1).
| Reaction Time (h) | 24 | 48 | 56 | 96 | 120 |
|---|
| Weight loss at 105 °C % | - | 59.8 | - | 28.1 | |
| Moisture (%) | | | | | 9.2 |
| C (%) * | 58.5 | 49.9 | 57.4 | 55.4 | 61.9 |
| H (%) * | 9.6 | 10.1 | 9.9 | 9.0 | 8.6 |
| N (%) * | 1.2 | - | - | 1.3 | 1.3 |
| S (%) * | 0.7 | 0.3 | 0.5 | 0.7 | 0.9 |
| O (%) ** | 30.0 | 39.8 | 32.2 | 33.6 | 27.3 |
| HHV (kJ/kg) | 28,595 | 24,374 | 28,200 | 26,780 | 29,730 |
| LHV (kJ/kg) | 26,565 | - | 26,110 | 24,870 | 27,950 |
| Density (kg/dm3) | - | - | 1.02 (25 °C) | - | 1.41 (25 °C) |
Table 6.
Elemental analysis, weight loss at 105 °C, moisture content, calorific value, and density of the liquefied product produced in the third reaction. (Solvents: 2EH and DEG 1:1).
Table 6.
Elemental analysis, weight loss at 105 °C, moisture content, calorific value, and density of the liquefied product produced in the third reaction. (Solvents: 2EH and DEG 1:1).
| Reaction Time (h) | 4 | 8 | 12 | 24 | 48 | 56 |
|---|
| Weight loss at 105 °C % (m/m) | 35.1 | 35.7 | 35.1 | 35.2 | 31.9 | 35.9 |
| Moisture % (m/m) | | | | | | 2.1 |
| C (%) * | 62.6 | 62.9 | 62.4 | 62.2 | 60.4 | 60.8 |
| H (%) * | 9.0 | 9.1 | 9.5 | 9.4 | 9.0 | 9.3 |
| S (%) * | 0.8 | 0.8 | 0.7 | 0.6 | 0.8 | 0.7 |
| O (%) ** | 27.6 | 27.2 | 27.5 | 27.8 | 29.9 | 29.3 |
| HHV (kJ/kg) | 30,282 | 30,364 | 30,551 | 29,933 | 28,530 | 29,108 |
| Density (kg/dm3) | 1.36 | 1.37 | 1,33 | 1.36 | 1.39 | 1.40 |
Table 7.
Standards used in HPLC-MS/MS.
Table 7.
Standards used in HPLC-MS/MS.
| Compounds | Standard |
|---|
| Arabinose|Xylose|Ribose | Succinic Acid |
| Glucose|Sorbose|Galactose Fructose|Mannose | Levulinic Acid |
| Lactic Acid | Xylitol |
| Cellobiose|Trehalose | Rhamnose |
Table 8.
Experimental conditions used in the lab-scale liquefaction of E. globulus bark and E. globulus sawdust.
Table 8.
Experimental conditions used in the lab-scale liquefaction of E. globulus bark and E. globulus sawdust.
| Conditions | E. globulus Bark | E. globulus Sawdust |
|---|
| Weight loss at 105 °C (%) | 53.4 | 44.4 |
| Ash (%) | 5.1 | 1.7 |
| Biomass (%) | 10 | 10 |
| Catalyst (%) | 1.5 | 1.5 |
| 2EH (g) | 750 | 750 |
| Biomass (g) | 188.3 | 152.4 |
| Temperature (°C) | 160 | 160 |
| Pressure (atm) | 1 | 1 |
| Reaction time (h) | 1 | 1 |


 ,
, 

