Article

Simulation of the Catalytic Gasification of Banana Biomass in the Production of Hydrogen, Using Glucose as a Model Compound

by
Jessica Gaona-Cumbicos
1,
Kelly Naula-Duchi
1,
Paúl Álvarez-Lloret
1,
William Mejía-Galarza
2,
Bolívar Bernal-Pesántez
2 and
Lourdes Jara-Cobos
1,*
1
Reactor Engineering, Catalysis and Environmental Technologies Group, Department of Biosciences, University of Cuenca, Cuenca 010205, Ecuador
2
Facultad de Ciencias Químicas, Universidad de Cuenca, Cuenca 010205, Ecuador
*
Author to whom correspondence should be addressed.
Catalysts 2023, 13(10), 1323; https://doi.org/10.3390/catal13101323
Submission received: 4 August 2023 / Revised: 15 September 2023 / Accepted: 20 September 2023 / Published: 25 September 2023
(This article belongs to the Section Biomass Catalysis)

Abstract

:
In the face of the climate change problem caused by fossil fuels, it is essential to seek efficient alternative energies with a lower environmental impact that are derived from renewable resources. Biomass gasification technology continues to generate significant interest in sustainable energy research as an alternative to traditional combustion technology. Gasification involves the thermochemical conversion of raw materials, resulting in a highly valuable gaseous product known as synthesis gas, commonly used as a fuel. Its numerous advantages include the availability of raw materials, the reduction in harmful emission streams, performance, and costs. As this topic gains momentum in the global energy framework, it is imperative to advance the maturity of this technology by addressing its weaknesses, primarily in terms of efficiency. The objective of this project was to investigate the hydrogen production process through the simulation of glucose gasification as a representative compound for biomass. This was achieved by conducting an integrated simulation of glucose gasification, encompassing both the heat transfer in the external system and the conversion of glucose into hydrogen gas, using the results obtained in the external system as initial conditions. Interrelated aspects of this complex process, including heat transfer and the kinetics of the gasification process, were modeled. Glucose was selected as the model compound due to its availability, simplicity, fundamental understanding, reproducibility, comparability, knowledge of reaction pathways, and simplification of mathematical models. The simulation resulted in a H2:CO ratio of 2.2, and molar fluxes were obtained for H2, CO, CO2, CH4, and H2O consistent with those typically observed in the gasification process of organic matter. These models were constructed, laying the foundation for the adaptability of subsequent optimization studies.

1. Introduction

The exponential growth of the world’s population, coupled with fundamental technological advancements essential for survival, converge at a common point: the growth of energy demand and the need to meet it [1,2]. This need is closely related to the preservation of regular economic performance [2,3]; therefore, any action taken regarding the energy source will have a certain level of impact [3]. Currently, the focus is on maintaining strategies for economic growth in conjunction with environmental damage mitigation, improving environmental quality, and seeking alternatives to address the evident depletion of non-renewable fossil fuel reserves [4]. Environmental quality is compromised by the generation of greenhouse gases resulting from the use of fossil fuels [1,5]. It is estimated that by the year 2060, global oil reserves will be depleted, making the search for sustainable and, if possible, renewable energy generation alternatives crucial [6]. The primary strategy is the production of renewable energies [7].
Renewable energy is obtained from non-depleting sources and is rapidly gaining increased global interest [8,9]. Biomass represents a potentially significant and ideal source for sustainable energy production [10]. In comparison to commonly used conventional fuels, biomass has the advantage of causing much lower environmental impact and flexibility in its source, with lignocellulosic residues being the most common source [11]. Bananas are one of the most widely produced commodities globally, abundant in countries with tropical and subtropical regions [12,13]. Being one of the most cultivated plants, it leaves behind large amounts of waste, including leaves, stems, pseudostems, and fruits that do not meet quality standards; these residues are used for energy generation [14].
The primary constituents of biomass are lignin, cellulose, and hemicellulose [15]. Cellulose is the most abundant compound among these components and is composed of repeating units of β-D glucose [16,17]. Given that cellulose is the predominant component in biomass and consists of glucose units, glucose serves as the model compound. Isolating glucose from biomass simplifies the energy extraction process [18]. The extraction of glucose from banana biomass involves various physical, chemical, and biological treatments, streamlining operational procedures and resource utilization [17].
One of the approaches for utilizing biomass as a renewable energy source is the production of hydrogen, a compound that can be obtained through thermochemical methods, including processes such as pyrolysis and liquefaction gasification, as well as through biochemical processes using microorganisms. Furthermore, thermochemical processes are considered the most optimal for obtaining hydrogen-rich synthesis gas from biomass [19]. Among these processes, steam gasification is the most promising for producing synthesis gas with hydrogen. In this pathway, the use of steam as a gasifying agent not only yields biogas rich in H 2 , but also minimizes environmental impact, especially by preventing the formation of NOx and with low C O 2 generation, thus making the obtained hydrogen “green” [20].
On the other hand, this form of energy is regarded as a key contributor to a green and sustainable future. Hydrogen offers ecological and efficient benefits, boasting a substantial energy potential of approximately 122 MJ/kg. This makes it a viable alternative to fossil fuel consumption due to its capacity to meet the energy needs of the latter. Some of the most significant advantages of hydrogen include its high energy conversion efficiency, its production with no water emissions, its potential for conversion into fuels, and its ability to be transported over long distances, among others [20].
In the production of biofuels from biomass, it is crucial to implement a pretreatment process. This aims to achieve effective and sustainable conversion, as it can reduce the recalcitrance of the biomass structure and generate solid residues with a high cellulose content. Various methods are employed for biomass pretreatment, including physical, chemical, biological, and combinations thereof utilizing liquid catalysts, such as acids, alkalis, and ionic liquids.
Physical pretreatment methods are focused on reducing particle size, thereby increasing the surface area. This, in turn, facilitates better degradation following chemical treatment. Key physical methods include milling, microwave-assisted pretreatment, and ultrasonication.
Chemical methods are responsible for modifying the crystalline structure of cellulose and removing hemicellulose and lignin fractions from the biomass. These methods employ solvents, alkalis, acids, and oxidizing compounds to achieve their objectives.
Biological methods are often employed in conjunction with chemical methods to enhance biomass degradation and improve biofuel yield. In these approaches, specific fungal and bacterial species are utilized to degrade lignin and cellulose components.
This integrated approach to biomass pretreatment plays a pivotal role in enabling efficient and sustainable biofuel production [21].
The production of hydrogen using sugars as the aqueous phase reforming (APR) of oxygenated compounds C n O n H 2 n + 2 was first proposed by Dumesic et al. This type of process consists of a series of reactions between the oxygenated reactant molecule and water in the liquid phase at a temperature of about 500–600 K with pressures between 10 and 50 bar, among the raw materials that can be reformed from methanol to cellulose, during the reaction process with the help of a catalyst, the reactant is converted into hydrogen and carbon dioxide with small amounts of carbon monoxides, methane, hydrocarbons and other oxygenated species. The production of hydrogen from glucose, xylose, and sugar alcohols, such as sorbitol and xylitol, representing hemicellulose in lignocellulosic biomass, or using a source of C5 sugars, through aqueous phase reforming (APR), involves a reaction utilizing a platinum-based catalyst supported on carbon in a batch process at low temperatures ranging from 473 to 553 K, with the aim of achieving improved energy efficiency. In general, this process begins with a pretreatment of lignocellulosic biomass through a hydrogenation stage to convert sugars into their corresponding sugar alcohols. Subsequently, this mixture, referred to as a hydrolyzed compound, can be replaced by a model mixture of glucose/xylose. These compounds are then subjected to aqueous phase reforming to produce hydrogen [22].
The gasification process is one of the most widely employed technologies for deriving renewable energy from biomass, enabling the production of hydrogen, a well-known energy vector [23]. Gasification involves partial thermal oxidation, typically carried out at temperatures ranging from 800 to 1000 °C, in the presence of gasifying agents such as steam or oxygen, which supply oxygen to the process [19]. The primary objective of gasification is to convert biomass into synthesis gas, which comprises carbon dioxide ( C O 2 ), water ( H 2 O ), carbon monoxide ( C O ), hydrogen ( H 2 ), methane ( C H 4 ), and various other gaseous compounds. Additionally, small quantities of solid carbon, ash, and other condensable substances like tars and oils are generated during the process [23,24,25]. The proportions of these products in the synthesis gas are notably influenced by factors such as the composition of the biomass, the raw materials used, operational conditions, the type of gasifier, and the gasifying agent employed [26]. During gasification, cellulose is rapidly and completely converted into glucose at approximately 400 °C. The primary reactions involved are glucose hydrolysis and the water–gas shift reaction [27].
In Table 1 [28], the degradation of biomass based on its lignocellulosic content is depicted as a function of temperature, with decomposition initiating at temperatures below 373 °C.
During the biomass gasification process, two stages occur depending on the formation of products. Stage I involves the creation of char with high concentrations of H2 and O2, as well as the cracking of volatile substances. As the temperature increases, the char transforms into fixed carbon, which reacts with the gasifying agent to produce synthesis gas in Stage II [23]. The gasification process comprises several chemical reactions, including drying, thermal decomposition or pyrolysis, partial combustion of certain gases, vapors, and char, and ultimately the gasification of the decomposition products [19].
Approximately two-thirds of the cellulose mass is arranged into an ordered structure, forming stable crystallization zones. The high-density hydrogen bonding within these crystallization zones renders cellulose less soluble and resistant to conversion. Consequently, cellulose is insoluble in water and most organic solvents [20].
The gasifier is the vessel where the gasification process reactions occur. Its selection depends on biomass properties, product requirements, and the chosen gasifying agent. Three primary types of gasifiers are commonly utilized: upflow and downflow fixed bed gasifiers, fluidized bed gasifiers, and entrained flow gasifiers. The upflow gasifier boasts high thermal efficiency and can accommodate biomass with up to 60% moisture content, although it tends to generate more tar. In contrast, the downflow gasifier produces fewer tars and is suitable for lower moisture content biomass, typically up to 30%. Lastly, the fluidized bed gasifier offers higher efficiency and improved biomass conversion due to more uniform heat distribution [29].
Several studies have found that renewable energy has an indirect influence on attitudes towards its use, mediated by its impact on the perceived ease of use and perceived usefulness [29]. To optimize processes, biomass should be as cost-effective as possible, as conditions significantly impact expenses. Cost estimates are also subject to external factors like fluctuating fossil fuel prices, variations in biofuel policies within a specific country, and emissions.
According to Adamu and Hossain [24], the kinetic model of glucose gasification is described by the Langmuir–Hinshelwood mechanisms. This model encompasses adsorption processes, desorption during reactant activation, surface reactions, and product desorption. Additionally, the process involves the water–gas shift (WGS) reaction, dry methane reforming reaction (RDRM), and steam methane reforming (SMR) reaction.
The evolution of this complex reactions scheme can be simulated using specialized software [30], such as Ansys Fluent. This tool enables the study of fluid thermal behavior during the glucose gasification process through computational fluid dynamics, revealing the temperature distribution within the system [27]. The simulation process is divided into three fundamental stages: (a) pre-processing, where the geometric model of the system is defined, (b) followed by mesh construction and the specification of material properties and boundary condition [31,32], and (c) post-processing, during which the analyst verifies and validates the model [33].
On the other hand, Python is an open access programming language that is highly valuable for scientific computing and can be applied effectively in the field of chemistry [34,35]. By employing material balances for each chemical species and incorporating the corresponding kinetic equations for each reaction generated during the gasification process, it becomes possible to observe and study the conversion of raw materials into their respective products.
In this way, Ansys Fluent will be used to compute the temperature profile inside the chemical reactor where gasification will proceed, and Python will be used to calculate the axial concentration profiles for each chemical species involved in the gasification process. The approach of initially simulating the thermal process and subsequently integrating those results into a new model focused on the catalyst offers several advantages.
Firstly, it enhances the accuracy of modeling by capturing the real impact of actual thermal conditions on catalyst activity. This, in turn, simplifies the identification of optimal thermal conditions for the catalyst, thereby enhancing the efficiency and selectivity of the gasification process.
Moreover, this methodology conserves resources by circumventing the initial complexity of directly modeling the catalyst, providing a more comprehensive understanding of the interactions between thermochemistry and catalysis.
Lastly, its versatility makes it applicable to various gasification processes, thereby expanding its utility in biomass conversion research.

2. Results and Discussion

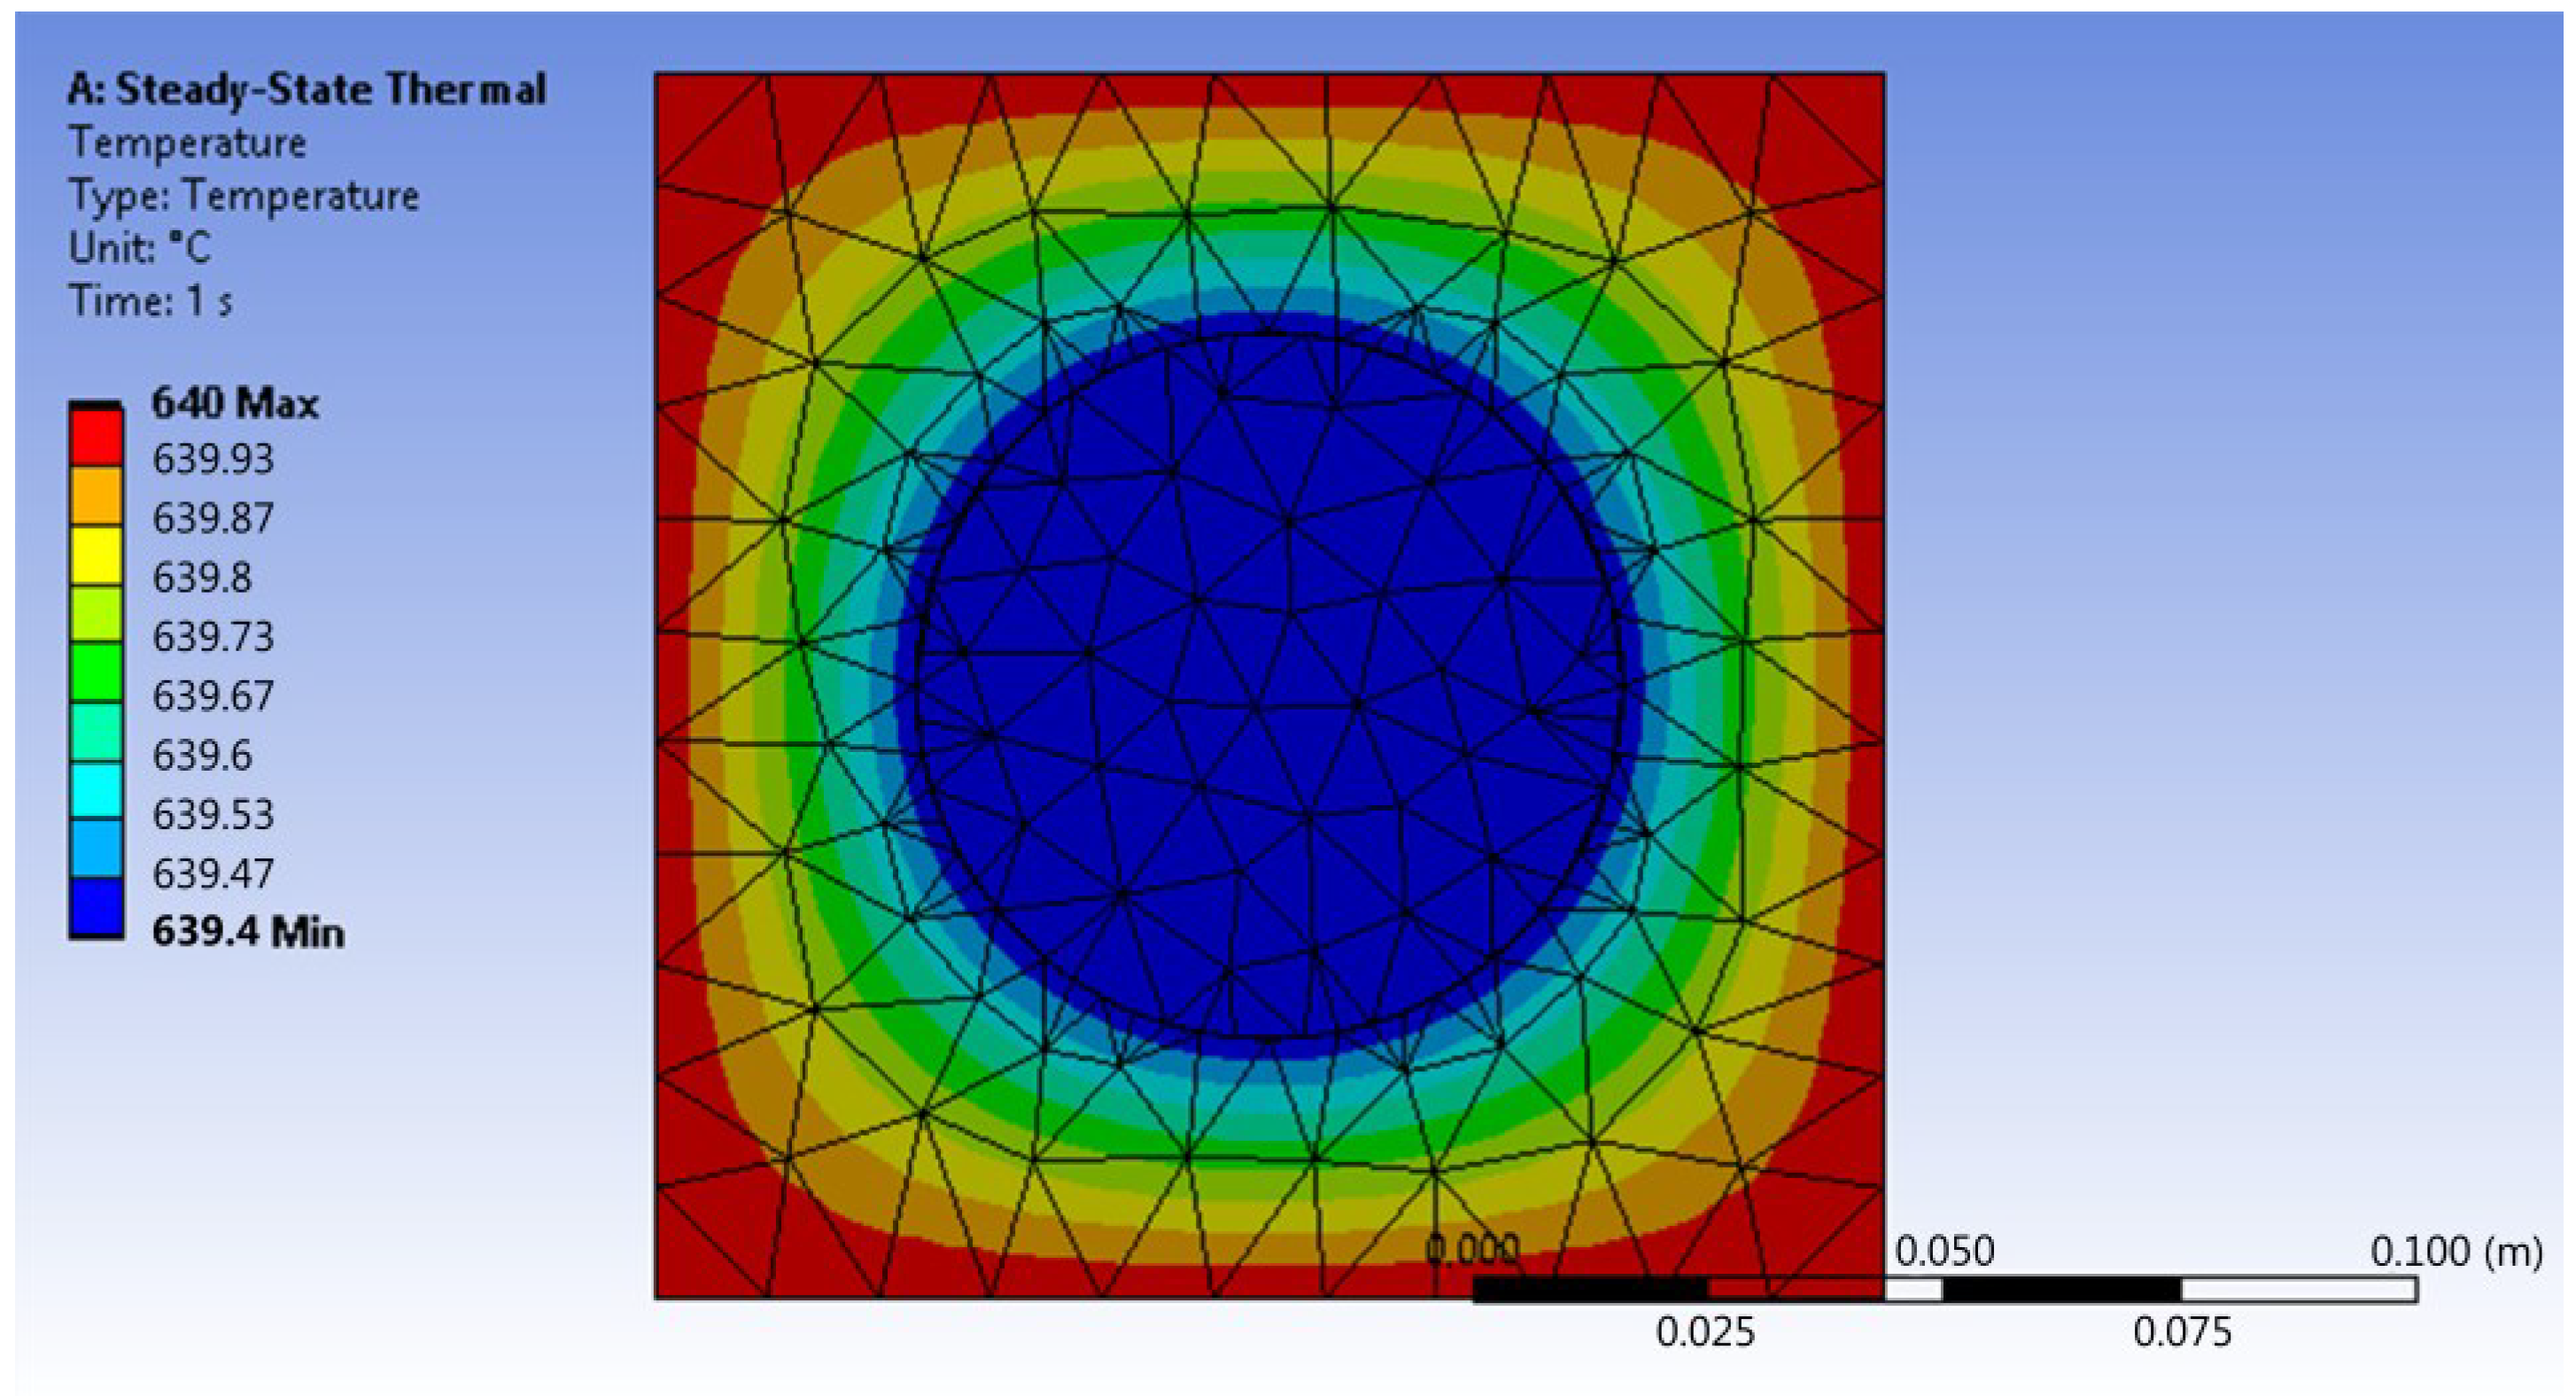
2.1. Temperature Distribution inside the Oven

Heat was transferred in this system by convection of hot air towards the walls of the reactor. It is assumed that the water vapor entering the system is 640 °C. However, it is not the real temperature because it does not consider aspects such as the influence of the heat transfer coefficient or interferences due to interactions with the ambient temperature; therefore, the temperature in the area that represents the surface of the reactor reaches a real value of 639.4 °C. This value indicates that the heat transfer is occurring almost optimally, but it is this value that will be used in the next stage, which corresponds to the gasification of glucose. The way heat is transferred through the system is shown in Figure 1.

2.2. Fluid Behavior inside the Reactor

2.2.1. Velocity through the Reactor

The fluid velocity at the reactor inlet was 0.0065 m/s, but as it passed through the biomass and catalyst bed, it experienced a reduction. This can be observed in the central region (Figure 2a,b), where the velocity decreased to approximately 0.00185 m/s, while on the walls it approached zero.

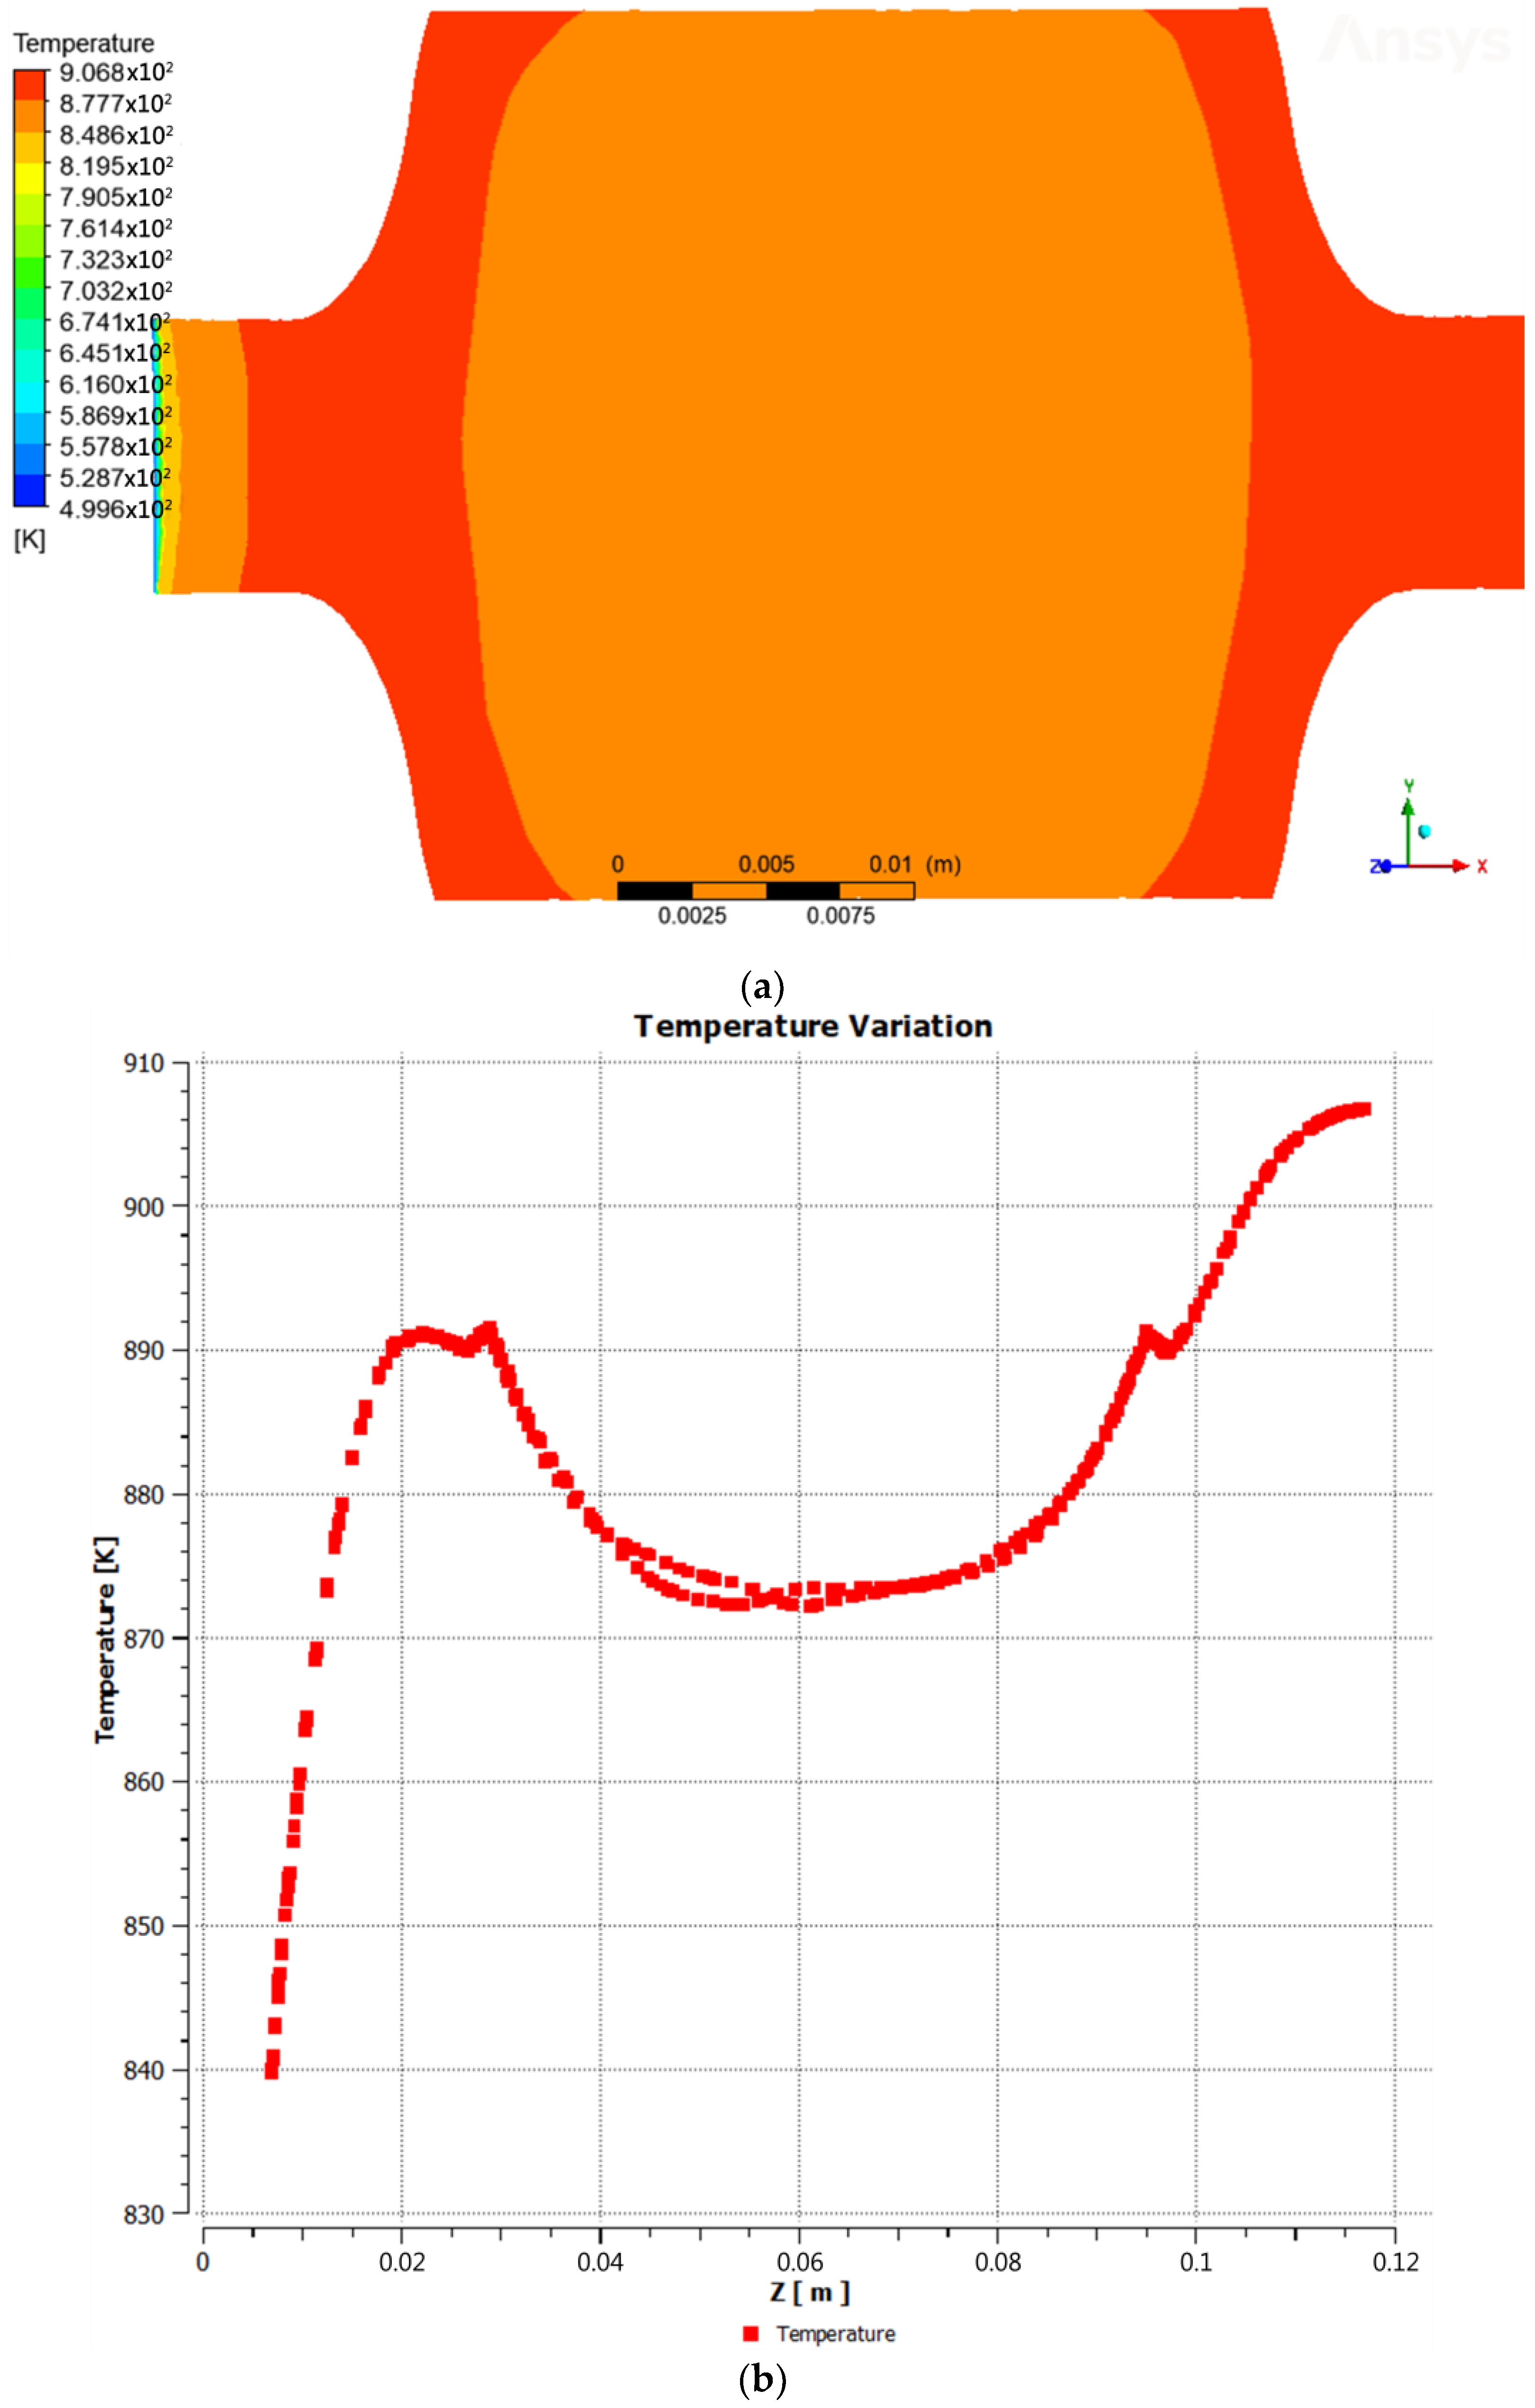
2.2.2. Temperature across the Reactor

The temperature distribution inside the reactor, accounting for the flow of the gasifying agent and the gases generated during the reaction, was as follows: the gasifying agent entered the reactor at a temperature of 226.85 °C, while the inner walls of the reactor reached 637.2 °C. Consequently, as the fluid passed through the reactor, it gradually attained a higher temperature, reaching approximately 604.7 °C (Figure 3a,b). This value was employed as the gasification reaction temperature.

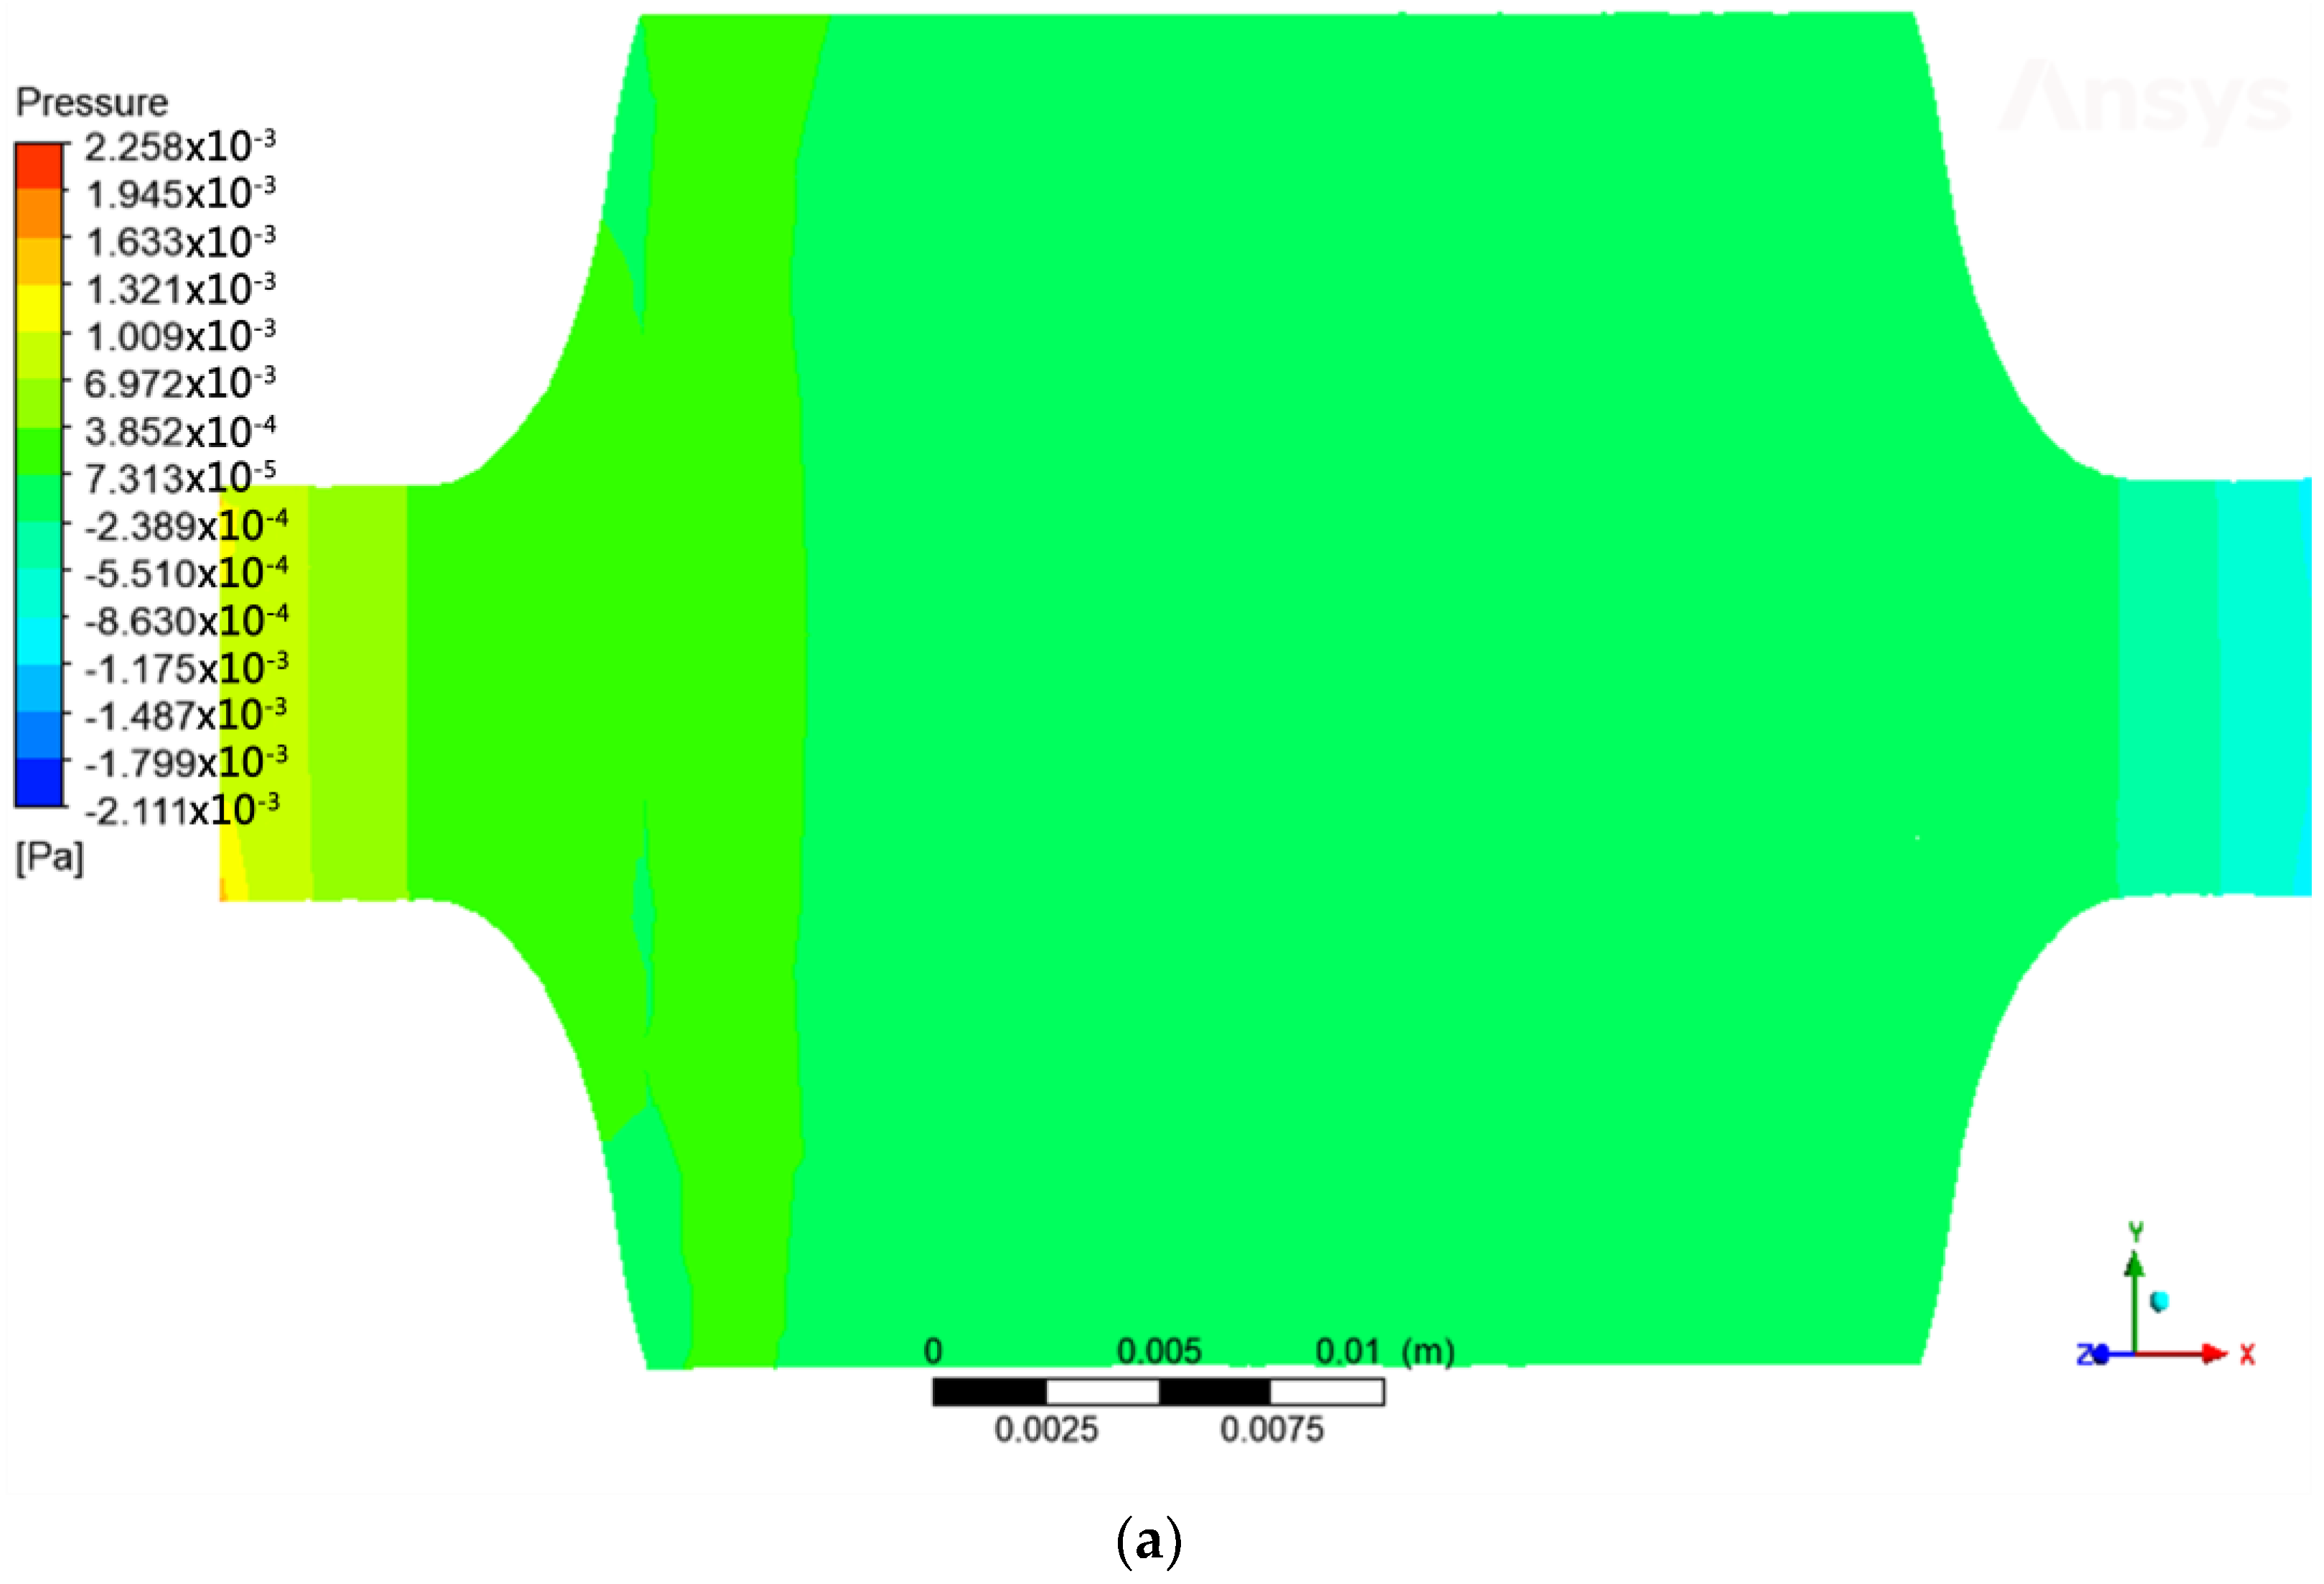
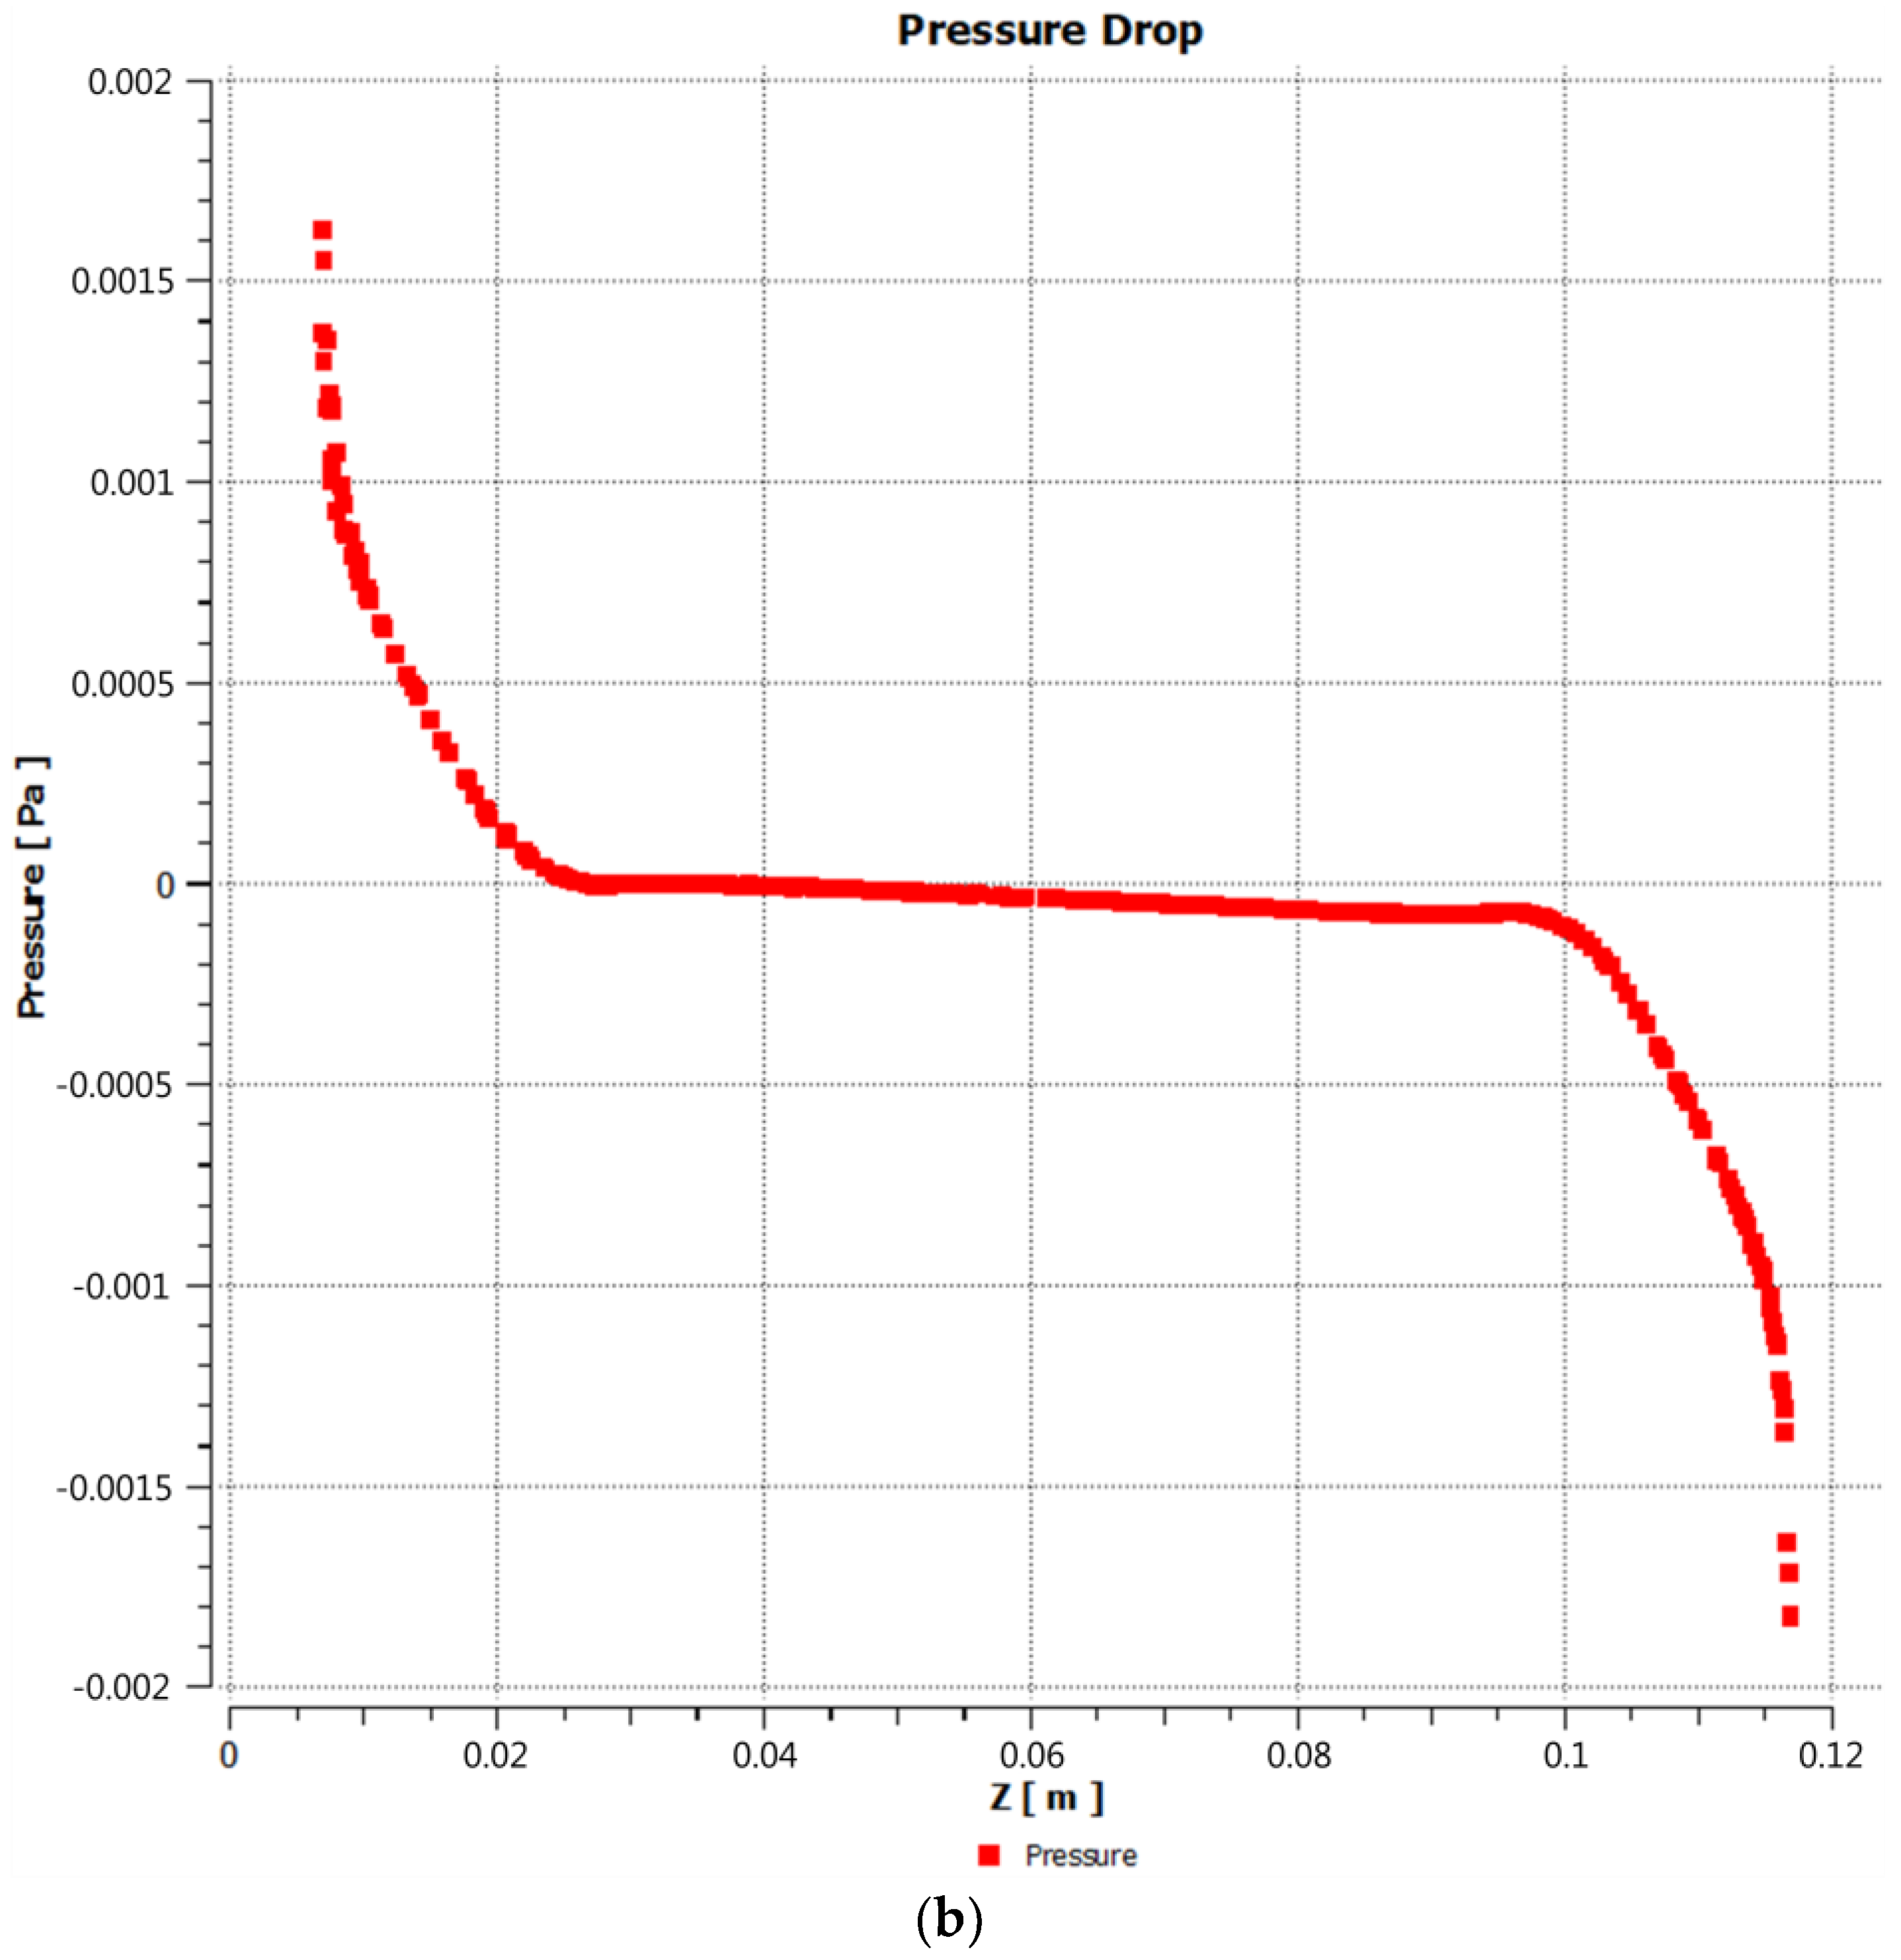
2.2.3. Pressure Drop across the Reactor

When the steam and gases generated in the gasification process pass through the reactor, they encounter some resistance due to the structure and internal components of the reactor. This resistance may be due to the geometry of the reactor, the presence of catalysts, physical obstacles, or any other factor that hinders the movement of the gas flow. Due to this resistance, a pressure drop occurs as the flow of gases progresses through the reactor. Pressure drop is the decrease in gas pressure as it flows through a conduit or reactor. In this case, the pressure drop occurs inside the gasification reactor due to the resistance encountered by the gases. By having a lower pressure inside the reactor compared to the outside environment, the gases generated have a tendency to expand (Figure 4a,b). This is because as the pressure decreases, the density of the gases also decreases. As a result, the gases become less dense and expand. This expansion makes it easier for the gases to rise through the reactor.

2.3. Simulation of the Gasification Reaction

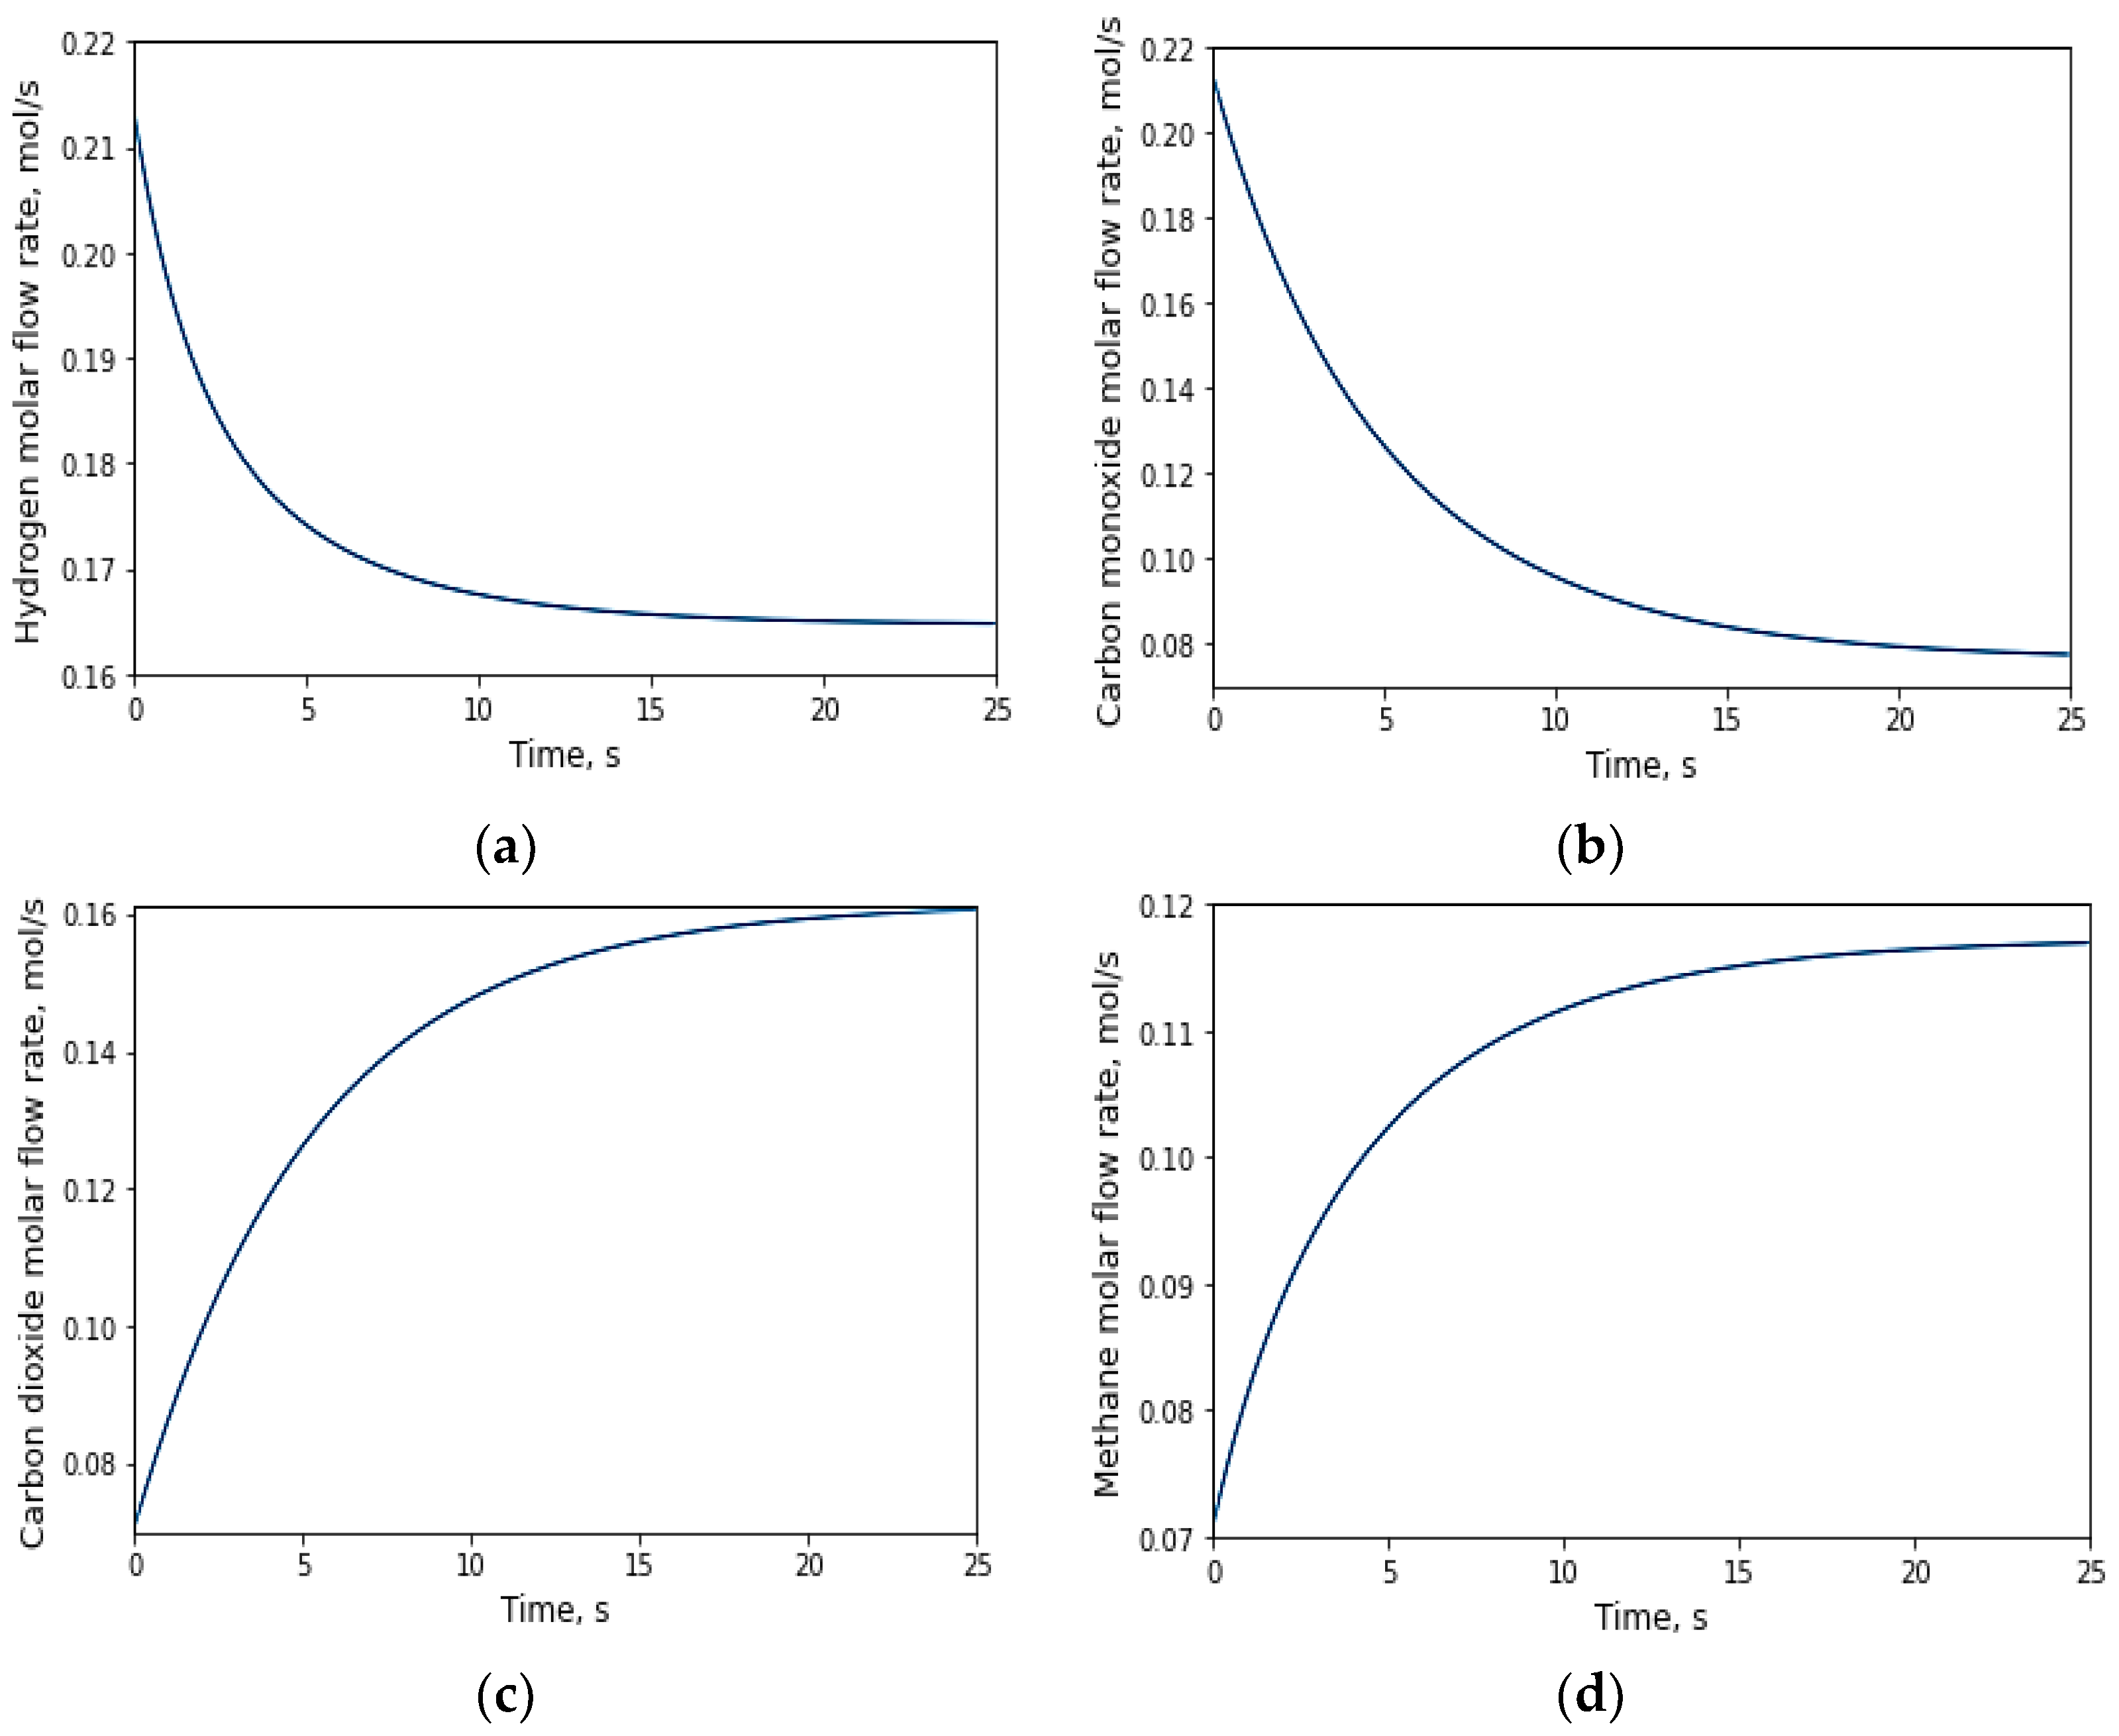
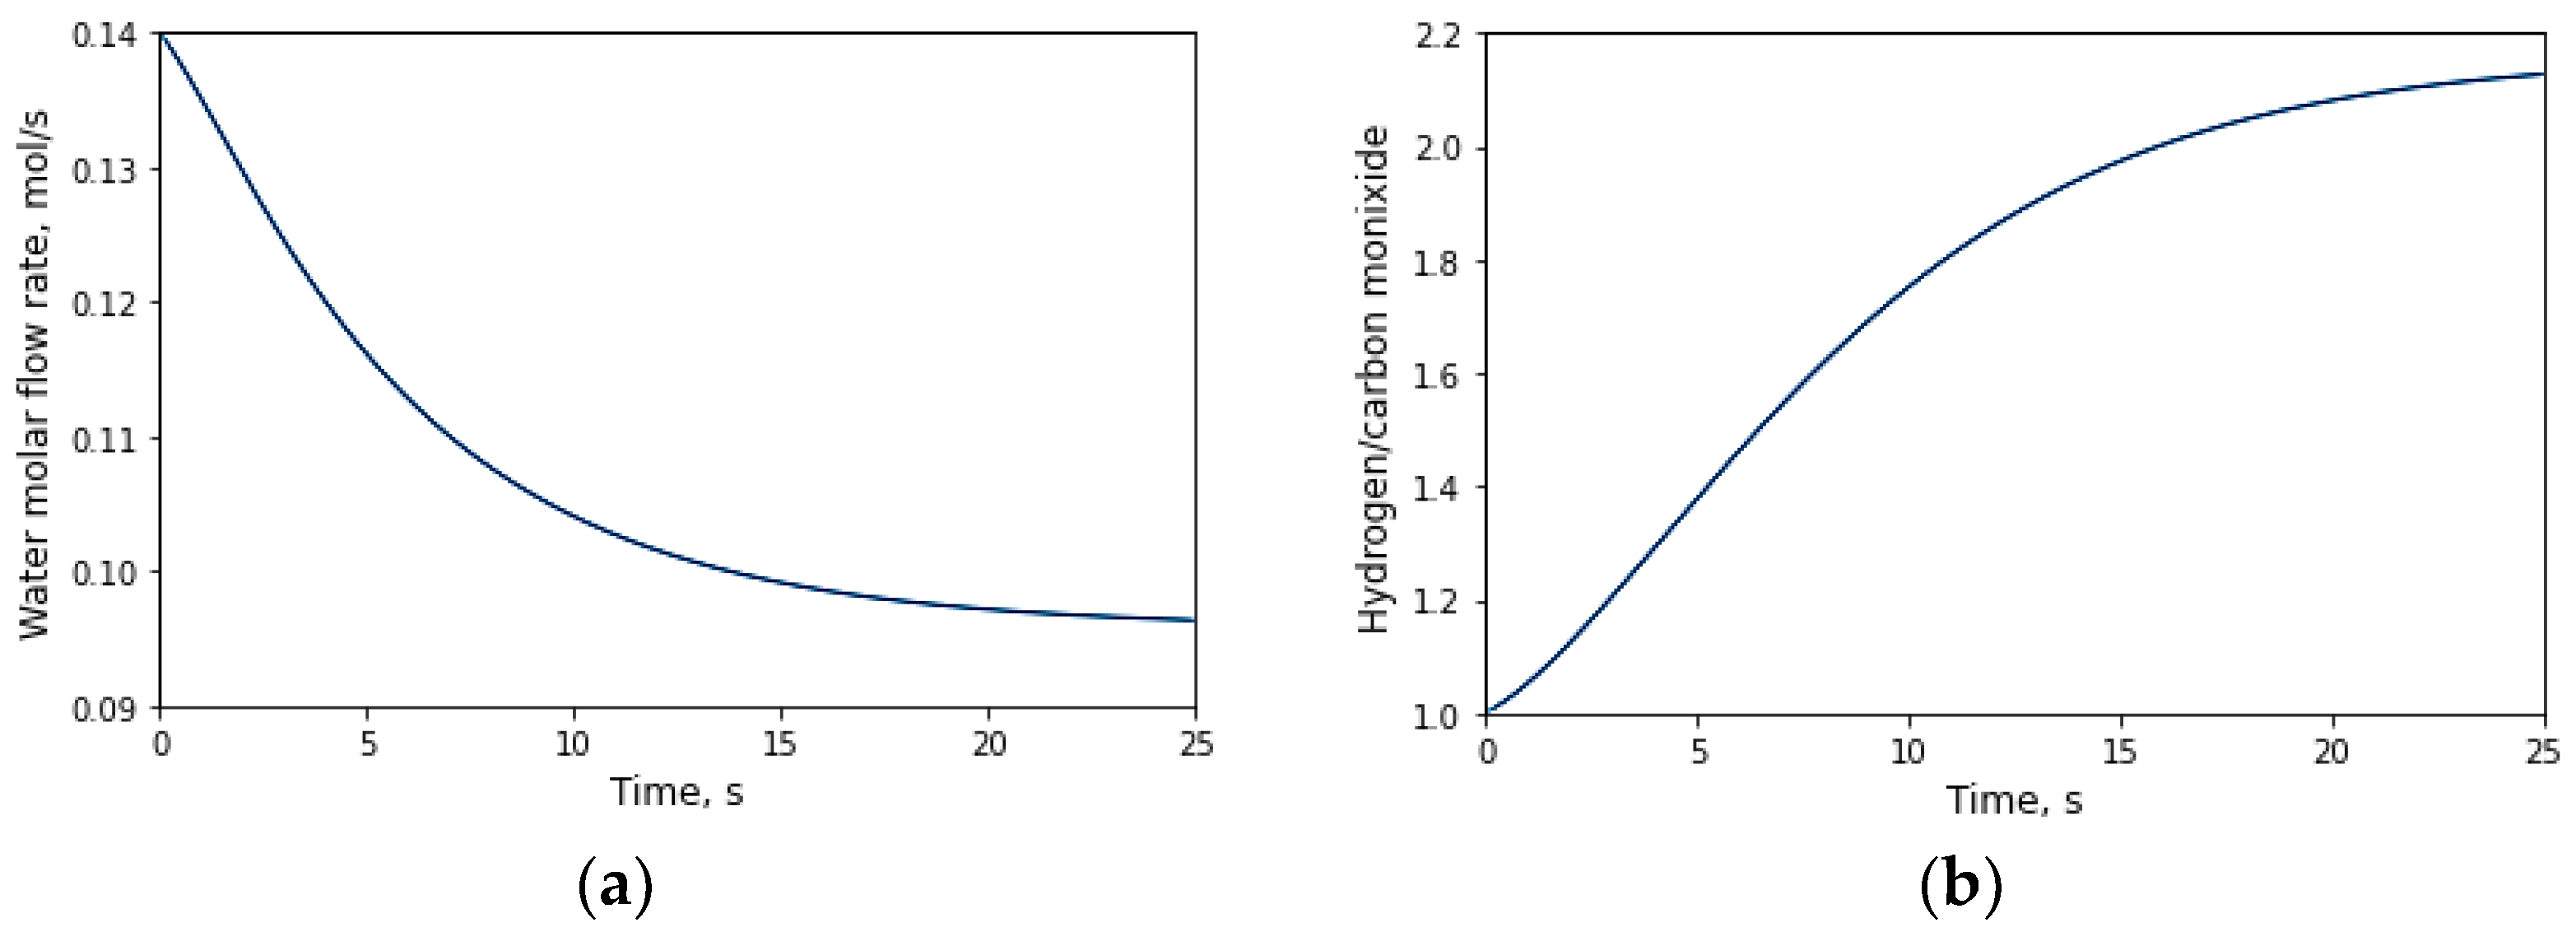
2.3.1. Evolution of the Number of Moles with Respect to Time

In the gasification reaction, an increase in the production of carbon dioxide and methane occurred since they are end products in both the WGS and RDRM reactions, as illustrated in Figure 5c,d. The evolution of hydrogen yield stabilized at approximately 0.16 mol/s, which represents the maximum value reached before reaching a constant production rate. The authors of [18], in their study titled “Hydrogen production through the gasification of glucose using 5% Ni catalysts with 2% La, Ce, and Mg and derivation of an intrinsic reaction rate equation”, reported values approaching 0.3 mol/s for temperatures close to those above 600 °C and catalysts with higher nickel contents. In a gasification process that involves reforming methane with steam and reverse reforming methane with steam, there are previous reactions that involve methane and water vapor, which causes hydrogen to be produced before the gasification reaction begins [36] (which can be seen in Figure 5a).
Furthermore, in their study titled “Hydrogen production through glucose gasification using γ-Al2O3 catalysts with Ni, Ce, and La, and interpretation of results using a non-stoichiometric model”, ref. [37] utilized glucose as a biomass model and achieved the maximum hydrogen yield at temperatures up to 600 °C with a reaction time of 30 s.
The constant H2:CO ratio is approximately 2.2. As reported by [38] in his study titled “Heterogeneous Catalysis for the Energetic Use of Biomass”, values close to or equal to 2 are required to achieve optimal hydrogen utilization. Typically, a high H2:CO ratio is observed when operating at elevated temperatures, exceeding 500 °C, falling within the range of 1.7 to 2 [39]. Some authors find this value acceptable; [40] find the H 2 : C O ratio reaches its maximum value at 2, for temperatures up to 700 °C. The authors of [18] suggest that a range of 2–3 for the H 2 : C O ratio is deemed high; however, the “suitability” of this value hinges on the specific context of the reaction and its intended outcomes, H 2 : C O ratios in the range of about 1.5 to 2 for good quality syngas [41]. In certain reactions, such as ammonia synthesis, an H 2 : C O ratio of approximately 2.2 is deemed suitable and is considered efficient for yielding the desired product [36]. In both WGS and SRM reactions, one of the reactants is water, and this consumption is illustrated in Figure 6.

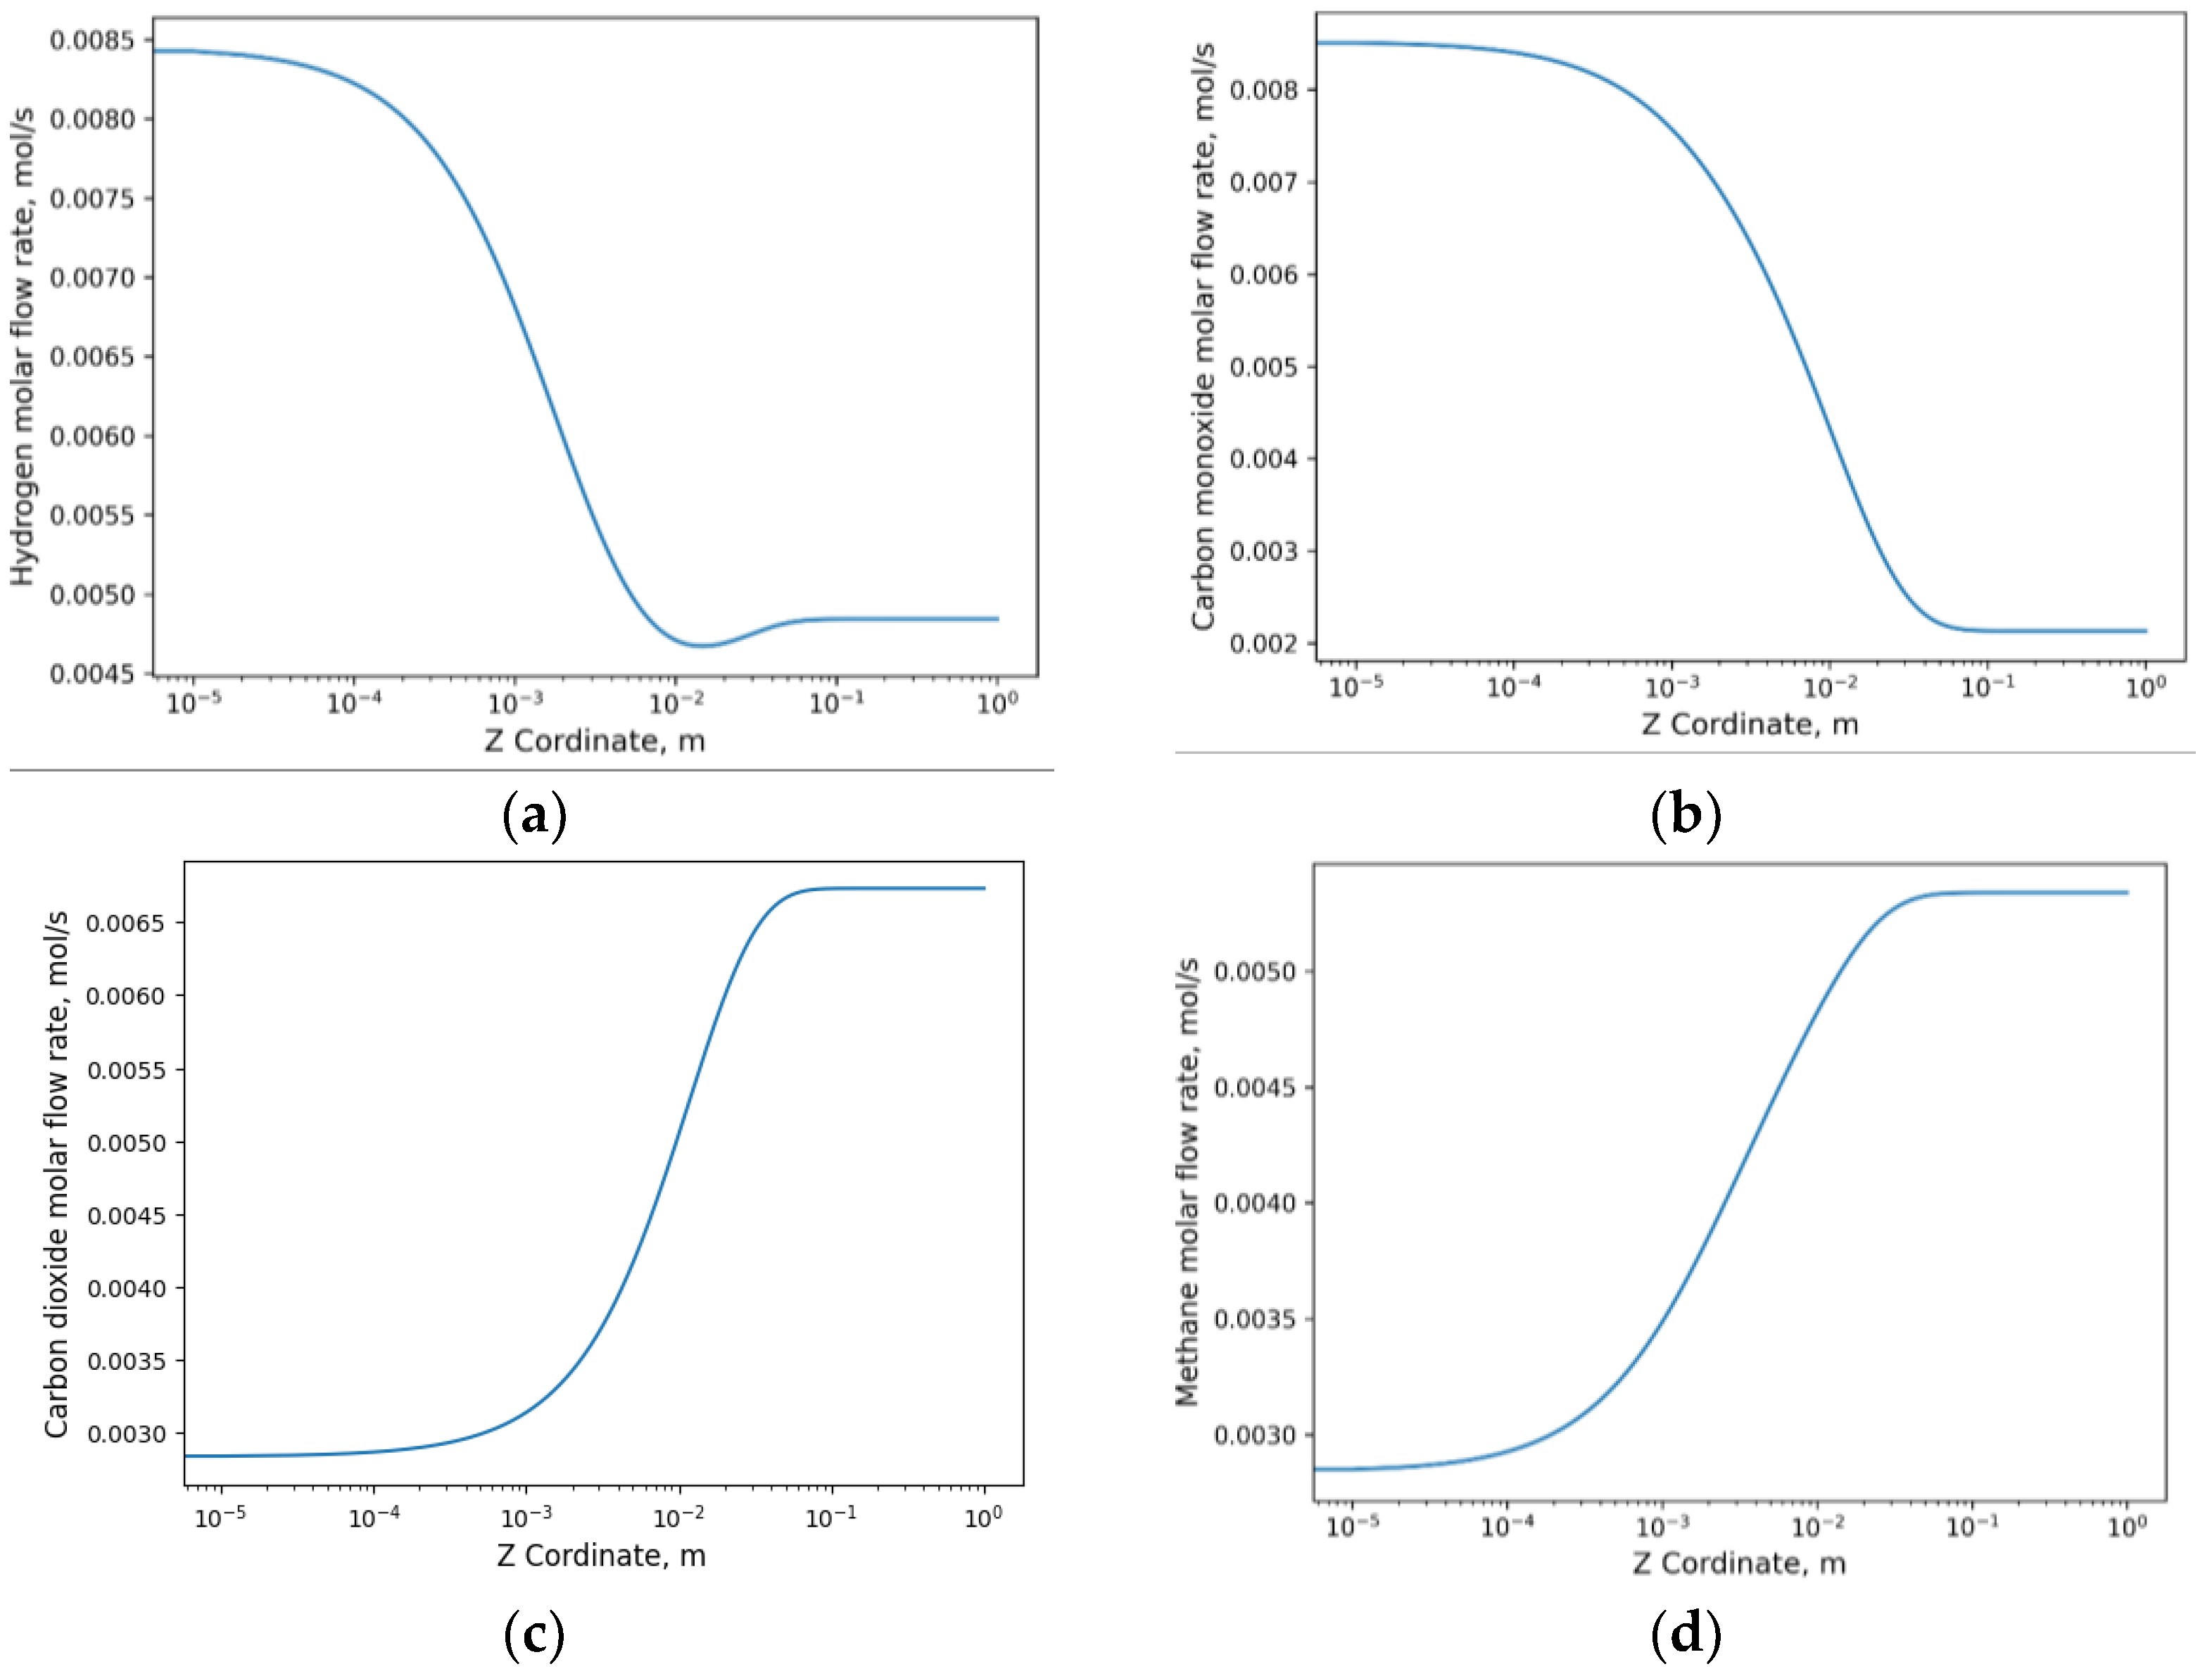
2.3.2. Evolution of the Number of Moles with Respect to the Longitudinal Axis

In this case study, the pressure was increased to 2 bar; however, there were no significant changes observed in the production of synthesis gas products compared to the analysis with respect to time. Figure 7a illustrates the decrease in hydrogen generation as it is consumed in the RDRM reaction, and this trend is also observed in Figure 7b where the decline occurs due to consumption in the WGS reaction. In the case of carbon dioxide, an increase was observed, as it is solely generated in the WGS reaction, which is the predominant reaction. On the other hand, dry reforming of methane results in the formation of methane alongside carbon dioxide.
Ultimately, the same H2:CO ratio was obtained, consistent with the results observed in the time-dependent study as shown in the Figure 8.

3. Materials and Methods

The integrated model comprises the use of two models: the first in Ansys and the second in Python. Initially, Ansys (Steady-State Thermal) was employed to simulate the heat distribution within the external system, which includes the oven and reactor walls. The results obtained from this simulation are then integrated into the new model as initial operating conditions. Subsequently, a Python code was developed to simulate the conversion of glucose into synthesis gas and other derivatives over time and along the longitudinal axis. This involves one model in a dynamic state and another in a steady state, respectively.

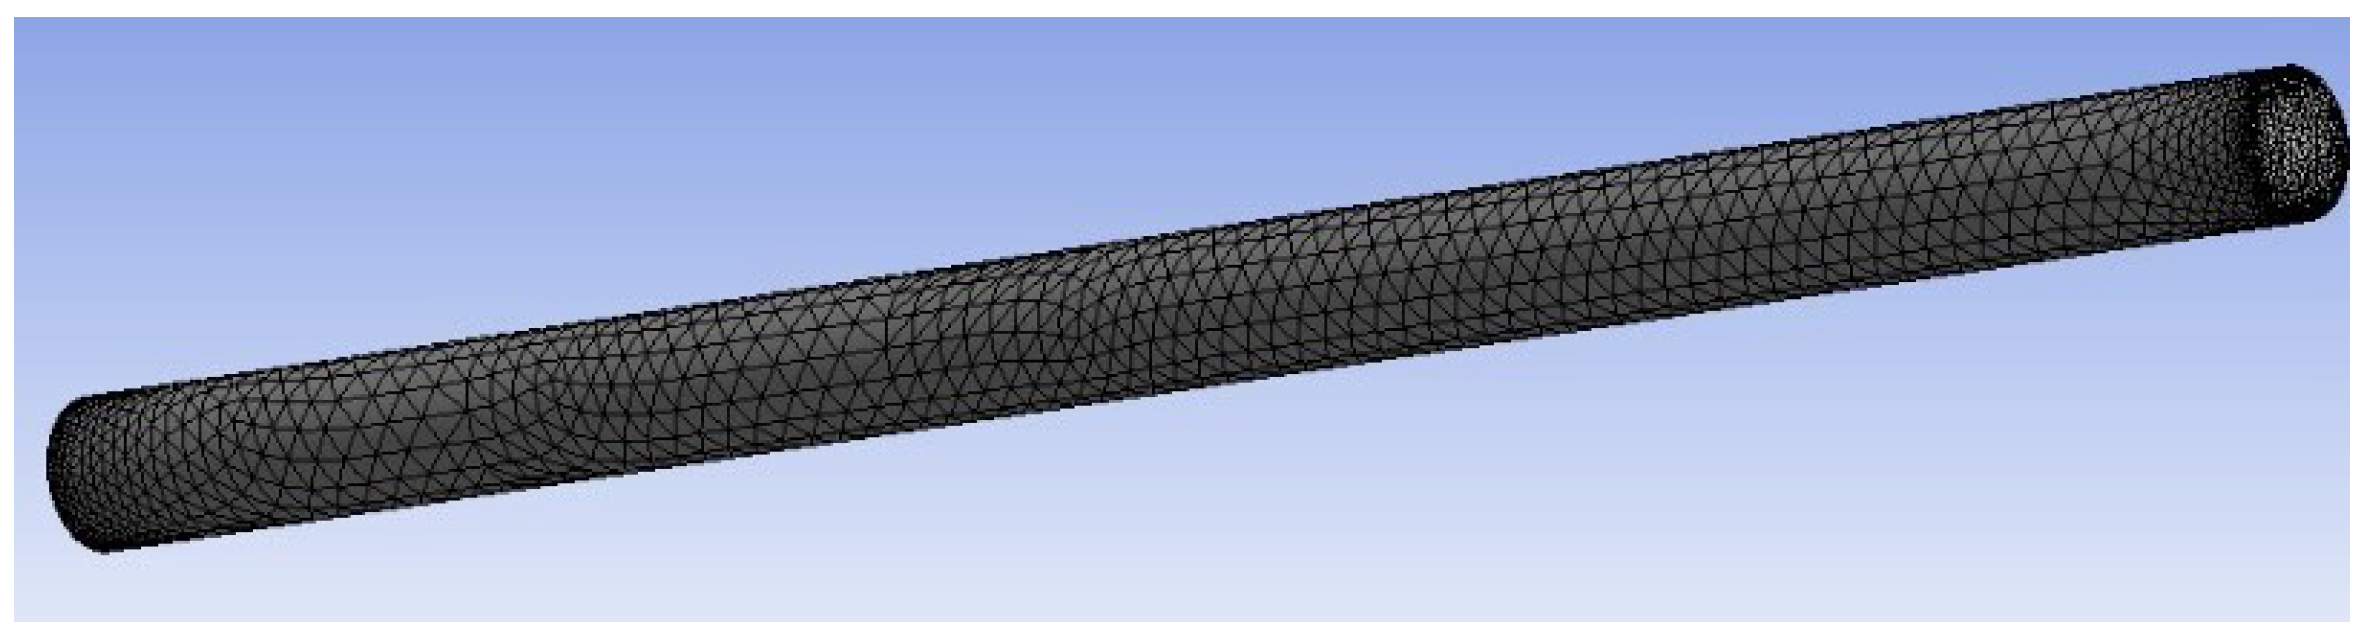
3.1. Geometry and Discretization

The geometry of the two systems is depicted in Figure 9. Part (a) corresponds to the geometric model of the oven, where the oven temperature was maintained at 640 °C. The heat transfer mechanism is achieved through convection, with a convection heat transfer coefficient of 5 W/m2 °C, and the ambient temperature set at 22 °C. The oven was constructed using 304 schedule 40 steel and featured a 1 cm thick glass wool insulator.
The catalyst-biomass composition is represented by a porous solid consisting of Ni/Al2O3, which was synthesized through the coprecipitation of Ni(NO3)2.6H2O and Al(NO3)3.9H2O. It has a porosity (ε) of 0.46, and its measurements are as follows: internal diameter of 3 cm, height of 6.6 cm, and fluid inlet and outlet through pipes with a diameter of 9.25 mm, corresponding to ¼ inch stainless steel pipes integrated into the reactor system.
The porosity of the catalytic bed was determined by designing the bed using 1 mm spheres packed within a 3 cm diameter and a height of 10 mm. In both cases, the discretization was generated in ICEM CFD. To achieve a more compact and higher-quality mesh, the tetrahedron method was employed as the default setting in this module.
The simulation operates with manually inputted boundary conditions. The internal temperature of the furnace, which reaches a stable operating state, is 639.41 °C, while the gasifying agent (water vapor), corresponding to Figure 10, reaches 226.85 °C.

3.2. Kinetic Model

The mathematical model of the reaction was developed using reaction kinetics based on the Langmuir–Hinshelwood mechanism. This mechanism encompasses reactant adsorption, catalytic surface reactions, and product desorption. It includes the water–gas shift (WGS) reaction, the reverse reaction of dry methane reforming (RDRM), and the steam reforming reactions of methane (SMR).
The Langmuir–Hinshelwood mechanism is employed as a model to describe chemical reactions that take place on the surface of a solid catalyst, where reactant molecules adsorb onto the catalyst’s surface, followed by surface reaction to generate products, which ultimately desorb into the gas phase [42]. This mechanism can be described by the following overall reaction:
A g + B g A a d s + B a d s p r o d u c t s g
Equation (1) can be elaborated for a catalytic reaction in the following steps:
  • Adsorption of gaseous reactants on the catalyst surface, i.e., the adsorption of molecules of reactants A and B at the active site of the catalyst:
    A g + C a t s A * s
    B g + C a t s B * s
  • Surface reaction at the catalyst’s active site: the species adsorbed in the previous stage react with each other on the catalyst’s surface, undergoing a rearrangement to form a complex AB*, which then further reacts to generate the corresponding products C and D:
    A * s + B * s A B * s
    A B * s C S + D S
  • Desorption of products from the catalyst’s surface to the gas phase:
    C S C g
    D S D g

3.2.1. Reactions Scheme

During the gasification process, the biomass macromolecule is converted into a series of products, including the main ones such as hydrogen H 2 , carbon monoxide, carbon C O , carbon dioxide C O 2 , methane C H 4 , water H 2 O , and in smaller quantities, coke and tars. To represent the gasification process, the following overall reaction is employed [24]:
C x H y O z + n H 2 O Δ a 1 H 2 + a 2 C O + a 3 C O 2 + a 4 H 2 O + a 5 C H 4 + a 6 C + t a r s
Biomass gasification entails a sequence of chemical reactions involving drying, particle decomposition, oxidation, and reduction (WGS, RDRM, and SRM). In Equation (8), the quantities of each product are contingent upon the operating conditions during the reaction, the type of biomass, and the activity and selectivity of the catalyst. Alumina catalysts are distinguished by their high surface area, thermal stability, and adsorption capacity, making this stage critical for reaction kinetics [38].
Based on the general equation for biomass, we prepared a solution containing 1.5 mL of glucose at a concentration of 15%, following the methodology outlined in the study conducted by [20] and using the specific equation below:
C 6 H 12 O 6 + H 2 O + C H 4 + 3 H 2 + C O 2 + 2 H 2 O + C
Equation (9) depicts the process of converting glucose into synthesis gas and other components. This equation enables the determination of the number of moles. Subsequently, after obtaining the number of moles and the mass of each product, the molar flux was calculated, assuming a reaction time of 25 s.
Given that suitable assumptions and approximations have been established, the following assumptions proposed by [21] are adopted for the kinetic model:
I.
Biomass undergoes conversion to produce C O , C O 2 , H 2 , and C H 4 , along with traces of coke and tar.
II.
C O , C O 2 , H 2 , C H 4 , and H 2 O , are adsorbed on the catalyst surface, where they undergo reactions until desorption occurs, contributing to the formation of the final product.
III.
The predominant reactions in the process include the water–gas shift (WGS), dry reforming of methane (DRM), and steam reforming of methane (SRM) reactions.
To uphold assumption (I) throughout the reaction, it is essential to maintain a reactor pressure below 57 psi, with the primary products generated being C O , C O 2 , H 2 , and C H 4 .
The case of assumption (III), the activation energies for the Bourdouard reaction and methanation should exceed those of SRM, WGS, and the reverse dry reforming of methane (RDRM).
With these considerations in mind, the following equations are presented.
Main reactions of the gasification process:
  • The water–gas shift (WGS)
C O + H 2 O H 2 + C O 2
2.
Steam Methane reforming (SMR)
C H 4 + H 2 O C O + 3 H 2
3.
Reverse dry methane reforming (RDRM)
2 C O + 2 H 2 C H 4 + C O 2

3.2.2. Steam Reforming of Methane (SRM)

The general reaction is given by
C H 4 + H 2 O C O + 3 H 2   S
  • Methane adsorption on the active site of the catalyst:
C H 4 + S   k 1 k 2   C H 4 S
2.
Vapor adsorption on the active site of the catalyst:
H 2 O + S   k 3 k 4   H 2 O S
3.
Surface reaction at the active site of the catalyst:
C H 4 S + H 2 O S + 2 S     k 5 k 6     C O S + 3 H 2 S
4.
C O desorption on the catalyst surface:
C O S + 2 S     k 7 k 8   C O + S
5.
Desorption of H 2 from the catalyst surface:
H 2 S     k 9 k 10   H 2 + S
Considering a pseudo-steady state, the following equation is used to describe the adsorption mechanism [24]
r S R M = k S R M P C H 4 P H 2 O ( 1 + K H 2 P H 2 + K H 2 O P H 2 O + K C O P C O + K C O 2 P C O 2 + K C H 4 P C H 4 ) 4 × 1 P C O P H 2 3 K S R M P C H 4 P H 2 O
where the value of K S R M is the equilibrium rate constant of the SRM, k S R M is the concentrated reaction rate constant for SRM, K H 2 is the adsorption rate constant of H 2 , K H 2 O is the adsorption rate constant of H 2 O , K   C O is the adsorption rate constant of C O , K C O 2 is the adsorption rate constant of C O 2 , and K C H 4 is the adsorption rate constant of C H 4 . P H 2 is the pressure of H 2 ,   P H 2 O   is   the   pressure   of   H 2 O , P C O   is   the   pressure   of   C O , P C O 2   is   the   pressure   of   C O 2 , and P C H 4 is the pressure of C H 4 .
The equilibrium rate constant is:
K S R M = k 6 K C O K H 2 3 k 5 K C H 4 K H 2 O

The Water–Gas Shift

The general reaction is given by
C O + H 2 O H 2 + C O 2
  • Carbone Monoxide adsorption on the active site of the catalyst:
C O + S   k 1 k 2   C O S
2.
Vapor adsorption on the active site of the catalyst:
H 2 O + S   k 3 k 4   H 2 O S
3.
Surface reaction at the active site of the catalyst:
C O S + H 2 O S + 2 S     k 5 k 6     C O 2 S + H 2 S
4.
C O 2 desorption on the catalyst surface:
C O 2 S     k 7 k 8   C O 2 + S
5.
Desorption of H 2 from the catalyst surface:
H 2 S     k 9 k 10   H 2 + S
Considering a pseudo-steady state, the following equation is used to describe the adsorption mechanism [24].
r W G S = k W G S P C O P H 2 O ( 1 + K H 2 P H 2 + K H 2 O P H 2 O + K C O P C O + K C O 2 P C O 2 + K C H 4 P C H 4 ) 2 × 1 P C O 2 P H 2 K W G S P C O P H 2 O
where the value of K W G S is the equilibrium rate constant of the WGS reaction, k W G S is the concentrated reaction rate constant for WGS, K H 2 is the adsorption rate constant of H 2 , K H 2 O is the adsorption rate constant of H 2 O , K   C O is the adsorption rate constant of C O , K C O 2 is the adsorption rate constant of C O 2 , and K C H 4 is the adsorption rate constant of C H 4 . P H 2 is the pressure of H 2 ,   P H 2 O   is   the   pressure   of   H 2 O , P C O   is   the   pressure   of   C O ,   P C O 2   is   the   pressure   of   C O 2 , and P C H 4 is the pressure of C H 4 .
The equilibrium rate constant is:
K W G S = k 6 K C O 2 K H 2 k 5 K C O K H 2 O

Reverse Dry Methane Reforming Reaction

The general reaction is given by
2 C O + 2 H 2 C H 4 + C O 2
1.
Carbone Monoxide adsorption on the active site of the catalyst:
C O + S   k 1 k 2   C O S
2.
Vapor adsorption on the active site of the catalyst:
H 2 + S   k 3 k 4   H 2 S
3.
Surface reaction at the active site of the catalyst:
2 C O S + 2 H 2 S     k 5 k 6     C O 2 S + C H 4 S + 2 S
4.
C O 2 desorption on the catalyst surface:
C O 2 S     k 7 k 8   C O 2 + S
5.
Desorption of C H 4 from the catalyst surface:
C H 4 S     k 9 k 10   C H 4 + S
Considering a pseudo-steady state, the following equation is used to describe the adsorption mechanism [24].
r R D R M = k R D R M P C O 2 P H 2 2 ( 1 + K H 2 P H 2 + K H 2 O P H 2 O + K C O P C O + K C O 2 P C O 2 + K C H 4 P C H 4 ) 4 × 1 P C O 2 P C H 4 K R D R M P C O 2 P H 2 2
where the value of K R D R M is the equilibrium rate constant for the RDRM reaction, k K D R M is the concentrated reaction rate constant for RDRM, K H 2 is the adsorption rate constant of H 2 , K H 2 O is the adsorption rate constant of H 2 O , K   C O is the adsorption rate constant of C O , K C O 2 is the adsorption rate constant of C O 2 and K C H 4 is the adsorption rate constant of C H 4 , P H 2 is the pressure of H 2 ,   P H 2 O   is   the   pressure   of   H 2 O , P C O   is   the   pressure   of   C O ,   P C O 2   is   the   pressure   of   C O 2 , and P C H 4 is the pressure of C H 4 .
The equilibrium rate constant is:
K R D M R = k 5 K C O 2 K H 2 2 k 6 K C O 2 K C H 4

3.2.3. Reaction Rate Constants and Adsorption Rate Constant

The reaction rate constants can be obtained by means of the Arrhenius equation [24].
k j = k i 0 exp E a R T 1 T 1 T 0
And for the adsorption rate constant:
K i = K i 0 exp Δ H i a d s R T 1 T 1 T 0
where k i corresponds to the adsorption rate constant of component I, k i 0 corresponds to the pre-exponential factor for component I, Δ H i a d s is the heat of adsorption for component i-th species, T is the reaction temperature and T 0 is the standard temperature and R is the ideal gas constant.

3.2.4. Dynamic and Steady-State Material Balance

The additive rate equation was used for component species of the reactions SRM, WGS and RDRM with respect to time [24].
R c = j = 1 N r v i , j r j
where v i , j is the stoichiometric coefficient of the t i-th species present in the j-th reaction, for j = 1 to Nr (the number of reactions). Accordingly, the material balance for the dynamic model is as follows:
R T d P H 2 d t = d n H 2 d t = R H 2 = r W G S + 3 r S R M 2 r R D R M   m c a t
R T d P C O d t = d n C O d t = R C O = r W G S + r S R M 2 r R D R M   m c a t
R T d P C O 2 d t = d n C O 2 d t = R C O 2 = r W G S + r R D R M   m c a t
R T d P C H 4 d t = d n C H 4 d t = R C H 4 = r S R M + r R D R M   m c a t
  R T d P H 2 O d t = d n H 2 O d t = R H 2 O = r W G S r R D R M m c a t
The steady-state material balance is as follows:
d n ˙ H 2 d = R H 2 = r W G S + 3 r S R M 2 r R D R M
d n ˙ C O d = R C O = r W G S + r S R M 2 r R D R M
d n ˙ C O 2 d = R C O 2 = r W G S + r R D R M
d n ˙ C H 4 d = R C H 4 = r S R M + r R D R M
d n ˙ H 2 O d = R H 2 O = r W G S r R D R M
The equations defined for the kinetic models of the primary products in the gasification reaction concerning time and the longitudinal axis, as previously derived, were solved using Python. The parameters specified in [21], which provides the kinetic parameters employed in these equations, were utilized. Furthermore, a catalytic mass of 3.92 g and a reactor diameter of 0.03 m were taken into account.

4. Conclusions

The glucose gasification process was simulated as a biomass model compound, which made it possible to study the behavior of the resulting gases through an integrated model that included in a first stage a thermal model with which it was possible to determine the real working temperature, and a second stage that, using these results as initial conditions, was built under the principles of the Langmuir–Hinshelwood adsorption mechanism to study the kinetics of glucose gasification. Molar fluxes were obtained for H 2 ,   C O ,   C O 2 ,   C H 4 , and H 2 O , presented in behavioral curves for two study cases: the dynamic model and the static model. It was observed that the results did not exhibit significant variations between the static and dynamic models. The choice of glucose as a model instead of biomass directly is based on the compound’s simplicity, availability, detailed knowledge, and ease of reproducibility, which facilitates the investigation and understanding of biomass conversion processes in the initial stages of the study.
The determining factor, the ratio between hydrogen and carbon monoxide H 2 : C O , showed a value of 2.2. A value of 2.2 in the H 2 : C O ratio may be adequate in many applications, but the “goodness” of this value will depend on the specific objectives of the reaction and the process conditions, with ammonium synthesis being the most common process of gaseous hydrogen utilization. The value obtained is highly acceptable.
The model that was presented showed that at an oven temperature of 639.4 °C, a reaction temperature inside the reactor of 604.7 °C, and a maximum pressure of 2 bar, results could be obtained that were consistent with the theory presented by several authors and that they consider acceptable for the mass ammonia production process. The simulation of glucose gasification allows the process to be studied without the need to invest economic and logistical resources such as a physical implementation. In addition, this work laid the foundation for subsequent studies that will be adapted or improved according to each specific case study.

Author Contributions

Writing—original draft preparation, J.G.-C. and K.N.-D.; writing—review and editing, L.J.-C., P.Á.-L., W.M.-G. and B.B.-P. All authors have read and agreed to the published version of the manuscript.

Funding

This research was funded by VIUC—Universidad de Cuenca.

Data Availability Statement

All data generated or analyzed during this study are included in this published article.

Conflicts of Interest

The authors declare no conflict of interest.

References

  1. Olabi, A.G.; Abdelkareem, M.A. Renewable energy and climate change. Renew. Sustain. Energy Rev. 2022, 158, 112111. [Google Scholar] [CrossRef]
  2. Feng, C.-Y.; Yang, X.; Afshan, S.; Irfan, M. Can renewable energy technology innovation promote mineral resources’ green utilization efficiency? Novel insights from regional development inequality. Resour. Policy 2023, 82, 103449. [Google Scholar] [CrossRef]
  3. Solaymani, S.; Zada, E.R.; Gatto, A. A Review on Energy and Renewable Energy Policies in Iran. Sustainability 2021, 13, 7328. [Google Scholar] [CrossRef]
  4. Djellouli, N.; Abdelli, L.; Elheddad, M.; Ahmed, R.; Mahmood, H. The effects of non-renewable energy, renewable energy, economic growth, and foreign direct investment on the sustainability of African countries. Renew. Energy 2022, 183, 676–686. [Google Scholar] [CrossRef]
  5. Elavarasan, R.M.; Shafiullah, G.M.; Padmanaban, S.; Kumar, N.M.; Annam, A.; Vetrichelvan, A.M.; Mihet-Popa, L.; Holm-Nielsen, J.B. A Comprehensive Review on Renewable Energy Development, Challenges, and Policies of Leading Indian States with an International Perspective. IEEE Access 2020, 8, 74432–74457. [Google Scholar] [CrossRef]
  6. Saleem, M. Possibility of utilizing agriculture biomass as a renewable and sustainable future energy source. Heliyon 2022, 8, e08905. [Google Scholar] [CrossRef] [PubMed]
  7. Ahmed, A.; Ge, T.; Peng, J.; Yan, W.C.; Tee, B.T.; You, S. Assessment of the renewable energy generation towards net-zero energy buildings: A review. Energy Build. 2022, 256, 111755. [Google Scholar] [CrossRef]
  8. Amjith, L.R.; Bavanish, B. A review on biomass and wind as renewable energy for sustainable environment. Chemosphere 2022, 293, 133579. [Google Scholar] [CrossRef]
  9. Rahman, A.; Farrok, O.; Haque, M.M. Environmental impact of renewable energy source based electrical power plants: Solar, wind, hydroelectric, biomass, geothermal, tidal, ocean, and osmotic. Renew. Sustain. Energy Rev. 2022, 161, 112279. [Google Scholar] [CrossRef]
  10. Yana, S.; Nizar, M.; Irhamni; Mulyati, D. Biomass waste as a renewable energy in developing bio-based economies in Indonesia: A review. Renew. Sustain. Energy Rev. 2022, 160, 112268. [Google Scholar] [CrossRef]
  11. Tezer, Ö.; Karabağ, N.; Öngen, A.; Çolpan, C.Ö.; Ayol, A. Biomass gasification for sustainable energy production: A review. Int. J. Hydrog. Energy 2022, 47, 15419–15433. [Google Scholar] [CrossRef]
  12. Fiallos-Cárdenas, M.; Pérez-Martínez, S.; Ramirez, A.D. Prospectives for the development of a circular bioeconomy around the banana value chain. Sustain. Prod. Consum. 2022, 30, 541–555. [Google Scholar] [CrossRef]
  13. Verma, M.; Mishra, V. Bioelectricity generation by microbial degradation of banana peel waste biomass in a dual-chamber S. cerevisiae-based microbial fuel cell. Biomass Bioenergy 2023, 168, 106677. [Google Scholar] [CrossRef]
  14. Singh, R.K.; Patil, T.; Pandey, D.; Tekade, S.P.; Sawarkar, A.N. Co-pyrolysis of petroleum coke and banana leaves biomass: Kinetics, reaction mechanism, and thermodynamic analysis. J. Environ. Manag. 2022, 301, 113854. [Google Scholar] [CrossRef] [PubMed]
  15. Dayton, D.C.; Foust, T.D. Analytical Methods for Biomass Characterization and Conversion; Elsevier: Amsterdam, The Netherlands, 2020; pp. 1–260. [Google Scholar] [CrossRef]
  16. Wang, X.; Yang, S.; Shen, B.; Yang, J.; Xu, L. Pyrolysis of Biomass Pineapple Residue and Banana Pseudo-Stem: Kinetics, Mechanism and Valorization of Bio-Char. Catalysts 2022, 12, 840. [Google Scholar] [CrossRef]
  17. Subramanian, P.; Sriramajayam, S.; Vijayakumary, P.; Raja, K.; Reddy, M.; Research, P.G. Extraction of cellulose from banana sheath and its characterization. Pharma Innov. J. 2022, 11, 1861–1867. [Google Scholar]
  18. Gallardo, G.; Alberto, M. Producción de Hidrógeno a Través de la Gasificación de Glucosa Usando Catalizadores de 5%Ni con 2% de La, Ce y Mg y Deducción de una Ecuación de Velocidad de Reacción Intrínseca; Universidad Autónoma de Zacatecas: Zacatecas, Mexico, 2019; Available online: http://ricaxcan.uaz.edu.mx/jspui/handle/20.500.11845/2306 (accessed on 4 April 2023).
  19. Jara-Cobos, L.; Abril-González, M.; Pinos-Vélez, V. Production of Hydrogen from Lignocellulosic Biomass: A Review of Technologies. Catalysts 2023, 13, 766. [Google Scholar] [CrossRef]
  20. Tacuri, D.; Andrade, C.; Álvarez, P.; Abril-González, M.; Zalamea, S.; Pinos-Vélez, V.; Montero-Izquierdo, A. Design and Development of a Catalytic Fixed-Bed Reactor for Gasification of Banana Biomass in Hydrogen Production. Catalysts 2022, 12, 395. [Google Scholar] [CrossRef]
  21. Bharadwaj, A.S.; Dev, S.; Zhuang, J.; Wang, Y.; Yoo, C.G.; Jeon, B.H.; Aggarwal, S.; Park, S.H.; Kim, T.H. Review of chemical pretreatment of lignocellulosic biomass using low-liquid and low-chemical catalysts for effective bioconversion. Bioresour. Technol. 2023, 368, 128339. [Google Scholar] [CrossRef]
  22. Pipitone, G.; Zoppi, G.; Frattini, A.; Bocchini, S.; Pirone, R.; Bensaid, S. Aqueous phase reforming of sugar-based biorefinery streams: From the simplicity of model compounds to the complexity of real feeds. Catal. Today 2020, 345, 267–279. [Google Scholar] [CrossRef]
  23. Yu, J.; Guo, Q.; Gong, Y.; Ding, L.; Wang, J.; Yu, G. A review of the effects of alkali and alkaline earth metal species on biomass gasification. Fuel Process. Technol. 2021, 214, 106723. [Google Scholar] [CrossRef]
  24. Adamu, S.; Hossain, M.M. Kinetics of Steam Gasification of Glucose as a Biomass Surrogate over Ni/Ce-Mesoporous Al2O3 in a Fluidized Bed Reactor. Ind. Eng. Chem. Res. 2018, 57, 3128–3137. [Google Scholar] [CrossRef]
  25. Bhushan, S.; Rana, M.S.; Mamta; Nandan, N.; Prajapati, S.K. Energy harnessing from banana plant wastes: A review. Bioresour. Technol. Rep. 2019, 7, 100212. [Google Scholar] [CrossRef]
  26. Zhang, Y.; Li, L.; Xu, P.; Liu, B.; Shuai, Y.; Li, B. Hydrogen production through biomass gasification in supercritical water: A review from exergy aspect. Int. J. Hydrog. Energy 2019, 44, 15727–15736. [Google Scholar] [CrossRef]
  27. García-Jarana, M.B.; Portela, J.R.; Sánchez-Oneto, J.; de la Ossa, E.J.M.; Al-Duri, B. Analysis of the supercritical water gasification of cellulose in a continuous system using short residence times. Appl. Sci. 2020, 10, 5185. [Google Scholar] [CrossRef]
  28. Flores, G. Determinación de la Capacidad Calorífica de Biomasas Residuales de la Producción Agrícola del Ecuador. Ph.D. Dissertation, Universidad Central de Ecuador, Faculta de Ciencias Químicas, Quito, Ecuador, 2022. [Google Scholar]
  29. Situmorang, Y.A.; Zhao, Z.; Yoshida, A.; Abudula, A.; Guan, G. Small-scale biomass gasification systems for power generation (<200 kW class): A review. Renew. Sustain. Energy Rev. 2020, 117, 109486. [Google Scholar] [CrossRef]
  30. Zalamea, S.; William, M.; Serrano, J. Kinetic and mathematical modeling of the catalytic supercritical water gasification of the glucose for the hydrogen production. Rev. Fac. Cienc. Químicas 2016, 14, 11. [Google Scholar]
  31. Espinilla Peña, F.J. Elaboración de un Modelo 3D de Una Turbina de Vapor. 2019. Available online: https://riull.ull.es/xmlui/handle/915/13373 (accessed on 6 April 2023).
  32. Escobar, J.O.C.; Jurado, F.; Vera, D. Simulation of an active indirect hybrid dehydrator using ANSYS software. Enfoque UTE Sci. Eng. J. 2021, 12, 29–44. [Google Scholar] [CrossRef]
  33. Benedicto Parrilla, A.; Brufau García, M.P. Simulación 2D de la Rotura de Presa de Malpasset con los Modelos Iber y RiverFlow2D. Masters Thesis, Universidad de Zaragoza, Zaragoza, Spain, 2019. [Google Scholar]
  34. Carlos, J.; Bedolla, J. Métodos Numéricos Usando Python con Aplicaciones a la Ingeniería Química; Universidad Nacional Autónoma de México: Mexico City, Mexico, 2022. [Google Scholar]
  35. Lemus-Contreras, S.A.; Pavón-Silva, T.B.; Alva, M.L.H.; Zarazúa-Aguilar, Y. Desarrollo de un programa con Python para la determinación de datos cinéticos en reacciones irreversibles de un solo componente en reactores intermitentes. J. Basic Sci. 2022, 8, 11–34. [Google Scholar]
  36. Ruya, P.M.; Lim, S.S.; Purwadi, R.; Zunita, M. Sustainable hydrogen production from oil palm derived wastes through autothermal operation of supercritical water gasification system. Energy 2020, 208, 118280. [Google Scholar] [CrossRef]
  37. Cruz, I. Producción de Hidrógeno a Través de la Gasificación de Glucosa Usando Catalizadores de γ-Al2O3 con Ni, Ce y La e Interpretación de Resultados Usando un Modelo No-Estequiométrico. 2018. Available online: https://1library.co/document/y4jjvj9y-produccion-hidrogeno-traves-gasificacion-catalizadores-interpretacion-resultados-estequiometrico.html (accessed on 17 September 2022).
  38. Li, A.; Han, H.; Hu, S.; Zhu, M.; Ren, Q.; Wang, Y.; Xu, J.; Jiang, L.; Su, S.; Xiang, J. A novel sludge pyrolysis and biomass gasification integrated method to enhance hydrogen-rich gas generation. Energy Convers. Manag. 2022, 254, 115205. [Google Scholar] [CrossRef]
  39. Song, X.; Guo, Z. Technologies for direct production of flexible H2/CO synthesis gas. Energy Convers. Manag. 2006, 47, 560–569. [Google Scholar] [CrossRef]
  40. Silva, R. Simulation of a Combined Coal/Biomass Gasification System for the Syngas Production. Porto, July. 2022. Available online: https://repositorio-aberto.up.pt/bitstream/10216/143750/2/575984.pdf (accessed on 14 September 2023).
  41. Usman, H.; Awais, M. Sensitivity Analysis of Coal and Bagasse Co-Firing in an Integrated Gasification Combined Cycle Power Plant. J. Chem. Chem. Eng. Res. 2022, 41, 1–13. [Google Scholar] [CrossRef]
  42. Razdan, N.K.; Bhan, A. Catalytic site ensembles: A context to reexamine the Langmuir-Hinshelwood kinetic description. J. Catal. 2021, 404, 726–744. [Google Scholar] [CrossRef]
Figure 1. Results of the simulation of heat transfer through the air inside the oven and its walls. The red zone represents a hotter zone.
Catalysts 13 01323 g001
Figure 2. (a) Behavior of the fluid velocity; (b) fluid velocity through the Z−chord.
Catalysts 13 01323 g002
Figure 3. (a) Fluid temperature distribution; (b) temperature variation with respect to z-axis.
Catalysts 13 01323 g003
Figure 4. (a) Pressure variation across the reactor; (b) pressure drop with respect to z-axis.
Catalysts 13 01323 g004aCatalysts 13 01323 g004b
Figure 5. Evolution of the behavior of molar fluxes resulting from the glucose gasification reaction over time: (a) hydrogen flux; (b) carbon monoxide flux; (c) carbon dioxide flux; (d) methane flux.
Catalysts 13 01323 g005
Figure 6. (a) Evolution of water flux obtained in the simulation; (b) hydrogen/carbon monoxide ratio with respect to time.
Catalysts 13 01323 g006
Figure 7. Evolution of flow behavior along the axial z-axis: (a) hydrogen flow; (b) carbon monoxide flow; (c) carbon dioxide flow; (d) methane flow.
Catalysts 13 01323 g007
Figure 8. (a) Evolution of water flux obtained in the simulation; (b) hydrogen/carbon monoxide ratio with respect to z-axis.
Catalysts 13 01323 g008
Figure 9. System geometry with its respective meshing; the two geometries have the default meshing that is generated automatically: (a) geometric representation of the oven; (b) geometry of the catalyzed-biomass mode.
Catalysts 13 01323 g009
Figure 10. Gassing agent: the geometry and discretization of the fluid domain (gasifying agent); it is 17 cm long and 9.25 mm in diameter.
Catalysts 13 01323 g010
Table 1. Biomass decomposition in terms of lignocellulosic matter.
ZoneTemperature RangeType of Material
I<373 KMoisture evolution.
II373–523 KOccurs at the outset of hemicellulose decomposition.
III523–633 KCellulose decomposition.
IV633–733 KLignin decomposition.
V>733 KFixed carbon oxidation.
Disclaimer/Publisher’s Note: The statements, opinions and data contained in all publications are solely those of the individual author(s) and contributor(s) and not of MDPI and/or the editor(s). MDPI and/or the editor(s) disclaim responsibility for any injury to people or property resulting from any ideas, methods, instructions or products referred to in the content.

