Abstract
Metal nanoparticles are widely used in catalysis by virtue of their excellent physicochemical properties, which are closely related to their morphology. In this work, we predict the reshaping of Ag, Ni, and Ir metal nanoparticles under a CO atmosphere using the recently proposed multiscale structure reconstruction model. In the low-pressure environment, temperature has little effect on the structures of Ag nanoparticles. However, the structures of Ag nanoparticles will change significantly in high- and low-temperature environments. Ni and Ir nanoparticles are greatly affected by the environment due to their stronger interactions with CO. This study demonstrates the structural changes of Ag, Ni, and Ir nanoparticles under different pressures and temperatures, providing theoretical guidance for in situ experiments and the rational design of nanocatalysts.
1. Introduction
Metal nanoparticles (NPs) have gained widespread attention for their ability to improve chemical catalytic performance [1,2,3,4]. The size and morphology of NPs have a great influence on their catalytic efficiencies, so there is great interest in whether and how metal NPs undergo structural changes in the reactive environment [5,6,7,8,9,10,11,12,13,14,15]. For example, Hansen et al. found the reversible remodeling of Cu NPs under water vapor and CO gas by in situ transmission electron microscopy [14]. Tao et al. observed the dynamic changes in the surface of Rh-Pt alloy NPs under atmospheric conditions of NO and CO by X-ray photoelectron spectroscopy [10]. Tao et al. brought to light that the stepped (557) and (332) faces of Pt crystals have clusters generated on the surface under the pressure of 1 torr, and at room temperature [11]. Recently, Frey et al. found using transmission electron microscopy that Pt NPs undergo remodeling in H2 and O2 atmospheres [5]. It can be seen that great progress has been made in in situ experiments of the structural changes of metal NPs in the reactive environment. Ideally, in situ studies are necessary for all the potential catalytic systems. However, it can hardly be done in experiments due to the large experimental costs.
A theoretical simulation is therefore highly demanded to predict structural changes of metal NPs under different reaction conditions. In the last few years, some theoretical models have been proposed to predict the structural changes of nanomaterials under various environmental conditions [16,17,18,19,20,21,22,23,24,25,26,27,28,29]. For example, using Monte Carlo simulations, Cao et al. previously predicted good stability of Mo-doped Pt-Ni alloys under oxidizing conditions [27]. Teck L. Tan et al. used a cluster expansion theory approach to investigate the controlled catalytic application of Pt-Pd alloys in hydrogen precipitation reactions [28]. Among these models, a multiscale structure reconstruction model (MSR), which was developed based on first-principles calculations, Wulff configurations, and thermodynamic adsorption isotherms, has been proven to be a very simple and efficient tool to quantitatively describe the morphological changes of metal NPs in the gaseous environment. Employing the MSR model, the structural changes of metal NPs (Cu, Au, Pt, and Pd) under a water vapor environment were successfully predicted [30]. However, the shape evolution of Pd nanoparticles would occur under the atmospheric pressure of O2 and H2 [31], which is consistent with the experiment [14]. However, more theoretical predictions of the reshaping behavior of various metal NPs are still needed for the rational design of nanocatalysts.
In this work, we used the MSR model to study the structural reconstruction of Ag, Ni, and Ir NPs under a CO atmosphere, which are common metal nanocatalysts but have not been studied in previous works. The Ag surfaces have very weak adsorption energy for CO, so the structure remains almost unchanged at low pressures. Ni and Ir have strong adsorption energies for CO, and the structure of these NPs changes at even 1 Pa pressure.
2. Results and Discussions
Table 1 shows the surface energies of the three metals and the surface area per atom of three low-index surfaces for single Ag, Ni, and Ir NPs. Table 2 presents the adsorption energy of CO for three metals on three low-index surfaces and the CO repulsion energy on metal surfaces. As shown in Table 2, the adsorption behavior of CO is different for different metals and surfaces. The adsorption energy of CO on Ag is very weak compared to that of Ni and Ir, so the repulsion energy of CO on the surface of Ag is also very weak.

Table 1.
The surface energies (eV/Å2) and the surface area per atom (Å2) of the three metals.

Table 2.
Adsorption energy (eV) of CO molecules on the three metals and the repulsion energy between the adsorbates (eV) are presented.
In order to understand the reconfiguration of Ag, Ni, and Ir NPs in a CO atmosphere, their equilibrium structures are shown in Figure 1, Figure 2 and Figure 3. Ag, Ni, and Ir are all Face-Centered Cubic (FCC) structures, and the size of their models is about 5 nm. The simulated temperatures are from 300 to 900 K, and the pressures are 1 Pa, 100 Pa, and 1 bar, respectively. Figure 4, Figure 5 and Figure 6 show the variation of CO coverage and surface energy with temperature for three low-index surfaces of the equilibrium structure of NPs, which correspond to Figure 1, Figure 2 and Figure 3, respectively.
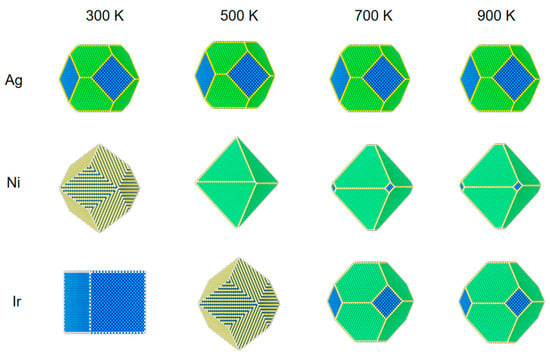
Figure 1.
The structural evolution of 5 nm metal NPs (Ag, Ni, and Ir) at different temperatures and 1 Pa of CO. Blue is 100 surfaces, yellow is 110 surfaces, and green is 111 surfaces.
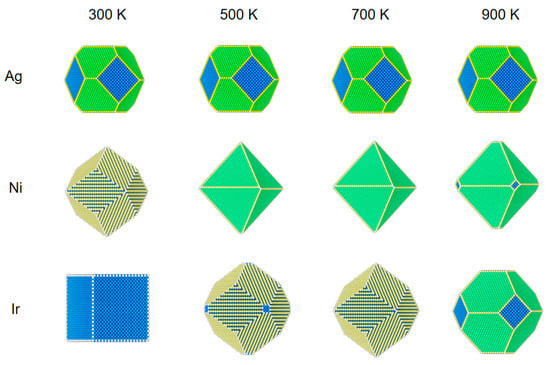
Figure 2.
The structural evolution of 5 nm metal NPs (Ag, Ni, and Ir) at different temperatures and 100 Pa of CO.
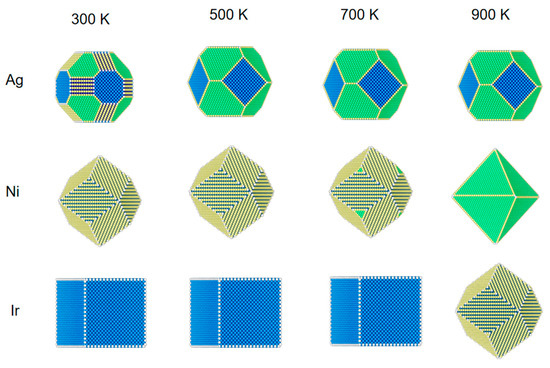
Figure 3.
The structural evolution of 5 nm metal NPs (Ag, Ni, and Ir) at different temperatures and 1 bar of CO.
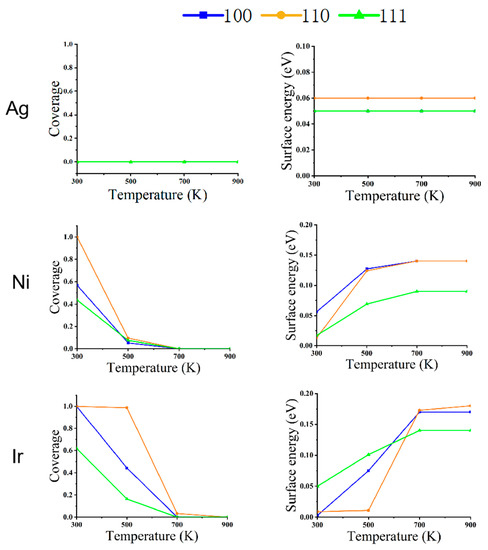
Figure 4.
The relationship between the coverage of CO (left) and surface energy (right) on the different faces of metal NPs (Ag, Ni, and Ir) at changing temperatures and a pressure of 1 Pa.
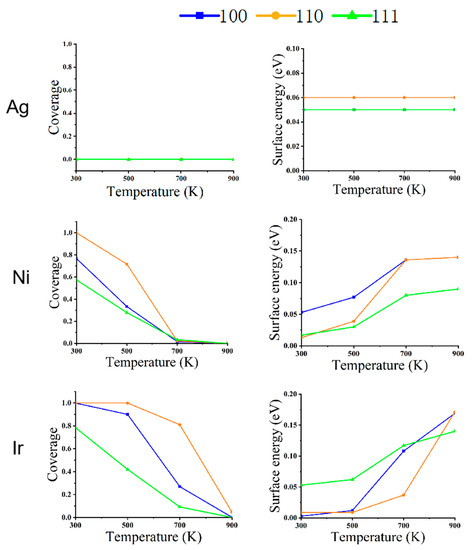
Figure 5.
The relationship between CO coverage (left) and surface energy (right) in different faces of metal NPs (Ag, Ni, and Ir) at changing temperatures and a pressure of 100 Pa.
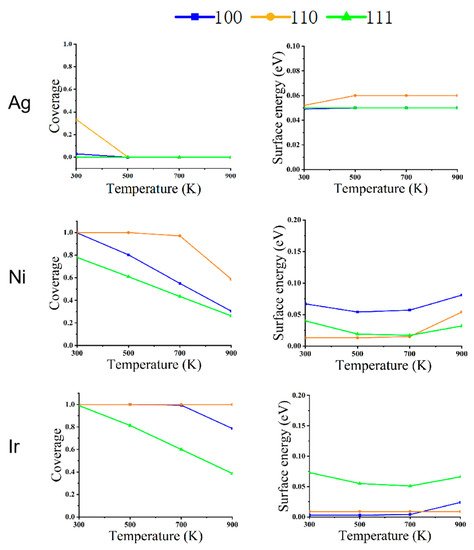
Figure 6.
The relationship between CO coverage (left) and surface energy (right) in different faces of metal NPs (Ag, Ni, and Ir) at changing temperatures and a pressure of 1 bar.
As shown in Figure 1, for Ag NPs at a pressure of 1 Pa, the equilibrium structure does not change with temperature under a CO atmosphere. As can be seen from Figure 4, there is no CO adsorption on the surface due to the weak adsorption energy of CO on Ag, and the surface energy of (100), (110), and (111) faces do not change, even at a low temperature of 300 K.
Ni NPs show significant structural changes at a pressure of 1 Pa. At 300 K, CO coverage on (110) is 100%, (100) is 57%, and on (111) is 44%. Since the repulsion energy of CO on the (110) surface is minimal compared to the other two surfaces, the equilibrium structures of Ni NPs are all rhombic dodecahedra composed of the (110) surface. When the temperature increases from 300 to 500 K, the CO adsorption on the three low-index surfaces decreases rapidly to near zero. The (111) surface has the smallest surface energy relative to the (100) and (110) surfaces, so the structure of the NPs changes from a rhombic dodecahedron to an octahedron composed entirely of the (111) surface. When the temperature rises to 700 K, there is no adsorption of CO on the three low-index surfaces, and the equilibrium structure becomes a truncated octahedron, with the truncated part being the (100) surface. When the temperature increases from 700 to 900 K, the nanoparticle structure does not change.
We can observe that the structural changes of Ir NPs are also different from Ni NPs. The coverage of CO adsorption at (100) and (110) is 100% at 300 K, but the (100) surface has a lower surface energy compared to the (110) surface. Under this condition, the Ir NPs form a cube consisting of (100) faces. When the temperature rises to 500 K, CO coverage at (100) decreases to 44% at (110) with 99% coverage; at this point, (110) has a very low surface energy with respect to (100) and (111), and a cube becomes a rhombic dodecahedron. When the temperature rises from 500 to 700 K, the CO coverage in (110) decreases to 17%, about the same as in (100) and (111). As the temperature rises from 500 to 700 K, CO coverage decreases to 3% at (110) and 0 at (100) and (111). Thus, a rhombic dodecahedron becomes a truncated octahedron. When the temperature is increased from 700 to 900 K, there is little effect on Ir NPs, so the equilibrium structure does not change. When the interaction with CO is strong, Ir NPs expose only the (100) surface. As the mutual CO interaction with the surface decreases, only the truncated octahedra consisting of (100) and (111) are exposed; this is similar to the recent report [32].
Figure 2 shows the structures of the three NPs at a pressure of 100 Pa. For Ag NPs, changing the temperature at a pressure of 100 Pa has almost no effect on its structure.
The structural reconstruction of Ni NPs at the pressure of 100 Pa is similar to those results at 1 Pa. At 700 K, all three low-index surfaces have 2% CO coverage, which is not the same as a pressure of 1 Pa, which has no CO coverage. The NPs become an octahedral equilibrium structure.
Because of the high adsorption energy and low repulsion energy of Ir NPs for CO, the equilibrium structure also changes significantly compared to the pressure of 1 Pa. When the temperature is 600 K, the coverage of (100) adsorbed CO is 90%; at this time, (100) also has a low surface energy, and the rhombic dodecahedron has a cut-off angle generated by the composition of (100). As the temperature increases from 600 to 800 K, (100) drops to 27% coverage for CO, and (110) is still at 81% coverage. The surface energy of (110) is very low relative to that of (100) and (111). The nanostructure changes from a truncated dodecahedron to a rhombic dodecahedron. When the temperature rises to 900 K, the CO coverage on all surfaces is essentially zero. The structure changes from a rhombic dodecahedron to a truncated octahedron.
As can be seen from Figure 3, Ag NPs at a pressure of 1 bar CO and a temperature of 300 K are different from when the pressure is low (1 Pa) and at 100 Pa. At 300 K, CO coverage is 33% at (110) and 3% at (100). The fraction of (110) increases more rapidly than (100) and (110). Due to the high pressure, the Ni and Ir surfaces are more strongly adsorbed to CO, so the structures until 700 K of temperature are similar to those at 300 K. In particular, Ir NPs are still 100% CO coverage at 900 K (110). The surface of Ni also has adsorption that differs from the low-pressure case.
Figure 4, Figure 5 and Figure 6 depict the variation of CO coverage and surface energy on the low-index surface of metal nanoparticles at different temperatures and pressures. With increasing pressure, the coverage of all three low-index surfaces of Ni and Ir increases significantly, up to 700 K with CO increasing from 100 pa to 1 bar, the rate of change of CO coverage also increases significantly due to the large pressure change. Figure 6 shows that in the high-pressure environment, the surface energy of the three metals is lower relative to the low-pressure environment’s surface energy. Additionally, the three low-index surface energies are not positively correlated with temperature, as shown in Figure 4 and Figure 5.
Figure 7 shows the percentage of low-index surfaces for Ag, Ni, and Ir at different pressures and temperatures. Coordination numbers less than seven are defined as edge and corner atoms. We note that there are more edge and corner atoms when the NPs expose more (100) and (110) facets. These structures may have better catalytic properties since the low-coordinated sites are normally more active than the high-coordinated ones. The (110) surface has a lower coordination number with respect to (100) and (111). We can see a significant increase in the (110) surface of Ag at a high pressure of 1 bar at a temperature of 300 K. At a high pressure of 1 bar, the Ni NPs also have a large (110) fraction before 700 K. For Ir NPs, (100) also has high coverage on CO, and (100) will form a lower surface energy than (110) and (111). Therefore, Ir NPs are prone to an equilibrium structure at low temperatures, forming a cube consisting of (100). For Ag NPs at a pressure of 1 bar and a temperature of 300 K, the surface energy of (110) decreases, so (110) can be seen significantly increased in the figure. For Ni NPs at pressures of 1 and 100 Pa, the (111) surface usually has a lower surface energy than the other two surfaces, so the structure is more exposed to the (111) surface. When the pressure increases to 1 bar, (110) has a more stable surface energy, so more of the (110) surface is exposed. For Ir NPs, the more exposed surfaces also have lower surface energy relative to other surfaces in a given environment.
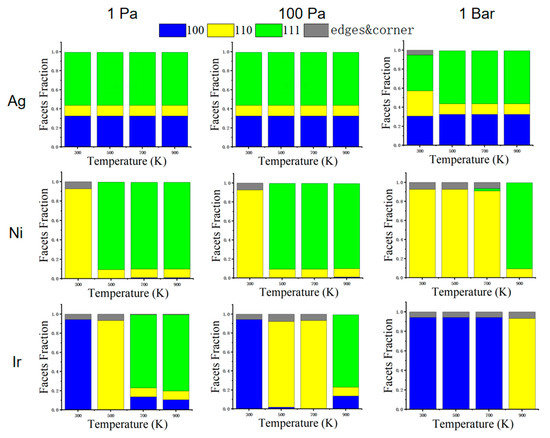
Figure 7.
The fraction of (100), (110), and (111) facets of corresponding structures under three pressures (1 Pa, 100 Pa, and 1 bar). Coordination numbers less than seven are defined as edge and corner atoms.
3. Methodology
3.1. DFT Calculations
In this work, all spin-polarized density functional theory (DFT) calculations were performed using the Vienna Ab initio Simulation Package (VASP) [33,34,35]. The projector augmented wave (PAW) was used [36,37]. The cut-off of the plane-wave expansion is 400 eV. The convergence criterion of the electronic self-consistent and the force in a conjugate-gradient algorithm are 10−5 eV and 0.05 eV/Å, respectively.
The surface energy of three pure metals can be written as follows:
here is referred to as the total energy of a (4 × 4) surface periodic slab, and is the energy per atom of the bulk metal. denotes the area of the slab, and is the number of pure metal atoms in the slab.
The Perdew–Burke–Ernzerhof (PBE) functional for Ag [38] and the revised form of the PBE functional (RPBE) for Ni and Ir were employed [39,40]. Each (4 × 4) slab contained 6 atomic layers with a vacuum of 20 Å. We used a (8 × 8 × 8) K point for the bulk calculation and a (8 × 8 × 1) K point for the slab calculation. For the surface energy calculation, the atoms in the slab were fully relaxed. For the CO adsorption calculation, the bottom two atomic layers were fixed, and the remaining atoms were allowed to relax. Considering the repulsive effect when adsorption of CO occurs on the surface, we calculated the adsorption energies of CO using the (1 × 1) slab for 100% coverage, and the adsorption energies of a single CO molecule on the (4 × 4) slab to get the repulsive energy . The K point of the (1 × 1) slab was set as (8 × 8 × 1) [41,42]. Then, the for CO can be written as follows:
here is the adsorption energy of a single CO molecule on the (4 × 4) slab, is the molecular adsorption energy using a (1 × 1) slab, and is the number of nearest neighbor surface coordination atoms.
When CO adsorbs on the surfaces, the entropy is set to 0. The entropy of gas-phase molecules is described by:
here is 1 atm, and is the entropy at 1 atm with a different temperature. The is fitted by data from the NIST-JANAF Thermochemical Tables [43].
3.2. MSR Model
MSR is a multiscale model that recently proposed that nanoclusters are reconfigured under atmospheric conditions. This model is composed of the Wulff construction, thermodynamic isotherms, and first-principle calculations.
Under a CO gas environment, the interface tension can be modified as follows:
here is the adsorption energy of the CO molecule, means the surface coverage by the adsorbed CO molecules, and is the surface area per surface atom. The surface coverage is determined by the CO pressure (P), temperature (T), and adsorption energy (). Considering the interaction of adsorbed CO on the metal surface, we changed Equation (4) to Equation (5) as follows:
then can be calculated by the Fowler–Guggenheim (F–G) adsorption isotherm, in which the lateral interaction between adsorbed CO is assumed to have a linear relationship to . This assumption works very well for low-index surfaces, but more test calculations concerning the adsorption configurations are needed when applying this model to high-index surfaces [44]:
here R means the gas constant and K is the adsorption equilibrium constant, which can be written as
where is the entropy of the adsorbed CO molecule, and is the entropy of the adsorbed gas-phase CO molecule.
4. Conclusions
In this work, we propose a multiscale reconstruction model based on a gas adsorption interaction. The MSR model is used to predict the equilibrium structures of different metal NPs (Ag, Ni, and Ir) at different temperature pressures in a CO atmosphere. In particular, the weak adsorption energy of CO on the Ag surface, the (110) surface of the equilibrium structure, increases at high pressure (1 bar) and low temperature (300 K). Under the same conditions, the coverage of the (110) surface is higher than that of the (100) and (111) surfaces due to the effect of the adsorption and repulsion energies of CO. Since the coordination number of the (111) surface is higher than that of the (100) and (110), this part of the (111) increases sharply on the nanoparticle surface as the CO coverage decreases. This work provides a more comprehensive understanding for in situ experiments and theoretical guidance for the rational design of nanocatalysts (Ag, Ni, and Ir).
Author Contributions
Methodology, B.Z. and Y.G.; software, B.Z. and Y.G.; formal analysis, M.Z.; investigation, M.Z. and Y.H.; data curation, M.Z. and Y.H.; writing—original draft preparation, M.Z.; writing—review and editing, W.X. and B.Z.; supervision, W.X. and B.Z.; funding acquisition, W.X. All authors have read and agreed to the published version of the manuscript.
Funding
This work was funded by the National Science Foundation of China (No. 11974195).
Conflicts of Interest
The authors declare no conflict of interest.
References
- Liao, H.G.; Jiang, Y.X.; Zhou, Z.Y.; Chen, S.P.; Sun, S.G. Shape-controlled synthesis of gold nanoparticles in deep eutectic solvents for studies of structure–functionality relationships in electrocatalysis. Angew. Chem. Int. Ed. 2008, 47, 9100–9103. [Google Scholar] [CrossRef] [PubMed]
- Narayanan, R.; El-Sayed, M.A. Catalysis with transition metal nanoparticles in colloidal solution: Nanoparticle shape dependence and stability. J. Phys. Chem. B 2005, 109, 12663–12676. [Google Scholar] [CrossRef]
- Burda, C.; Chen, X.; Narayanan, R.; El-Sayed, M.A. Chemistry and properties of nanocrystals of different shapes. Chem. Rev. 2005, 105, 1025–1102. [Google Scholar] [PubMed]
- Ahmadi, T.S.; Wang, Z.L.; Green, T.C.; Henglein, A.; El-Sayed, M.A. Shape-controlled synthesis of colloidal platinum nanoparticles. Science 1996, 272, 1924–1925. [Google Scholar] [CrossRef] [PubMed]
- Frey, H.; Beck, A.; Huang, X.; van Bokhoven, J.A.; Willinger, M.-G. Dynamic interplay between metal nanoparticles and oxide support under redox conditions. Science 2022, 376, 982–987. [Google Scholar] [CrossRef] [PubMed]
- Abuin, M.; Kim, Y.Y.; Runge, H.; Kulkarni, S.; Maier, S.; Dzhigaev, D.; Lazarev, S.; Gelisio, L.; Seitz, C.; Richard, M.-I. Coherent X-ray imaging of CO-adsorption-induced structural changes in Pt nanoparticles: Implications for catalysis. ACS Appl. Nano Mater. 2019, 2, 4818–4824. [Google Scholar] [CrossRef]
- Avanesian, T.; Dai, S.; Kale, M.J.; Graham, G.W.; Pan, X.; Christopher, P. Quantitative and atomic-scale view of CO-induced Pt nanoparticle surface reconstruction at saturation coverage via DFT calculations coupled with in situ TEM and IR. J. Am. Chem. Soc. 2017, 139, 4551–4558. [Google Scholar] [CrossRef]
- Jiang, Y.; Li, H.; Wu, Z.; Ye, W.; Zhang, H.; Wang, Y.; Sun, C.; Zhang, Z. In situ observation of hydrogen-induced surface faceting for palladium–copper nanocrystals at atmospheric pressure. Angew. Chem. Int. Ed. 2016, 55, 12427–12430. [Google Scholar] [CrossRef]
- Baldi, A.; Narayan, T.C.; Koh, A.L.; Dionne, J.A. In situ detection of hydrogen-induced phase transitions in individual palladium nanocrystals. Nat. Mater. 2014, 13, 1143–1148. [Google Scholar] [CrossRef]
- Yuan, Y.; Yan, N.; Dyson, P.J. Advances in the rational design of rhodium nanoparticle catalysts: Control via manipulation of the nanoparticle core and stabilizer. Acs Catal. 2012, 2, 1057–1069. [Google Scholar] [CrossRef]
- Tao, F.; Salmeron, M. In situ studies of chemistry and structure of materials in reactive environments. Science 2011, 331, 171–174. [Google Scholar] [CrossRef]
- Tao, F.; Grass, M.E.; Zhang, Y.; Butcher, D.R.; Renzas, J.R.; Liu, Z.; Chung, J.Y.; Mun, B.S.; Salmeron, M.; Somorjai, G.A. Reaction-driven restructuring of Rh-Pd and Pt-Pd core-shell nanoparticles. Science 2008, 322, 932–934. [Google Scholar] [CrossRef]
- Liu, Z.; Ihl Woo, S. Recent advances in catalytic DeNOx science and technology. Catal. Rev. 2006, 48, 43–89. [Google Scholar] [CrossRef]
- Hansen, P.L.; Wagner, J.B.; Helveg, S.; Rostrup-Nielsen, J.R.; Clausen, B.S.; Topsøe, H. Atom-resolved imaging of dynamic shape changes in supported copper nanocrystals. Science 2002, 295, 2053–2055. [Google Scholar] [CrossRef] [PubMed]
- Tao, A.R.; Habas, S.; Yang, P. Shape control of colloidal metal nanocrystals. Small 2008, 4, 310–325. [Google Scholar] [CrossRef]
- Yuan, L.; Li, X.; Zhu, B.; Zhang, G.; Gao, Y. Reshaping of Rh nanoparticles in operando conditions. Catal. Today 2020, 350, 184–191. [Google Scholar] [CrossRef]
- Rossi, K.; Asara, G.G.; Baletto, F. A genomic characterisation of monometallic nanoparticles. Phys. Chem. Chem. Phys. 2019, 21, 4888–4898. [Google Scholar] [CrossRef]
- Chepkasov, I.; Visotin, M.; Kovaleva, E.; Manakhov, A.; Baidyshev, V.; Popov, Z. Stability and electronic properties of PtPd nanoparticles via MD and DFT calculations. J. Phys. Chem. C 2018, 122, 18070–18076. [Google Scholar] [CrossRef]
- Nanba, Y.; Ishimoto, T.; Koyama, M. Structural stability of ruthenium nanoparticles: A density functional theory study. J. Phys. Chem. C 2017, 121, 27445–27452. [Google Scholar] [CrossRef]
- Zhu, B.; Creuze, J.; Mottet, C.; Legrand, B.; Guesmi, H. CO adsorption-induced surface segregation and formation of Pd chains on AuPd (100) alloy: Density Functional Theory based Ising model and Monte Carlo simulations. J. Phys. Chem. C 2016, 120, 350–359. [Google Scholar] [CrossRef]
- Turner, C.H.; Lei, Y.; Bao, Y. Modeling the atomistic growth behavior of gold nanoparticles in solution. Nanoscale 2016, 8, 9354–9365. [Google Scholar] [CrossRef] [PubMed]
- Wang, Y.-G.; Yoon, Y.; Glezakou, V.-A.; Li, J.; Rousseau, R. The role of reducible oxide–metal cluster charge transfer in catalytic processes: New insights on the catalytic mechanism of CO oxidation on Au/TiO2 from ab initio molecular dynamics. J. Am. Chem. Soc. 2013, 135, 10673–10683. [Google Scholar] [CrossRef]
- Ouyang, R.; Liu, J.-X.; Li, W.-X. Atomistic theory of Ostwald ripening and disintegration of supported metal particles under reaction conditions. J. Am. Chem. Soc. 2013, 135, 1760–1771. [Google Scholar] [CrossRef] [PubMed]
- Zafeiratos, S.; Piccinin, S.; Teschner, D. Alloys in catalysis: Phase separation and surface segregation phenomena in response to the reactive environment. Catal. Sci. Technol. 2012, 2, 1787–1801. [Google Scholar] [CrossRef]
- Barmparis, G.D.; Remediakis, I.N. Dependence on CO adsorption of the shapes of multifaceted gold nanoparticles: A density functional theory. Phys. Rev. B 2012, 86, 085457. [Google Scholar] [CrossRef]
- Li, C.; Raciti, D.; Pu, T.; Cao, L.; He, C.; Wang, C.; Mueller, T. Improved prediction of nanoalloy structures by the explicit inclusion of adsorbates in cluster expansions. J. Phys. Chem. C 2018, 122, 18040–18047. [Google Scholar] [CrossRef]
- Cao, L.; Mueller, T. Theoretical insights into the effects of oxidation and Mo-doping on the structure and stability of Pt–Ni nanoparticles. Nano Lett. 2016, 16, 7748–7754. [Google Scholar] [CrossRef]
- Tan, T.L.; Wang, L.-L.; Johnson, D.D.; Bai, K. A comprehensive search for stable Pt–Pd nanoalloy configurations and their use as tunable catalysts. Nano Lett. 2012, 12, 4875–4880. [Google Scholar] [CrossRef]
- Yuge, K. Segregation of Pt28Rh27 bimetallic nanoparticles: A first-principles study. J. Phys. Condens. Matter 2010, 22, 245401. [Google Scholar] [CrossRef]
- Zhu, B.; Xu, Z.; Wang, C.; Gao, Y. Shape evolution of metal nanoparticles in water vapor environment. Nano Lett. 2016, 16, 2628–2632. [Google Scholar] [CrossRef]
- Zhang, X.; Meng, J.; Zhu, B.; Yu, J.; Zou, S.; Zhang, Z.; Gao, Y.; Wang, Y. In situ TEM studies of the shape evolution of Pd nanocrystals under oxygen and hydrogen environments at atmospheric pressure. Chem. Commun. 2017, 53, 13213–13216. [Google Scholar] [CrossRef] [PubMed]
- Assaf, N.W.; Suleiman, I.A.; Shawaqfeh, A.T. The surface energy phase diagrams of CO adsorption on the low index iridium surfaces and the morphology of iridium nanoparticles. J. Cryst. Growth 2022, 593, 126774. [Google Scholar] [CrossRef]
- Kresse, G.; Furthmüller, J. Efficiency of ab-initio total energy calculations for metals and semiconductors using a plane-wave basis set. Comput. Mater. Sci. 1996, 6, 15–50. [Google Scholar] [CrossRef]
- Kresse, G.; Furthmüller, J. Efficient iterative schemes for ab initio total-energy calculations using a plane-wave basis set. Phys. Rev. B 1996, 54, 11169. [Google Scholar] [CrossRef]
- Kresse, G.; Hafner, J. Ab initio molecular dynamics for liquid metals. Phys. Rev. B 1993, 47, 558. [Google Scholar] [CrossRef]
- Kresse, G.; Joubert, D. From ultrasoft pseudopotentials to the projector augmented-wave method. Phys. Rev. B 1999, 59, 1758. [Google Scholar] [CrossRef]
- Blöchl, P.E. Projector augmented-wave method. Phys. Rev. B 1994, 50, 17953. [Google Scholar] [CrossRef]
- Patra, A.; Peng, H.; Sun, J.; Perdew, J.P. Rethinking CO adsorption on transition-metal surfaces: Effect of density-driven self-interaction errors. Phys. Rev. B 2019, 100, 035442. [Google Scholar] [CrossRef]
- Gajdoš, M.; Hafner, J.; Eichler, A. Ab initio density-functional study of NO on close-packed transition and noble metal surfaces: I. Molecular adsorption. J. Phys. Condens. Matter 2005, 18, 13. [Google Scholar] [CrossRef]
- Gajdoš, M.; Eichler, A.; Hafner, J. CO adsorption on close-packed transition and noble metal surfaces: Trends from ab initio calculations. J. Phys. Condens. Matter 2004, 16, 1141. [Google Scholar] [CrossRef]
- Blöchl, P.E.; Jepsen, O.; Andersen, O.K. Improved tetrahedron method for Brillouin-zone integrations. Phys. Rev. B 1994, 49, 16223. [Google Scholar] [CrossRef] [PubMed]
- Monkhorst, H.J.; Pack, J.D. Special points for Brillouin-zone integrations. Phys. Rev. B 1976, 13, 5188. [Google Scholar] [CrossRef]
- Chase, M.W., Jr. JANAF thermochemical table. J. Phys. Chem. Ref. Data 1985, 14 (Suppl. 1), 695–940. [Google Scholar]
- Fowler, R.H.; Guggenheim, E.A. Statistical Thermodynamics; Cambridge University Press: Cambridge, UK, 1939; pp. 431–450. [Google Scholar]
Disclaimer/Publisher’s Note: The statements, opinions and data contained in all publications are solely those of the individual author(s) and contributor(s) and not of MDPI and/or the editor(s). MDPI and/or the editor(s) disclaim responsibility for any injury to people or property resulting from any ideas, methods, instructions or products referred to in the content. |
© 2023 by the authors. Licensee MDPI, Basel, Switzerland. This article is an open access article distributed under the terms and conditions of the Creative Commons Attribution (CC BY) license (https://creativecommons.org/licenses/by/4.0/).