Abstract
Levan has wide applications in chemical, cosmetic, pharmaceutical and food industries. The free levansucrase is usually used in the biosynthesis of levan, but the poor reusability and low stability of free levansucrase have limited its large-scale use. To address this problem, the surface-displayed levansucrase in Saccharomyces cerevisiae were generated and evaluated in this study. The levansucrase from Zymomonas mobilis was displayed on the cell surface of Saccharomyces cerevisiae EBY100 using a various yeast surface display platform. The N-terminal fusion partner is based on a-agglutinin, and the C-terminal one is Flo1p. The yield of levan produced by these two whole-cell biocatalysts reaches 26 g/L and 34 g/L in 24 h, respectively. Meanwhile, the stability of the surface-displayed levansucrases is significantly enhanced. After six reuses, these two biocatalysts retained over 50% and 60% of their initial activities, respectively. Furthermore, the molecular weight and polydispersity test of the products suggested that the whole-cell biocatalyst of levansucrase displayed by Flo1p has more potentials in the production of levan with low molecular weight which is critical in certain applications. In conclusion, our method not only enable the possibility to reuse the enzyme, but also improves the stability of the enzyme.
1. Introduction
Levan is a polysaccharide with diverse probiotic functions that is currently receiving increasing attention. Levan is widely found in nature, as an extracellular polysaccharide in microorganisms and as a non-structural storage carbohydrate in plants [1]. Levan consists of fructose units mainly linked by β (2,6) glycosidic bonds, with β (2,1) linked side chains [2]. It can be obtained by chemical synthesis, microbial fermentation or enzymatic synthesis. The cost of chemical synthesis method is too high, and the yield of fermentation broth extraction method is low and the separation is difficult [3]. In contrast, the enzymatic synthesis of levan has more industrial prospects. It is based on the direct polymerization of the fructose group of sucrose by transglycosylation using levansucrase (EC 2.4.1.10) [4]. Currently, the preparation efficiency, stability and reusability of levansucrase limits the application of levan enzymatic synthesis methods. Although the efficiency of levansucrase utilization has been improved mainly by immobilization [5,6,7], e.g., Zymomonas mobilis levansucrae was immobilized in the chitin-binding domain to obtain 83 g/L levan [8], however, the cost of enzyme preparation via immobilization is still an major obstacle to the application of enzymatic synthesis of levan.
Whole-cell catalyst technology is a biotechnology widely used in research and industry to reduce the production time and cost. Surface display system is an important technology in this field, which can auto-immobilize proteins on the exterior of microbial cell [9]. The interested protein can be fused to anchor motif and displayed on the cell surface, which still maintains the stability and functional activity of the interested protein. Surface display system has been successfully applied to the modification of various enzyme, such as lipase, xylanase, cellulase and so on [10,11,12,13,14]. The production of fructooligosaccharides (FOS) by surface display of fructosyltransferase have been observed [15]. However, only few studies on the synthesis of levan using surface display of levansucrase were reported. Heung-Chae Jung used ice-nucleation as an anchoring protein to synthesize Z. mobilis levansucrase on Escherichia coli surface and obtained 44 g/L levan by whole-cell bioconversion in 9 consecutive days [16]. The application of other surface display systems in levan synthesis has not been reported.
The biological activity of polysaccharides is affected by their molecular weight [17,18,19]. It has been reported that the prebiotic activity of levan is related to its high degree of polymerization. This study found that the number of Bifidobacterium population increased significantly higher in the models treated using levan with high degree of polymerisation than using inulin with low degree of polymerization. However, as for levan, the biological activity of low molecular levan is better. In this study, levans with various molecular weight and levan oligosaccharides were used for evaluation, and the low molecular weight levan had the most obvious inhibitory effect on pathogenic bacteria [20]. Levansucrase can produce levan with different degrees of polymerization and FOS, depending on the microbial source of the enzyme and the conditions of reaction as sucrose concentration, pH, temperature, metal ions and reactors types [21,22,23,24]. At present, the effects of different surface display systems on the molecular weight of levan have not been reported.
In this paper, two different anchoring proteins (Aga1p, Flo1p) were used to construct different surface display systems. Levansucrase from Z. mobilis was displayed on the surface of Saccharomyces cerevisiae and used to biosynthesis levan from sucrose. The enzyme activity and stability under different conditions were tested and compared with free levansucrase. Furthermore, the effects of different synthesis methods on the molecular weight of levan were evaluated.
2. Results and Discussion
2.1. Construction of Two Yeast Cell Surface Display Systems
The levU gene was successfully cloned and it shows 1269 bp of ORF encoding 423 amino acid (aa) residues. The sequence exhibited 99% identity with the levansucrase from Z. mobilis subsp. ATCC 10988 (GenBank: AAA27695.1) [25]. The mode of fusion has an important effect on the function of the fusion protein, depending mainly on the structure of the protein [26]. To ensure the activity of levansucrase, two yeast display systems, a-agglutinin and Flo1p, were chosen to display levansucrase on the cell surface of S. cerevisiae. The a-agglutinin receptor consists of two subunits, Aga1p (725 aa) and Aga2p (69 aa). The levU gene (without termination codon) was cloned into the 3′ end of aga2 gene, located downstream of the GAL1 promoter (Figure 1a). The Aga1p is secreted from the yeast cell and covalently linked to cell wall via β-glucan, the Aga2p binds to Aga1p through two disulfide bonds. The N-terminal portion of Aga2p is required for attaching to Aga1p, while LevU can be fused to the C-terminal for presenting on the yeast cell surface. The a-agglutinin display system was successfully constructed and could immobilize the levansucrase on the surface of yeast by N-terminal fusion (Figure 1b). In this system, the C-terminal of the levansucrase is free.
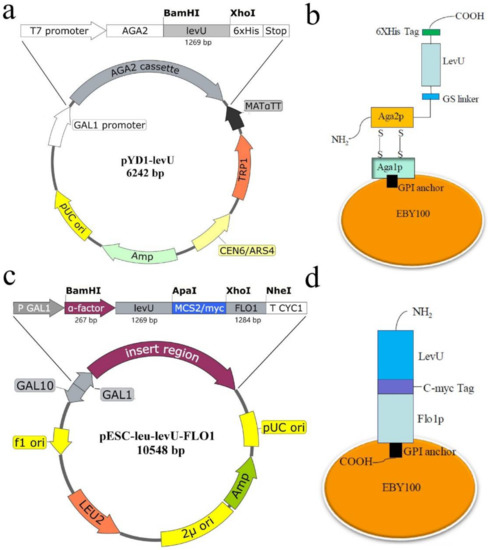
Figure 1.
Schematic design of the yeast surface display systems for levansucrase from Z. mobilis. (a) Construction of plasmid pYD1-levU; (b) yeast cell surface display mechanism of a-agglutinin system; (c) Construction of plasmid pESC-leu-levU-FLO1; (d) yeast cell surface display mechanism of Flo1p system.
The Flo1p system involved in the α-factor in S. cerevisiae. The α-factor gene with 267 bp as an efficient signal peptide of yeast was amplified and fused with the levU, and a 1536 bp fused DNA fragment (α-factor-levU) was successfully assembled. The secretory expression plasmid pESC-leu-α-factor-levU was constructed. The FLO1 gene with 1284 bp (428 aa) as flocculation protein gene of S. cerevisiae was amplified and inserted into the downstream of the fusion gene (Figure 1c). The C-terminal region of Flo1p contains a glycosylphosphatidylinositol (GPI)-attachment signal, so the N-terminal of Flo1p is fused with the C-terminal of LevU (Figure 1d). In this system, the N-terminal of the levansucrase is free.
2.2. Verification of the Recombinant Levansucrase Localization on S. cerevisiae EBY100
To verify whether the fusion proteins were successfully displayed on the cell surface of the yeast or not, the induced cells were conducted with the 6 × His/C-myc monoclonal antibody as the primary antibody and IgG-FITC/IgG-AMCA as the secondary antibody. The green fluorescence was observed on the cells of the induced EBY100/pYD1-levU under the fluorescence microscope (Figure 2), and the blue fluorescence was observed on the EBY100/pESC-leu-levU-FLO1 cells (Figure 3), while no fluorescence was detected on the yeast cells EBY100 without levU. These results indicate that the fusion protein was indeed successfully displayed on the cell surface of S. cerevisiae EBY100.
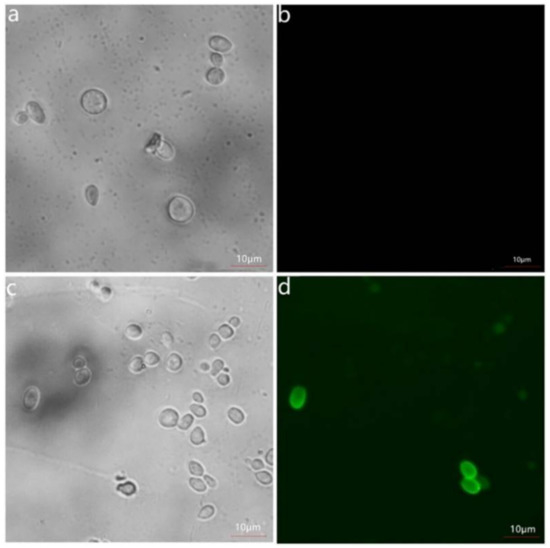
Figure 2.
Immunofluorescence labeling of recombinant enzyme displayed on the yeast cell surface. (a,b) the bright-field and immunofluorescence micrographs of S. cerevisiae EBY100 cells harboring pYD1, respectively; (c,d) the bright-field and immunofluorescence micrographs of S. cerevisiae EBY100 cells harboring pYD1-levU, respectively.
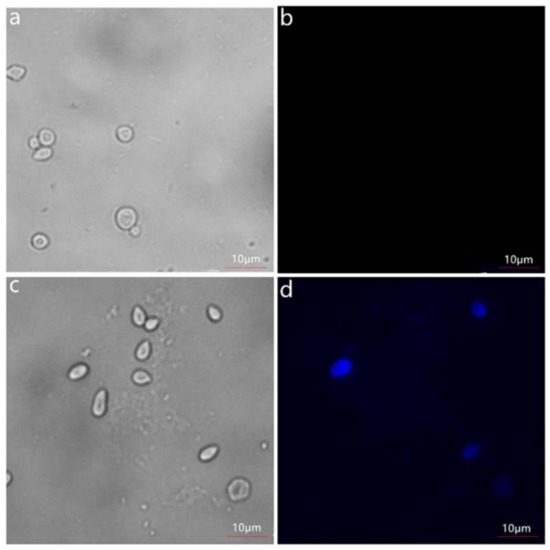
Figure 3.
Immunofluorescence labeling of recombinant enzyme displayed on the yeast cell surface. (a,b) the bright-field and immunofluorescence micrographs of S. cerevisiae EBY100 cells harboring pESC-leu, respectively; (c,d) the bright-field and immunofluorescence micrographs of S. cerevisiae EBY100 cells harboring pESC-leu-levU-FLO1, respectively.
2.3. Characterization of Levansucrase
The effects of temperature, pH, different metal ions (5 mmol) on the enzyme activity of levansucrase were examined. The optimal temperature of the displayed levansucrases was 35 °C, while the free levansucrase showed the highest activity at 30 °C. At temperatures, below 30 °C, the free levansucrase exhibited slightly higher activity than the two displayed levansucrases. However, at temperatures above 35 °C, the displayed levansucrases showed a significant increase in enzyme activity in comparison to free levansucrase. It is worth to mention that, the free levansucrase activity dropped to 25% at 45 °C, while the two displayed levansucrases had 50% of the maximal activity at 45 °C (Figure 4a). An important problem in biotechnological utilization of levansucrases is their relatively low thermal stability. Therefore, it was of great interest to further explore if displayed levansucrase on the surface of yeast cell could enhance this property. Figure 4b shows the stability of free and displayed levansucrases at 50 °C for different time, displayed levansucrase kept 50% and 60% of the initial activity after pre-incubating enzyme at 50 °C for 180 min, respectively. However, the free enzyme only remained 20% relative activity. The results showed that the thermal stability of displayed levansucrases were 2.5–3 times better than free levansucrase.
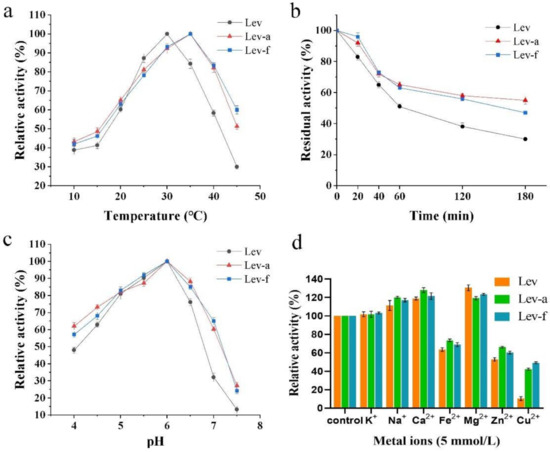
Figure 4.
Effects of pH and temperature on the relative activity of S. cerevisiae cell surface displayed levansucrases and free levansucrase. (a) the relative activities along with different temperatures; (b) the thermal stabilities along with the time durations at 50 °C; (c) the relative activities at different pH values; (d) effects of metal ions on the activity of levansucrases at 30 °C and pH 6.0. Abbreviations: Lev, free levansucrase; Lev-a, levansucrase displayed with a-agglutinin; Lev-f, levansucrase displayed with Flo1p. (The maximum activity was taken as 100%; experiments were performed in triplicates, and error bars represent one Standard Deviation).
The activity of both free and displayed levansucrase were examined by sucrose dissolving at the buffer with different pHs (3.0–7.5). The optimum pH of the two displayed levansucrases was 6.0, which is identical to free levansucrase (Figure 4c). The pH above 7.5 led to a complete inhibition of the levansucrase. Overall, the two displayed levansucrases showed a better pH tolerance than free levansucrase, especially when pH is higher than 7.0 (2+ times better). In the cases of Bacillus subtilis, Pseudomonas syringae and Rahnella aquatilis, the optimal pH for levan formation is 6.0 [27]. Dan Goldman found that Z. mobilis levansucrase exists in two active forms, depending on the pH, at pH above 7.0, the enzyme is mainly a dimer, at pH below 6.0, the enzyme in its microfibril form [28].
Overall, the properties of the surface display levansucrases did not alter too much in comparison with their free forms. These observations suggest that the display of levansucrase didn’t lead to remarkable alterations in the enzyme microenvironment. In addition, the optimum temperatures of levansucrase displayed with a-agglutinin was similar to Flo1p, which indicates that the anchoring motifs have no significant effect on the temperature and pH profiles of the displayed levansucrase.
The effect of different metal ions on the activity of levansucrase was assayed at the optimum temperature and pH, in which the metal ions were set to a final concentration of 5 mmol/L. The reaction without any metal ions was used as the control. As shown in Figure 4d, The Na+, Ca2+ and Mg2+ caused significant increases in the enzyme activity, while K+ almost had no effect on the levansucrase activity. The heavy metal ions Fe2+, Zn2+ and Cu2+ strongly inhibited the enzyme activity, which is consistent to the result reported by Chevalier and Rupp [29], while our displayed levansucrases reduced the inhibitory effect, especially to Cu2+ (4–5 times better, Figure 4d).
With the surface-displayed expression system, we can reuse levansucrase as the immobilized enzyme on the yeast cells. As shown in Figure 5, the enzyme activity gradually decreased with an increase of the reused times. The levansucrases retained 80% of their initial activity in the second cycles and more than 50% of their activity was still remained after six cycles. The reuse efficiency of Lev-f is slightly higher than that of Lev-a. Overall, the results demonstrate the two recombinant strains can be repeatedly used as whole-cell catalyst to produce levan from sucrose.
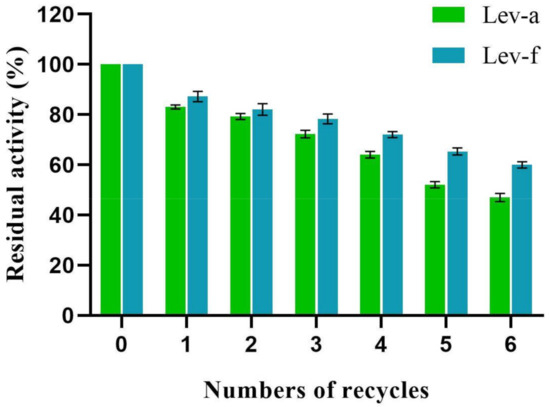
Figure 5.
Effect of the number of successive reactions on the levansucrase activity. The residual activity was determined by assuming that the first-round activity was 100%. Lev-a, levansucrase displayed with a-agglutinin; Lev-f, levansucrase displayed with Flo1p. (Experiments were performed in triplicates, and error bars represent one standard deviation).
2.4. Levan Biosynthesis
To obtain a high yield of levan, the important process parameters, including sucrose concentration and reaction time, were optimized. The yield of levan was significantly enhanced when the sucrose concentration was increased from 100 to 400 g/L (Figure 6a), while the yield of levan was slightly decreased when the sucrose concentration was 500 g/L. The reason may be the following, high sucrose content leads to a high viscosity of the reaction system, which is detrimental to molecular diffusion, thus makes the enzyme catalyzes the reaction less efficiently. Different incubation periods were used to further identify the best synthesis time for levan production, and it was found that the yield of levan increased rapidly during the first 24 h and then became stable for all three levansucrases (Figure 6b), so the optimal reaction time was determined to be 24 h.
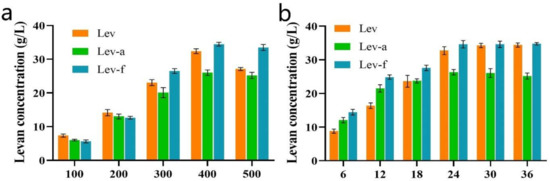
Figure 6.
Optimization of sucrose concentration and reaction time on levan synthesis. (a) The effect of sucrose concentration on levan synthesis. (b) The effect of reaction time on levan synthesis with a sucrose concentration of 400 g/L. Lev, free levansucrase; Lev-a, levansucrase displayed with a-agglutinin; Lev-f, levansucrase displayed with Flo1p.
The levan was biosynthesized under the optimal conditions. The yield of levan produced by Lev-f reached 34 g/L after 24 h, which is higher than that by Lev-a (26 g/L). The productivities were 1.42 g/L/h and 1.08 g/L/h, respectively. The productivities of the yeast-developing systems were much higher than that of the previously reported system. Heung-Chae Jung displayed the Z. mobilis levansucrase on the surface of Escherichia coli and used it to synthesize levan. After 9 days of reaction, levan (44 g/L) was synthesized from sucrose, but the productivity only reached 0.2 g/L/h [16]. That suggests that our methods can produce levan much more efficiently. The difference in the yield of two systems may be due to different anchoring motifs, besides the location of His-tags. Hill et al. found that the levansucrase from Vibrio natriegens with the His-tags located at the N-terminal (VnLS-N) appeared a better transfructosylating efficiency than the C-terminal form (VnLS-C), therefore the VnLS-N can produce levan more efficiently than VnLS-C [30]. The productivity varies greatly among levansucrases from different types of microorganisms. In this investigation, the productivity of whole-cell catalyst was higher than those reported in most of the studies (Table 1). Nevertheless, the constructed yeast-developing systems for the levan biosynthesis can be further improved by using defected invertase strains. S. cerevisiae EBY100 used in our systems was not an invertase defective strain in sucrose utilization, and only part of the substrate is used for transformation, while the other part is used by the host. This has been reported in the production of levan using a recombinant invertase defective S. cerevisiae [31]. It indicated the levan productivity of the yeast-developing system can be further increased by choosing different strains of invertase.

Table 1.
Levan biosynthesis from sucrose by microbial levansucrase.
2.5. Polymerization of Levan Synthesized by Different Forms of Levansucrase
Because the biological activity of levan was influenced by its polymerization, the molecular weight (Mw) and polydispersity (PD) of the levan produced by different forms of levansucrase were determined by the gel permeation chromatography (GPC). It was found that levan showed that the antitumor activity depends on its Mw and PD, and the maximum effect was observed at Mw of 460 kDa and PD of 16.2 [37]. In our experiments, the Mw of levan produced by Lev-f was 690 kDa, was slightly higher than that by Lev-a, which was 610 kDa, while the Mw of levan produced by free enzyme was 2760 kDa (Figure 7). Therefore, the GPC results revealed that whole-cell catalysts produced low Mw levan. One possible explanation is that the displayed levansucrase may have a weaker bind with the levan chain than the free levansucrase, thereby showing low Mw levan formation. However, the PD of levan produced by Lev-a reached 53.5 which was higher than that of Lev-f (26.9). It suggested that the levan produced by Lev-f has more potential in antitumor activity, because its Mw and PD were closer to that in the literature which has the optimal antitumor ability [37].
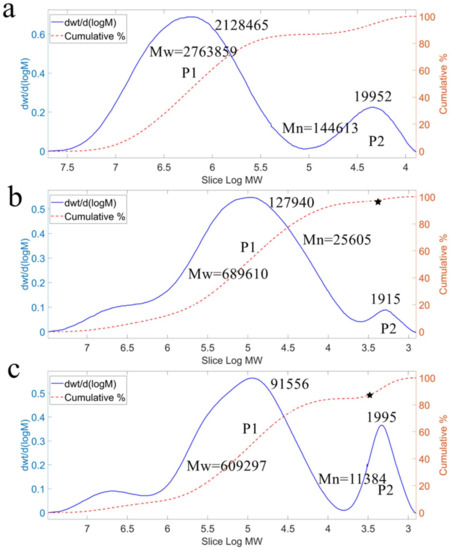
Figure 7.
GPC profiles of levan products synthesized by different forms of levansucrases. (a) levan produced by Lev; (b) levan produced by Lev-f; (c) levan produced by Lev-a; Mw = weight average molecular weight; Mn = number average molecular weight.
The levans produced by levansucrases in vitro often had a bimodal distribution of molecular weight. B. subtilis 168 levansucrase can synthesize low and high Mw levan with an average of 8.3 and 2300 kDa respectively [38], and the values are 5 and 3000 kDa for Z.mobilis levansucrase [17]. Similar results were found in this study. The free levansucrase synthesized low and high Mw levan (P2 and P1, Figure 7) with an average of 20 and 2128 kDa, respectively. While that are 1.9 and 127.9 kDa for Lev-f, and 2.0 and 91.6 kDa for Lev-a, respectively. The homogeneity tends to have a significant effect on the activity of polysaccharides [39]. Our results showed the bimodal distribution of molecular weight of the levan produced by Lev-f was more likely a single-peak distribution (comparing the P2 peaks in Figure 7), indicating that the homogeneity of the levan had improved.
According to the molecular weight, the P2 fraction of the levan produced by displayed levansucrase was inferred as levan FOS. Thus, the FOS produced by Lev-f was much less than that by Lev-a (Figure 7b,c). The content of FOS in the levan produced by Lev-a reached 17% (indicating by the pentagram in Figure 7c), which is much higher than that of Lev-f (2%). It may be the reason that the catalytic domain of levansucrase is closer to the N-terminal, where the fusion protein anchored at the cell surface in Lev-a, and the enhanced effect of steric hindrance may limit the extension of the polysaccharide chain. Moreover, levans with various molecular weight and different FOS were used for evaluating the antibacterial activity, indicating that low Mw levans are preferable as alternative sweeteners to the FOS [40]. Thus, the levan produced by Lev-f can be considered as prebiotics.
Only few investigations have been reported that the forms of levansucrase affected levan Mw distribution in enzymatic synthesis, but they have led to conflicting results. Jang et al. found that immobilization of levansucrase onto magnetite resulted the Mw of levan decreased from 6000 kDa to 3000 kDa [23]. Moriano et al. found that immobilized levansucrase from Z. mobilis on vinyl sulfone-activated silica was not able to produce levan but synthesized a similar amount of FOS than the free enzyme [24]. In contrast, Chambert et al. found that immobilization of levansucrase (from Bacillus subtilis) onto the calcium phosphate caused the formation of high Mw levan in large quantity [6]. It is obvious that different origins of the levansucrase and different immobilization supports could result in different effects.
3. Materials and Methods
3.1. Strains, Plasmids and Culture Conditions
The levansucrase-producing bacterial Zymomonas mobilis CICC10225 strain was obtained from the China Center of Industrial Culture Collection (CICC®). Plasmid pYD1, pESC-leu and Saccharomyces cerevisiae EBY100 (MATaura3-52 trp 1 leu 2Δ1 his3Δ200 pep4: HIS3 prb 1Δ1.6R can1 GAL1) were purchased from Invitrogen (Shanghai, China) and used for yeast cell surface display. The pMD19-T plasmid for sequencing was purchased from Takara Biotechnology (Dalian, China).
Z. mobilis was cultivated in medium (50 g/L sucrose, 7.0 g/L yeast extract, 2.5 g/L K2HPO4, 1.6 g/L (NH4)2SO4, 1.0 g/L MgSO4·7H2O). Escherichia coli DH5α was used as a host for DNA manipulation and grown in Luria-Bertani (LB) medium (10 g/L NaCl, 10 g/L peptone, 5 g/L yeast extract). Recombinant E. coli DH5α was grown in LB medium with 50 μg/mL ampicillin. S. cerevisiae EBY100 was grown in YPD medium (10 g/L yeast extract, 20 g/L peptone, 20 g/L dextrose), pESC-leu transformants were selected on Minimal Dextrose Plates with tryptophan(MDT), and pYD1 transformants were selected on Minimal dextrose plates with leucine (MDL). The following precultivation was performed in SD-CAA medium (20 g/L glucose, 6.7 g/L YNB, 5 g/L casamino acids). S. cerevisiae EBY100 transformants harboring plasmids were aerobically cultivated in SG-CAA medium (20 g/L galactose, 6.7 g/L YNB, 5 g/L casamino acids) for fusion protein expression and cell-surface display.
3.2. Construction of Cell-Surface Display Plasmids
The Z. mobilis levansucrase gene (levU) was amplified by PCR from its genome using the primer sets levU-F/levU-R (Table 2). The PCR conditions were as follows: 95 °C for 5 min; 30 cycles in 95 °C for 15 s, 55 °C for 15 s, and 72 °C for 30 s; and 72 °C for 10 min. The amplified products were purified using Gel/PCR Extraction Kit (Biomiga, SanDiego, CA, USA) and digested with both BamH I and Xho I (Thermo Fisher Scientific Inc, Waltham, MA, USA). The purified levU gene was ligated into the BamH I-Xho I restriction sites of the display vector pYD1 using T4 DNA ligase. The resulted plasmid, pYD1-levU, was transformed into E. coli DH5α using the heat-shock method. Positive clones were analyzed by restriction endonuclease digestion and PCR and then by sequencing.
Table 2.
Primers used in the present study.
The levU2 gene was amplified by PCR using the primer sets levU-F2/levU-R2. The α-factor gene of yeast signal peptide was amplified by S. cerevisiae EBY100 with the primer sets αF1/αR1 for secretory expression of levansucrase in S. cerevisiae. LevU2 and α-factor fragments were used as templates to amplify the secretory sequence α-factor-levU by overlapping PCR using primer sets αF1/levU-R2. The FLO1 gene was amplified from S. cerevisiae EBY100 with the primer sets FL-F/FL-R. The obtained fragments α-factor-levU and pESC-leu expression vector were digested with BamH I and Apa I, respectively. The products were ligated with T4 DNA ligase at 20 °C for 2 h and transferred into E. coli DH5α. The obtained positive plasmid was named pESC-leu-levU. The vector pESC-leu-levU and FLO1 were digested with XhoI and NheI, respectively. The products were ligated and transferred into E. coli DH5α. Large quantities of pESC-leu-levU-FLO1 plasmid and pYD1-levU plasmid were extracted for transformation into S. cerevisiae EBY100 using the TIANprep Mini Plasmid Kit (Tiangen Biotech, Beijing, China).
3.3. Yeast Transformation and Surface Display of Levansucrase
pYD1-levU plasmids were transformed into S. cerevisiae EBY100 competent cells by lithium acetate method [41]. The yeast transformants were selected on the MDL plates by incubated at 30 °C for 2 to 4 days until single colonies appeared. Trp+ phenotype transformants were confirmed by colony PCR. The pESC-leu-levU and pESC-leu-levU-FLO1 plasmids were treated in the same way except the screening culture is MDT media.
The yeast transformants were incubated in 10 mL SD-CAA selective medium for about 24 h at 30 °C until the OD600 was about 2–5. The yeast cells were collected by centrifugation (6000 rpm, 4 °C, 5 min) and resuspended in SG-CAA medium to an OD600 of 0.5 to 1, and then cultivated at 20 °C with shaking at 200 rpm for about 48 h for inducting expression. Induced cells were harvested by centrifugation (6000 rpm, 4 °C, 5 min), then washed and resuspended with citric acid phosphate buffer (50 mmol/L, pH 6.0) until the OD600 is 2.0, to obtain the cell suspension of the displayed enzyme. For EBY100/pESC-leu-levU, the culture supernatant was treated with ammonium sulfate to 85% saturation to precipitate the free levansucrase, then resuspended.
3.4. Indirect Yeast Immunofluorescence
Fluorescent immunostaining was performed to assess the presence of levansucrase on the yeast cell surface using fluorescent antibody and microscopy. The cells of EBY100/pYD1-levU were collected by centrifugation (6000 rpm, 4 °C, 5 min), washed twice with 50 mmol/L PBS buffer (pH7.4), and then resuspended in 250 μL of 1 × PBS (containing 1 mg/mL BSA and 5 μL 6 × His monoclonal antibody). After incubation on ice for 30 min with occasional mixing, the cells were collected, washed twice, and then resuspended in 1 × PBS, 1 mg/mL BSA, and 5 μL anti-mouse IgG conjugated with fluorescein isothiocyanate (FITC). After incubation on ice for 30 min in the dark and invert the tube occasionally (every 5 min), the cells were washed three times and resuspended in 50 μL of PBS. Then the cell was observed under the fluorescence microscope and photographed. For EBY100/pESC-leu-levU-FLO1 use the c-Myc monoclonal antibody and IgG-AMCA as the primary and secondary antibody, respectively.
3.5. Enzyme Activity Assay of Levansucrase
The levansucrase activity of whole-cell was detected in 50 mmol/L citric acid phosphate buffer at 30 °C with 10% sucrose as substrate. The induced whole-cells were collected, washed and suspended in citric acid phosphate buffer (pH 6.0, OD600 2.0). Then 1 mL of whole-cell pellet was added into the reaction mixture. After incubation for 40 min, the supernatant was separated by centrifugation (10,000 rpm, 4 °C, 10 min) and the supernatant was boiled for 5 min. The concentration of reducing sugar was measured by the DNS method, the empty EBY100 strain was used as control. One unit of levansucrase (U) is defined as the amount of enzyme that releases 1 µmol reducing sugars from sucrose per minute.
3.6. Characterization of Surface Displayed Levansucrases
To determine the optimal temperature of the levansucrase, the activity was measured at various temperatures ranging from 10 °C to 45 °C in a citric acid phosphate buffer (50 mmol/L, pH 6.0). Levansucrase thermal stability was estimated by pre-incubating the cells containing surface displayed forms of levansucrase, or free levansucrase in citric acid phosphate buffer (50 mmol/L, pH 6.0) at 50 °C for 180 min. Residual levansucrase activity was assayed under standard assay conditions. Levansucrase activity was studied in citric acid phosphate buffer (50 mmol/L, pH 3.0–7.5) at the optimal temperature to determine its optimal pH. The maximum activity of the enzyme was normalized as 100%.
The effect of different metal ions on the enzyme activity was measured under standard assay conditions by using different metal salts in citric acid phosphate buffer (50 mmol/L, pH 6.0). The metal ions in the form of NaCl, KCl, CaCl2, FeSO4, MgSO4, ZnSO4 and CuSO4 were used at a final concentration of 5 mmol/L. The reaction system was incubated at the optimal conditions for 1 h. The enzyme activity in the absence of the metal ions was considered as 100%.
To investigate the reusability of the displayed levansucrase, the enzyme activity of the first reaction was detected. The yeast cells were collected and washed with 50 mmol/L citric acid phosphate buffer (pH 6.0) with centrifugation after the first reaction. The cells obtained were again applied for the second reaction and so on. The initial activity of the displayed levansucrase was defined as 100%.
3.7. Levan Synthesis
Enzymatic synthesis reaction was carried out by using a 20 mL reaction mixture containing 400 g/L sucrose prepared with 50 mmol/L citric acid phosphate buffer (pH 6.0) and 5 mL displayed levansucrase and incubated at 35 °C for 24 h in a shaking water bath. The reaction mixture was centrifuged (6000 rpm, 4 °C, 10 min) to remove yeast cells, then three volumes of anhydrous ethanol were added to the supernatant, mixed thoroughly, and kept overnight at 4 °C. The precipitate was collected by centrifugation (12,000 rpm, 4 °C, 15 min), washed twice with 80% ethanol, re-dissolved in water and then lyophilized to constant weight.
Sucrose concentrations from 100 to 500 g/L were used to optimize the substrate concentration. Others were the same as the initial reaction conditions. To determine the optimal reaction time for levan synthesis, different incubation periods were used.
3.8. Molecular Weight Measurement
The molecular weight and molecular weight distribution of levan were estimated by Waters 2695 GPC system with Ultrahydrogel™ Linear size exclusion columns (300 mm × 7.8 mm, 2 μm) and refractive index detector (Waters, Milford, MA, USA). Solutions of the levan samples (5 mg/mL) were filtered using F&H membrane filter (0.45 μm) and injected to the column through 20 μL loop. Samples were analyzed in the GPC columns at 45 °C with 0.9 mL/min of 0.1 mol/L sodium nitrate as mobile phase. The molecular weight was calculated based on the data processed by Empower software (Waters, Milford, MA, USA).
4. Conclusions
We successfully displayed Z. mobilis levansucrase on the surface of S. cerevisiae using a-agglutinin and Flo1p as the anchoring motifs. These two displaying systems can also enhance the thermostability of levansucrase and reduce the inhibitory effect of metal ions, and they could retain 50% of the original activity after six times of reuse. Moreover, the displayed levansucrase in the Flo1p system produced 34 g/L low-molecular-weight levan with average Mw of 610 kDa, and the one in a-agglutinin system produced 26 g/L low-molecular-weight levan with average Mw of 690 kDa. Furthermore, the homogeneity of the levan produced by Flo1p system had improved and the content of FOS greatly decreased. So, our findings offer a possibility for producing low-molecular-weight levan, which are preferable as alternative prebiotics to the oligosaccharides.
Author Contributions
Conceptualization, H.S., H.X. and Y.C.; methodology, H.S. and H.X.; validation, D.Y.; formal analysis, H.S. and D.Y.; investigation, H.S. and D.Y.; resources, D.Q., H.X. and Y.C.; data curation, H.S.; writing—original draft preparation, H.S.; writing—review and editing, H.S., H.X. and Y.C.; visualization, H.S. and D.Y.; supervision, D.Q., H.X. and Y.C.; project administration, Y.C.; funding acquisition, D.Q., H.X. and Y.C. All authors have read and agreed to the published version of the manuscript.
Funding
This work was supported by National Natural Science Foundation of China (No. 32071479); Fundamental Research Funds for the Central Universities (No.2018SCUH0072); Sichuan Science and Technology Program (2019YJ0117, 2020YJ0304, 2020YFH0076, 2020YJ0305). Chengdu Science and Technology Program (2019-YF05-02317-SN).
Conflicts of Interest
The authors declare no conflict of interest.
References
- Smeekens, J.C.M.; Ebskamp, M.J.M.; Weisbeek, P.J. Method for Obtaining Transgenic Plants Showing a Modified Fructan Pattern. U.S. Patent US5986173A, 16 November 1999. [Google Scholar]
- Nadzir, M.M.; Nurhayati, R.W.; Idris, F.N.; Nguyen, M.H. Biomedical Applications of Bacterial Exopolysaccharides: A Review. Polymers 2021, 13, 530. [Google Scholar] [CrossRef] [PubMed]
- Srikanth, R.; Reddy, C.H.; Siddartha, G.; Ramaiah, M.J.; Uppuluri, K.B. Review on production, characterization and applications of microbial levan. Carbohydr. Polym. 2015, 120, 102–114. [Google Scholar] [CrossRef] [PubMed]
- Li, W.; Yu, S.; Zhang, T.; Jiang, B.; Mu, W. Recent novel applications of levansucrases. Appl. Microbiol. Biotechnol. 2015, 99, 6959–6969. [Google Scholar] [CrossRef] [PubMed]
- Jang, K.H.; Song, K.B.; Park, B.S. Levan production by use of the recombinant levansucrase immobilized on titanium-activated magnetite. Process. Biochem. 2001, 37, 339–343. [Google Scholar] [CrossRef]
- Chambert, R.; Petit-Glatron, M.F. Immobilisation of levansucrase on calcium phosphate gel strongly increases its polymerase activity. Carbohydr. Res. 1993, 244, 129–136. [Google Scholar] [CrossRef]
- Iizuka, M.; Yamaguchi, H.; Ono, S.; Minamiura, N. Production and Isolation of Levan by Use of Levansucrase Immobilized on the Ceramic Support SM-10. Biosci. Biotechnol. Biochem. 1993, 57, 322–324. [Google Scholar] [CrossRef]
- Chiang, C.J.; Wang, J.Y.; Chen, P.T.; Chao, Y.P. Enhanced levan production using chitin-binding domain fused levansucrase immobilized on chitin beads. Appl. Microbiol. Biotechnol. 2009, 82, 445–451. [Google Scholar] [CrossRef]
- Lozani, M.; Hossain, A.S.; Mra, V.; Te Pari, R. Surface Display—An Alternative to Classic Enzyme Immobilization. Catalysts 2019, 9, 728. [Google Scholar] [CrossRef]
- Chung, C.-F.; Lin, S.-C.; Juang, T.-Y.; Liu, Y.-C. Shaking Rate during Production Affects the Activity of Escherichia coli Surface-Displayed Candida antarctica Lipase A. Catalysts 2020, 10, 382. [Google Scholar] [CrossRef]
- Kim, D.; Ku, S. Bacillus Cellulase Molecular Cloning, Expression, and Surface Display on the Outer Membrane of Escherichia coli. Molecules 2018, 23, 503. [Google Scholar] [CrossRef]
- Fujita, Y.; Katahira, S.; Ueda, M.; Tanaka, A.; Okada, H.; Morikawa, Y.; Fukuda, H.; Kondo, A. Construction of whole-cell biocatalyst for xylan degradation through cell-surface xylanase display in Saccharomyces cerevisiae. J. Mol. Catal. B Enzym. 2002, 17, 189–195. [Google Scholar] [CrossRef]
- Wang, J.K.; He, B.; Du, W.; Luo, Y.; Yu, Z.; Liu, J.X. Yeast with surface displayed xylanase as a new dual purpose delivery vehicle of xylanase and yeast. Anim. Feed. Sci. Technol. 2015, 208, 44–52. [Google Scholar] [CrossRef]
- Yang, X.; Zhang, Y.; Pang, H.; Yuan, S.; Wang, X.; Hu, Z.; Zhou, Q.; He, Y.; Yan, Y.; Xu, L. Codisplay of Rhizopus oryzae and Candida rugosa Lipases for Biodiesel Production. Catalysts 2021, 11, 421. [Google Scholar] [CrossRef]
- Zhang, L.; An, J.; Li, L.; Wang, H.; Liu, D.; Li, N.; Cheng, H.; Deng, Z. Highly Efficient Fructooligosaccharides Production by an Erythritol-Producing Yeast Yarrowia lipolytica Displaying Fructosyltransferase. J. Agric. Food Chem. 2016, 64, 3828–3837. [Google Scholar] [CrossRef]
- Jung, H.C.; Lebeault, J.M.; Pan, J.G. Surface display of Zymomonas mobilis levansucrase by using the ice-nucleation protein of Pseudomonas syringae. Nat. Biotechnol. 1998, 16, 576–580. [Google Scholar] [CrossRef]
- Bo, Y.B.; Lee, S.J.; Mah, J.H. Antipathogenic activity and preservative effect of levan (β-2,6-fructan), a multifunctional polysaccharide. Int. J. Food Sci. Technol. 2014, 49, 238–245. [Google Scholar]
- Benigar, E.; Dogsa, I.; Stopar, D.; Jamnik, A.; Kralj Cigic, I.; Tomsic, M. Structure and dynamics of a polysaccharide matrix: Aqueous solutions of bacterial levan. Langmuir 2014, 30, 4172–4182. [Google Scholar] [CrossRef]
- Hundschell, C.S.; Jakob, F.; Wagemans, A.M. Molecular weight dependent structure of the exopolysaccharide levan. Int. J. Biol. Macromol. 2020, 161, 398–405. [Google Scholar] [CrossRef]
- Liu, C.; Kolida, S.; Charalampopoulos, D.; Rastall, R.A. An evaluation of the prebiotic potential of microbial levans from Erwinia sp. 10119. J. Funct. Foods 2019, 64, 103668. [Google Scholar] [CrossRef]
- Porras-Dominguez, J.R.; Avila-Fernandez, A.; Miranda-Molina, A.; Rodriguez-Alegria, M.E.; Munguia, A.L. Bacillus subtilis 168 levansucrase (SacB) activity affects average levan molecular weight. Carbohydr. Polym. 2015, 132, 338–344. [Google Scholar] [CrossRef]
- Hou, Y.; Huang, F.; Yang, H.; Cong, H.; Zhang, X.; Xie, X.; Yang, H.; Tong, Q.; Luo, N.; Zhu, P. Factors affecting the production and molecular weight of levan in enzymatic synthesis by recombinant Bacillus subtilis levansucrase SacB-T305A. Polym. Int. 2020, 70, 185–192. [Google Scholar] [CrossRef]
- Jang, K.H.; Song, K.B.; Kim, C.H.; Chung, B.H.; Kang, S.A.; Chun, U.H.; Choue, R.W.; Rhee, S.K. Comparison of characteristics of levan produced by different preparations of levansucrase from Zymomonas mobilis. Biotechnol. Lett. 2001, 23, 339–344. [Google Scholar] [CrossRef]
- Santos-Moriano, P.; Monsalve-Ledesma, L.; Ortega-Mu?Oz, M.; Fernandez-Arrojo, L.; Ballesteros, A.O.; Santoyo-Gonzalez, F.; Plou, F.J. Vinyl sulfone-activated silica for efficient covalent immobilization of alkaline unstable enzymes: Application to levansucrase for fructooligosaccharide synthesis. RSC Adv. 2016, 6, 64175–64181. [Google Scholar] [CrossRef]
- Song, K.B.; Joo, H.K.; Rhee, S.K. Nucleotide sequence of levansucrase gene (levU) of Zymomonas mobilis ZM1 (ATCC10988). Biochim. Biophys. Acta 1993, 1173, 320–324. [Google Scholar] [CrossRef]
- Wen, S.; Mao, T.; Yao, D.; Li, T.; Wang, F. Yeast Surface Display of Antheraea pernyi Lysozyme Revealed α-Helical Antibacterial Peptides in Its N-Terminal Domain. J. Agric. Food Chem. 2018, 66, 9138–9146. [Google Scholar] [CrossRef]
- Oner, E.T.; Hernandez, L.; Combie, J. Review of Levan polysaccharide: From a century of past experiences to future prospects. Biotechnol. Adv. 2016, 34, 827–844. [Google Scholar] [CrossRef]
- Goldman, D.; Lavid, N.; Schwartz, A.; Shoham, G.; Danino, D.; Shoham, Y. Two active forms of Zymomonas mobilis levansucrase. An ordered microfibril structure of the enzyme promotes levan polymerization. J. Biol. Chem. 2008, 283, 32209. [Google Scholar] [CrossRef]
- Chevalier, P.M.; Rupp, R.A. Inhibition of Sucrose: Sucrose Fructosyl Transferase by Cations and Ionic Strength. Plant Physiol. 1993, 101, 589–594. [Google Scholar] [CrossRef][Green Version]
- Hill, A.; Chen, L.; Mariage, A.; Petit, J.L.; Berardinis, V.D.; Karboune, S. Discovery of new levansucrase enzymes with interesting properties and improved catalytic activity to produce levan and fructooligosaccharides. Catal. Sci. Technol. 2019, 9, 2931–2944. [Google Scholar] [CrossRef]
- Ko, H.; Bae, J.H.; Sung, B.H.; Kim, M.J.; Sohn, J.H. Efficient production of levan using a recombinant yeast Saccharomyces cerevisiae hypersecreting a bacterial levansucrase. J. Ind. Microbiol. Biotechnol. 2019, 46, 1611–1620. [Google Scholar] [CrossRef]
- Xavier, J.R.; Ramana, K.V. Optimization of Levan Production by Cold-Active Bacillus licheniformis ANT 179 and Fructooligosaccharide Synthesis by Its Levansucrase. Appl. Biochem. Biotechnol. 2017, 181, 986–1006. [Google Scholar] [CrossRef]
- Hvels, M.; Kosciow, K.; Kniewel, J.; Jakob, F.; Deppenmeier, U. High yield production of levan-type fructans by Gluconobacter japonicus LMG 1417. Int. J. Biol. Macromol. 2020, 164, 295–303. [Google Scholar] [CrossRef]
- van Hijum, S.A.; Szalowska, E.; van der Maarel, M.J.; Dijkhuizen, L. Biochemical and molecular characterization of a levansucrase from Lactobacillus reuteri. Microbiology 2004, 150, 621–630. [Google Scholar] [CrossRef]
- Liu, Q.; Yu, S.; Zhang, T.; Jiang, B.; Mu, W. Efficient biosynthesis of levan from sucrose by a novel levansucrase from Brenneria goodwinii. Carbohydr. Polym. 2017, 157, 1732–1740. [Google Scholar] [CrossRef]
- Khudair, A.Y.; Salman, J.; Ajah, H.A. Production of levan from locally leuconostoc mesensteroides isolates. J. Pharm. Sci. Res. 2018, 10, 3372–3378. [Google Scholar]
- Gmt, C.; Lima, R.C.; de França, F.P.; Lopes, C.E. Molecular weight and antitumour activity of Zymomonas mobilis levans. Int. J. Biol. Macromol. 2000, 27, 245. [Google Scholar]
- Ortizsoto, M.E.; Rivera, M.; Rudiñopiñera, E.; Olvera, C.; Lópezmunguía, A. Selected mutations in Bacillus subtilis levansucrase semi-conserved regions affecting its biochemical properties. Protein Eng. Des. Sel. 2008, 21, 589. [Google Scholar] [CrossRef]
- Dyatlov, V.A.; Kruppa, I.S.; Mamaeva, S.A.; Kireev , V.V. Change of Polysaccharide Molecular-Weight Distribution and Fraction Homogeneity After Periodate Oxidation. Chem. Nat. Compd. 2014, 50, 973–977. [Google Scholar]
- Marx, S.P.; Winkler, S.; Hartmeier, W. Metabolization of beta-(2,6)-linked fructose-oligosaccharides by different bifidobacteria. FEMS Microbiol. Lett. 2000, 182, 163–169. [Google Scholar]
- Gietz, D.; Jean, A.S.; Woods, R.A.; Schiestl, R.H. Improved method for high efficiency transformation of intact yeast cells. Nucleic Acids Res. 1992, 20, 1425. [Google Scholar] [CrossRef]
Publisher’s Note: MDPI stays neutral with regard to jurisdictional claims in published maps and institutional affiliations. |
© 2021 by the authors. Licensee MDPI, Basel, Switzerland. This article is an open access article distributed under the terms and conditions of the Creative Commons Attribution (CC BY) license (https://creativecommons.org/licenses/by/4.0/).