Article

Hexavalent Chromium Removal via Photoreduction by Sunlight on Titanium–Dioxide Nanotubes Formed by Anodization with a Fluorinated Glycerol–Water Electrolyte

1
Green Electronic Nanomaterials Group, School of Materials and Mineral Resources Engineering, Engineering Campus, Universiti Sains Malaysia, Nibong Tebal 14300, Penang, Malaysia
2
Faculty of Applied Sciences, Universiti Teknologi MARA Cawangan Pulau Pinang, Permatang Pauh Campus, Permatang Pauh 13500, Penang, Malaysia
3
Faculty of Chemical Engineering Technology, Kompleks Pusat Pengajian Jejawi 2, Universiti Malaysia Perlis, Taman Muhibbah, Jejawi 02600, Arau, Perlis, Malaysia
4
Carbon Research Technology Group, Faculty of Manufacturing Engineering, Universiti Teknikal Malaysia Melaka, Durian Tunggal 76100, Malacca, Malaysia
5
Institute of Liberal Arts and Sciences, Toyohashi University of Technology, Toyohashi 441-8580, Aichi, Japan
6
Department of Electrical and Electronic Information Engineering, Toyohashi University of Technology, Toyohashi 441-8580, Aichi, Japan
*
Authors to whom correspondence should be addressed.
Catalysts 2021, 11(3), 376; https://doi.org/10.3390/catal11030376
Submission received: 14 February 2021 / Revised: 9 March 2021 / Accepted: 10 March 2021 / Published: 13 March 2021
(This article belongs to the Special Issue Advances in Photocatalytic Wastewater Purification)

Abstract

:
In this paper, titanium–dioxide (TiO2) nanotubes (TNTs) are formed by anodic oxidation with a fluorinated glycerol–water (85% and 15%, respectively) electrolyte to examine the effect of fluoride ion concentration, time, and applied voltage on TNT morphologies and dimensions. For fluoride ion concentration, the surface etching increases when the amount of ammonium fluoride added to the electrolyte solution increases, forming nanotube arrays with a clear pore structure. At a constant voltage of 20 V, TNTs with an average length of ~2 µm are obtained after anodization for 180 min. A prolonged anodization time only results in a marginal length increment. The TNT diameter is voltage dependent and increases from approximately 30 nm at 10 V to 310 nm at 60 V. At 80 V, the structure is destroyed. TNTs formed at 20 V for 180 min are annealed to induce the TiO2 anatase phase in either air or nitrogen. When ethylenediaminetetraacetic acid is added as a hole scavenger, 100% hexavalent chromium removal is obtained after 120 min of sunlight exposure for nitrogen-annealed TNTs.

1. Introduction

In recent years, the application of TiO2 as a photocatalyst to reduce heavy metals such as hexavalent chromium [Cr(VI)] has gained academic attention. Cr(VI) is used in several industrial processes, including chrome plating, stainless steel manufacturing, chrome pigment formation, and leather tanning. Among these, chrome plating is responsible for producing large amounts of wastewater containing Cr(VI) ions. Fortunately, Cr(VI) compounds can be eliminated from industrial wastewater by chemical precipitation, flotation, adsorption, ion exchange, and electrochemical deposition [1].
The reduction of Cr(VI) to chromium [Cr(III)] is also conducted to treat Cr(VI)-laden wastewater by photocatalysis [2]. This process is beneficial because, whereas Cr(VI) is mobile, corrosive, and toxic to humans, Cr(III) is non-toxic and an essential dietary element. Industrial activities such as metal finishing and chrome plating produce wastewater with large amounts of Cr(VI), which can contaminate water bodies and soil. The uptake of Cr(VI) in plants from Cr(VI)-contaminated soil was reviewed by Shahid et al. in 2017 [3], and the existence of Cr(VI) in rice was reported by Rudzi et al. in 2018 [4]. Preventing Cr(VI) from contaminating the environment can be achieved by properly removing the ions from their discharge point. As mentioned, Cr(VI) can be reduced to Cr(III) by photocatalysis process. This process requires a photocatalyst, such as titanium dioxide (TiO2), which is very effective due to the negative position of the conduction-band electrons that can reduce Cr(VI) to Cr(III).
TiO2 nanotubes (TNTs) can be synthesized by template-assisted deposition [5,6], hydrothermal treatment [7,8], atomic layer deposition [3,9], sol–gel treatment [10,11], and titanium (Ti) anodization [12,13,14,15,16,17,18,19,20,21,22]. Of these methods, anodization is preferred because of its feasibility, cost-effectiveness, and robustness. More importantly, anodization also enables the formation of self-aligned TNT arrays [23]. In the anodization process, the electrolyte is an essential parameter with respect to controlling the morphological features of the anodic film. For nanotubular formation, a presence of fluoride ions has been identified as the most important parameter.
Zwilling and co-workers [13] fabricated highly ordered porous anodic TiO2 films in chromic acid containing hydrofluoric acid. This so-called first-generation electrolyte resulted in short TNTs (~500 nm) due to excessive etching. This was followed by the development of a second-generation electrolyte, i.e., a buffered solution containing sodium fluoride or ammonium fluoride (NH4F), which produces TNTs longer than 5 μm [24]. Even longer TNTs (>10 μm) have been formed using third-generation organic fluoride electrolytes, such as ethylene glycol, glycerol, and formamide. However, organic electrolytes require oxygen species for stable oxide growth [25,26,27,28,29,30,31]; water is commonly added as the oxygen provider. Recent research has reported the use of alkaline species for electrolytes to obtain even longer TNT formation, such as potassium hydroxide, lithium hydroxide, and sodium hydroxide [32,33,34,35,36,37,38]. The use of hydrogen peroxide has also been explored, and TNTs with a grassy surface structure have been reported [39].
In this work, TNTs are produced by Ti anodization in glycerol–water electrolyte. Anodic film grew in glycerol–water electrolyte was examined, including the success of self-aligned TNTs formation, by varying NH4F content, time, and anodization voltage. To the best of our knowledge, research on TNTs formation with the electrolyte in question is lacking, especially with respect to using photocatalysts for Cr(VI) reduction in synthetic wastewater. In fact, there is a complete lack of work reporting on the use of highly serrated TNTs for Cr(VI) reduction under sunlight. The formation TNTs with serrated walls, could increase the surface area for more catalytic sites that can enhance reactions. Long TNTs with a clear surface opening are also preferred for the catalytic process to take advantage of both the interior and the exterior of the nanotubes.
TiO2 is a wide-bandgap semiconductor, and, therefore, electron–hole pair generation is only possible under ultraviolet (UV) radiation. However, sunlight activation can be achieved by the mid-gap states induced by the defects created when TNTs are heat-treated in a reduced atmosphere or in a nitrogen-containing environment. In this paper, the formed TNTs are annealed in nitrogen, and their ability to reduce Cr(VI) via photoreduction to Cr(III) is reported. Moreover, to ensure an effective reduction process, ethylenediaminetetraacetic acid (EDTA) was used as a hole scavenger. This is necessary, as a hole scavenger can suppress the recombination of electron–hole pairs, hence the increased in the number of free electrons available for Cr(VI) reduction.

2. Results and Discussion

2.1. Anodic Oxide Features on Titanium Anodized in Water–Glycerol Electrolyte

2.1.1. Effect of NH4F Concentration

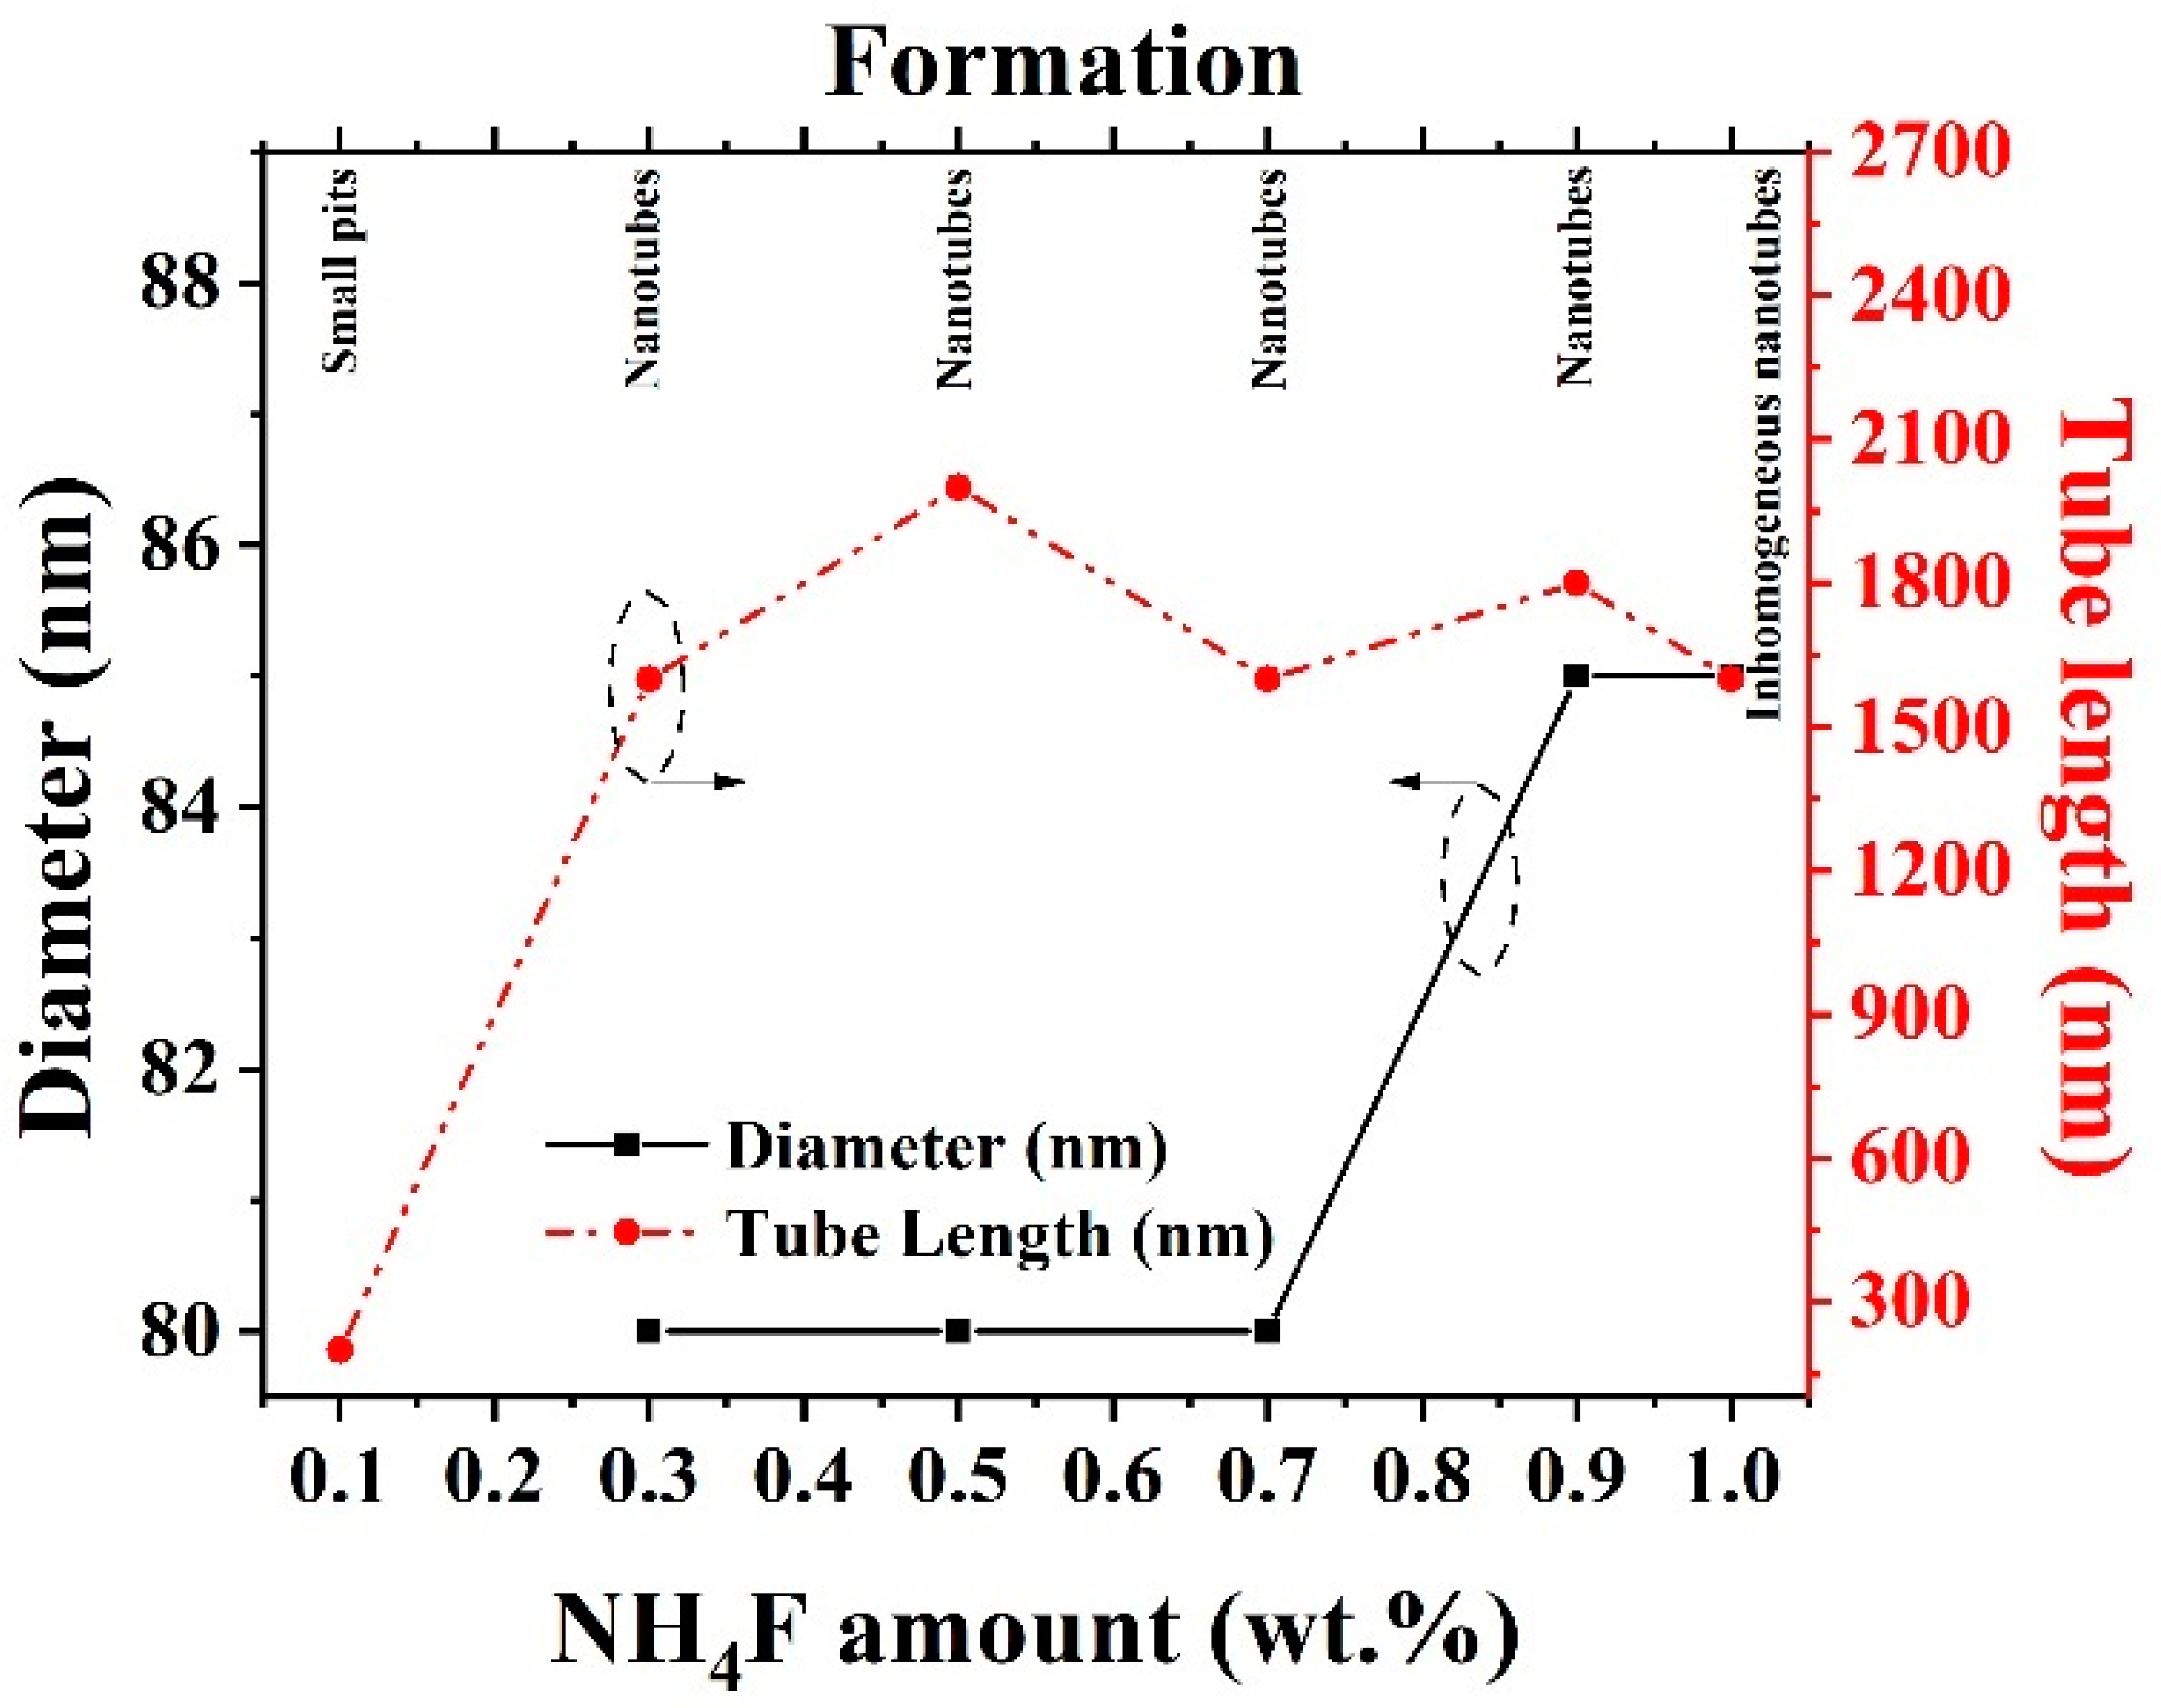
Figure 1 shows the cross-section FESEM morphologies of anodized Ti in the water–glycerol electrolyte with various amounts of NH4F; insets are the surface images of the corresponding samples. Anodization was conducted at 20 V for 90 min. From the micrographs, it is evident that the amount of NH4F added to the electrolyte influences the length and diameter of the TNTs. Figure 2 summarizes the findings, from which it is evident that, apart from the 0.1 wt.% NH4F sample, a nanotubular structure was successfully formed with the length and diameter affected by the amount of fluoride ions. The TNT length increased from 1.6 to 2.0 μm when anodized with the electrolyte containing 0.3 and 0.5 wt.% NH4F, respectively. However, higher concentrations of NH4F (>0.7 wt.%) reduced the length, which can be attributed to severe chemical dissolution at the TNTs surface due to the increased number of fluoride ions. Moreover, the TNT diameter increased, albeit marginally, with an increase in NH4F content.
The formation of TiO2 by anodic oxidation is described by Equation (1). At the initial stage of the anodization process, a barrier layer comprising defective TiO2 was formed. Pores then developed because of the chemical dissolution of the barrier layer (Equation (2)) and for discrete nanotubes formation, the pores must be separated.
T i 4 + + 2 H 2 O T i O 2 + 4 H + + 4 e
T i O 2 + 6 F + 4 H + [ T i F 6 ] 2 + 2 H 2 O
During the anodization process, ion migration across the anodic film is essential to increase the oxide thickness. The migration of fluoride ions is believed to be faster than any other inward-migrating ions, and, thus, a fluoride-rich layer (FRL) will form at the oxide–Ti interface [40]. The bottom part of the nanotubes, as seen in the cross-sectional images, is scallop-shaped, indicating a flow mechanism in the oxide pore formation. According to this mechanism, FRL will eventually be displaced as inter pore materials. Pores are separated when the FRL is dissolved by water, resulting in discrete nanotubes. At larger amounts of NH4F, a thicker FRL is thought to form around the pores, and, as the electrolyte is excess with water, the dissolution of this FRL will result in TNTs with very thin walls. As seen from the FESEM images, the sample prepared in the electrolyte with 1.0 wt.% NH4F had walls thinner than 10 nm, and the severe dissolution resulted in an inhomogeneous surface structure. From here, 0.5 wt.% NH4F was chosen as the optimum amount of fluoride ion in the electrolyte, as it is adequate for surface etching, and the nanotubes formed also had considerable length, as shown in Figure 2.

2.1.2. Effect of Anodization Voltage

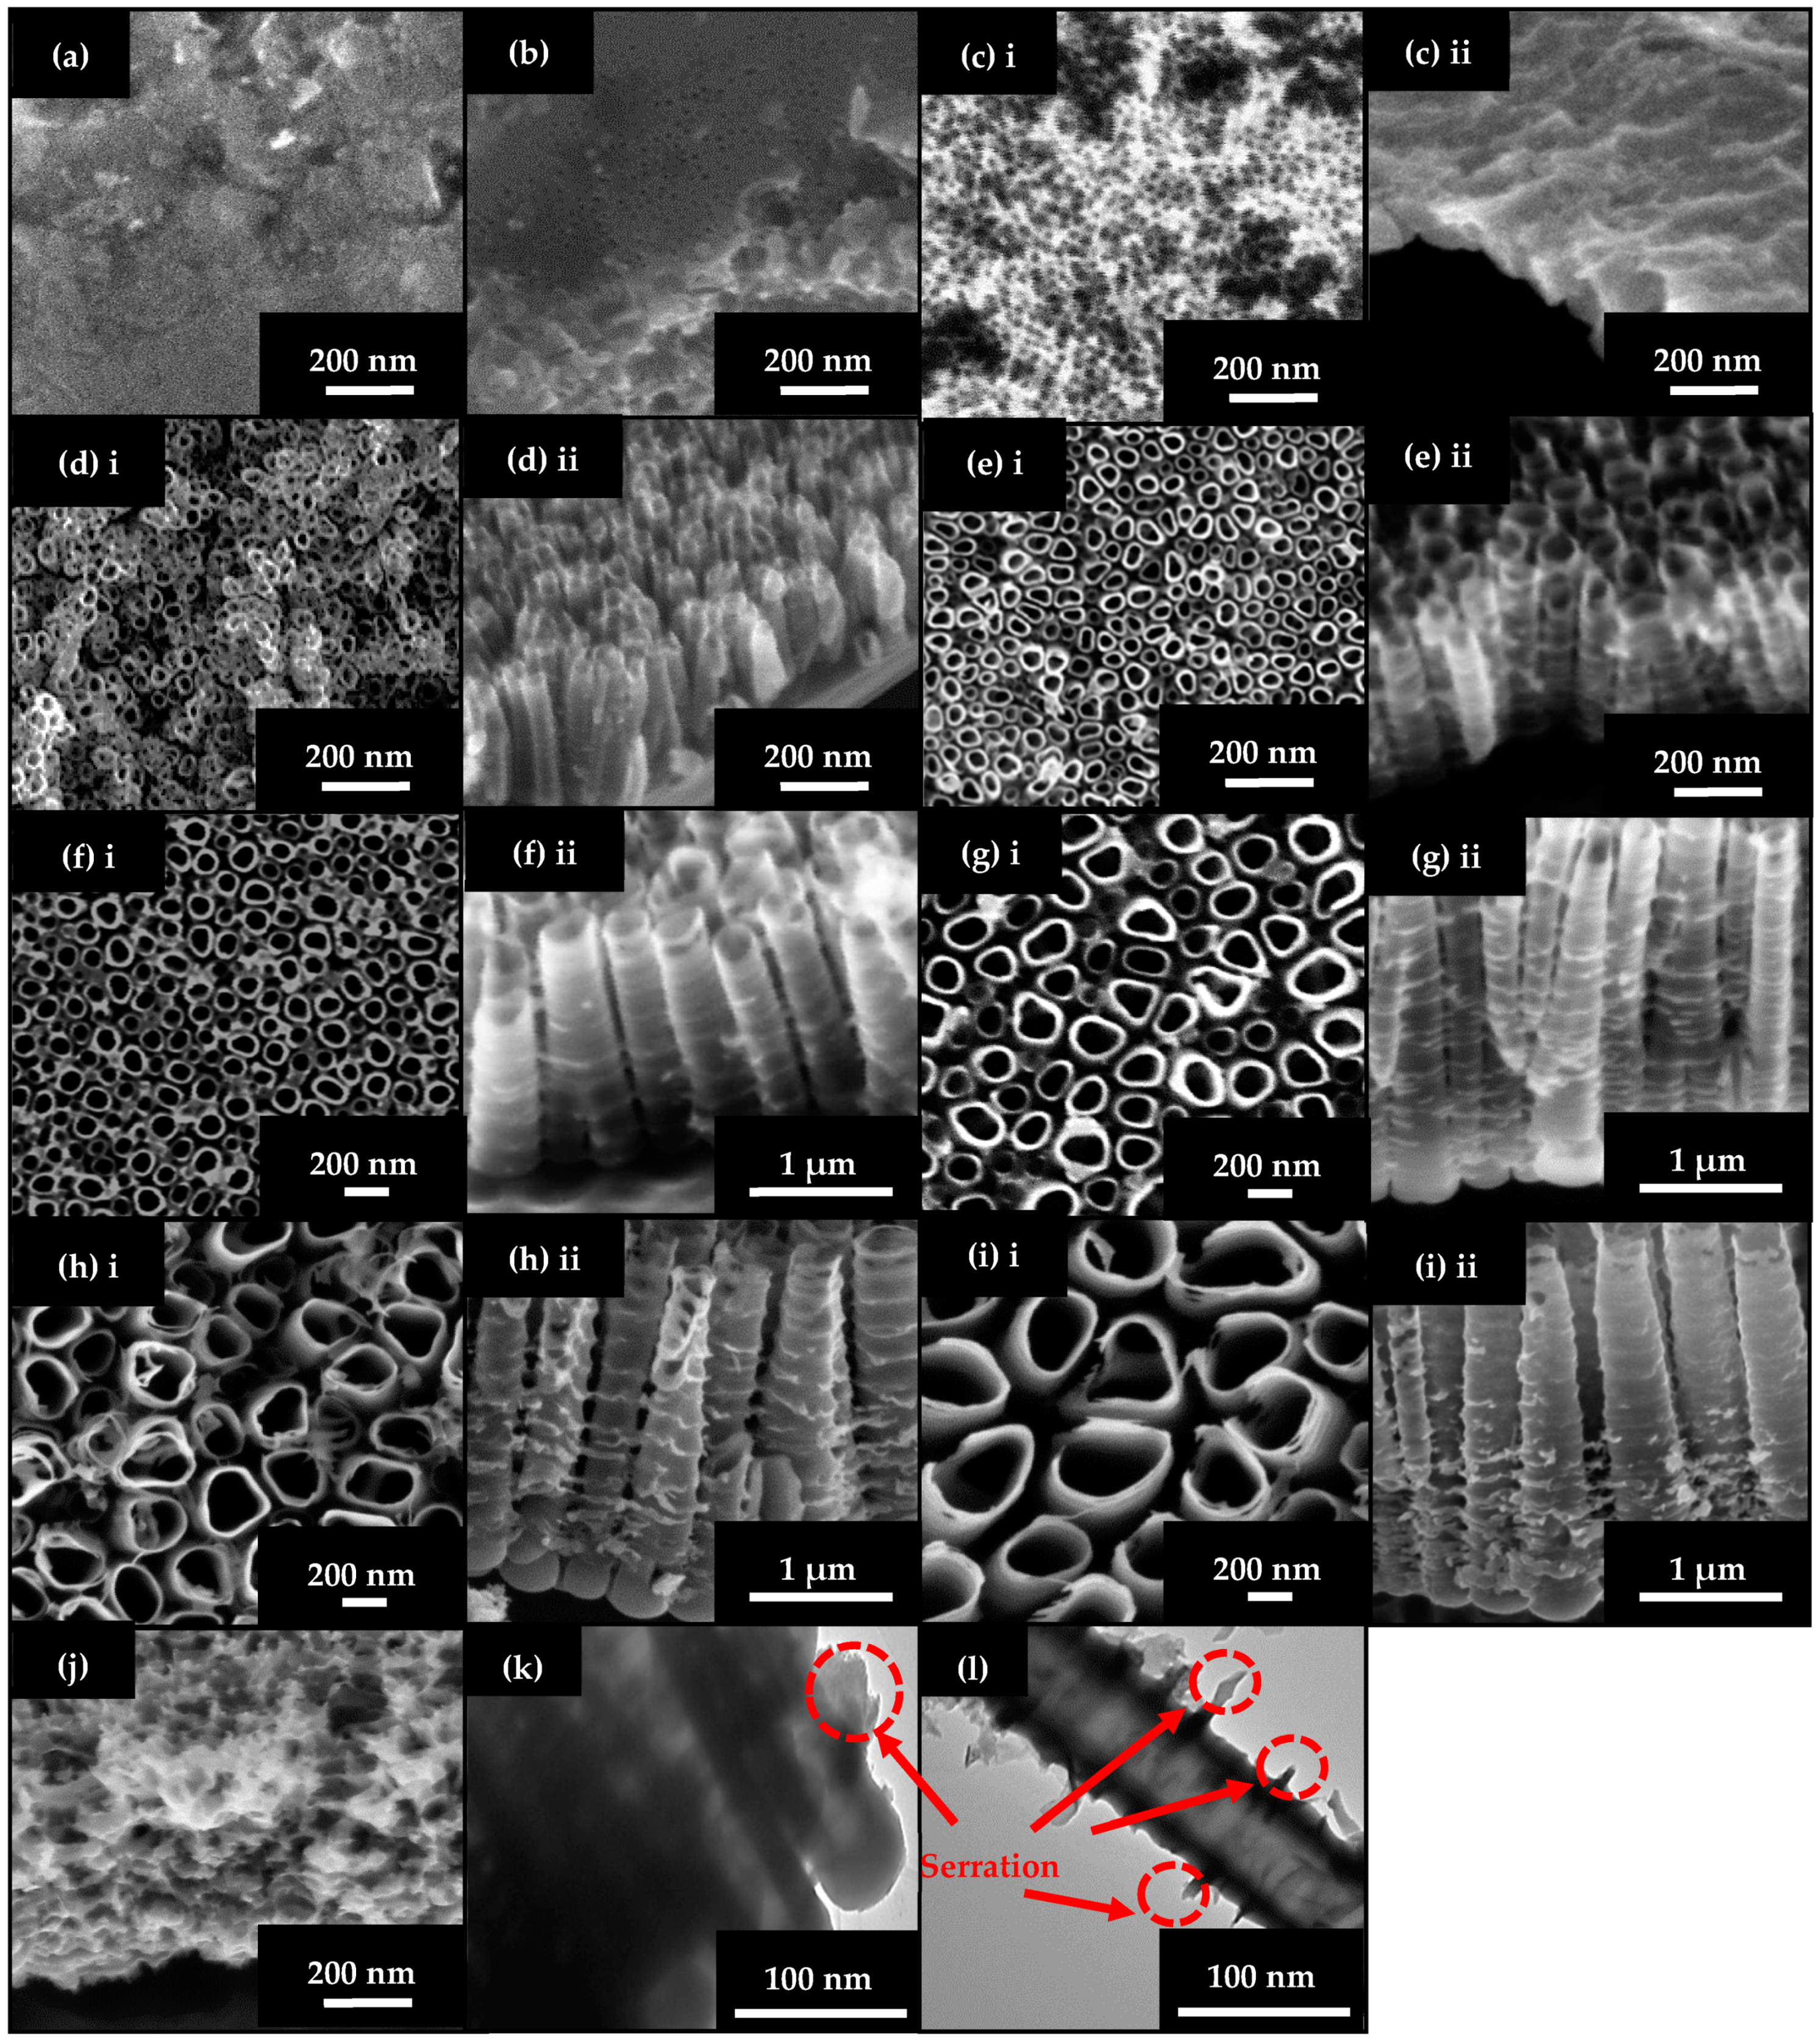
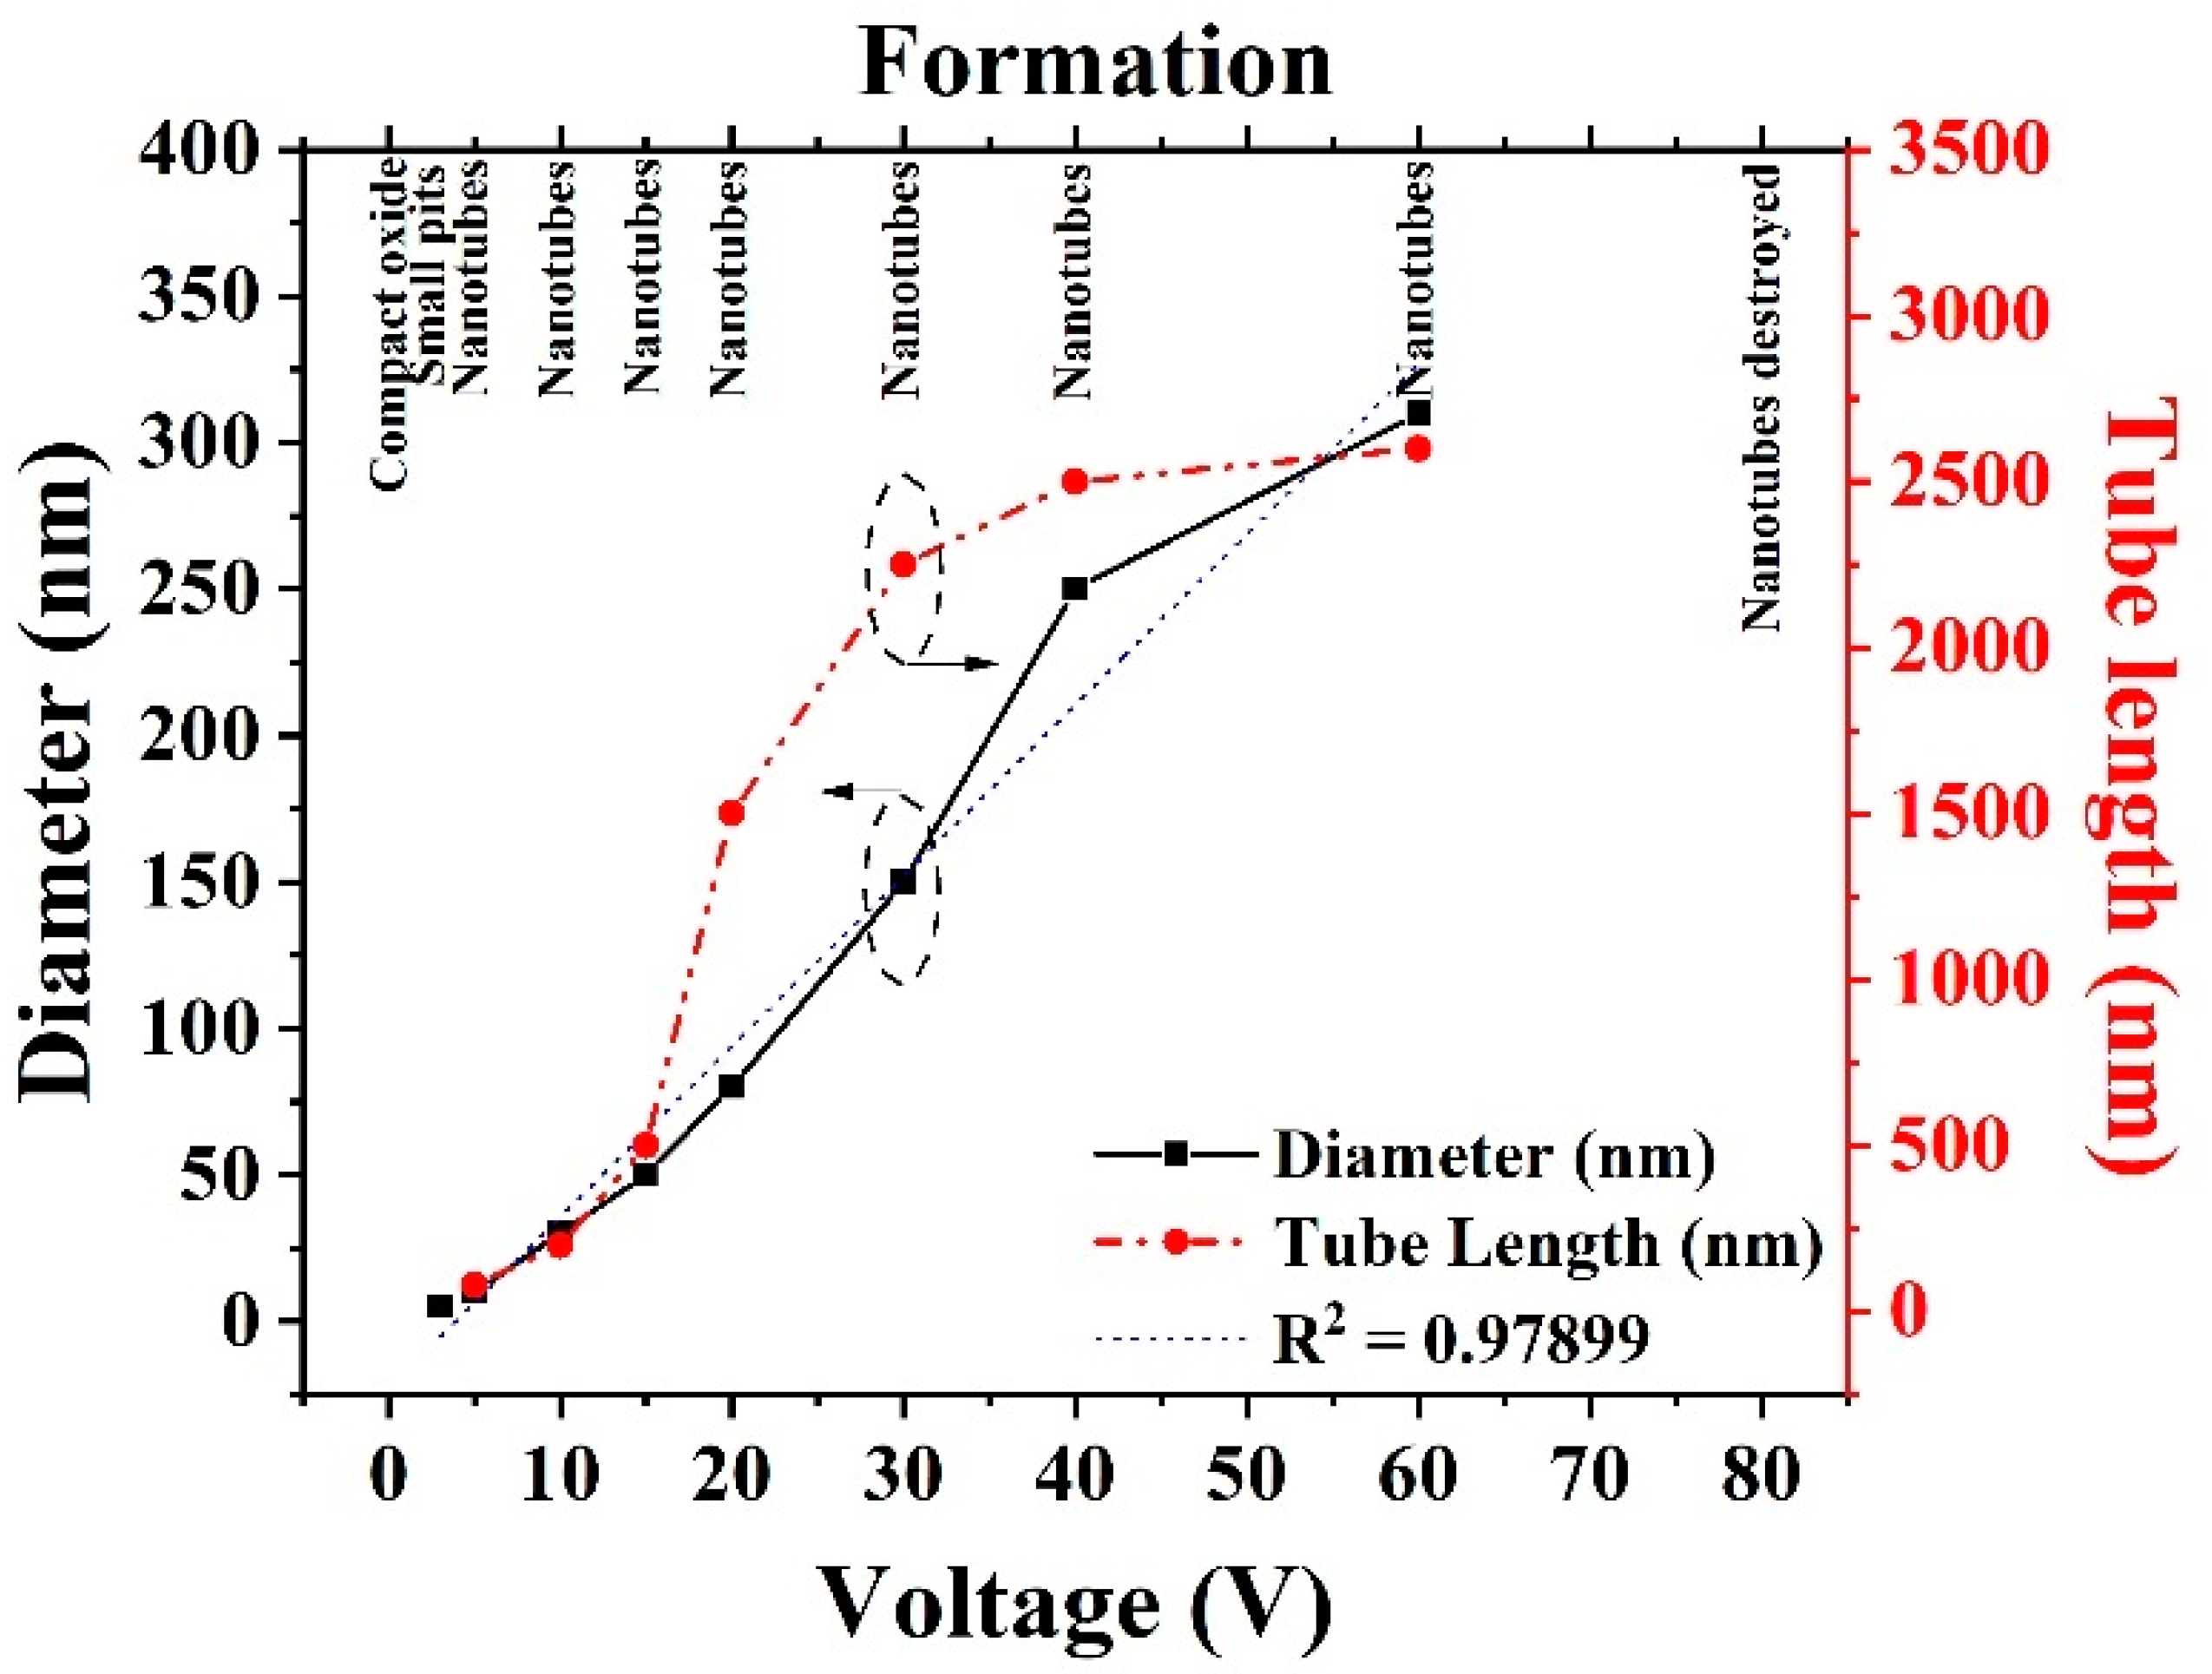
Apart from NH4F content, anodization voltage is also known to play an essential role in tuning TNT dimensions [20]: a higher anodization voltage results in a higher oxidation rate, resulting in the formation of more H + ions in the electrolyte (Equation (1)). If the number of H + ions in the electrolyte increases, chemical dissolution increases, resulting in larger and longer TNTs. Nevertheless, there is a limit to the voltage applied, as a high voltage may induce an overly rapid electric field dissolution, destroying the nanotubular structure. As reported by Lockman et al., depending on the electrolyte used, there is a threshold voltage at which the TNT structure is formed; TNTs are formed above the threshold voltage, while a lower voltage would result in insufficient electric field dissolution, generating compact anodic film or film with small pores [20]. Figure 3 shows the FESEM morphologies, whereas Figure 4 summarizes the anodic film features as a function of applied voltage. Ti anodized at 1 V has a rather compact surface oxide without any noticeable microstructure, as shown by Figure 3a. Small pits with 5–8 nm diameters can be observed in Figure 3b for the sample anodized at 3 V. Increasing the anodization voltage to 5 V results in larger pits (diameter ~10 nm) with an increased distribution, as shown in Figure 3c.
The corresponding cross-sectional FESEM image shows that the thickness of the anodic layer is approximately 80 nm. TNTs formed on the foil with an average diameter of 30 nm (Figure 3d) for the 10 V sample and 50 nm (Figure 3e) for the 15 V sample. The length of the nanotubes ranged from approximately 200 to 500 nm. The 20 V anodized sample resulted in TNTs with a length of ~1.5 µm and an outer diameter of 80 nm (Figure 3f).
As the anodization voltage was increased to 30 V, the diameter increased to 150 nm (Figure 3g); at 40 V, it increased to 250 nm (Figure 3h); however, the nanotubes length for both samples did not differ by much (~2.5 μm). Anodization at 60 V resulted in TNTs with a diameter and length of 310 nm and 2.6 μm, respectively (Figure 3i); for this electrolyte, it appears that voltage affects TNT diameter but not length. At 80 V, the nanotubular structure was destroyed (Figure 3j) due to the overaccelerated electric field dissolution causing severe polarization and weakening of the Ti-O bond, which led to the formation of an irregular porous oxide structure. Figure 3k shows the TEM image of the 20 V sample taken from the bottom part of the TNTs, demonstrating TNTs with scallop-shaped barrier layer of ∼20 nm thickness. If compared with anodic TNTs formed in ethylene glycol [32,33,34,35,36,37,38], the thickness of the barrier layer for the abovementioned sample is rather large, perhaps because of the excess water in the glycerol, which increases oxidation. In Figure 3l, a single nanotube is shown with serrated walls.

2.1.3. Effect of Variation Reaction Time

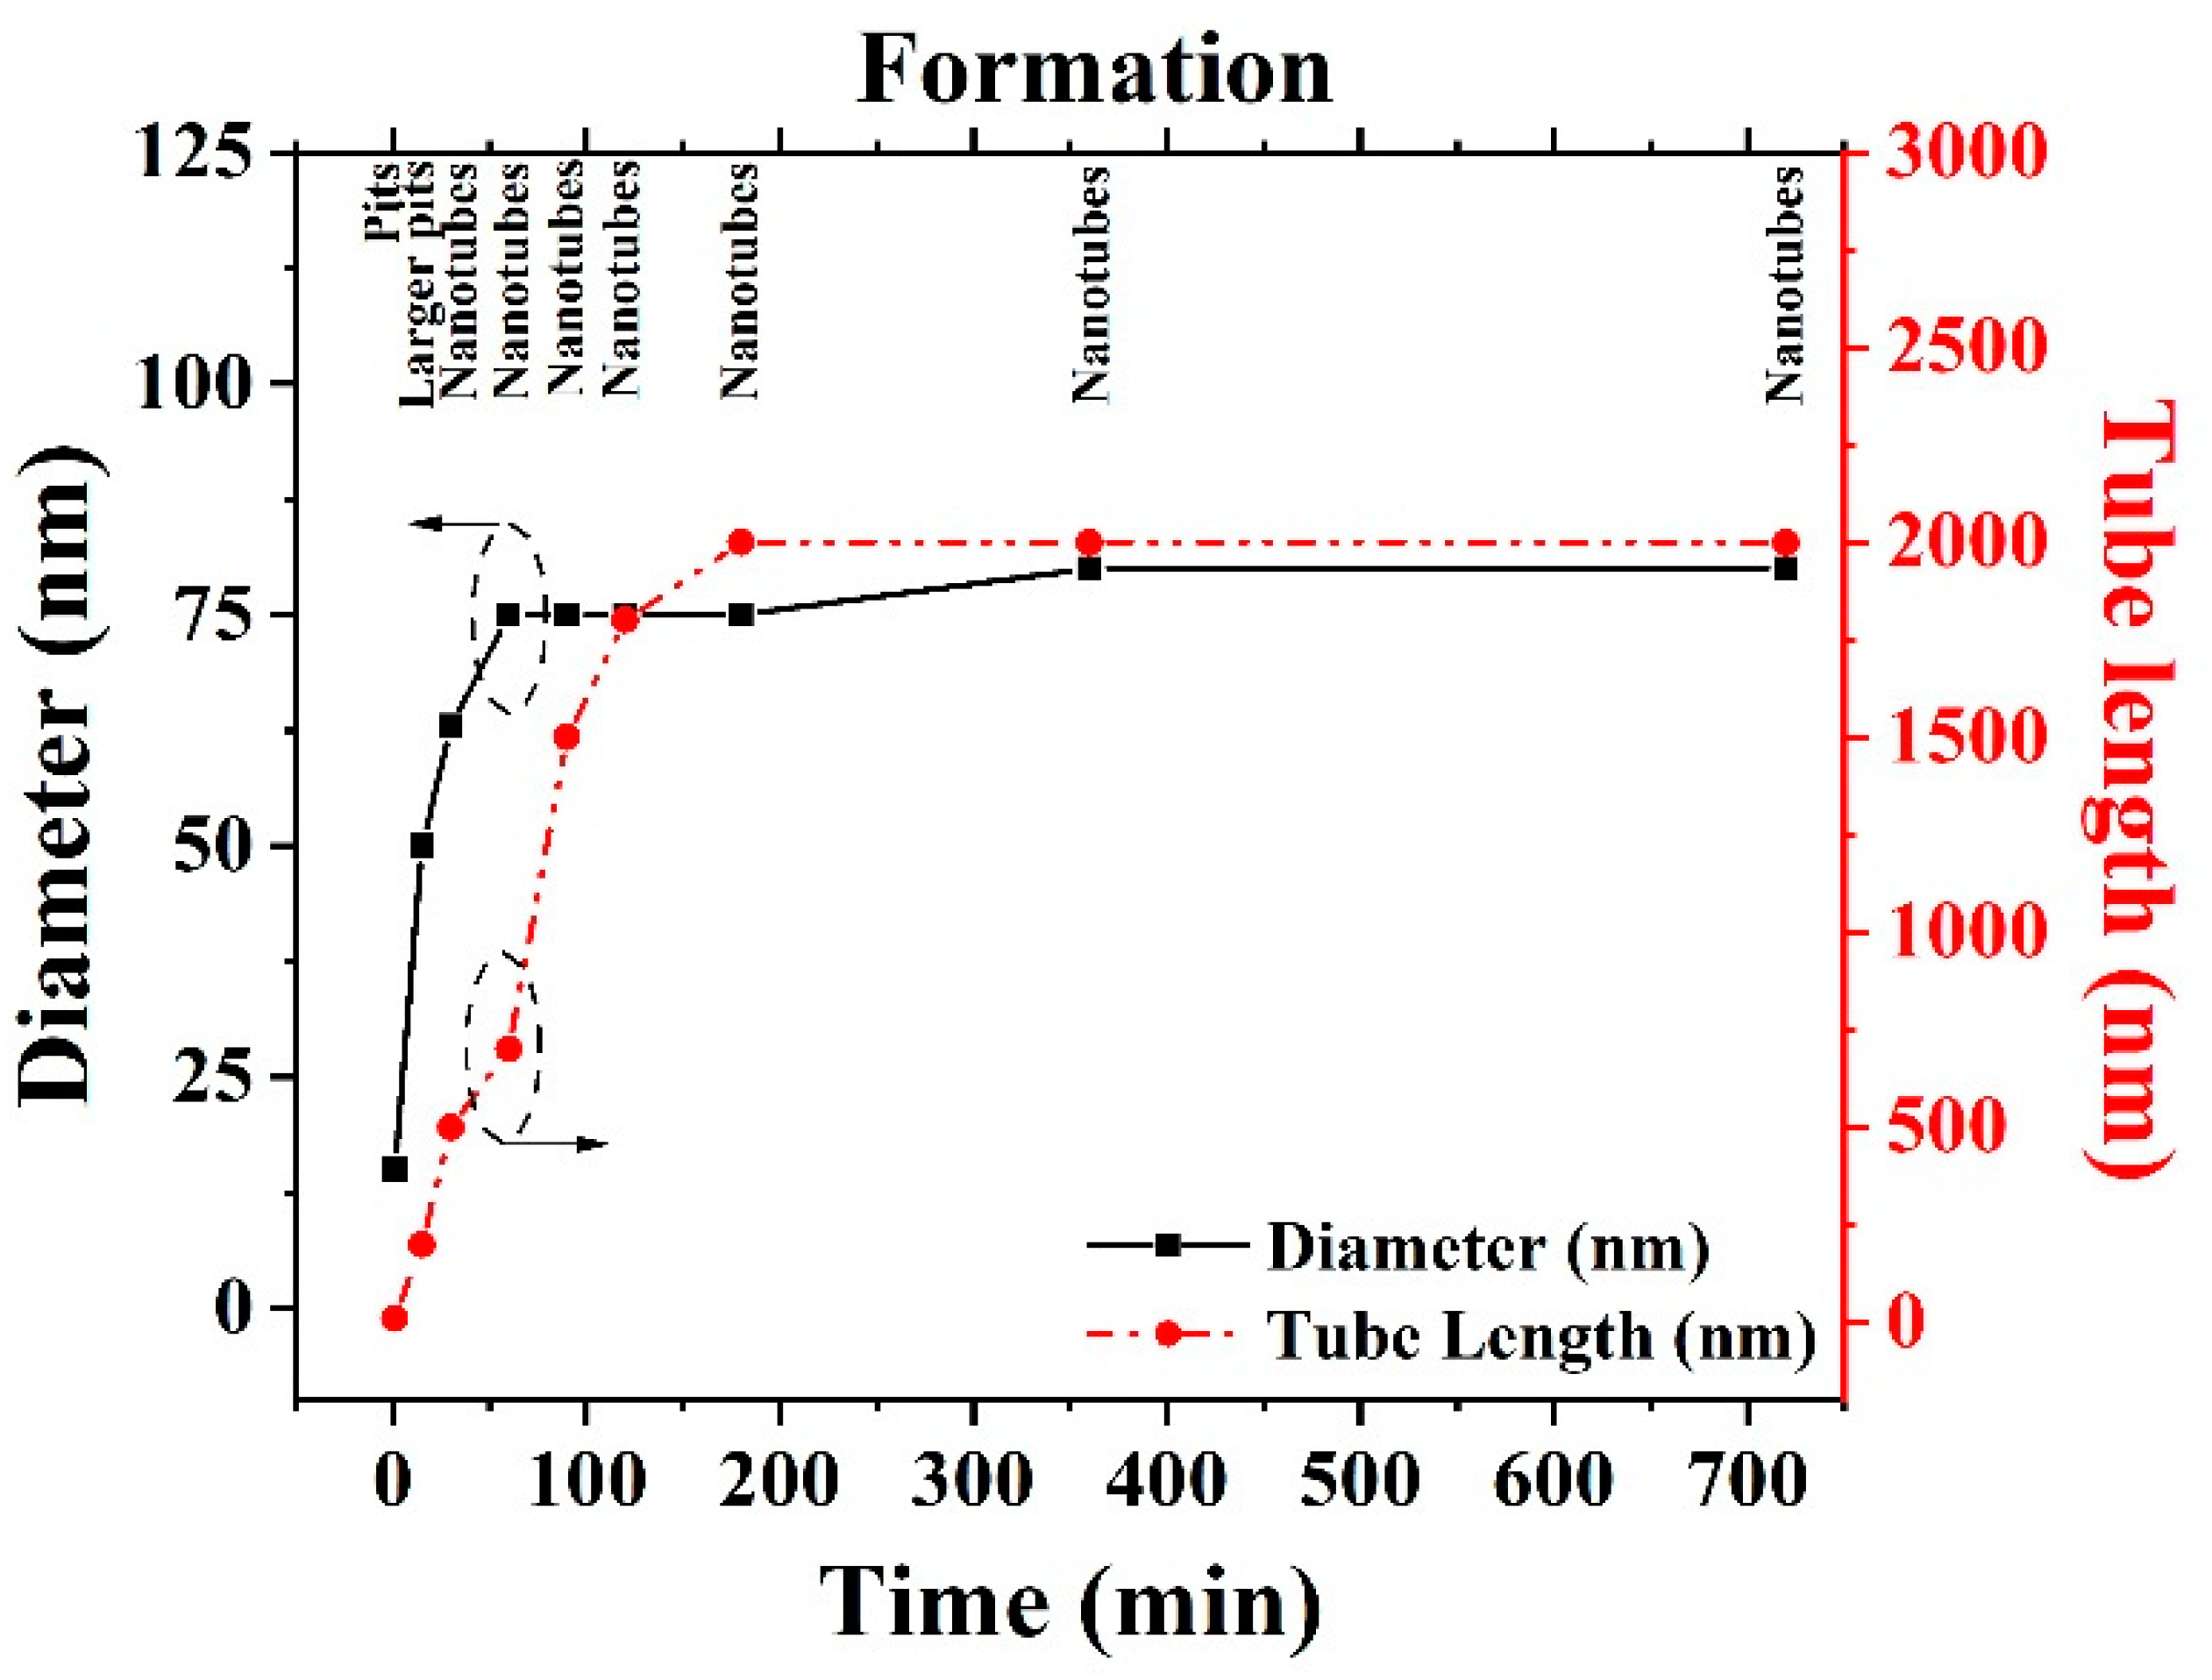
Foils were then anodized at 20 V but at varying times from 1 to 720 min; 20 V was selected, as it produced TNTs with a diameter smaller than 100 nm. A time variation experiment was performed to investigate the influence of anodization duration over TNT dimensions. The FESEM images in Figure 5 show the morphologies of the anodic film, and Figure 6 summarizes the anodic film features formed at different anodization times. As seen in Figure 5a, anodization for 1 min resulted in anodic films with a thickness of ~10 nm and randomly distributed pits on the surface. The pit diameter increased to ~50 nm after anodization for 15 min (Figure 5b). From the cross-sectional morphology, it is evident that a self-aligned nanotubular structure formed beneath this pitted region, indicating inadequate surface etching. A more obvious nanotube structure was obtained for the sample anodized for 30 min (Figure 5c). The TNT opening was also very clear, suggesting that surface etching is time dependent. Moreover, TNTs length was longer for this sample than for the 15 min sample.
The length increased further with an increase in anodization time; at 60 min, the TNT length increased to 700 nm; at 90 min, it increased to 1.5 μm; and, at 120 min, it increased to 1.8 μm, as shown in Figure 5d–f, respectively. However, the length remained constant at ~2 μm for samples anodized for 180–720 min (Figure 5g–i). The TNT diameter was ~80 nm for all samples, indicating that the diameter is independent of anodization time. Similar findings have been reported [18].

2.1.4. Effect of Annealing Environment.

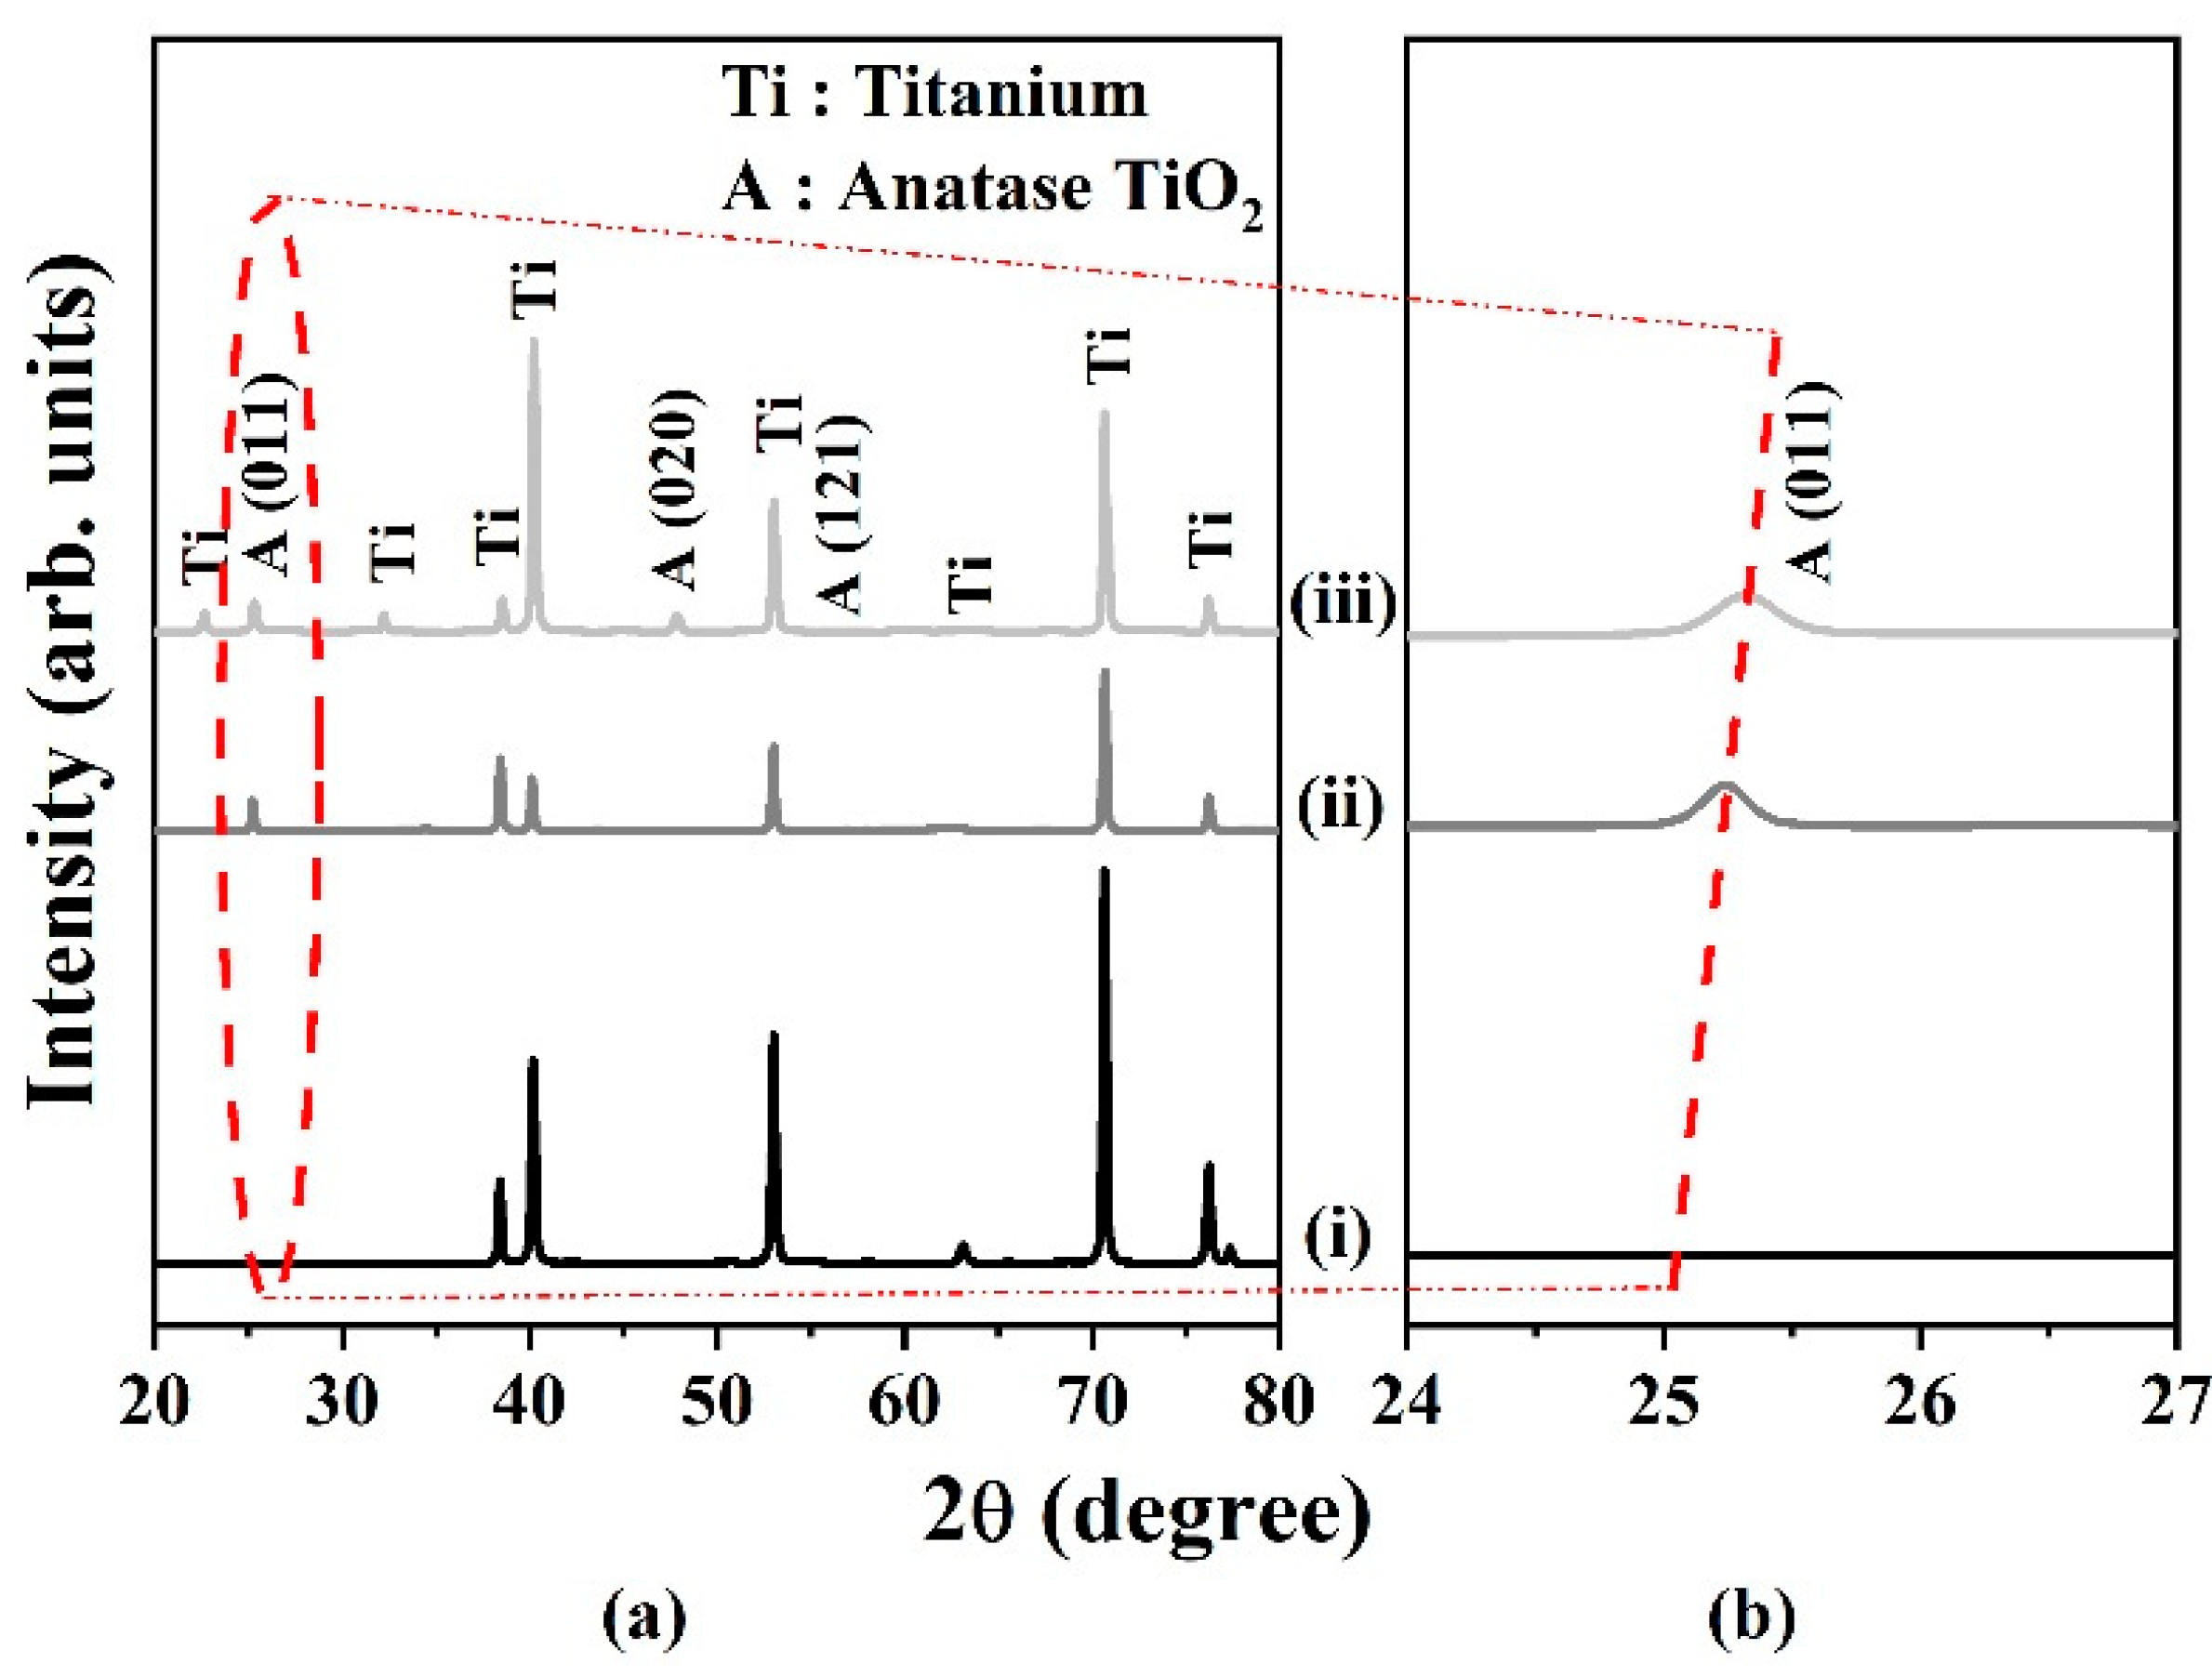
Samples prepared by anodization at 20 V were annealed either in air or nitrogen at 450 °C for 3 h. The XRD pattern in Figure 7a shows that the as-anodized TNTs are amorphous, and, after annealing, anatase TiO2 (ICSD: 98-010-7874) can be identified from peaks at 25.4°, 48.1°, and 54.7°, corresponding to the (011), (020), and (121) planes, respectively. Minimal differences can be observed for samples annealed in air and nitrogen, apart from a slight shift in the (011) peak, as shown in Figure 7b. This shift is attributed to lattice distortion [41], perhaps induce by the substitution of nitrogen within the crystal lattice, which results in strain [42,43,44]. Since the ionic radius of nitrogen ( r N 2 + = 1.46 Å) is larger than that of oxygen ( r O 2 + = 1.38 Å), the substitution of nitrogen in the O-site of the crystal structure may result in the TiO2 crystal lattice expanding because of tensile strain [42].
Anatase crystallite size for air- and nitrogen-annealed TNTs was calculated using the Debye–Scherrer equation at the (011) anatase peak according to the full width at the half maximum of the diffraction pattern. The crystallite sizes were 26.29 and 36.79 nm for nitrogen- and air-annealed TNTs, respectively. The smaller crystallite size for the nitrogen-annealed TNTs can be attributed to growth suppression during annealing in the nitrogen environment [45].
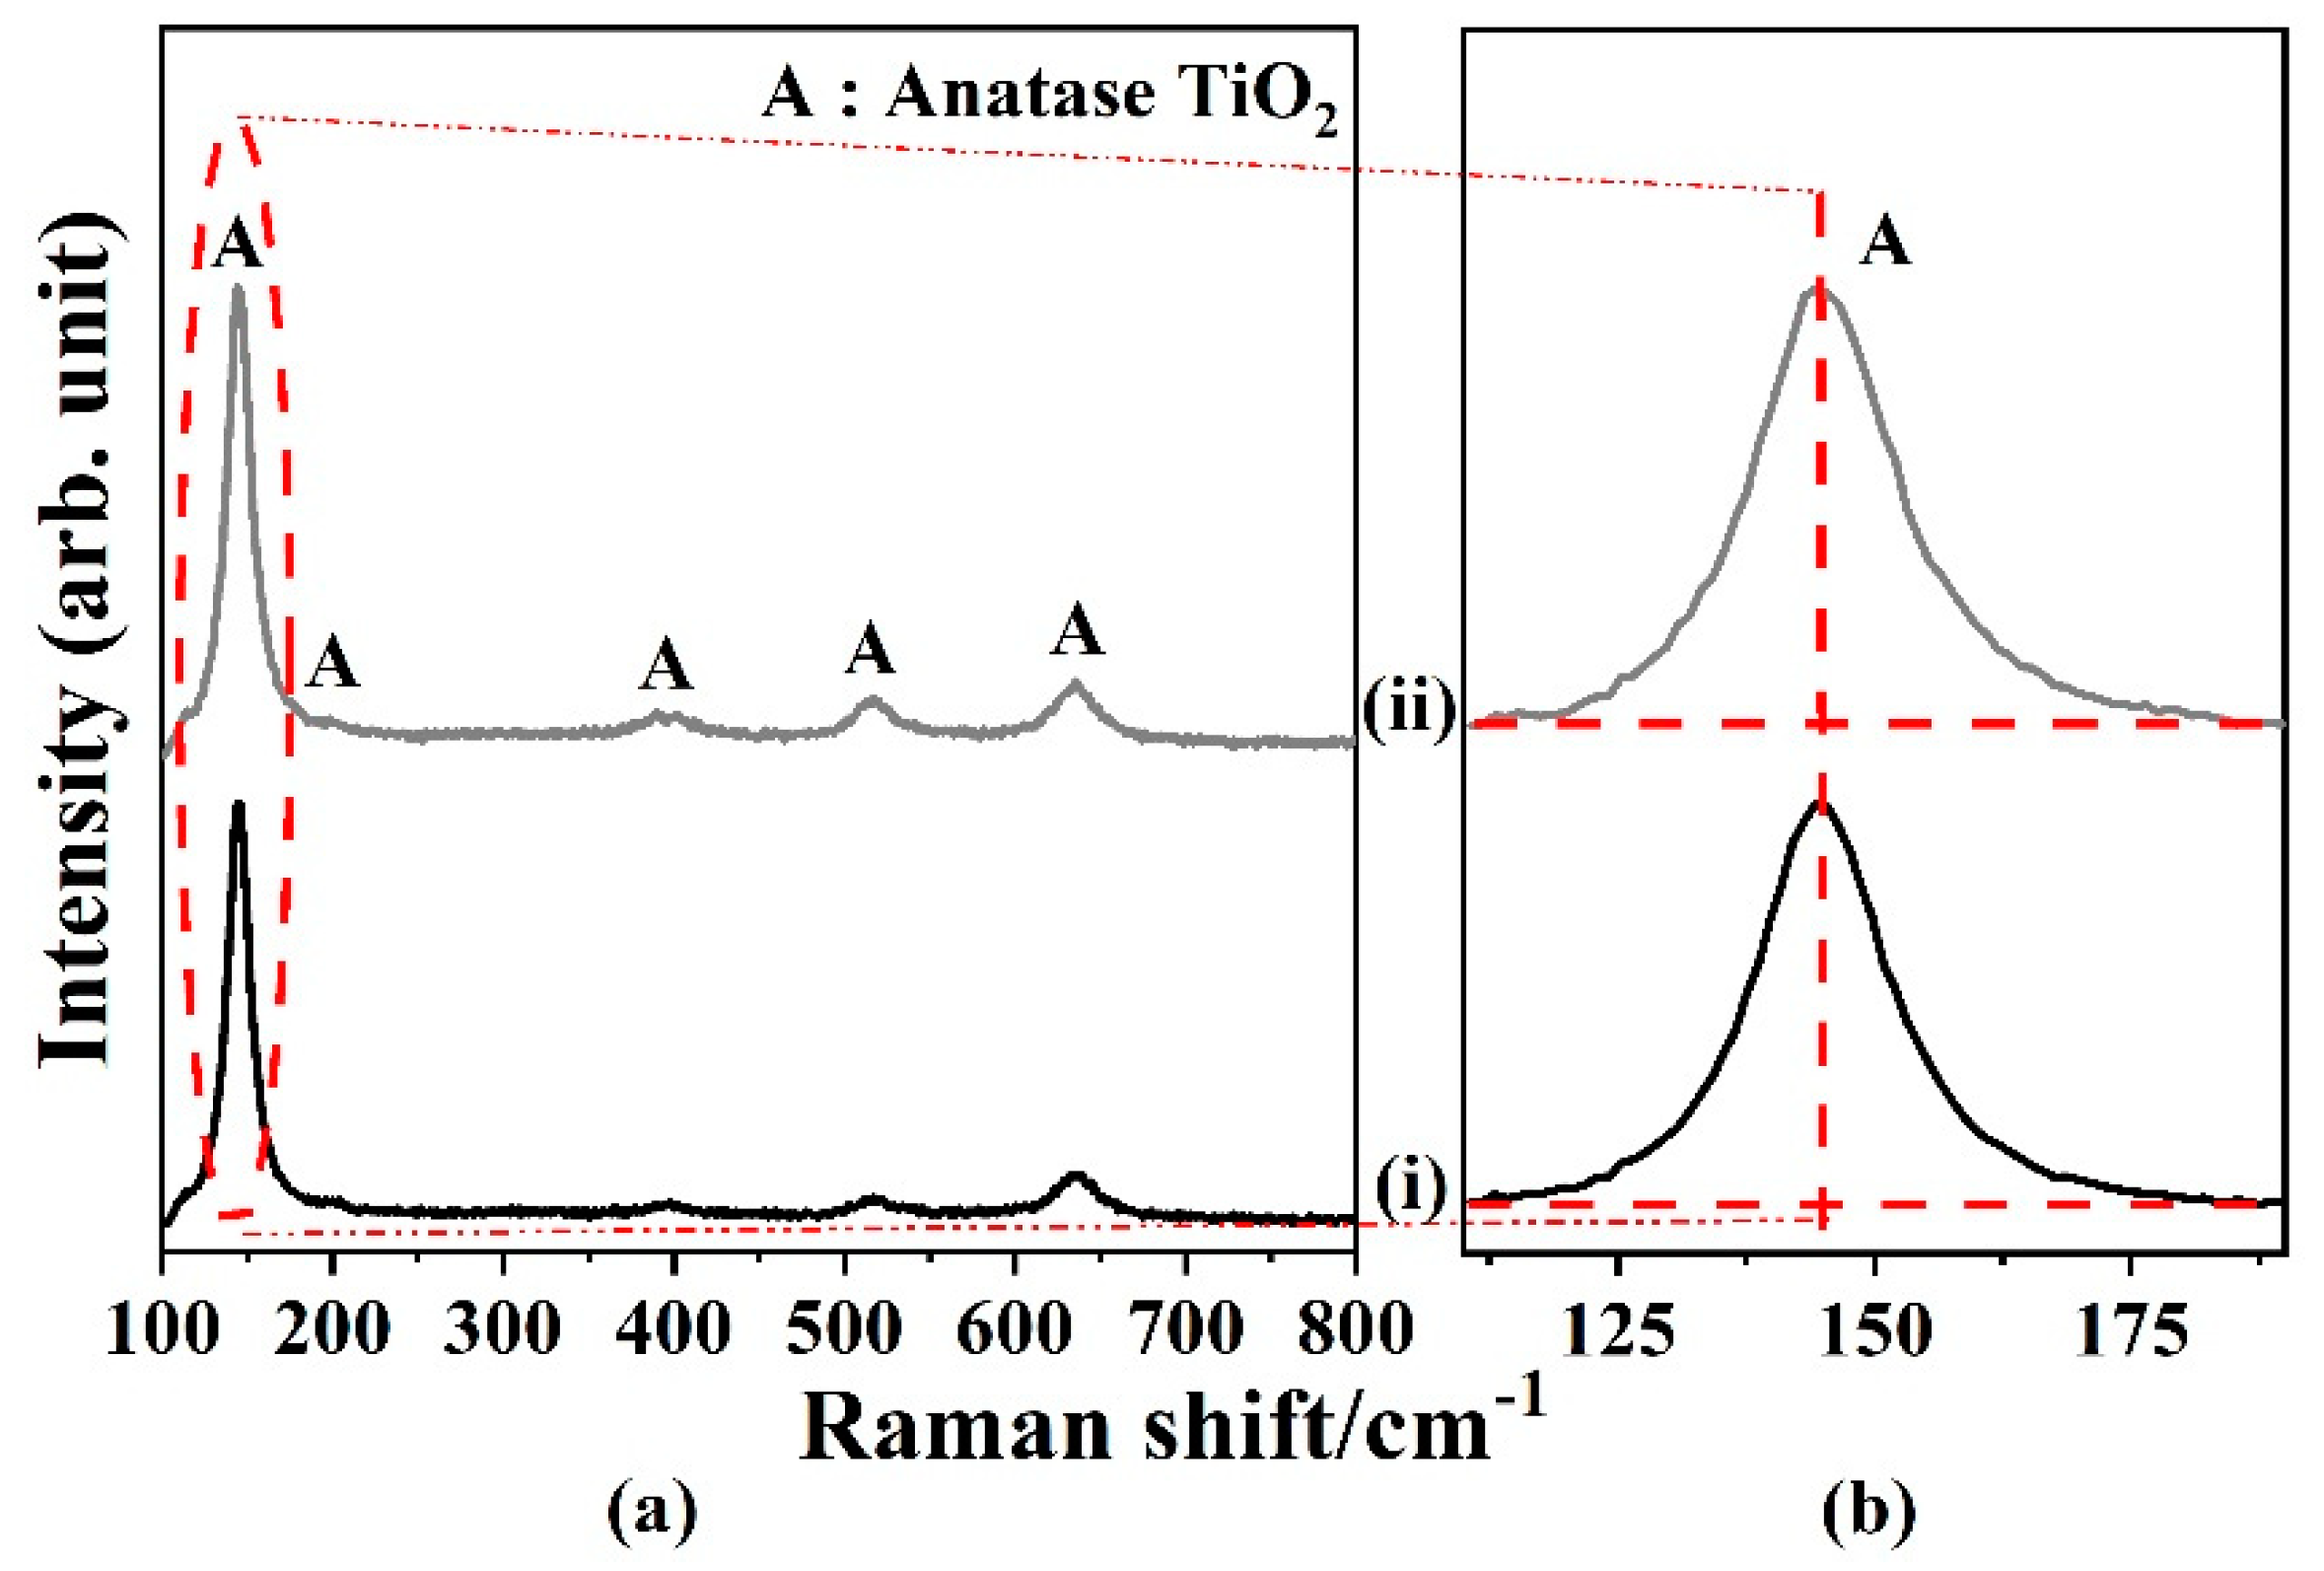
To further study the changes in phase structure after annealing in air and nitrogen environment, Raman spectroscopy on the TNTs was carried out, and the results are shown in Figure 8. When the TNTs were annealed at 450 °C, both samples exhibited three typical modes corresponding to A1g (515 cm−1), B1g (398 and 515 cm−1), and Eg (144, 197, and 640 cm−1), respectively, in the Raman spectrum [39]. The peaks in these modes demonstrate the presence of anatase phase as the predominant crystal structure. The anatase peaks of TNT are labelled with A (Figure 8a). The intensity of the dominant anatase peak at 144 cm−1 was higher for the TNTs annealed in nitrogen compared to air. Moreover, from the enlarged image of the dominant peak in Figure 8b, it can be observed that the bandwidth increased for the nitrogen-annealed sample. These results indicate that the crystallinity of the anatase phase was enhanced and the crystallite size decreased after annealing in nitrogen, which is consistent with the results of the XRD measurement.
The optical properties of the annealed TNT films were determined using diffuse reflectance UV–Vis spectroscopy, the results of which are shown in Figure 9. The energy bandgap E g of the samples was calculated using the Kubelka–Munk equation [46]:
F ( R ) = ( 1 R ) 2 2 R
where R is the diffuse reflectance of the sample. Using the Tauc relation, the following equation was obtained:
F ( R ) h υ = A ( h υ E g ) n
where A is the proportionality constant, F ( R ) is the K–M function, and h υ is photon energy [47,48]. The F ( R ) function can be multiplied by h υ using a corresponding coefficient (n). The n values of 0.5 and 2 were used to estimate the direct and indirect bandgap oxide, respectively. Then, the extrapolation of ( F ( R ) × h υ ) 2 or ( F ( R ) × h υ ) 0.5 = 0 was conducted to obtain the direct and indirect E g values, respectively.
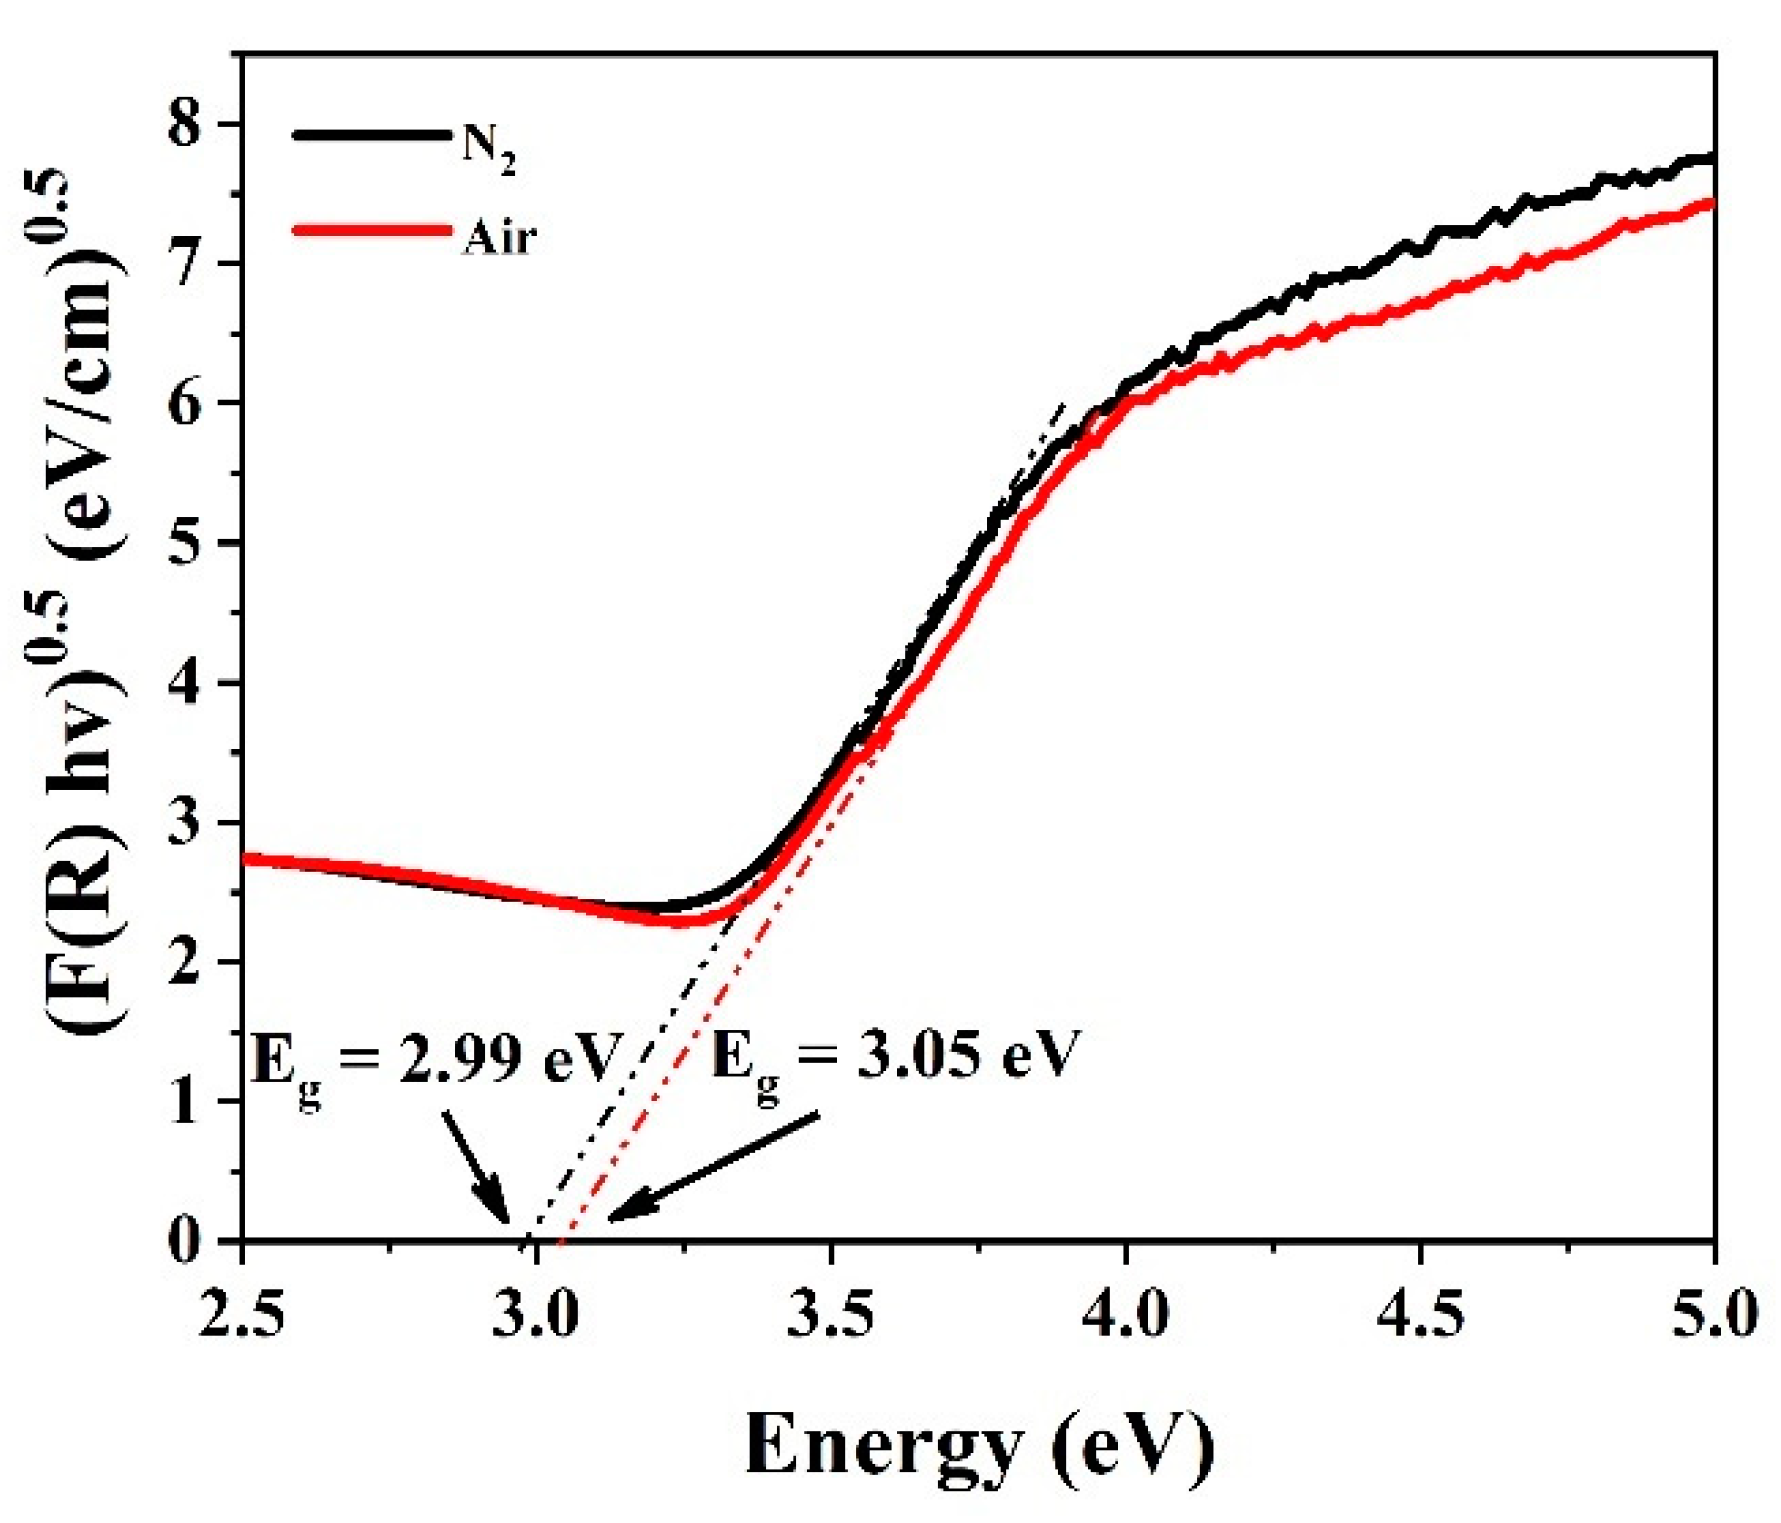
Figure 9 plots ( F ( R ) h υ ) 0.5 vs. h υ . Here, the indirect bandgap energy can be evaluated by extrapolating a straight line for ( F ( R ) h υ ) 0.5 to intercept the photon energy axis (Figure 9) [49]. The estimated bandgaps obtained for the TNTs annealed in air and nitrogen are 3.05 and 2.99 eV, respectively. The smaller bandgap for nitrogen-annealed TNTs can be attributed to the presence of defect states within the bandgap [50].

2.2. Photoreduction of Hexavalent Chromium Ions on Titanium-Dioxide Nanotubes

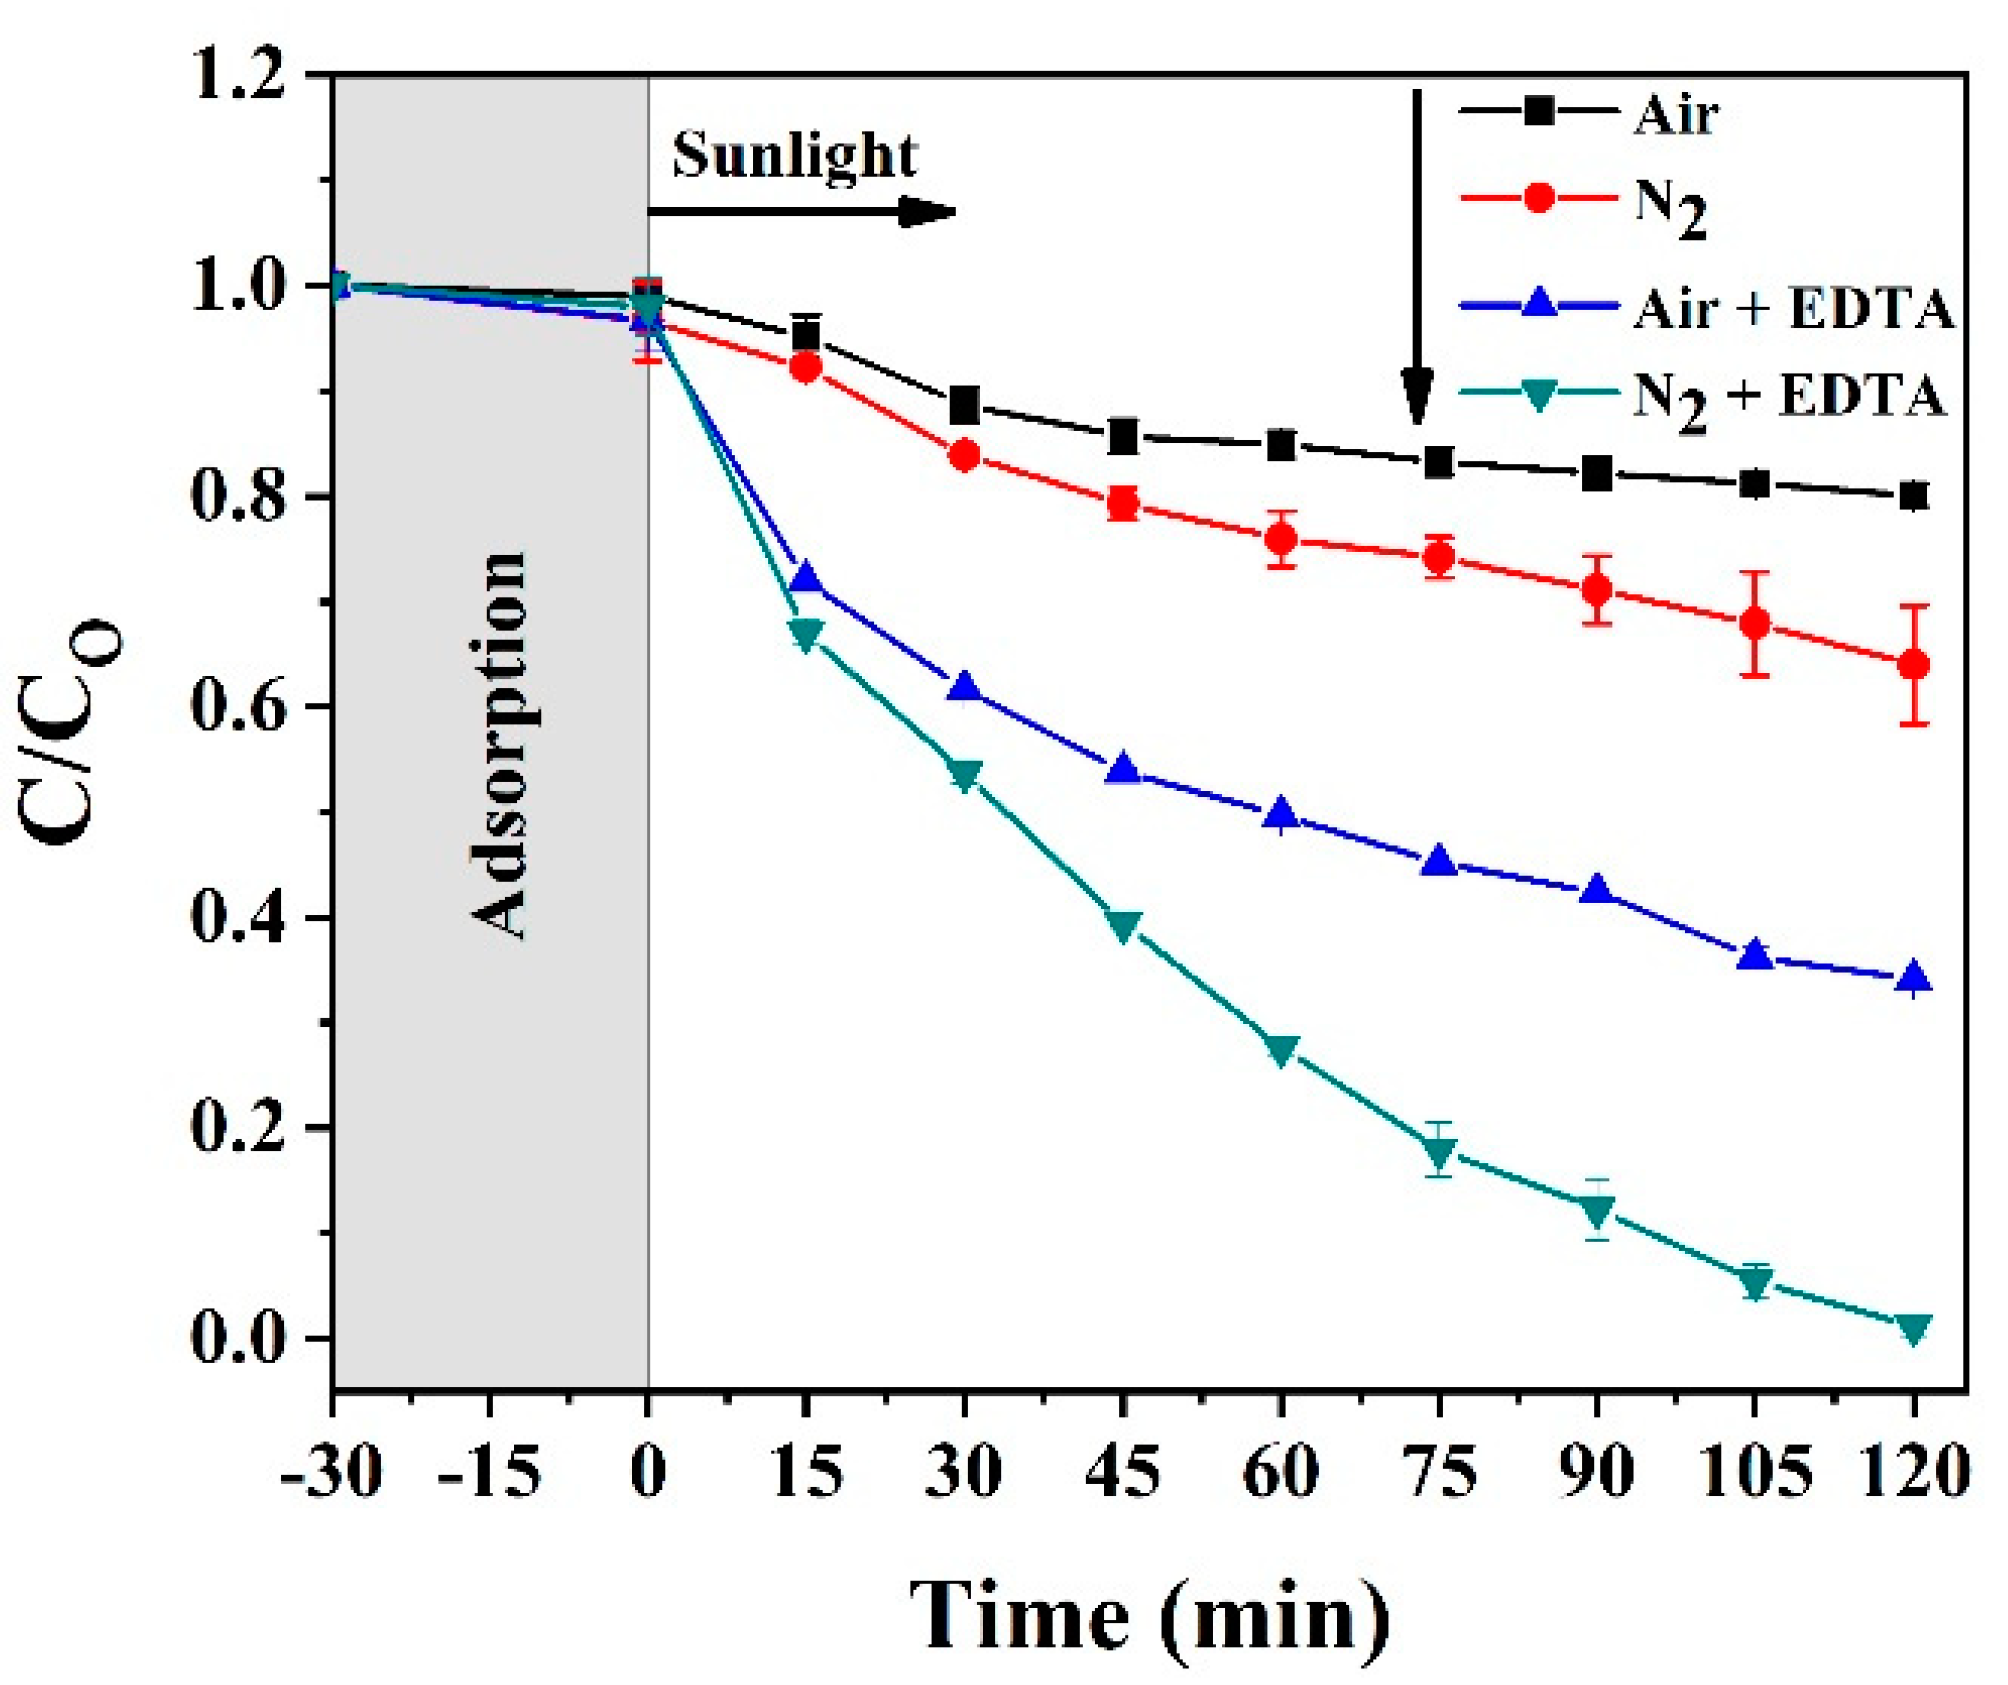
Cr(VI) photoreduction experiments were conducted by exposing 10 ppm Cr(VI) solution to natural sunlight on a sunny day. Cr(VI) photoreduction was very slow without EDTA addition, as shown in Figure 10; less than 10% Cr(VI) removal was recorded. The percentage of removal increased when EDTA was added to the Cr(VI) solution: 50% and 63% for air- and nitrogen-annealed TNTs, respectively, after 60 min of sunlight exposure. The total reduction of Cr(VI) was achieved for nitrogen-annealed TNTs after 120 min of sunlight exposure, possibly because of the narrow energy bandgap for this sample [46]. Air-annealed TNTs only achieved a 70% reduction after 120 min of sunlight irradiation.
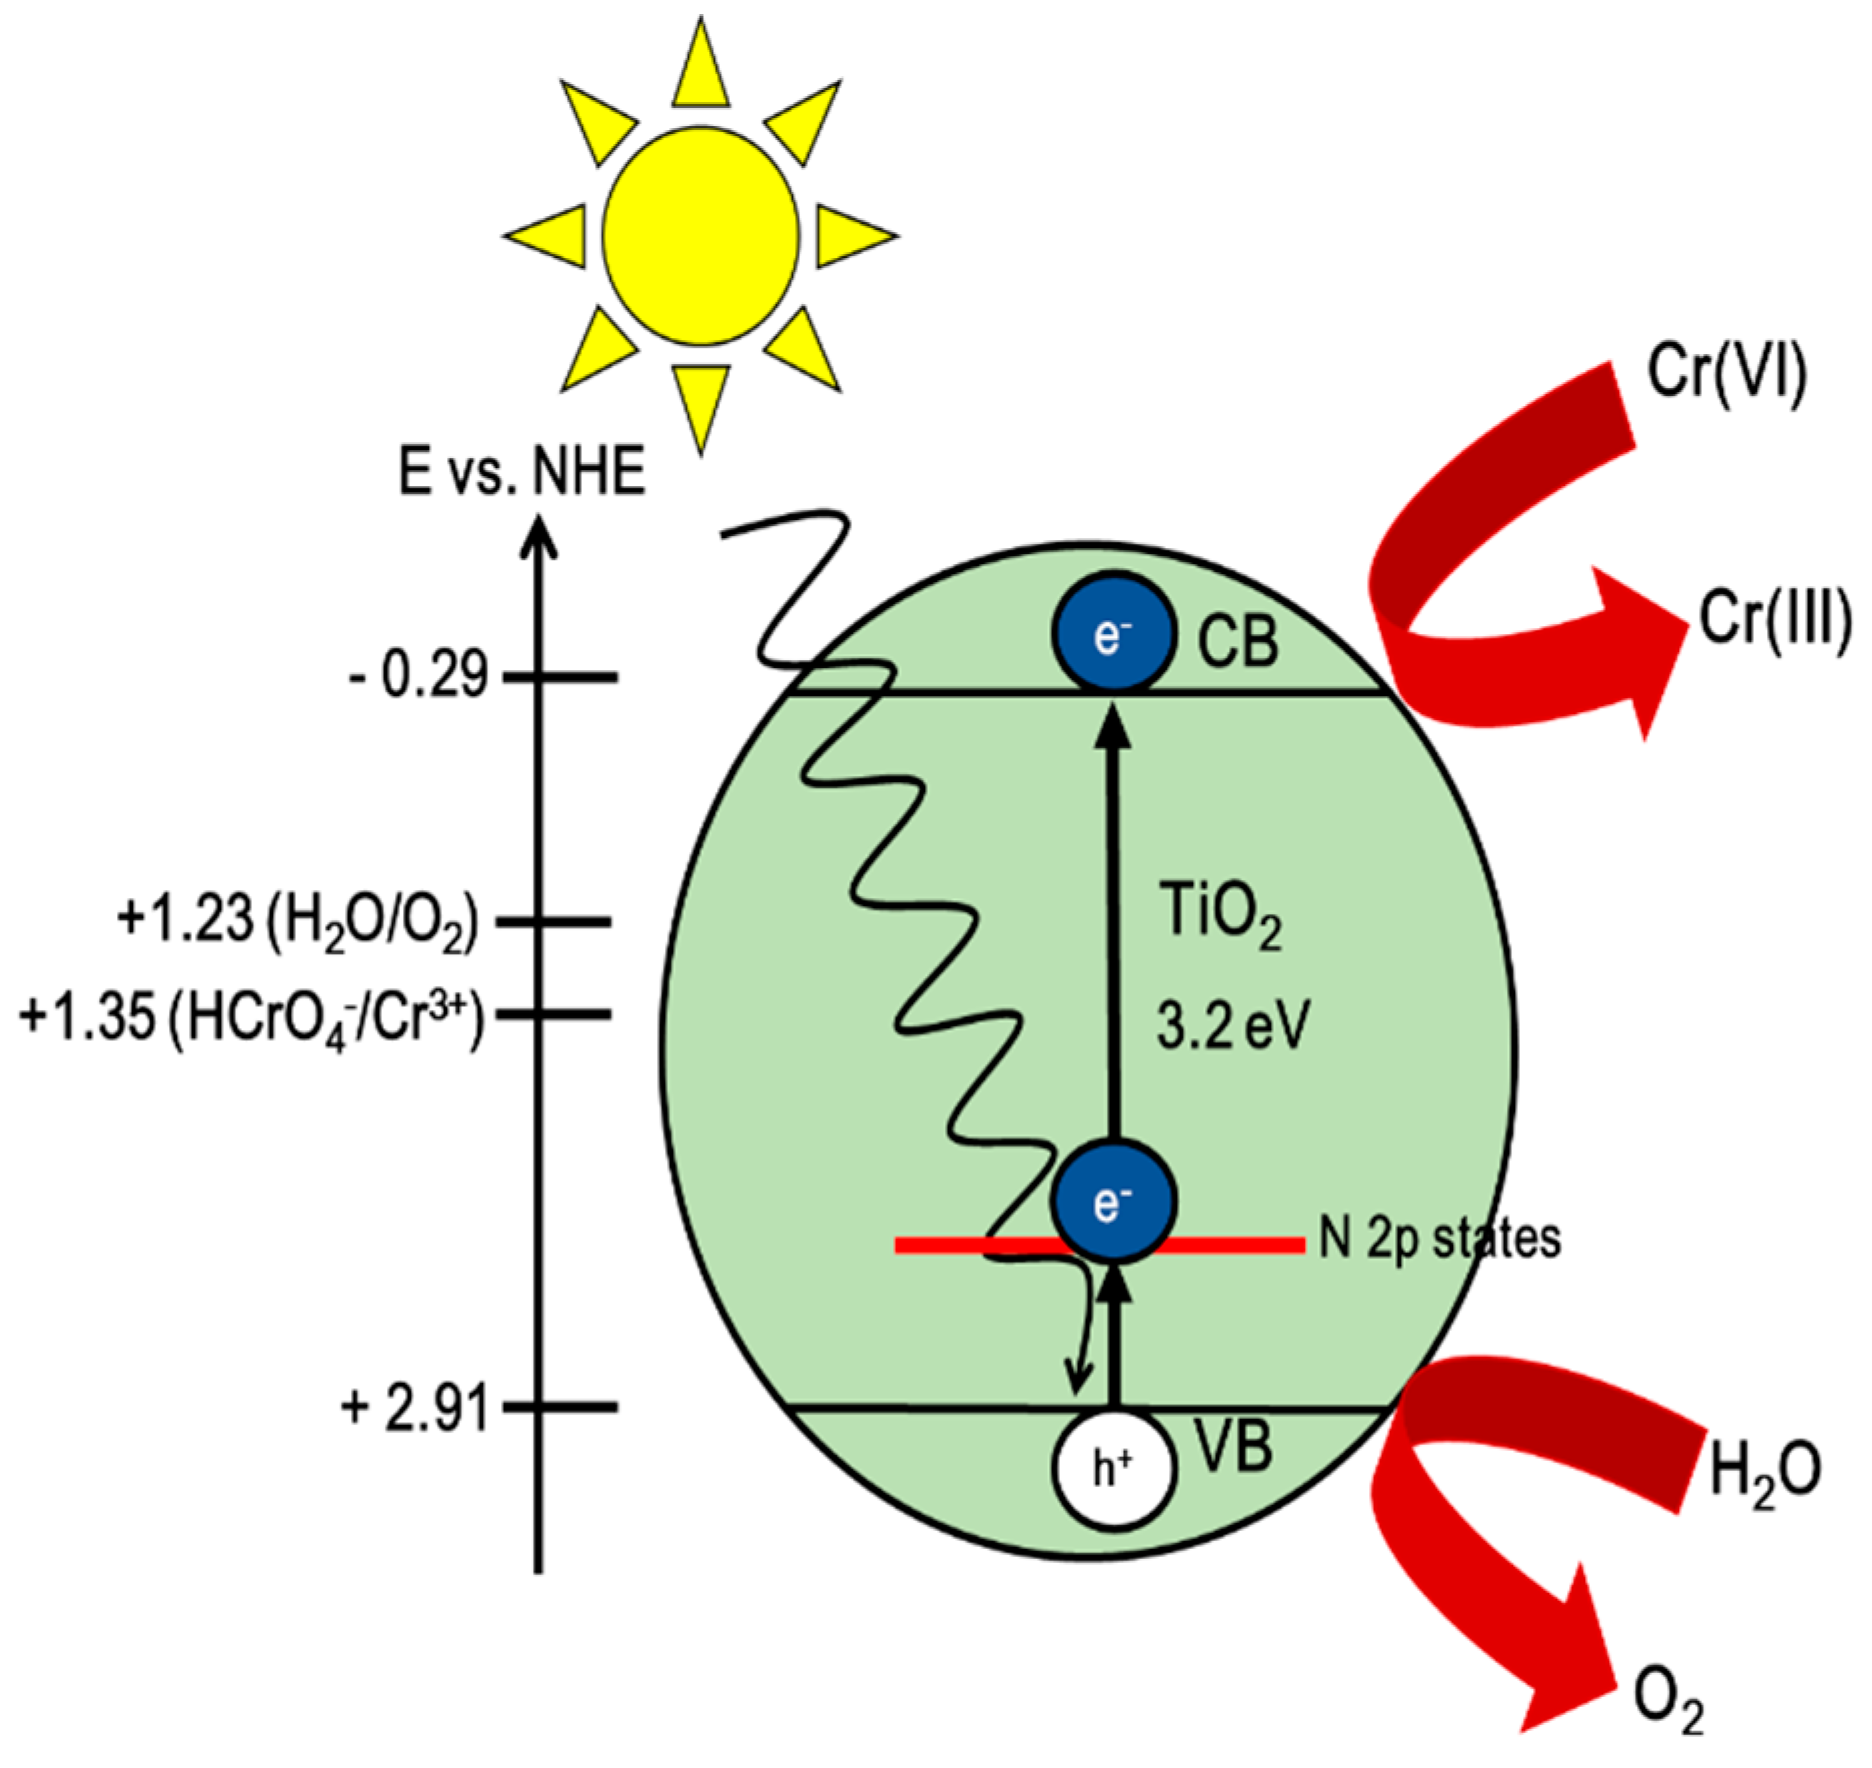
Nitrogen insertion is possible within the TiO2 lattice, as observed from the anatase peak shift in the XRD. Substituting nitrogen in the lattice resulted in the formation of N-2p states above the valence band (VB) of TiO2 [51], which reduced the TiO2 bandgap and thus enabled the adsorption of visible light for electron excitation (Equation (5)) from the CB, as depicted in Figure 11.
The reduction potential of HCrO4/Cr3+ under the standard condition is E0 = +1.35 V vs. normal hydrogen electrode (NHE) at pH = 0, whereas the CB potential for TiO2 is +0.05 eV vs. NHE at pH = 0 [52]. Since the reduction potential of HCrO4/Cr3+ is more positive than the CB, electron reduction is possible:
TiO 2 + h v e C B + h V B +
The reduction of Cr(VI) under acidic conditions (pH ≤ 2) can be described in Equation (6) [53]:
HCrO 4 + 7 H + + 3 e C r 3 + + 4 H 2 O
The band edge positions of the CB and VB for the TNTs was calculated by applying the concept of electronegativity using Equations (7) and (8):
E V B = X E e + 0.5   E g
E C B = E V B E g
where E V B is the VB edge potential at the point of zero charge, E C B is the CB edge potential, and X is the absolute electronegativity of the semiconductor (the X value for TiO2 is 5.81 eV) [54], which is defined as the geometric average of the absolute electronegativity of the constituent atoms, and E e is the energy of free electrons at the hydrogen scale (approximately 4.5 eV). Table 1 shows the calculated E C B , E V B , and E g values for TNTs formed in glycerol-water electrolyte and after annealing.

2.2.1. Effect of EDTA as Hole Scavenger

As shown in Figure 10, Cr(VI) reduction was sluggish without EDTA added to the solution. This could be due to several reasons, such as the fast recombination process [56] or the reoxidation of Cr(III) to Cr(VI) [57] by OH. OH radicals are well known as a strong oxidizing agent and are produced when holes react with H2O, which can be expressed by Equation (9) [58]:
H 2 O + h + O H + H +
OH concentration can be suppressed by ensuring they react with EDTA, as this results in their degradation to CO2 and H2O, which can be expressed by Equation (10):
O H + s c a v e n g e r C O 2 + H 2 O
Holes are also known to be oxidizing, and EDTA can be used to capture holes; capturing holes can also reduce the recombination of electron–hole pairs. This can be expressed by Equation (11):
h + + s c a v e n g e r C O 2 + H 2 O

2.2.2. The Effect of Initial Hexavalent Chromium Concentration

A reduction experiment using Cr(VI) of varying concentration was performed using a Cr(VI) solution of 5, 10, 15, and 20 ppm. The experiment (Figure 12) showed a very fast reduction of 5 ppm Cr(VI) solution with 100% reduction after 90 min of sunlight exposure. As shown previously, 100% removal of Cr(VI) was observed after 120 min for 10 ppm solution. At higher ppm level of Cr(VI) reduction times, 80% removal was seen for 15 ppm solution and 75% for 20 ppm solution.

2.2.3. Reaction Kinetics Modeling

The pseudo-first-order Langmuir–Hinshelwood model [59] was used to understand the reaction kinetics:
R = d C d t = k t
The resulting integrals of Equation (12) can be expressed as a pseudo-first-order equation when the adsorption is relatively weak/or the reactant concentration is low:
ln C C o = k t
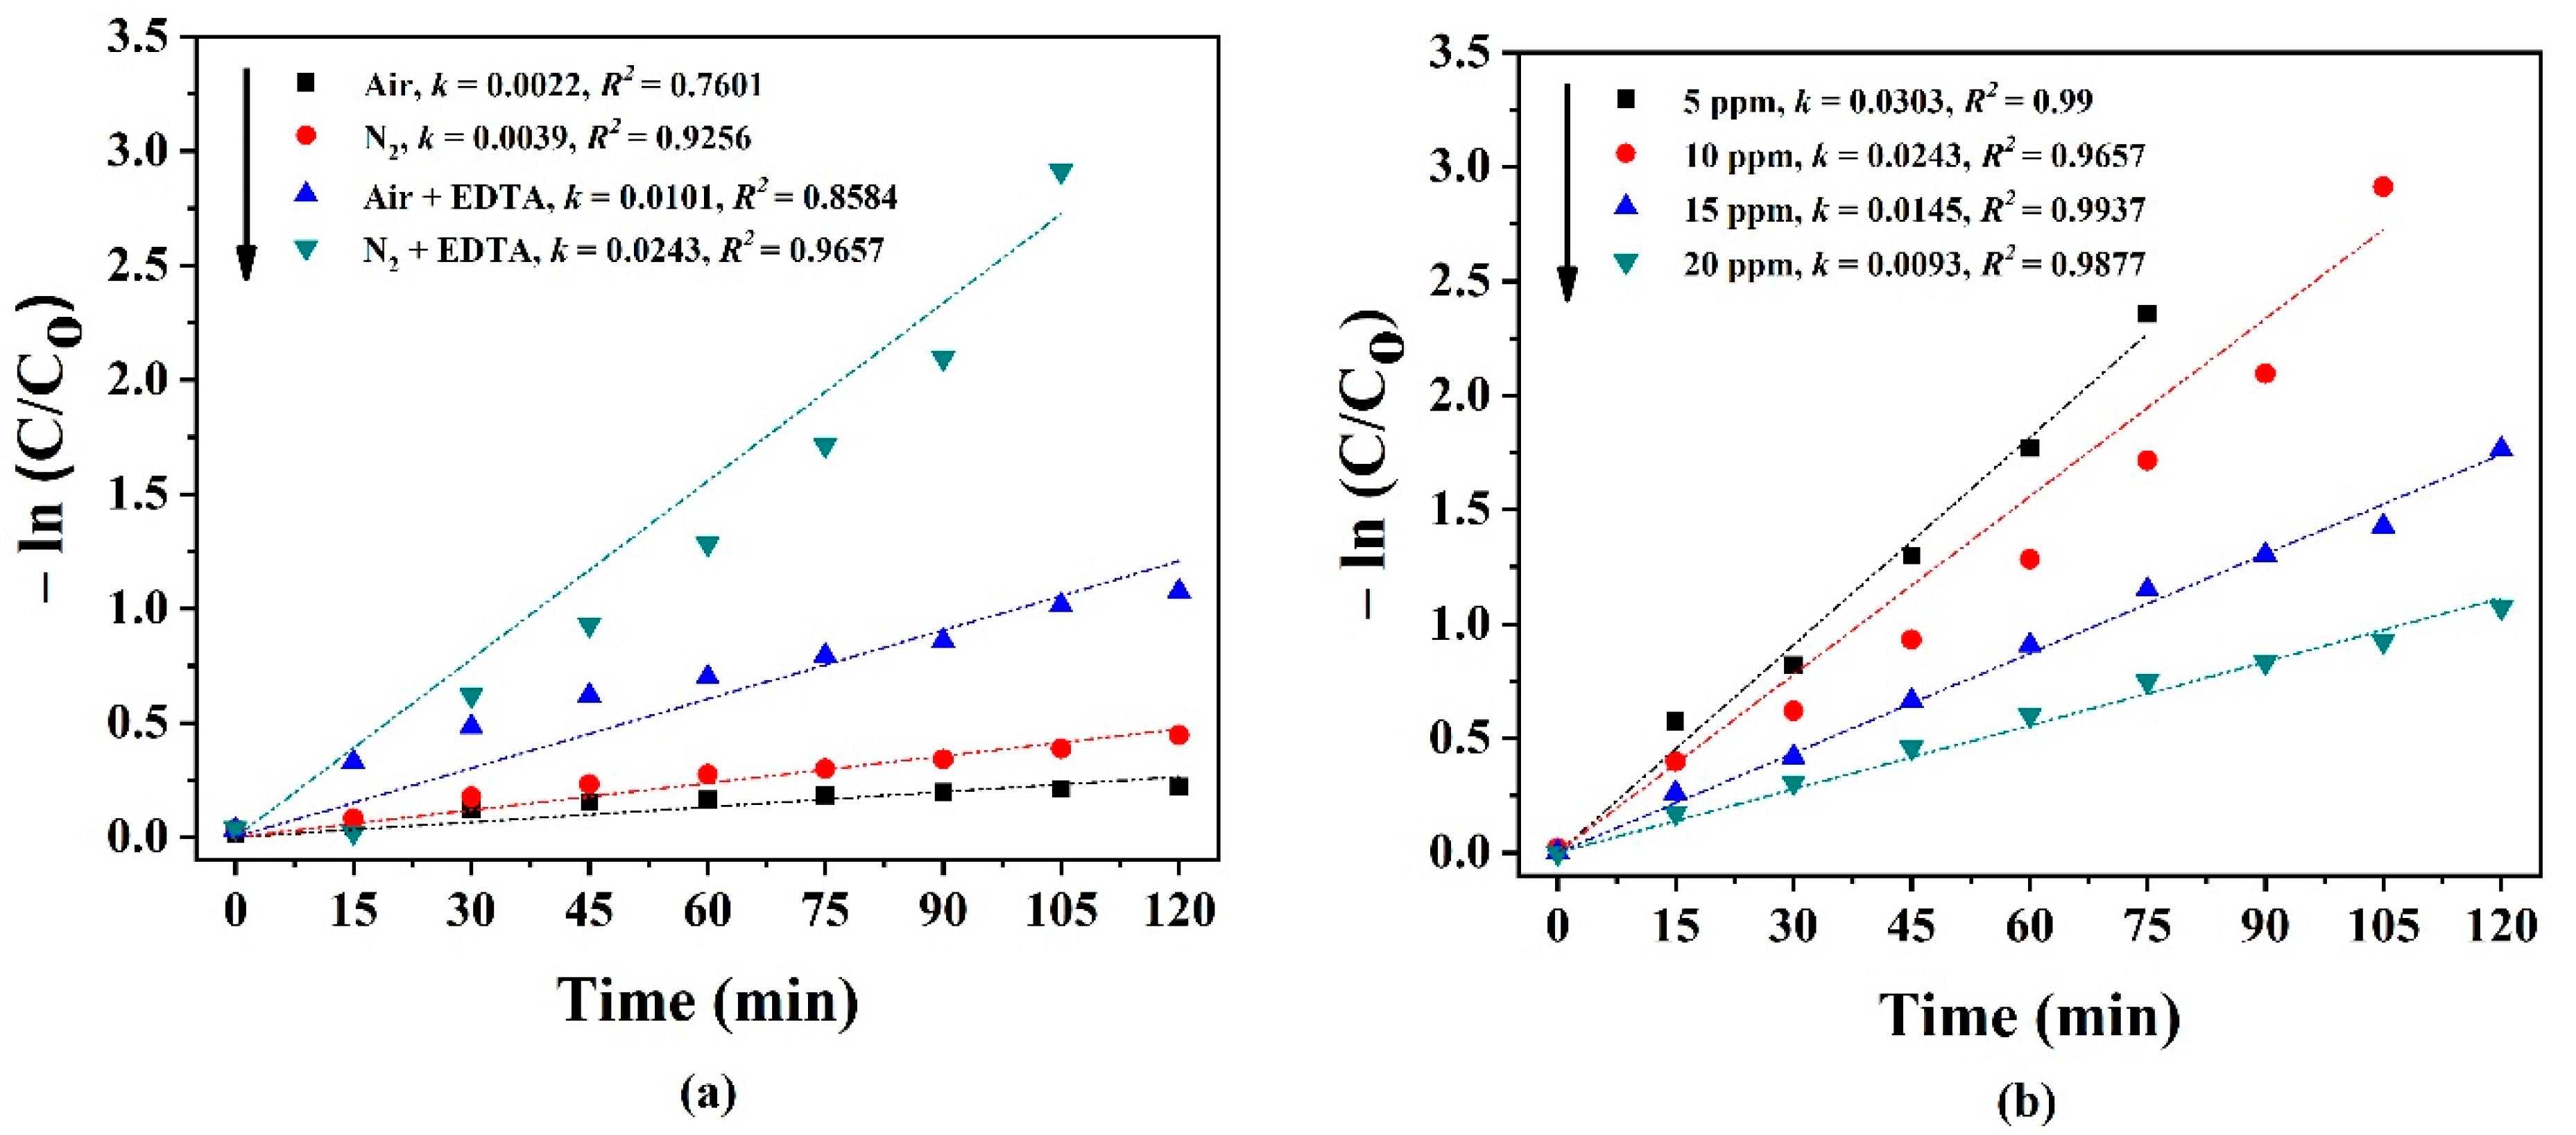
where R denotes the photocatalytic reaction rate; k is the apparent photocatalytic pseudo-first-order reaction rate constant; C o and C denote the initial Cr(VI) concentration and the Cr(VI) concentration at a given time t, respectively. The model validity is determined by the correlation coefficient of determination (R2): a value close to 1 suggests that the model is ideal for explaining Cr(VI) kinetics. Figure 13 plots ln C C o vs. time; the k value is the slope of the line fitted on the plot of ln C C o vs. t.
The inset of Figure 13a provides the k and R2 values for Cr(VI) metal ions. The pseudo-first-order Cr(VI) removal rate increases when EDTA is introduced. Based on the k value, the photocatalytic activity of nitrogen-annealed TNTs with EDTA as a hole scavenger is roughly seven times larger (k = 0.0249 min−1) than that for nitrogen-annealed TNTs without EDTA (k = 0.0039 min−1). Similar results were obtained for the k value of air-annealed TNTs with EDTA (k = 0.0101 min−1): photocatalytic activity was roughly five times greater than it was in the absence of EDTA as a hole scavenger (k = 0.0022 min−1).
For Cr(VI) solutions with different concentrations, Cr(VI) reduction appears to follow the Langmuir–Hinshelwood model and can be described by pseudo-first-order kinetics, as confirmed by the obtained straight line and R2 value of ≅1 (Figure 13b). A similar observation was reported for Cr(VI) photoreduction by Shaban et al. [60]. The reaction rate constant for Cr(VI) reduction was 0.0303, 0.0243, 0.0145, and 0.0093 min−1 for the 5, 10, 15, and 20 ppm solutions, indicating a fast reduction in diluted solutions after sunlight irradiation for 120 min.
Table 2 compares the Cr(VI) reduction efficiency obtained in the present paper with the existing literature, from which it is evident that the photocatalytic reduction of nitrogen-annealed TNTs is comparable with fluorine- and carbon-doped TNTs under UV–Vis light irradiation [45,61,62,63,64,65]. Furthermore, by adding a small amount of EDTA (1 mM), a higher efficiency of Cr(VI) photoreduction was obtained compared to the addition of other scavengers, such as phenol (10 mM) and tartaric acid (6 mM), at higher amounts under UV–Vis light irradiation. [60,66,67].

3. Materials and Methods

Ti foils (99.96% pure; thickness: 0.13 mm; Stream Chemical, Newburyport, USA) were cut into square sections (10 × 10 mm) for the experiment. Before anodization, the foils were degreased in an ultrasonic bath of acetone (J.T. Baker—9254, Center Valley, PA, United States) and then ethanol (95.7% pure; Samchen, Shah Alam, Selangor, Malaysia) for 15 min each. The foils were then rinsed with deionized water and dried. The cleaned foils were then placed in an electrochemical cell with a restricted area of 5 × 10 mm exposed to the electrolyte. The anodization experiment was conducted using a two-electrode electrochemical cell at room temperature with a platinum cathode (diameter of 2 mm; 75 mm in length; Metrohm, Herisau, Switzerland) and Ti foil as the anode using a DC power source (Agilent E3647A, Santa Clara, CA, USA). The distance between the anode and cathode was 30 mm. The electrolyte was a glycerol–water (85% and 15%, respectively) solution (Merck, Darmstadt, Germany). Ammonium fluoride (NH4F, Merck, Darmstadt, Germany)) was added to the electrolyte in different amounts: 0.1, 0.3, 0.5, 0.7, 0.9, and 1.0 wt.%. To examine the anodization time effect, a 0.5 wt.% NH4F electrolyte bath was used. The anodization time varied from 1 to 720 min at a constant voltage of 20 V. The effect of the anodization voltage was examined by varying the voltage from 1 to 80 V for 90 min in the same electrolyte bath (fixed sweep rate of 0.1 V/s).
The anodized Ti foil was removed from the electrolyte and rinsed with deionized water and dried in air naturally. The anodized Ti was then annealed using a horizontal tube furnace (Lenton 1200, Derbyshire, United Kingdom) at 450 °C for 3 h in air or nitrogen. The morphologies of the anodized foils were observed by field emission scanning electron microscopy (FESEM; Variable Pressure Zeiss Supra 35, Oberkochen, Germany). Transmission electron microscopy (TEM; JEOL, JEM-2100F, Tokyo, Japan), at an acceleration voltage of 200 kV, was used to provide detailed observations of nanotube structure. X-ray diffraction (XRD; Bruker D8, Bruker GmBH, Karlsruhe, Germany) and Raman spectrometer (RENISHAW inVia 9P1567, Charfield, United Kingdom) were conducted to determine the TNT phase and crystal analysis. UV–visible (UV–Vis) spectrophotometers were used to attain the diffuse reflectance spectra (Cary 5000, UV-Vis-NIR, Agilent, Santa Clara, United States) and conduct the Cr(VI) photoreduction (Varian Cary 50, budd lake, NJ, United States).
For the Cr(VI) removal evaluation, 100 ppm Cr(VI) was prepared by dissolving 0.0283 g of potassium dichromate salt (K2Cr2O7, A.R. grade, Merck, Germany) in 100 mL of deionized water. Then, the Cr(VI) stock solution was diluted to obtain the 5–20 ppm Cr(VI) solution. The pH of the solution was lowered using hydrogen chloride (Merck, Germany). For the hole scavenger, 1 mM of Ethylenediaminetetraacetic acid (EDTA; AJAX Chemicals, Sydney, Australia) was added to the Cr(VI) solution. During the test, four anodized foils with a surface area of 1 × 0.5 cm2 were immersed in the Cr(VI) solution. Before light irradiation, the solution was left in the dark for 30 min to achieve adsorption–desorption equilibrium. The solution was then exposed to sunlight with an average light intensity of ~1000 Wm−2, which was measured with a solar power meter (TM-207, Tenmars, Taiwan, China). During light irradiation, 2 mL of the aliquot sample was withdrawn every 15 min. The reduction of Cr(VI) was determined using 1,5-diphenylcarbazide (Merck, Germany), and, based on the UV–Vis results, the Cr(VI) concentration in the solution was calculated using Equation (14) at λmax = 540 nm:
C r ( V I ) r e m o v a l   e f f i c i e n c y = C C o
where C denotes the concentration of Cr(VI) at a given time (at λmax = 540 nm), and Co is the initial concentration (before sunlight irradiation).

4. Conclusions

In this study, photoreduction of Cr(VI) using anodized TNTs under natural sunlight irradiation was demonstrated. The TNTs were formed by the anodic oxidation of Ti foil in a fluorinated glycerol–water electrolyte. The effects of NH4F concentration in the electrolyte, anodization voltage, anodization duration, and annealing atmosphere (air or nitrogen) on the nanotubes were systematically described. The minimum voltage for TNTs formation was identifiezd as 5 V. To obtain TNT arrays with a clear, open top structure exhibiting a considerable length, anodization must be conducted using an electrolyte with an NH4F concentration of >0.5 wt.% for more than 30 min. A higher NH4F content led to rigorous etching forming irregular TNTs. The diameter of the TNT formed increased with voltage in the range of 10 to 60 V, while anodization at 80 V resulted in the collapse of the tubular structure. TNTs with an average length of ~2 µm were obtained after anodization for 180 min using an applied voltage of 20 V. From the XRD results of the annealed sample in air and nitrogen, the anatase crystallite size obtained was 36.79 and 26.29 nm, respectively. The smaller crystallite size of nitrogen-annealed TNTs is consistent with the obtained Raman results. The bandgaps of both annealed samples were determined using UV–Vis DRS, indicating a smaller bandgap for the nitrogen-annealed TNTs compared to the air-annealed ones. This enabled an enhanced Cr(VI) photoreduction efficiency in the visible light region, especially under natural sunlight irradiation. This was further demonstrated by the reduction of 10 ppm Cr(VI) solution that achieved a complete (100%) removal after 120 min of exposure to natural sunlight with the addition of EDTA as a hole scavenger.

Author Contributions

Conceptualization, S.A.R., N.A. and Z.L.; methodology, S.A.R. and Z.L.; validation, S.A.R., W.K.T., G.K., A.M. and Z.L.; formal analysis, S.A.R., N.A. and Z.L.; investigation, S.A.R., N.A. and Z.L.; resources, Z.L. and W.K.T.; data curation, S.A.R. and Z.L.; writing—original draft preparation, S.A.R.; writing—review and editing, S.A.R., W.K.T. and Z.L.; visualization, S.A.R., N.B. and S.I.; supervision, Z.L.; project administration, W.K.T. and Z.L.; funding acquisition, W.K.T. and Z.L. All authors have read and agreed to the published version of the manuscript.

Funding

This research was funded by the Research University Grant (USM-TUT Collaboration) 1001/PBAHAN/870048.

Data Availability Statement

Not applicable.

Acknowledgments

Research University Grant (USM-TUT Collaboration) 1001/PBAHAN/870048 and support from Universiti Teknologi MARA are also acknowledged. W. K Tan acknowledges the Japan society for KAKENHI Early-Career Scientist JP18K14013 for supporting this research.

Conflicts of Interest

The authors declare no conflict of interest.

References

  1. Karimi-Maleh, H.; Orooji, Y.; Ayati, A.; Qanbari, S.; Tanhaei, B.; Karimi, F.; Alizadeh, M.; Rouhi, J.; Fu, L.; Sillanpää, M. Recent advances in removal techniques of Cr(VI) toxic ion from aqueous solution: A comprehensive review. J. Mol. Liq. 2020, 329, 115062. [Google Scholar] [CrossRef]
  2. Schrank, S.G.; José, H.J.; Moreira, R.F.P.M. Simultaneous photocatalytic Cr(VI) reduction and dye oxidation in a TiO2 slurry reactor. J. Photochem. Photobiol. A Chem. 2002, 147, 71–76. [Google Scholar] [CrossRef]
  3. Shahid, M.; Shamshad, S.; Rafiq, M.; Khalid, S.; Bibi, I.; Niazi, N.K.; Dumat, C.; Rashid, M.I. Chromium speciation, bioavailability, uptake, toxicity and detoxification in soil-plant system: A review. Chemosphere 2017, 178, 513–533. [Google Scholar] [CrossRef] [PubMed]
  4. Rudzi, S.K.; Ho, Y.B.; Abd Khani, I.I. Heavy metals contamination in paddy soil and water and associated dermal health risk among farmers. Malays. J. Med. Health Sci. 2018, 14, 2–10. [Google Scholar]
  5. Hoyer, P. Formation of a titanium dioxide nanotube array. Langmuir 1996, 12, 1411–1413. [Google Scholar] [CrossRef]
  6. Tu, Y.F.; Huang, S.Y.; Sang, J.P.; Zou, X.W. Synthesis and photocatalytic properties of Sn-Doped TiO2 nanotube arrays. J. Alloys Compd. 2009, 482, 382–387. [Google Scholar] [CrossRef]
  7. Yuan, Z.-Y.; Su, B.-L. Titanium oxide nanotubes, nanofibers and nanowires. Colloids Surf. A Physicochem. Eng. Asp. 2004, 241, 173–183. [Google Scholar] [CrossRef]
  8. Kasuga, T.; Hiramatsu, M.; Hoson, A.; Sekino, T.; Niihara, K. Titania nanotubes prepared by chemical processing. Adv. Mater. 1999, 11, 1307–1311. [Google Scholar] [CrossRef]
  9. Abaffy, N.B.; Evans, P.; Triani, G.; McCulloch, D. Multilayer alumina and titania optical coatings prepared by atomic layer deposition. Nanostruct. Thin Films 2008, 7041, 704109. [Google Scholar] [CrossRef]
  10. Yoshimura, N.; Sato, S.; Itoi, M.; Taguchi, H. Electrical properties of TiO2 thin film prepared by sol-gel method. IEEJ Trans. Fundam. Mater. 1991, 111, 117–122. [Google Scholar] [CrossRef] [Green Version]
  11. Venkatachalam, N.; Palanichamy, M.; Murugesan, V. Sol–gel preparation and characterization of nanosize TiO2: Its photocatalytic performance. Mater. Chem. Phys. 2007, 104, 454–459. [Google Scholar] [CrossRef]
  12. Zhao, J.; Wang, X.; Chen, R.; Li, L. Fabrication of titanium oxide nanotube arrays by anodic oxidation. Solid State Commun. 2005, 134, 705–710. [Google Scholar] [CrossRef]
  13. Zwilling, V.; Darque-Ceretti, E.; Boutry-Forveille, A.; David, D.; Perrin, M.Y.; Aucouturier, M. Structure and Physicochemistry of anodic oxide films on titanium and TA6V alloy. Surf. Interface Anal. 1999, 27, 629–637. [Google Scholar] [CrossRef]
  14. Krengvirat, W.; Sreekantan, S.; Noor, A.-F.M.; Negishi, N.; Kawamura, G.; Muto, H.; Matsuda, A. Low-temperature crystallization of TiO2 nanotube arrays via hot water treatment and their photocatalytic properties under visible-light irradiation. Mater. Chem. Phys. 2013, 137, 991–998. [Google Scholar] [CrossRef]
  15. Krengvirat, W.; Sreekantan, S.; Noor, A.-F.M.; Kawamura, G.; Muto, H.; Matsuda, A. Single-step growth of carbon and potassium-embedded TiO2 nanotube arrays for efficient photoelectrochemical hydrogen generation. Electrochim. Acta 2013, 89, 585–593. [Google Scholar] [CrossRef]
  16. Gong, D.; Grimes, C.A.; Varghese, O.K.; Hu, W.; Singh, R.S.; Chen, Z.; Dickey, E.C. Titanium oxide nanotube arrays prepared by anodic oxidation. J. Mater. Res. 2001, 16, 3331–3334. [Google Scholar] [CrossRef] [Green Version]
  17. Choi, J.; Wehrspohn, R.B.; Lee, J.; Gösele, U. Anodization of nanoimprinted titanium: A comparison with formation of porous alumina. Electrochim. Acta 2004, 49, 2645–2652. [Google Scholar] [CrossRef]
  18. Macák, J.M.; Tsuchiya, H.; Schmuki, P. High-aspect-ratio TiO2 nanotubes by anodization of titanium. Angew. Chem. Int. Ed. 2005, 44, 2100–2102. [Google Scholar] [CrossRef] [PubMed]
  19. Tsuchiya, H.; Akaki, T.; Nakata, J.; Terada, D.; Tsuji, N.; Koizumi, Y.; Minamino, Y.; Schmuki, P.; Fujimoto, S. Metallurgical aspects on the formation of self-organized anodic oxide nanotube layers. Electrochim. Acta 2009, 54, 5155–5162. [Google Scholar] [CrossRef]
  20. Lockman, Z.; Sreekantan, S.; Ismail, S.; Schmidt-Mende, L.; MacManus-Driscoll, J.L. Influence of anodisation voltage on the dimension of Titania nanotubes. J. Alloys Compd. 2010, 503, 359–364. [Google Scholar] [CrossRef] [Green Version]
  21. Sreekantan, S.; Lockman, Z.; Hazan, R.; Tasbihi, M.; Tong, L.K.; Mohamed, A.R. Influence of electrolyte pH on TiO2 nanotube formation by Ti anodization. J. Alloys Compd. 2009, 485, 478–483. [Google Scholar] [CrossRef]
  22. Kawamura, G.; Ohmi, H.; Tan, W.K.; Lockman, Z.; Muto, H.; Matsuda, A. Ag nanoparticle-deposited TiO2 nanotube arrays for electrodes of Dye-sensitized solar cells. Nanoscale Res. Lett. 2015, 10, 219. [Google Scholar] [CrossRef] [Green Version]
  23. Lockman, Z.; Ismail, S.; Sreekantan, S.; Schmidt-Mende, L.; MacManus-Driscoll, J.L. The rapid growth of 3 µm long titania nanotubes by anodization of titanium in a neutral electrochemical bath. Nanotechnology 2009, 21, 055601. [Google Scholar] [CrossRef] [PubMed]
  24. Ismail, S.; Lockman, Z.; Ahmad, Z.A. Crystallization of TiO2 Nanotubes Arrays Grown by Anodization of Ti in Organic Electrolyte. Adv. Mater. Res. 2012, 620, 412–417. [Google Scholar] [CrossRef]
  25. Sreekantan, S.; Saharudin, K.A.; Lockman, Z.; Tzu, T.W. Fast-rate formation of TiO2 nanotube arrays in an organic bath and their applications in photocatalysis. Nanotechnology 2010, 21, 365603. [Google Scholar] [CrossRef] [PubMed] [Green Version]
  26. Regonini, D.; Satka, A.; Jaroenworaluck, A.; Allsopp, D.W.E.; Bowen, C.R.; Stevens, R. Factors influencing surface morphology of anodized TiO2 nanotubes. Electrochim. Acta 2012, 74, 244–253. [Google Scholar] [CrossRef] [Green Version]
  27. Liu, Z.; Zhang, X.; Nishimoto, S.; Jin, M.; Tryk, D.A.; Murakami, T.; Fujishima, A. Highly ordered TiO2 nanotube arrays with controllable length for photoelectrocatalytic degradation of phenol. J. Phys. Chem. C 2008, 112, 253–259. [Google Scholar] [CrossRef]
  28. Perillo, P.M.; Rodriguez, D.F. Growth control of TiO2 nanotubes in different physical environments. Nanosci. Methods 2012, 1, 194–200. [Google Scholar] [CrossRef]
  29. Raja, K.; Gandhi, T.; Misra, M. Effect of water content of ethylene glycol as electrolyte for synthesis of ordered Titania nanotubes. Electrochem. Commun. 2007, 9, 1069–1076. [Google Scholar] [CrossRef]
  30. Naghizadeh, S.G.H.A.; Golobostanfard, M.R. Effect of fluoride concentration and water content on morphology of Titania nanotubes in ethylene glycol solution. Adv. Mater. Res. 2014, 829, 907–911. [Google Scholar] [CrossRef]
  31. Song, H.; Cheng, K.; Guo, H.; Wang, F.; Wang, J.; Zhu, N.; Bai, M.; Wang, X. Effect of ethylene glycol concentration on the morphology and catalytic properties of TiO2 nanotubes. Catal. Commun. 2017, 97, 23–26. [Google Scholar] [CrossRef]
  32. Taib, M.A.A.; Razak, K.A.; Jaafar, M.; Lockman, Z. Initial growth study of TiO2 nanotube arrays anodised in KOH/fluoride/ethylene glycol electrolyte. Mater. Des. 2017, 128, 195–205. [Google Scholar] [CrossRef]
  33. Nyein, N.; Tan, W.K.; Kawamura, G.; Matsuda, A.; Lockman, Z. Anodic Ag/TiO2 nanotube array formation in NaOH/fluoride/ethylene glycol electrolyte as a photoanode for dye-sensitized solar cells. Nanotechnology 2016, 27, 355605. [Google Scholar] [CrossRef] [Green Version]
  34. Nyein, N.; Tan, W.K.; Kawamura, G.; Matsuda, A.; Lockman, Z. TiO2 nanotube arrays formation in fluoride/ethylene glycol electrolyte containing LiOH or KOH as photoanode for dye-sensitized solar cell. J. Photochem. Photobiol. A Chem. 2017, 343, 33–39. [Google Scholar] [CrossRef]
  35. Nyein, N.; Zulkifli, M.A.; Tan, W.K.; Matsuda, A.; Lockman, Z. Effect of NaOH Concentration on the formation of TiO2 nanotube arrays by anodic oxidation process for photoelectrochemical cell. Solid State Phenom. 2017, 264, 152–155. [Google Scholar] [CrossRef]
  36. Taib, M.A.A.; Tan, W.K.; Okuno, T.; Kawamura, G.; Jaafar, M.; Razak, K.A.; Matsuda, A.; Lockman, Z. Formation of TiO2 nanotube arrays by anodic oxidation in LiOH added ethylene glycol electrolyte and the effect of thermal annealing on the photoelectrochemical properties. In Proceedings of the International Conference on Nano-Electronic Technology Devices and Materials, 2015 (IC-NET 2015), Selangor, Malaysia, 27 February–2 March 2015; AIP Publishing LLC: Melville, NY, USA, 2016; Volume 1733, p. 020025. [Google Scholar]
  37. Nyein, N.; Lockman, Z.; Matsuda, A.; Kawamura, G.; Tan, W.K.; Oo, T.Z. Formation of TiO2 nanotube arrays in KOH added fluoride-ethylene glycol (EG) electrolyte and its photoelectrochemical response. In Proceedings of the International Conference on Nano-Electronic Technology Devices and Materials, 2015 (IC-NET 2015), Selangor, Malaysia, 27 February–2 March 2015; AIP Publishing LLC: Melville, NY, USA, 2016; Volume 1733, p. 020030. [Google Scholar]
  38. Taib, M.A.A.; Kawamura, G.; Matsuda, A.; Jaafar, M.; Razak, K.A.; Lockman, Z. Synthesis of TiO2 Nanotube Arrays in NaOH Added Ethylene Glycol Electrolyte and the Effect of Annealing Temperature on the Nanotube Arrays to their Photocurrent Performance. Key Eng. Mater. 2016, 701, 28–32. [Google Scholar] [CrossRef]
  39. Taib, M.A.A.; Alias, N.; Jaafar, M.; Razak, K.A.; Tan, W.K.; Shahbudin, I.P.; Kawamura, G.; Matsuda, A.; Lockman, Z. Formation of grassy TiO2 nanotube thin film by anodisation in peroxide electrolyte for Cr(VI) removal under ultraviolet radiation. Nanotechnology 2020, 31, 435605. [Google Scholar] [CrossRef]
  40. Berger, S.; Albu, S.P.; Schmidt-Stein, F.; Hildebrand, H.; Schmuki, P.; Hammond, J.S.; Paul, D.F.; Reichlmaier, S. The origin for tubular growth of TiO2 nanotubes: A fluoride rich layer between tube-walls. Surf. Sci. 2011, 605, L57–L60. [Google Scholar] [CrossRef]
  41. Sahai, A.; Kumar, Y.; Agarwal, V.; Olive-Méndez, S.F.; Goswami, N. Doping concentration driven morphological evolution of Fe doped ZnO nanostructures. J. Appl. Phys. 2014, 116, 164315. [Google Scholar] [CrossRef]
  42. Kumari, R.; Sahai, A.; Goswami, N. Effect of nitrogen doping on structural and optical properties of ZnO nanoparticles. Prog. Nat. Sci. 2015, 25, 300–309. [Google Scholar] [CrossRef] [Green Version]
  43. Ramirez, H.; Medina-Ramirez, I. Photocatalytic Semiconductors; Springer: New York, NY, USA, 2015; p. 117. [Google Scholar]
  44. Morikawa, T.; Asahi, R.; Ohwaki, T.; Aoki, K.; Taga, Y. Band-gap narrowing of titanium dioxide by nitrogen doping. Jpn. J. Appl. Phys. 2001, 40, L561–L563. [Google Scholar] [CrossRef]
  45. Zulkifli, M.A.; Bashirom, N.; Tan, W.K.; Kawamura, G.; Matsuda, A.; Lockman, Z. Rapid TiO2 nanotubes formation in aged electrolyte and their application as photocatalysts for Cr(VI) reduction under visible light. IEEE Trans. Nanotechnol. 2018, 17, 1106–1110. [Google Scholar] [CrossRef]
  46. Murphy, A. Band-gap determination from diffuse reflectance measurements of semiconductor films, and application to photoelectrochemical water-splitting. Sol. Energy Mater. Sol. Cells 2007, 91, 1326–1337. [Google Scholar] [CrossRef]
  47. Tauc, J.; Grigorovici, R.; Vancu, A. Optical properties and electronic structure of amorphous germanium. Phys. Status Solidi B 1966, 15, 627–637. [Google Scholar] [CrossRef]
  48. Davis, E.A.; Mott, N.F. Conduction in non-crystalline systems V. Conductivity, optical absorption and photoconductivity in amorphous semiconductors. Philos. Mag. 1970, 22, 0903–0922. [Google Scholar] [CrossRef]
  49. López, R.; Gómez, R. Band-gap energy estimation from diffuse reflectance measurements on sol–gel and commercial TiO2: A comparative study. J. Sol-Gel Sci. Technol. 2012, 61, 1–7. [Google Scholar] [CrossRef]
  50. Delegan, N.; Daghrir, R.; Drogui, P.; El Khakani, M.A. Bandgap tailoring of in-situ nitrogen-doped TiO2 sputtered films intended for electrophotocatalytic applications under solar light. J. Appl. Phys. 2014, 116, 153510. [Google Scholar] [CrossRef]
  51. Wang, W.; Tadé, M.O.; Shao, Z. Nitrogen-doped simple and complex oxides for photocatalysis: A review. Prog. Mater. Sci. 2018, 92, 33–63. [Google Scholar] [CrossRef]
  52. Sayama, K.; Arakawa, H. Photocatalytic decomposition of water and photocatalytic reduction of carbon dioxide over zirconia catalyst. J. Phys. Chem. 1993, 97, 531–533. [Google Scholar] [CrossRef]
  53. Muñoz, J.; Domènech, X. TiO2 catalysed reduction of Cr(VI) in aqueous solutions under ultraviolet illumination. J. Appl. Electrochem. 1990, 20, 518–521. [Google Scholar] [CrossRef]
  54. Lu, H.; Fan, W.; Dong, H.; Liu, L. Dependence of the irradiation conditions and crystalline phases of TiO2 nanoparticles on their toxicity to Daphnia magna. Environ. Sci. Nano 2016, 4, 406–414. [Google Scholar] [CrossRef]
  55. Sclafani, A.; Herrmann, J.M. Comparison of the photoelectronic and photocatalytic activities of various anatase and rutile forms of titania in pure liquid organic phases and in aqueous solutions. J. Phys. Chem. 1996, 100, 13655–13661. [Google Scholar] [CrossRef]
  56. Botta, S.G.; Navío, J.A.; Hidalgo, M.C.; Restrepo, G.M.; Litter, M.I. Photocatalytic properties of ZrO2 and Fe/ZrO2 semiconductors prepared by a sol–gel technique. J. Photochem. Photobiol. A Chem. 1999, 129, 89–99. [Google Scholar] [CrossRef]
  57. Testa, J.J.; Grela, M.A.; Litter, M.I. Experimental evidence in favor of an initial one-electron-transfer process in the heterogeneous photocatalytic reduction of chromium(VI) over TiO2. Langmuir 2001, 17, 3515–3517. [Google Scholar] [CrossRef]
  58. Sun, B.; Reddy, E.P.; Smirniotis, P.G. Visible light Cr(VI) reduction and organic chemical oxidation by Tio2 photocatalysis. Environ. Sci. Technol. 2005, 39, 6251–6259. [Google Scholar] [CrossRef]
  59. Chakrabarti, S.; Dutta, B.K. Photocatalytic degradation of model textile dyes in wastewater using ZnO as semiconductor catalyst. J. Hazard. Mater. 2004, 112, 269–278. [Google Scholar] [CrossRef]
  60. Shaban, Y.A. Effective photocatalytic reduction of Cr(VI) by carbon modified (CM)-n-TiO2 nanoparticles under solar irradiation. World J. Nano Sci. Eng. 2013, 3, 154–160. [Google Scholar] [CrossRef] [Green Version]
  61. Bashirom, N.; Tan, W.K.; Kawamura, G.; Matsuda, A.; Lockman, Z. Comparison of ZrO2, TiO2, and α-Fe2O3 nanotube arrays on Cr(VI) photoreduction fabricated by anodization of Zr, Ti, and Fe foils. Mater. Res. Express 2020, 7, 055013. [Google Scholar] [CrossRef]
  62. Wang, S.Q.; Bi, B.; Zhao, X.J. Study on photocatalytic reduction of Cr(VI) by fluorine-doped TiO2. Key Eng. Mater. 2017, 727, 841–846. [Google Scholar] [CrossRef]
  63. Liu, L.; Luo, C.; Xiong, J.; Yang, Z.; Zhang, Y.; Cai, Y.; Gu, H. Reduced graphene oxide (rGO) decorated TiO2 microspheres for visible-light photocatalytic reduction of Cr(VI). J. Alloys Compd. 2017, 690, 771–776. [Google Scholar] [CrossRef]
  64. Zhao, Y.; Zhao, D.; Chen, C.; Wang, X. Enhanced photo-reduction and removal of Cr(VI) on reduced graphene oxide decorated with TiO2 nanoparticles. J. Colloid Interface Sci. 2013, 405, 211–217. [Google Scholar] [CrossRef]
  65. Lei, X.; Zhang, Z.; Wu, Z.; Piao, Y.; Chen, C.; Li, X.; Xue, X.; Yang, H. Synthesis and characterization of Fe, N and C tri-doped polymorphic TiO2 and the visible light photocatalytic reduction of Cr(VI). Sep. Purif. Technol. 2017, 174, 66–74. [Google Scholar] [CrossRef]
  66. Rahmat, S.; Tan, W.K.; Kawamura, G.; Matsuda, A.; Lockman, Z. Facile fabrication of rGO/rutile TiO2 nanowires as photocatalyst for Cr(VI) reduction. Mater. Today Proc. 2019, 17, 1143–1151. [Google Scholar] [CrossRef]
  67. Djellabi, R.; Ghorab, F.M.; Nouacer, S.; Smara, A.; Khireddine, O. Cr(VI) photocatalytic reduction under sunlight followed by Cr(III) extraction from TiO2 surface. Mater. Lett. 2016, 176, 106–109. [Google Scholar] [CrossRef]
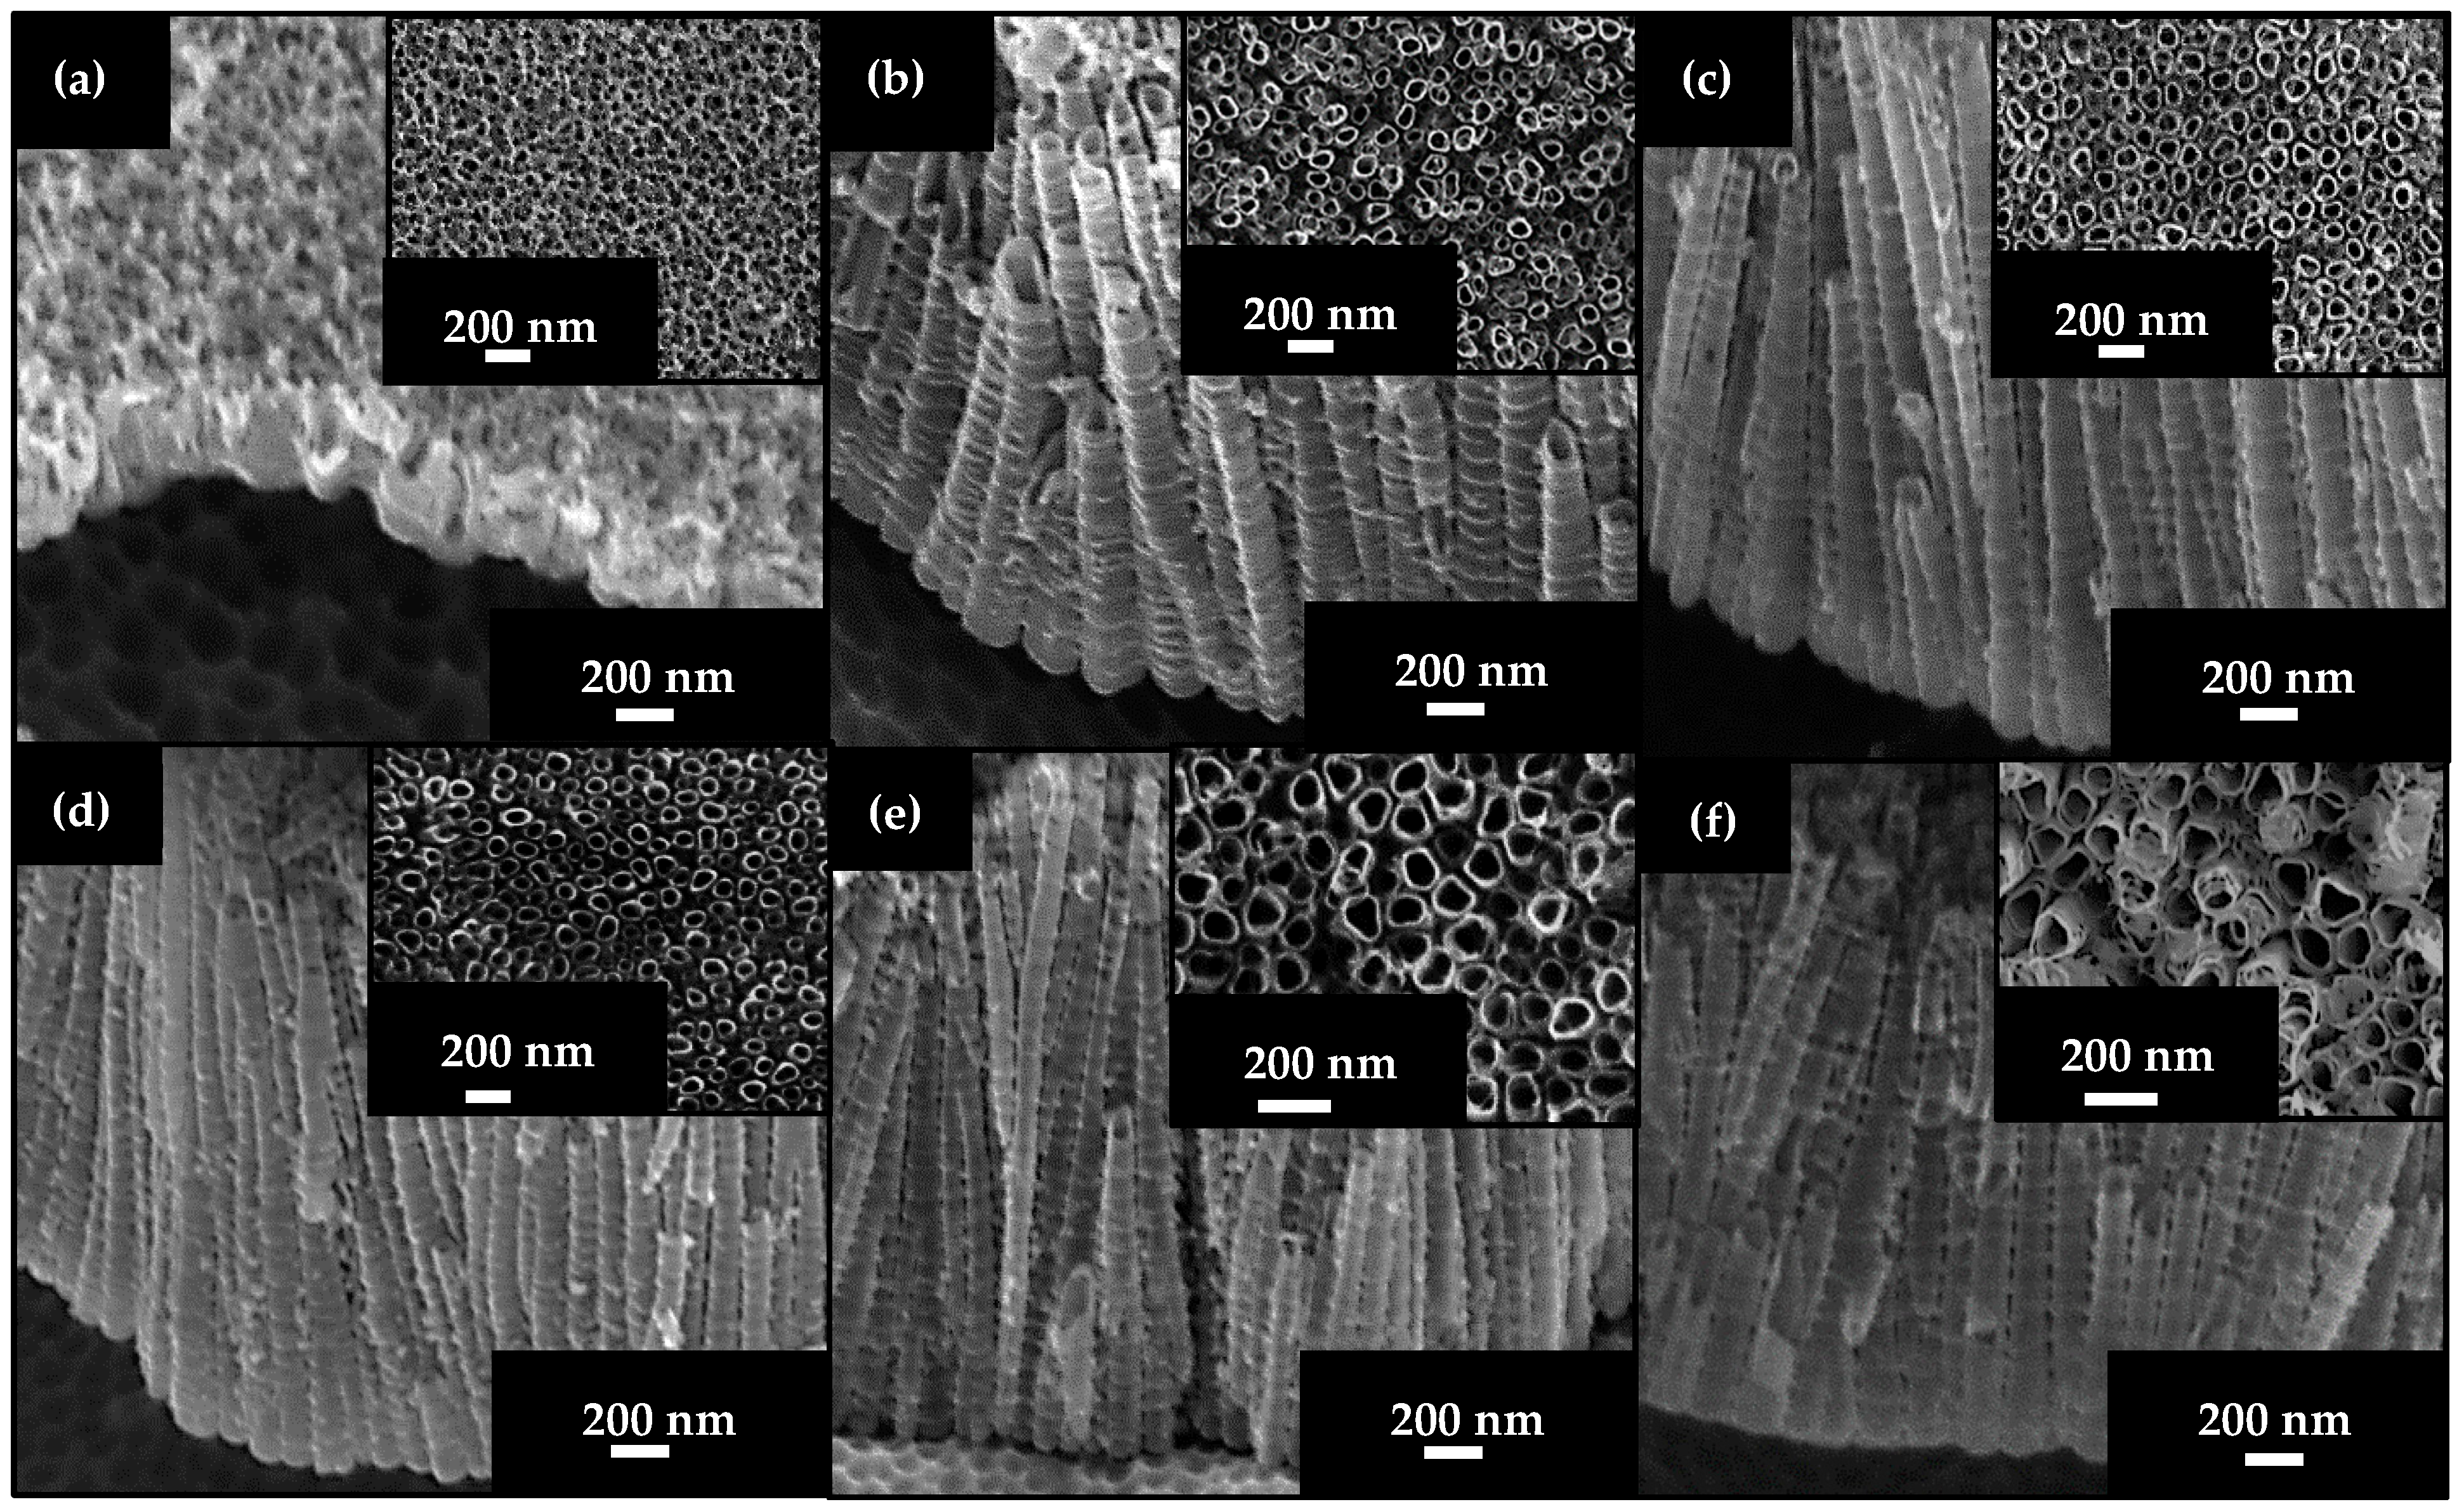
Figure 1. FESEM of anodized TiO2 at 20 V for 90 min in the glycerol–water electrolyte with different NH4F concentrations: (a) 0.1, (b) 0.3, (c) 0. 5, (d) 0.7, (e) 0.9, and (f) 1.0 wt.%.
Catalysts 11 00376 g001
Figure 2. Anodic TiO2 formed at 20 V for 90 min in the glycerol–water electrolyte with different NH4F concentrations: 0.1, 0.3, 0.5, 0.7, 0.9, and 1.0 wt.%.
Catalysts 11 00376 g002
Figure 3. FESEM images of anodized TiO2 at different voltages: (a) 1, (b) 3, (c) 5, (d) 10, (e) 15, (f) 20, (g) 30, (h) 40, (i) 60, and (j) 80 V. Surface morphology views: Figure (c) i, (d) i, (e) i, (f) i, (g) i, (h) i and (i) i and cross-sectional views: Figure (c) ii, (d) ii, (e) ii, (f) ii, (g) ii, (h) ii and (i) ii. TEM images for the 20 V sample (k) bottom, and (l) to show serrated walls. All anodization was performed in glycerol-water electrolyte added to it 0.5 wt.% NH4F electrolyte for 90 min.
Catalysts 11 00376 g003
Figure 4. Anodic film formation features (NH4F = 0.5 wt.%, time = 90 min) at 1, 3, 5, 10, 15, 20, 30, 40, 60, and 80 V in a water–glycerol electrolyte.
Catalysts 11 00376 g004
Figure 5. Figure 5. FESEM images of the anodized TiO2 at different anodization times: (a) 1, (b) 15, (c) 30, (d) 60, (e), 90 (f) 120, (g) 180, (h) 360, and (i) 720 min. All anodization was performed at 20 V in glycerol-water added to it 0.5 wt.% NH4F.
Catalysts 11 00376 g005
Figure 6. Titanium–dioxide (TiO2) nanotube (TNT) features formed (NH4F = 0.5 wt.%, voltage = 20 V) for 1, 15, 30, 60, 90, 120, 180, 360, and 720 min. All anodization was performed at 20 V in glycerol-water added to it 0.5 wt.% NH4F.
Catalysts 11 00376 g006
Figure 7. (a) XRD patterns for (i) as-anodized TNTs (20 V) and TNTs anodized in (ii) air and (iii) nitrogen. (b) Enlarged XRD patterns for anatase (011) peak. Annealing was conducted at 450 °C for 3 h.
Catalysts 11 00376 g007
Figure 8. (a) Raman spectra for TNTs annealed in (i) air and (ii) nitrogen. (b) Enlarged Raman patterns for anatase peak at 144 cm−1. Annealing was conducted at 450 °C for 3 h.
Catalysts 11 00376 g008
Figure 9. Experimental bandgap estimated using Kubelka–Munk diffuse reflectance solid state UV–Vis equation for TNTs annealed in nitrogen and air.
Catalysts 11 00376 g009
Figure 10. Cr(VI) removal efficiency of the TNTs annealed in nitrogen and air under natural sunlight irradiation (Cr(VI) concentration = 10 ppm, pH = 1, sample = 2 cm2).
Catalysts 11 00376 g010
Figure 11. Proposed mechanism of Cr(VI) photoreduction of TNTs under sunlight irradiation.
Catalysts 11 00376 g011
Figure 12. Photoreduction efficiency of nitrogen-annealed TNTs with EDTA and different Cr(VI) concentrations under natural sunlight for 120 min.
Catalysts 11 00376 g012
Figure 13. (a) Graph of –ln(C/Co) vs. time and the reduction reaction rate constants for TNTs annealed in air and nitrogen with and without EDTA. (b) Graph of –ln(C/Co) for reduction of Cr(VI) in various initial concentrations. Both experiments were conducted by sunlight irradiation for a Cr(VI) solution with a pH level of 1.
Catalysts 11 00376 g013
Table 1. Calculated ECB, EVB and Eg of TNTs annealed in nitrogen and air compared with anatase TiO2 from [55].
SampleEg (eV)EVB (eV)ECB (eV)
Anatase TiO23.202.91−0.29
TNTs-Air3.052.84−0.22
TNTs-N22.992.81−0.19
Table 2. Comparison of obtained Cr(VI) reduction efficiency with recent studies under UV–Vis light irradiation (RGO = reduced graphene oxide; C = carbon; N2 = nitrogen).
PhotocatalystMethodSample SizeScavengerpHCr(VI) Conc. (ppm)Source of Light Removal Efficiency (%)Time (h)Ref.
TNTs-N2Anodization1 cm225 Natural sunlight805[45]
TNTs-AirAnodization1 cm2210 Natural sunlight103[61]
TNTs-N2Anodization2 cm2110 Natural sunlight372Current work
TNTs-FluorineSol–gel2.58Fluorescent lamp902[62]
TiO2-5%RGOHydrothermal210 Solar983[63]
TiO2/RGOSol–gel2.612Mercury lamp86.54[64]
0.30wt.%Fe-N-C-TiO2Hydrothermal220 Xenon lamp1004[65]
C-Modified n-TiO2Sol–gelPhenol (10 mM)55 Natural sunlight1000.33[60]
TiO2NW-RGOAnodization4 cm2EDTA (1 mM)110 Xenon lamp1001[66]
P25 DegussaTartaric acid (6 mM)2.220 Natural sunlight1002[67]
TNTs-N2Anodization2 cm2EDTA (1 mM)110 Natural sunlight1002Current work
Publisher’s Note: MDPI stays neutral with regard to jurisdictional claims in published maps and institutional affiliations.