Review

Sonochemical and Sonoelectrochemical Production of Energy Materials

1
Hydrogen Energy and Sonochemistry Research Group, Department of Energy and Process Engineering, Norwegian University of Science and Technology (NTNU), NO-7491 Trondheim, Norway
2
Department of Electronic Systems & ENERSENSE, Norwegian University of Science and Technology (NTNU), NO-7491 Trondheim, Norway
*
Author to whom correspondence should be addressed.
Catalysts 2021, 11(2), 284; https://doi.org/10.3390/catal11020284
Submission received: 6 January 2021 / Revised: 16 February 2021 / Accepted: 17 February 2021 / Published: 21 February 2021
(This article belongs to the Special Issue Catalysis Under Ultrasonic Irradiation)

Abstract

:
Sonoelectrochemistry is the combination of ultrasound and electrochemistry which provides many advantages in electrochemistry, such as fast reaction rates, surface cleaning and activation, and increased mass transport at an electrode. Due to the advantages, some efforts have been made in order to benefit sonoelectrochemistry in the field of energy and environmental engineering. This review paper highlights the developed progress of the application of sonoelectrochemistry in the production of hydrogen, electrocatalyst materials and electrodes for fuel cells and semiconductor photocatalyst materials. This review also provides the experimental methods that are utilized in several sonoelectrochemical techniques, such as different set-ups generally used for the synthesis of energy-related materials. Different key parameters in the operation of sonoelectrochemical synthesis including ultrasonication time, ultrasound frequency and operation current have been also discussed. There are not many research articles on the sonoelectrochemical production of materials for supercapacitors and water electrolyzers which play crucial roles in the renewable energy industry. Therefore, at the end of this review, some articles which have reported the use of ultrasound for the production of electrocatalysts for supercapacitors and electrolyzers have been reviewed. The current review might be helpful for scientists and engineers who are interested in and working on sonoelectrochemistry and electrocatalyst synthesis for energy storage and energy conversion.

1. Introduction to Sonoelectrochemistry

Ultrasound is a sonic wave with frequencies above the audible range of humans. It is divided into two categories: (i) high-frequency low-power ultrasound; high ultrasonic frequencies of 2–20 MHz with low power intensities (0.1–1 W·cm−2) have been used in medical imaging, food quality analysis and non-destructive material inspection; and, (ii) low-frequency high-power ultrasound; Power ultrasound refers to acoustic waves with low frequencies between 20 to 100 kHz and high power intensities of 10–1000 W·cm−2 [1]. Many applications of power ultrasound are based on acoustic cavitation, in which microbubbles in solution form, grow and then collapse. The collapsing bubble event is a microscopic implosion that generates high local turbulence and thermal energy. Moreover, the collapsing bubble can generate a high temperature up to 5000 °C and high pressure up to 2000 atm [2,3]. The evolution of a cavitation bubble during ultrasonication is shown in Figure 1.
Sonoelectrochemistry is the combination of ultrasound with electrochemistry [4]. Figure 2 shows a schematic diagram of a sonoelectrochemical reactor set-up. Ultrasound is transmitted using an ultrasonic bath or probe. The ultrasonic probe can be either directly immersed in the electrolyte or separated from it. When an ultrasonic probe is separated from the electrolyte, an inner electrochemical cell is used, as shown in Figure 2. In both cases, an ultrasonic horn should face the working electrode surface, known as “face-on” geometry.
Ultrasound affects both heterogeneous systems (thermodynamic systems consisting of two or more phases) consisting of the electrode and the electrolyte and homogeneous systems (systems whose chemical composition and physical properties are the same in all parts of the systems) that take place in the bulk electrolyte, which may experience extreme conditions by acoustic cavitation. The sonochemical effect caused by acoustic cavitation may lead to new reaction mechanisms [4].
The utilization of ultrasound in electrochemistry offers many advantages including [4]:
  • Gas bubble removal at the electrode surface;
  • Solution degassing;
  • The disruption of the Nernst diffusion layer;
  • The enhancement of the mass transport of electroactive species through the double layer; and,
  • The activation and cleaning of the electrode surface.
Table 1 summarizes the major influencing factors of ultrasound on electrochemistry.
Despite its promising applications, sonoelectrochemistry has not been used widely. There are some difficulties in carrying out experiments using both ultrasound and electrochemical processes including the positioning of the electrode, cell geometry, and ultrasonic horn tip/electrode distance. Furthermore, the impacts of ultrasound parameters such as frequency and acoustic power should be considered. However, recently, this field is regaining attention because of the advances made in sonochemical and electrochemical equipment [9]. For example, the use of ultrasound in water electrolysis technology for hydrogen (and oxygen) production, has been shown to improve the energy efficiency of the water electrolysis process [10,11].
Recently, the use of ultrasound for the synthesis of materials, especially nanostructured materials for fuel cells, electrolyzers, supercapacitors and semiconductors catalysts has provided many advantages in terms of simplicity, efficiency, rapidity and environmentally-friendliness [12,13,14,15,16]. Several studies have also illustrated that the shape and size of particles can be easily controlled by ultrasonication time, power and frequency [12,13,17,18].
In this review paper, we introduce the current use of sonoelectrochemistry in hydrogen production, synthesis of electrocatalysts and electrodes for fuel cells and the production of semiconductor and supercapacitor catalysts. In addition, different sonoelectrochemical set-ups and syntheses have been provided and very briefly discussed.

2. Sonoelectrochemical Production of Hydrogen

Developing cost-effective energy storage technologies to use low-cost electricity from renewable energy technologies is essential to meet the decarbonization of our energy systems [19]. Large-scale energy storage plays an important role in resolving problems related to peak energy consumption and production typically being out of phase (known as the duck curve) [20,21]. Energy storage is a feasible solution for smoothing out the duck curve that allows energy to be generated when it is available and sent out when and where it is needed [20].
Hydrogen energy systems are considered to be essential for long-term energy storage and conversion technology to solve global environmental problems [22]. Renewable energy can be used in relation to hydrogen in several ways [9]:
  • Converting excess electricity into hydrogen (energy carrier) and converting it back into electricity when and where required. This entails hydrogen storage for renewable electricity;
  • Mixing electrolytic hydrogen with natural gas or converting it to methane, as this allows for the hydrogen to be stored in the existing gas grid;
  • Converting excess electricity to hydrogen, which can be used for industrial processes, and,
  • Using excess electricity for hydrogen production and then using the hydrogen produced as a clean fuel for use in the transport sector.
Water electrolysis is one of the most important technologies in such a system. Electrochemical water splitting involves two half-cell reactions: hydrogen evolution reaction (HER) at the negative electrode (cathode); and oxygen evolution reaction (OER) at the positive electrode (anode). Table 2 shows the main half-cell reactions in alkaline and acidic electrolytes.
The cell voltage for water splitting is considerably higher than the thermodynamic decomposition voltage due to high overpotentials, especially for the OER. In addition to the anode and cathode overpotentials, the ohmic cell voltage drop from the presence of the gas bubbles in the solution and at the electrode surface contributes to high energy consumption [3,23]. The total ohmic resistance of water electrolysis is shown in Equation (1) [3].
R = R e + R m + R b + R c
where Re is the electrolyte resistance, Rm is the membrane resistance, Rb is the bubble resistance and Rc is the circuit resistance. The Rm and Rc are constant in an electrolytic cell and can be reduced by optimizing the wire connection and production process of the membrane. The dispersion of the bubbles in the electrolyte decreases the electrolyte conductivity and in turn increases Re. Besides, the bubble coverage on the surface of the electrode act as a shield for the electric field, leading to high bubble resistance Rb (also termed in the industry as bubble “overpotential”) [3,24].
The cathodic and anodic overpotentials can be reduced by applying an efficient electrocatalyst on to the electrodes and/or operating the cell at higher temperatures (65–80 °C) [23]. The efficiency of water electrolysis can be increased by controlling the following factors: (a) the more effective disengagement of gas bubbles from the electrodes and the membranes, thereby virtually eliminating gas blanketing; (b) making gas bubble removal more effective from the electrolyte, even with very small electrode spacing; and, (c) promoting faster removal of the gas bubbles at the electrode surface to increase the local heat/mass transfer coefficients [22].
Experimental observations have shown that the electrochemical production of hydrogen can be improved significantly by using power ultrasound through [25]:
  • Enhancing mass transport in the bulk electrolyte and near the surfaces;
  • Cleaning and activation of surfaces; and,
  • Changing reaction pathways caused by sonochemical effects.
Figure 3 shows a simplified water electrolyzer (containing a protonic conducting membrane) subjected to ultrasound (probe). Figure 3b illustrates the accumulation of hydrogen bubbles on the cathode and oxygen bubbles on the anode, leading to high ohmic resistance and cathodic and anodic overpotentials. The removal of hydrogen and oxygen bubbles from the electrode surfaces by applying ultrasound is shown in Figure 3c. Water electrolysis in presence of ultrasound was first observed by Moriguchi in the 1930s using a platinum (Pt) electrode, which occurred at faster rates and lower cell voltages than under silent conditions [3,26]. The sonoelectrochemical production of hydrogen was then continued by Pollet’s research group at the Birmingham Proton Exchange Membrane Fuel Cell in 2011 [9]. For example, Lepesant [27] and other researchers such as Zadeh [28] and Symes [29], under the supervision of Pollet, studied the influences of ultrasound on electrolytic hydrogen production from weak acidic (H2SO4) and alkaline (NaOH and KOH) solutions using various electrode materials including platinum (Pt), industrial carbon (C), glassy carbon (GC) and 316 stainless steel (316-SS). Our recent work at the Norwegian University of Science and Technology (NTNU) Hydrogen Energy and Sonochemistry research group investigated the effects of ultrasound on the hydrogen evolution reaction in the mild acidic electrolyte on polycrystalline Pt [30]. It was found that all the results are in agreement and showed that power ultrasound increased the rate of hydrogen production. For example, our group showed a 250% enhancement in current density at maximum acoustic power (29.2 W·cm−2) through effective hydrogen bubble removal as indicated by the ultra-fast camera imaging experiments (Figure 4) [30].
Li et al. [22] studied the effects of power ultrasound on water electrolysis in different NaOH concentrations. They found that the energy efficiency of water electrolysis was considerably improved in the presence of an ultrasonic field. This was observed by measuring the cell voltage, the efficiency and the energy consumption of the generated gas from the electrolytic process. A large reduction of the cell voltage was observed under the ultrasonic field, especially at high current densities and low electrolyte concentrations. At the same current density, the cell voltage difference under silent and ultrasonic conditions fell as the concentration of the electrolyte was increased. It was also observed that the efficiency of hydrogen production was enhanced by 5–18% at high current densities under acoustic conditions. Overall, the energy-saving for molecular hydrogen production by using an ultrasonic field was about 10–25% for specific electrolyte concentrations and when a high current density was employed.
Lin et al. [11] investigated the ultrasonic effects on hydrogen production by water electrolysis. In their study, they carried out an electrochemical impedance spectroscopy (EIS) to examine the polarization impedance phenomena in ultrasonic water electrolysis (Figure 5). For the first time, EIS was used to analyze the electrochemical reaction during water electrolysis. They found that at a cell voltage of 2 V, ultrasound improved the activity and concentration impedances and accelerated the detachment of hydrogen bubbles during water electrolysis. At room temperature, and with an electrode gap of 2 mm, a cell voltage of 4 V, and an electrolyte concentration of 40 wt%, the difference in current density between water electrolysis carried out in the absence and presence of ultrasound (225 W) was 240 mA·cm−2. They deduced that the power required for the sonoelectrolytic process showed a power saving of 3.5 kW and an efficiency saving of 15%.
Budischak et al. [10] also studied the effects of ultrasound on HER in 2 M KOH using Pt as a working electrode. Their results illustrated that ultrasound can significantly improve the efficiency of an electrolyzer, especially at intermediate current densities.
Until now, only a few fundamental investigations have been carried out in the field of the sonoelectrochemical production of hydrogen. There has not been much focus on systematic investigations of the effects that various sonoelectrochemical experimental parameters have on processes, such as ultrasonic power, ultrasonic frequency, electrolyte type and concentrations, electrode materials and reactor design. Furthermore, the mechanism of the HER under ultrasonication is still ambiguous. A major problem for practical applications is the electrode erosion and material stability (e.g., the polymeric membrane) under ultrasonication, which may hinder the life of a sonoelectrochemical system. Moreover, an extended investigation on the integration of sonolysis and electrocatalysis processes for large scale hydrogen production via water splitting should be performed [9].

3. Sonoelectrochemical Synthesis of Electrocatalyst for Fuel Cells

A fuel cell is an electrochemical device that converts the chemical energy of a fuel (methanol, hydrogen or natural gas) and an oxidant (pure oxygen or air) into electricity in the presence of an electrocatalyst. Fuel cells based on the choice of fuel and electrolyte can be classified into six types [14]:
  • Proton exchange membrane fuel cell (PEMFC);
  • Direct methanol fuel cell (DMFC);
  • Alkaline fuel cell (AFC);
  • Phosphoric acid fuel cell (PAFC);
  • Molten carbonate fuel cell (MCFC), and,
  • Solid oxide fuel cell (SOFC).
Table 3 shows a summary of operational specifications of different fuel cell technologies.
Currently, fuel cell systems are too expensive and are not durable. However, there are several methods to reduce the cost and efficiency of a fuel cell by [14]:
  • Decreasing the catalyst loading in fuel cell electrodes;
  • Decreasing the catalyst nanoparticle size;
  • Developing metallic alloy electrocatalysts;
  • Developing Pt-free and PGM (platinum group metal)-free electrocatalysts;
  • Using novel fabrication methods to synthesize catalysts and producing better catalyst dispersion on fuel cell electrodes;
  • Developing fuel cell electrode fabrication methods, enabling better catalyst dispersion and utilization, and,
  • Using new techniques to increase mass transport at the fuel cell electrode surface.
Using ultrasound is one of the most promising methods for producing and performing efficient fuel cell catalysts, electrodes and electrolyte materials. For example, Pollet [33] and very recently Hansen et al. [18] demonstrated that ultrasound can be used to produce precious metal catalysts for low temperature PEMFC. In his comprehensive review [14], Pollet also showed that the ultrasonication, sonochemical, and sonoelectrochemical methods can be used to produce efficient catalyst nanoparticles, carbon-supported electrocatalysts, and fuel cell and electrolyzer electrodes due to the enhanced mass transport phenomenon, cavitation, and water sonolysis [14,34,35]. The sonoelectrochemical method is a simple, fast, and effective way for the synthesis of nanostructured materials [12,13]. Figure 6 shows a sonoelectrochemical set-up modified by Zin, Pollet, and Dabalà [36] from Reisse’s original set-up by only using the vibrating tip of the ultrasonic probe as the cathode—“sonoelectrode”. In this method, an electric current pulse is applied to nucleate and carries out the electrodeposit, followed by a short burst of ultrasonic energy (e.g., 20 kHz) to remove the products from the ultrasonic probe (horn or sonifier) cathode, clean the cathode surface, and replenishes the double layer with fresh metallic ions by a highly efficient stirring of the electrolyte solution. During the ultrasonic process, the surface state and the morphology of the nanoparticles, falling from the cathode, changes under the remarkable ultrasonic conditions [37].
The shape and size of these nanomaterials can also be controlled by adjusting various parameters such as the current density, time of deposition and ultrasonication, temperature, ultrasonic power, surfactants and concentration of reagents [12,13]. Shen et al. [13] developed a simple sonoelectrochemical method for the synthesis of dendritic Pt nanostructures (DPNs) for methanol oxidation. The DPNs showed higher electrocatalytic activity towards the methanol oxidation reaction (MOR) than the monodisperse Pt nanoparticles due to the porosity structure and the greatly enhanced effective surface area. They showed that the current density has a great effect on the morphology of obtained Pt nanostructures.
Figure 7 [13] shows the TEM images of Pt nanostructures obtained at different current densities. As it can be seen in Figure 7, higher current densities lead to the agglomeration of the particles because at these current densities, the reduction rate of Pt4+ increases and the nucleation rate is faster than that of the growth, and the enhanced reduction rates yield the generation of more nuclei as well as the formation of smaller primary Pt nanoparticles. As building blocks, these Pt nanoparticles favor the assembly and formation of the DPNs. They also investigated the effects of the ultrasonication time on the evolution of nanostructure morphology. The TEM images of these samples are shown in Figure 8 [13]. When the reaction time was 10 min, individual nanoparticles were observed with diameters of about 2.5 nm (Figure 8a). At 30 min of reaction, the small 3D dendritic structures formed due to the attachment and assembly of primary nanoparticles (Figure 8b). When the reaction time was prolonged to 60 min, the 3D dendritic structures grew continuously, and the percentage of the dendritic nanostructures was prevailing (Figure 8c). As the reaction time reached 90 min, the 3D dendritic nanostructures were fully developed and showed a uniform spherical morphology (Figure 8d).
In the other study, Shen et al. [12] synthesized palladium (Pd) nanostructured by the simple sonoelectrochemical method characterized the electrocatalytic activity of the Pd nanostructure towards the ethanol electrooxidation. They also investigated the effect of pH on the size and morphology of Pd nanostructures. The different pH values of the Pd solution resulted in different existing forms of the Pd complex and, therefore, led to different reduction rates of palladium [12]. The higher pH values resulted in slower reduction rates and, therefore, led to smaller Pd nanoparticles [12,38].
Zin et al. [36] for the first time synthesized Pt nanoparticles from aqueous chloroplatinic solutions in the presence of low-frequency high-power ultrasound (20 kHz). They demonstrated that pure Pt metallic nanoparticles were produced sonoelectrochemically. Furthermore, they observed that ultrasonication enabled the production of Pt nanoparticles of high purity, controlled structures and homogenous nanometric crystalline sizes.
There are different methods for the synthesis of platinum group metal (PGM) nanoparticles supported on carbon (and other conductive support materials [34]) such as: the impregnation, the sputtering, the electrodeposition, the colloidal, and the ion-exchange methods [39]. Karousos et al. [17] synthesized Pt/C (platinum on carbon black) nanocomposite by a novel process, combining galvanostatic pulsed electrodeposition and pulsed ultrasonication with high power, low-frequency (20 kHz) ultrasound for PEMFC (Figure 9). They showed that the current pulse amplitude is the most critical nanoparticle size-determining parameter, while only particles under 10 nm attached to carbon black. They also observed that with a low current density the particle size was large, while at a higher current density the formation of smaller metallic nanoparticles was favored. This phenomenon can be explained by the action of diffusion. During a shorter reduction time, metallic cluster growth evolves quickly due to reduction from the solution on several spots of the sonoelectrode. For longer reduction times, close metallic clusters have the chance to grow due to two-dimensional surface diffusion, yielding larger NPs [17].

4. Sonoelectrochemical Production of Electrodes for Fuel Cells

Electrodes for both PEMFCs, DMFCs (and proton exchange membrane water electrolyzers—PEMWEs) usually consist of deposited catalyst ink on either carbonaceous, polymeric and other material substrate. The catalyst ink usually consists of a PGM/C or PGM/MO (metal oxide) mixed with a solid polymer electrolyte (e.g., Nafion®) [40]. In order to increase the performance of the electrodes (i.e., the “true” catalyst surface area), it is necessary to either (a) increase the catalyst layer thickness for a given PGM catalyst loading or (b) increase the amount of PGM catalyst in the catalyst layer [40].
One of the most promising methods to increase the active site of Pt and effective use of Pt as an electrocatalyst is to deposit PGMs on conductive substrates electrochemically from commercial plating baths [40,41]. However, in view of increasing the PGM utilization, it was shown that the rate-determining step of PGM electrodeposition is controlled by mass transport [40,41]. One of the many ways to increase mass transport in such processes is to use efficient stirring or forced convection in the form of ultrasound [42].
Pollet [33] reported the use of ultrasound for the fabrication of PEMFC electrodes for the first time. He synthesized platinum loaded on Nafion®-bonded carbon anodes in membrane electrode assemblies (MEAs) by galvanostatic pulse electrodeposition in the absence and presence of ultrasound (20 kHz). He found that the sonoelectrochemically synthesized PEMFC electrodes exhibited better performance compared to those prepared by (a) the galvanostatic pulse method only (i.e., silent conditions) or (b) other conventional methods. He also found maximum power densities of 98.5 mW·cm−2 for anodes prepared sonoelectrochemically, compared with 91.5 mW·cm−2 (by the galvanostatic pulse method alone) and 86 mW·cm−2 (by the conventional method) (Figure 10) [33].
A great difference in the catalytic layer can be detected from the SEM images (Figure 11) [33]. As it can be seen from Figure 11a, the galvanostatic pulse method leads to agglomerated Pt and uneven surfaces which may decrease the amount of Pt particles taking part in the reaction. In comparison, the sono-galvanostatic pulse method (Figure 11b) leads to uniformly distributed Pt (with no clusters) resulting in a homogenous layer along the gas diffusion layer (GDL); leading to (a) a compact electrodeposit that may decrease the PEMFC electrode porosity (induced by ultrasonication), (b) improved access to reactants to Pt sites and, (c) consequently to a better Pt utilization and higher performance. It has been proven that employing ultrasound in an electroplating bath leads to an increase in metallic electrodeposit thickness, porosity and hardness due to: (a) the formation of metallic small grain size leading to an increase in dislocation density and (b) hydrogen bubbles’ removal within the metallic electrodeposit by the collapse of cavitation bubbles and the intense acoustic streaming at the electrode surface [15].
Pollet et al. [43] performed the electrodeposition of Pt on glassy carbon (GC) and gas diffusion layer (GDL) surfaces in dilute chloroplatinic acid solutions (10 mM PtCl 4 2 in 0.5 M NaCl) potentiodynamically under silent and ultrasonic conditions (20 kHz) at different ultrasonic powers (up to 6 W) (Figure 12). According to their study, currents (GC only) increased by eightfold at the maximum ultrasonic power compared to silent conditions. In addition, positive shifts in electrode potentials were observed under ultrasonic conditions that might be attributed to a decrease in concentration and nucleation overpotentials. They also found that the Pt deposit characteristics on GC under silent conditions differed greatly from ultrasonic conditions. Pt utilizations were found to decrease under forced agitation and were attributed to larger or/and agglomeration of catalyst nanoparticles. Furthermore, voltametric analyses of Pt/GC in acid prepared in the presence of ultrasound above 2.3 W showed no hydrogen adsorption and desorption peaks. However, it was found that electrodeposited Pt on GDL samples under ultrasound led to smaller Pt particle sizes (<200 nm) compared to silent conditions (ca. 0.9–1 mm). These observations were attributed to the implosion of cavitation bubbles at the GC and GDL surfaces enabling the “deagglomeration” of Pt nanoparticles or/and activating nucleation sites for Pt [43].

5. Sonoelectrochemical Production of Semiconductor Photocatalysts

Semiconductor photocatalysis with a primary focus on titanium dioxide (TiO2) as a durable photocatalyst has been developed for water photo-splitting to produce hydrogen [44]. Water splitting by the photocatalytic process involves UV radiation or sunlight and semiconductor photocatalytic materials. Upon illumination with light, the electrons (e) in the valence band (VB) of the semiconductor photocatalysts are photoexcited to the conduction band (CB), while the holes (h+) remain in the VB. The difference in energy between the VB and CB is named the bandgap energy, which must correspond to the wavelength of light for semiconductor photocatalysts to effectively absorb light. After photoexcitation, the e and h+ are separated and migrate to the photocatalyst surface. Herein, the water-splitting reaction takes place, and they act as an oxidizing and reducing agent to generate O2 and H2, respectively. In order to facilitate the oxidation and reduction of water, the VB and CB potentials are also important. Both the oxidation and reduction potentials of H2O should lie within the photocatalyst bandgap. The lower level of the CB should be more negative than the reduction potential of H+/H2 (0.00 V vs. SHE), while the upper level of the VB should be more positive than the oxidation potential of O2/H2O (1.229 V vs. SHE) [9].
Mohapatra et al. [45] synthesized well-ordered and robust TiO2 nanotubular arrays via sonoelectrochemistry. They found that self-ordered arrays of TiO2 nanotubes with the diameter of 30–100 nm and length of 300–1000 nm can be synthesized under an applied potential of 5–20 V. Figure 13 shows the sonoelectrochemical set-up of their work. They also found that the rate of formation of the TiO2 nanotubes by the sonoelectrochemical method is almost twice as fast as the magnetic stirring method. They demonstrated that high-quality nanotubes can be prepared using high viscous solvents such as ethylene glycol under ultrasonic treatment. The TiO2 nanotubes prepared in the organic electrolytes (ethylene glycol) are then annealed under H2 atmosphere to give incorporated carbon into the Titania nanotubes (TiO2xCx)-type materials with a bandgap of around 2.0 eV. They found this process to be highly efficient for incorporating carbon into TiO2 nanotubes. They also characterized the photoelectrocatalytic activity of these materials towards the HER and were found to have better activity than materials prepared by the magnetic stirring technique [45].
Wang et al. [15] synthesized TiO2 nanotube arrays (TiO2NTs) functionalized with CdS nanoparticle-based perfusion and deposition through a single-step sonoelectrodeposition method. They obtained even, controlled at 50 °C CdS nanoparticles with a smaller size and more homogeneous distribution in dimethyl sulfoxide (DMSO) under ultrasonic irradiation. Moreover, TiO2 nanotubes can be filled with nanoparticles because of the ultrasonic effect. They found that the CdS–TiO2NTs prepared by traditional electrodeposition displayed an enhanced photocurrent compared to CdS–TiO2NTs prepared by the sonoelectrodeposition. In the coupled semiconductor system, the small band-gap semiconductor CdS acted as a photosensitizer for the TiO2. An enhanced photocatalytic reaction can occur through the transfer of the photoexcited electron from the CdS nanoparticle to the TiO2 nanotube. The application of the sonoelectrochemical technique leads to better solar light harvest in the visible light region [15]. Therefore, the sonoelectrochemical method is a promising method to fabricate excellent composite materials at lower temperatures in the organic solvent [15]. A proposed schematic diagram of the possible process of CdS formation in nanotubes under sonochemical and electrochemical conditions is illustrated in Figure 14 [15].

6. The Use of Ultrasound for the Synthesis of Electrocatalysts for Supercapacitors

Supercapacitors are alternative energy and power storage devices that can be intensely discharged without affecting their lifetime. They have gained attention due to their high energy density as compared to conventional capacitors and high power density compared to batteries [16,46]. In this regard, one of the most significant research spotlights is on designing a novel electrode material with high specific capacitance, able to endure long-term cyclic stability [47]. The main electrode materials are carbon materials [48], conductive polymers [49], metal oxides [50] and composite electrodes [51]. It has been shown that the ultrasonic-assisted synthesis of electrocatalysts for supercapacitors enhance the electrical conductivity and charge storage capacity of the whole nanostructured electrode, properties that are essential for supercapacitor applications [16,52].
Balasubramaniam et al. [16] synthesized a new nanohybrid consisting of copper oxide and zinc antimonate using ultrasonication assisted homogenous magnetic stirring approach. They investigated their performance as an electrode material for supercapacitors. Thereafter, the electrochemical properties of the nanohybrid electrode were investigated using cyclic voltammetry (CV), galvanostatic charge/discharge (GCD) and EIS studies in 1.0 M KOH solution. The fabricated nanohybrid electrode material exhibited exceptional electrochemical performance by delivering maximum specific capacitance of 257.14 F·g−1 at a current density of 12.5 A·g−1 in 1.0 M KOH. The nanocomposite showed a high cycling stability of 102% even after 2000 cycles at a current density of 10.0 A·g−1. They attributed the exceptional electrochemical characteristics of CuO/ZnSb2O6 nanocomposites to their dual nanorod morphology, the influence of ultrasonication on non-aggregated nanocomposite formation, the presence of a greater number of electrochemical active sites, and their synergistic interactions. Teng et al. [52] synthesized garlic peel-based 3D hierarchical porous carbons (GBPCs) by ultrasonic-assisted impregnation. They proposed the strategy of ultrasonic-assisted synthesis of GBPC. They showed that the structure and electrochemical properties of 3D layered PC are significantly improved after ultrasonic-assisted impregnation for a period of time, which is best at 6 min. They also illustrated that ultrasonic waves cause the surface-adhered carbonized product to fall off due to cavitation, so that potassium hydroxide can have a better mass transfer during activation and create more active sites. Figure 15 shows the evolution of the microscopic process of GBPC synthesis and conventional activated synthetic PC. The reaction mechanism of this process can be attributed to the combined effects produced by the local shear force triggered by cavitation and mechanical, causing partial crack rupture and surface impurities to fall off, hence improving the pore connectivity. Furthermore, the ultrasonic capillary effect (UCE), which is attributed to the increase in depth and velocity of the penetration of liquid into canals and pores under ultrasonication, increases the diffusion of ions in the improved structure and subsequent escape of potassium hydroxide [52].
El-Khodary et al. [53] prepared the 3D hierarchical porous carbon materials (3D-HPC) through activated commercially available microporous carbon by using KOH as a chemical activator supported by ultrasonic irradiation to ensure the efficient penetration of KOH inside the micropores followed by solidification and then pyrolyzed it at different temperatures. They demonstrated that the AC-850 sample exhibited high specific capacitance of 269.19 F·g−1 at a current density of 2 A·g−1 with high-rate capability and long-term cycling stability. Moreover, the AC-850-based symmetric supercapacitor delivered a high energy density of 21.4 Wh·kg−1 at a power density of 531.2 W·kg−1 with an excellent rate performance and superior cycling stability. Their work provides a clear strategy to obtain the 3D hierarchical porous carbon materials (micro-, meso- and macro-pores) from the commercial carbon, which can be used in lithium–ion batteries, catalysis, gas storage and water treatment [53].
Iqbal et al. [54] synthesized the novel strontium-based mixed phased nanomaterials by the sonochemical method followed by the calcination process. They showed that the crystallinity and phase purity of nanostructures increased by the increasing calcination temperature (Figure 16). Surface morphological analysis revealed the formation of mixed particles and rod-like structures, which sufficiently grew during the calcination process. At 600 °C calcination temperature, sufficient growth took place and low particle aggregation was achieved. By increasing the calcination temperature above 800 °C, the particles grew considerably to micron-sizes and the morphology of the material changed from mixed particle-rod to closely packed dense particles which significantly reduced particle-specific areas. They showed that the sample with a calcination temperature of 600 °C exhibited the best performance with a maximum specific capacity of 175 C·g−1 at the current density of 0.3 A·g−1 and a lowest ESR value of 1.2 Ω. The optimized nanomaterial was used to fabricate a supercapattery device (S4//AC) which gave excellent performances with a high energy density value of 21.8 Wh·kg−1 at a power density of 224 W·kg−1 at a low current density of 0.3 A·g−1. It was also found that the power density reached a maximum value of 2400 W·kg−1 at 3.2 A·g−1. Furthermore, their device showed a good capacity retention of 87% after 3000 cycles. They demonstrated that the reaction time, controlled power and amplitude of the ultrasonic waves resulted in the formation of nanomaterials of multiple phases.

7. The Use of Ultrasound for Synthesis of Electrocatalysts for Electrolyzers

There are only a few works in the area of the ultrasonic-assisted synthesis of electrocatalysts for water electrolyzers. The oxygen evolution reaction (OER) is an important half-cell reaction in water electrolysis which suffers from high overpotentials. Iridium (Ir) and ruthenium (Ru)-based materials have been considered to be the best electrocatalyst materials for the OER. However, high cost and low abundancy of these materials hinder their large scale practical applications [55]. Therefore, it is of great theoretical and practical significance to design efficient non-noble metal OER catalysts. An “ideal” non-noble metal OER catalyst must meet the following requirements [56]:
  • a high catalytic activity, i.e., a high current density at low overpotentials, and,
  • shows long-term cyclic stability.
Recently, metal-organic framework nanosheets (MONs) have been shown to be promising catalyst materials. They are two-dimensional (2D) materials exhibiting rapid electron transfer, taking advantage of both metal-organic frameworks (MOFs) and 2D materials [56]. Wang et al. [56] have reported a simple top–down approach to synthesize Co-MONs and used the composite directly as an efficient OER catalyst. They employed an ultrasonic bath (40 kHz, 100 W) to control the exposure of the preponderant lattice plane that can offer many active catalytic sites and accelerate ions transport.
Nickel–iron layered double hydroxide (NiFe LDH) has also been considered a potential catalyst towards the OER [57]. Munonde et al. [58] reported a simple/green approach to improve the oxygen evolution activity of NiFe LDH supported on carbon black (CB). They reported that the ultrasonic process provides an effective method to exfoliate layered materials in a “green” approach. They exfoliated the materials by applying ultrasound (UIP500hd, 20 kHz, 500 W) in pure water and witnessed an increase in the activity of NiFe LDH/CB towards the OER. They showed that the exfoliated NiFe LDH/CB nanosheets have significantly higher OER activity than their corresponding bulk NiFe LDH/CB in an alkaline solution, with an overpotential of 220 mV at a current density of 10 mA·cm−2, which is 60 mV lower than the 280 mV of the bulk NiFe LDH/CB. They suggested that the ultrasonic process provides an effective method to exfoliate layered materials [58].

8. Conclusions and Future Perspectives

Sonoelectrochemistry is the combination of ultrasonic energy in an electrochemical system that offers several advantages, including gas bubble removal at the electrode surface, solution degassing, disruption of the Nernst diffusion layer, enhancement of the mass transport of electroactive species through the double layer, and the activation and cleaning of the electrode surface. These benefits in electrochemistry lead to improved process efficiencies (electrode and current efficiencies), increased electrochemical rates and yields, decreased cell voltages and electrode overpotentials, improved electrodeposited materials in terms of hardness, quality, porosity and thickness, and the suppression of electrode fouling and degassing at the electrode surface.
This mini-review provides the fundamental information and applications of sonoelectrochemistry in producing energy materials such as the synthesis of electrocatalysts and electrodes for fuel cells, the fabrication of semiconductors for water photo-splitting and the sonoelectrochemical production of hydrogen through electrochemical water splitting. In general, the sonoelectrochemical method offers several advantages and will progressively play an important role in the field of materials science compared to other conventional methods. The optimization of various ultrasonic parameters plays a key role in the performance of the sonoelectrochemical method. The main factors that should be considered during the sonoelectrochemical technique are listed below [9]:
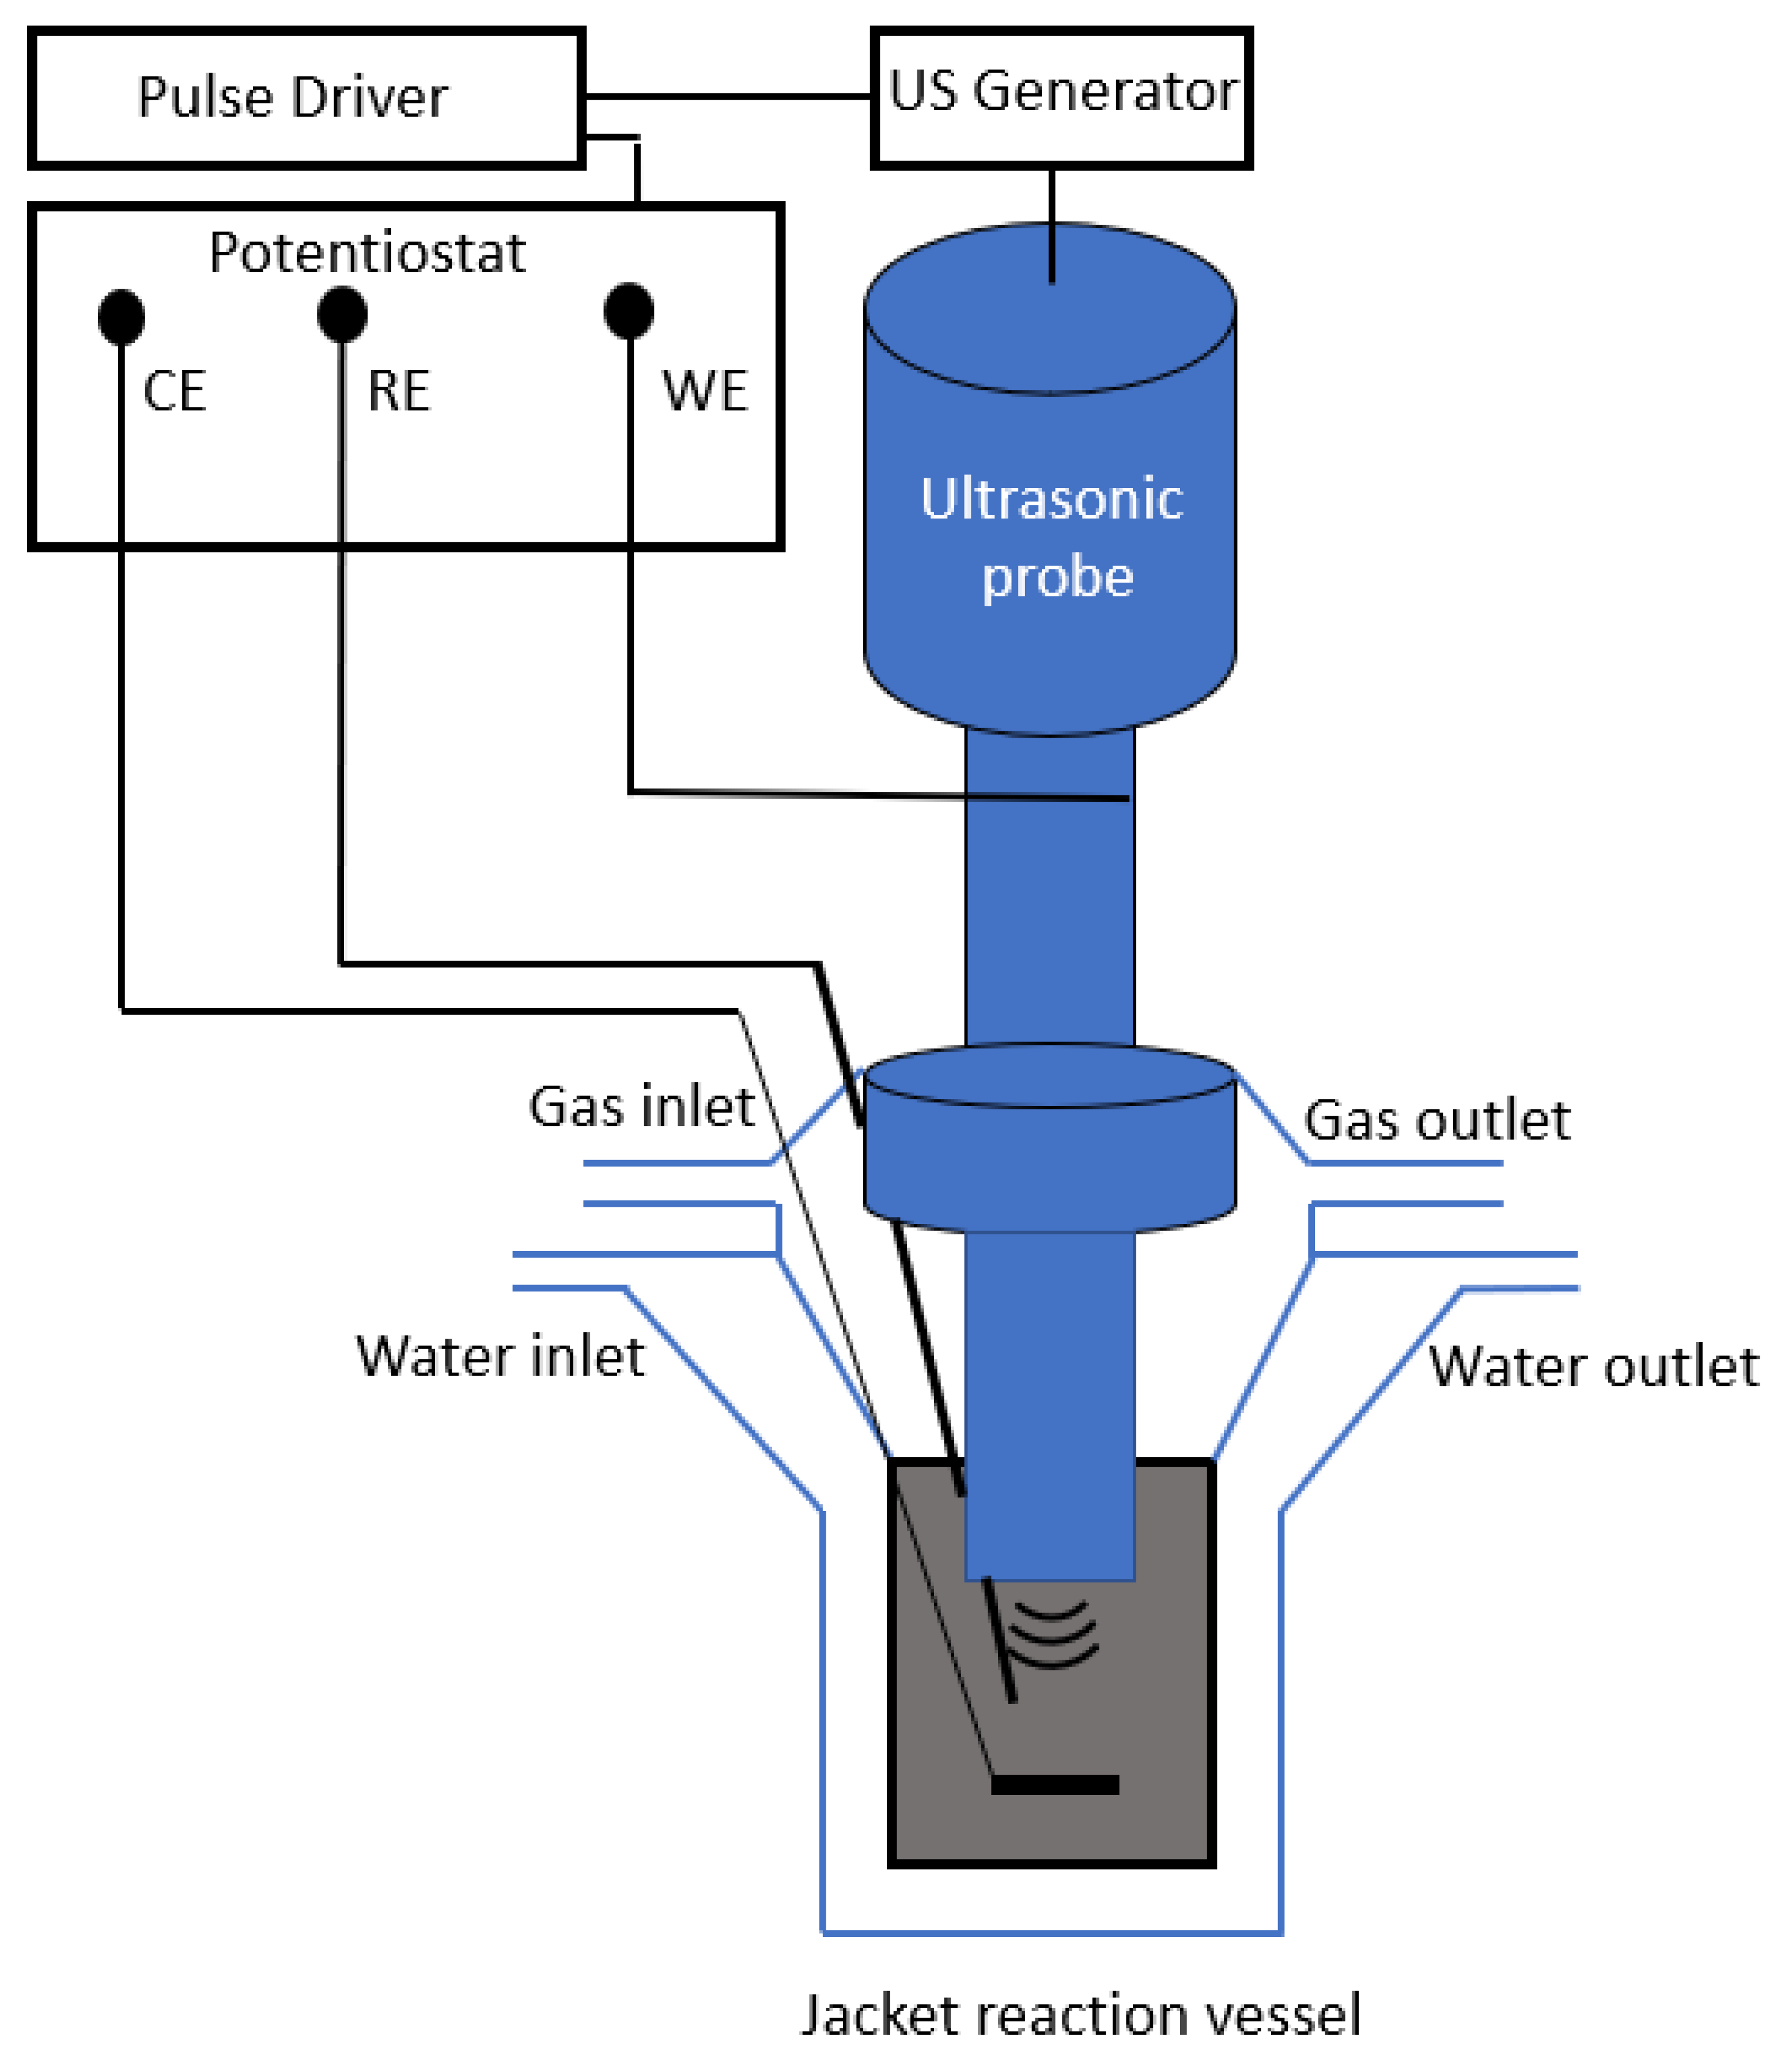
  • In order to produce high-intensity bubbles and free radicals, an ultrasonic probe-type emitter is preferable since (a) in ultrasonic baths, ultrasonic waves penetrate through a glass wall before reaching the electrolyte in the electrochemical cell, and (b) ultrasonic frequencies are mostly in the range of 20–100 kHz. In the case of an ultrasonic probe or horns, the ultrasonic intensities can reach up to 1000 W·cm−2 and they can be in direct contact with the electrolyte (although direct immersion could lead to contamination arising from the ultrasonic probe tip)
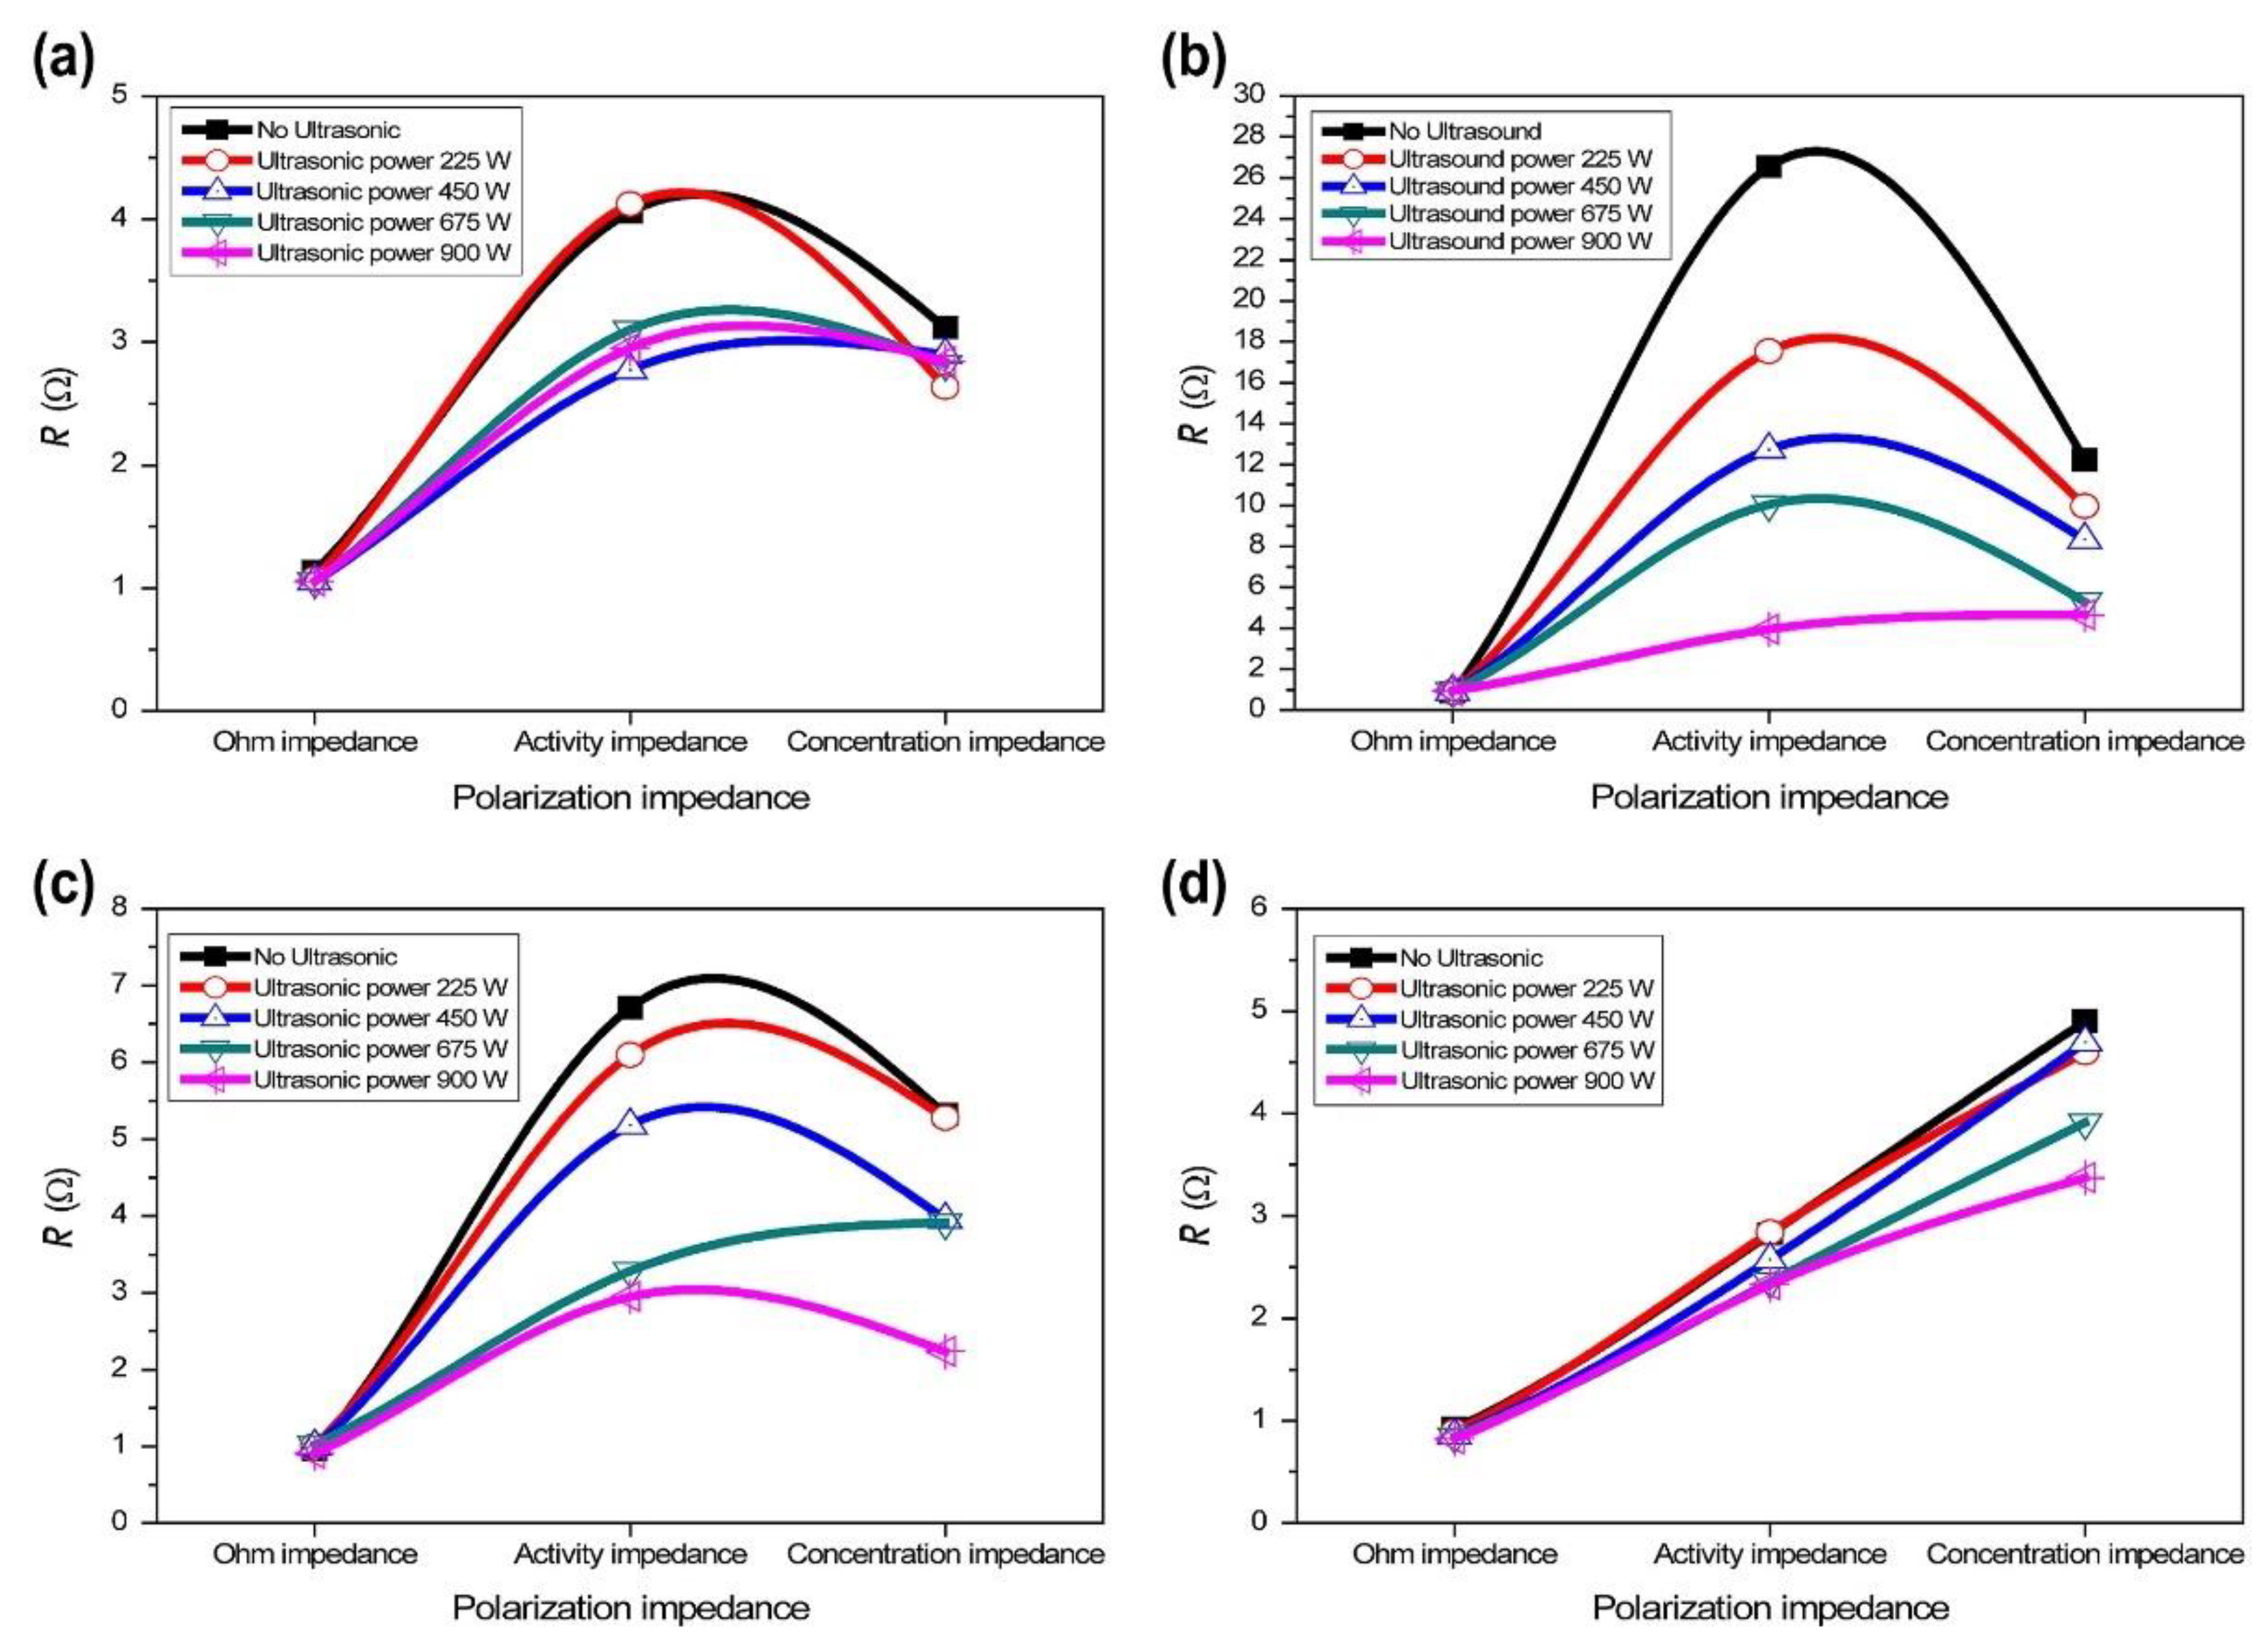
  • The rate of the electrochemical reaction generally increases by increasing the ultrasonic intensity.
  • Lower ultrasonic frequencies are preferred over higher frequencies in order to improve mass transfer at the electrode.
  • The applied cell voltage for the electrochemical process is an important parameter in the water-splitting processes and ultrasound has shown to lower the overall ohmic cell voltage and cell overpotentials.
  • For efficient sonoelectrochemical processes, the optimization of various experimental parameters, such as the experimental design, ultrasonic frequency, acoustic power, irradiation time, ultrasonic transducer–electrode distance, electrode materials, electrode potentials, temperature, pH, conductivity, and electrolyte compositions are recommended.
Despite the remarkable developments of sonoelectrochemistry and its benefits in many applications, there is still some room for further developments and investigations in the energy and environment areas. According to the literature [9], laboratory-scale equipment for sonoelectrochemistry is available, however, large-scale and industrial set-ups and reactors are required.
In order to scale-up, the following points should be considered:
Ultrasound operating in the range of 20–100 kHz is energy-demanding. For example, the amount of energy consumed by an ultrasonic transducer operating at 20 kHz (200 W) working at 30% amplitude is ca. 0.0853 kWh ((0.2 × 0.30) + 0.0253, where 0.0253 W is the idle energy consumed by the ultrasonic generator). To overcome this issue, different strategies could be applied, for example, by using pulsed ultrasound or by using more energy-efficient ultrasonic transducers and generators.
The “solution flow velocity vs. ultrasonic field vs. contact time” correlation should be studied. The best results could be achieved for low volumetric flow rates under low ultrasonic intensities, leading to lower energy costs.
Simulation and modelling can provide useful information with regard to sonoelectrochemical reactor optimization.
However, it is worth mentioning that the use of ultrasound for chemical and electrochemical processes can, in most cases, reduce the reaction times by 50% and may lead to similar or even higher chemical yields than under silent conditions. In any cases, a technico-economic analysis of the scale-up process should be undertaken together with the ultrasonic transducer/ultrasonic equipment manufacturer.

Author Contributions

F.F.; literature search, writing—original draft preparation and editing, J.J.L.; writing—review and editing, O.S.B.; supervision, B.G.P.; idea, supervision, writing—review and editing. All authors have read and agreed to the published version of the manuscript.

Funding

This research received no external funding.

Data Availability Statement

Data available in a publicly accessible repository.

Acknowledgments

The authors would like to thank NTNU and the NTNU ENERSENSE program for the 3-year financial support towards FF’s doctoral studies.

Conflicts of Interest

The authors declare no conflict of interest.

References

  1. Feng, H.; Yang, W.; Hielscher, T. Power ultrasound. Food Sci. Technol. Int. 2008, 14, 433–436. [Google Scholar] [CrossRef]
  2. Leong, T.; Ashokkumar, M.; Kentish, S. The fundamentals of power ultrasound—A review. Acoustics Austral. 2011, 39, 54–63. [Google Scholar]
  3. Islam, M.H.; Burheim, O.S.; Pollet, B.G. Sonochemical and sonoelectrochemical production of hydrogen. Ultrason. Sonochem. 2019, 51, 533–555. [Google Scholar] [CrossRef]
  4. Pollet, B. Power Ultrasound in Electrochemistry: From Versatile Laboratory Tool to Engineering Solution; John Wiley & Sons: Hoboken, NJ, USA, 2012. [Google Scholar]
  5. Frenkel, V.; Gurka, R.; Liberzon, A.; Shavit, U.; Kimmel, E. Preliminary investigations of ultrasound induced acoustic streaming using particle image velocimetry. Ultrasonics 2001, 39, 153–156. [Google Scholar] [CrossRef]
  6. Kumar, A.; Kumaresan, T.; Pandit, A.B.; Joshi, J.B. Characterization of flow phenomena induced by ultrasonic horn. Chem. Eng. Sci. 2006, 61, 7410–7420. [Google Scholar] [CrossRef]
  7. Elder, S.A. Cavitation microstreaming. J. Acoust. Soc. Am. 1959, 31, 54–64. [Google Scholar] [CrossRef]
  8. Mason, T.J. Sonochemistry; Royal Society of Chemistry: London, UK, 1990. [Google Scholar]
  9. Theerthagiri, J.; Madhavan, J.; Lee, S.J.; Choi, M.Y.; Ashokkumar, M.; Pollet, B.G. Sonoelectrochemistry for energy and environmental applications. Ultrason. Sonochem. 2020, 63, 104960. [Google Scholar] [CrossRef] [PubMed]
  10. Budischak, C.; Honsberg, C.; Opila, R.L. Electroanalytic effects of ultrasound on a hydrogen evolution reaction in KOH. In Proceedings of the 2008 33rd IEEE Photovoltaic Specialists Conference, San Diego, CA, USA, 11–16 May 2008. [Google Scholar]
  11. Lin, M.-Y.; Hourng, L.-W. Ultrasonic wave field effects on hydrogen production by water electrolysis. J. Chin. Inst. Eng. 2014, 37, 1080–1089. [Google Scholar] [CrossRef]
  12. Shen, Q.; Min, Q.; Shi, J.; Jiang, L.; Zhang, J.-R.; Hou, W.; Zhu, J.-J. Morphology-controlled synthesis of palladium nanostructures by sonoelectrochemical method and their application in direct alcohol oxidation. J. Phys. Chem. C 2009, 113, 1267–1273. [Google Scholar] [CrossRef]
  13. Shen, Q.; Jiang, L.; Zhang, H.; Min, Q.; Hou, W.; Zhu, J.-J. Three-dimensional dendritic Pt nanostructures: Sonoelectrochemical synthesis and electrochemical applications. J. Phys. Chem. C 2008, 112, 16385–16392. [Google Scholar] [CrossRef]
  14. Pollet, B.G. The use of ultrasound for the fabrication of fuel cell materials. Int. J. Hydrog. Energy 2010, 35, 11986–12004. [Google Scholar] [CrossRef]
  15. Wang, C.; Sun, L.; Yun, H.; Li, J.; Lai, Y.; Lin, C. Sonoelectrochemical synthesis of highly photoelectrochemically active TiO2 nanotubes by incorporating CdS nanoparticles. Nanotechnology 2009, 20, 295601. [Google Scholar] [CrossRef]
  16. Balasubramaniam, M.; Balakumar, S. Ultrasonication-assisted fabrication of hierarchical architectures of copper oxide/zinc antimonate nanocomposites based supercapacitor electrode materials. Ultrason. Sonochem. 2019, 56, 337–349. [Google Scholar] [CrossRef] [PubMed]
  17. Karousos, D.S.; Desdenakis, K.I.; Sakkas, P.M.; Sourkouni, G.; Pollet, B.G.; Argirusis, C. Sonoelectrochemical one-pot synthesis of Pt–Carbon black nanocomposite PEMFC electrocatalyst. Ultrason. Sonochem. 2017, 35, 591–597. [Google Scholar] [CrossRef] [PubMed]
  18. Hansen, H.E.; Seland, F.; Sunde, S.; Burheim, O.S.; Pollet, B.G. Two routes for sonochemical synthesis of platinum nanoparticles with narrow size distribution. Mater. Adv. 2021. [Google Scholar] [CrossRef]
  19. Lewis, N.S.; Nocera, D.G. Powering the planet: Chemical challenges in solar energy utilization. Proc. Natl. Acad. Sci. USA 2006, 103, 15729–15735. [Google Scholar] [CrossRef] [Green Version]
  20. Jalili, Z.; Krakhella, K.W.; Einarsrud, K.E.; Burheim, O.S. Energy generation and storage by salinity gradient power: A model-based assessment. J. Energy Storage 2019, 24, 100755. [Google Scholar] [CrossRef]
  21. Denholm, P.; O’Connell, M.; Brinkman, G.; Jorgenson, J. Overgeneration from solar energy in california. In A Field Guide to the Duck Chart; National Renewable Energy Laboratory (NREL): Golden, CO, USA, 2015. [Google Scholar]
  22. Li, S.-D.; Wang, C.-C.; Chen, C.-Y. Water electrolysis in the presence of an ultrasonic field. Electrochim. Acta 2009, 54, 3877–3883. [Google Scholar] [CrossRef]
  23. Cheng, H.; Scott, K.; Ramshaw, C. Intensification of water electrolysis in a centrifugal field. J. Electrochem. Soc. 2002, 149, D172–D177. [Google Scholar] [CrossRef]
  24. Wang, M.; Wang, Z.; Gong, X.; Guo, Z. The intensification technologies to water electrolysis for hydrogen production—A review. Renew. Sustain. Energy Rev. 2014, 29, 573–588. [Google Scholar] [CrossRef]
  25. Angulo, A.; van der Linde, P.; Gardeniers, H.; Modestino, M.; Rivas, D.F. Influence of bubbles on the energy conversion efficiency of electrochemical reactors. Joule 2020, 4, 555–579. [Google Scholar] [CrossRef] [Green Version]
  26. Moriguchi, N. The effect of supersonic waves on chemical phenomena,(III). The effect on the concentration polarization. J. Chem. Soc. Jpn 1934, 55, 749–750. [Google Scholar]
  27. Lepesant, M. Sonoelectrochemical Production of Hydrogen for PEM Fuel Cell Applicatio; Internship Report; ENSICAEN: Caen, France, 2011. [Google Scholar]
  28. Zadeh, S.H. Hydrogen production via ultrasound-aided alkaline water electrolysis. J. Autom. Control. Eng. 2014, 2, 103–109. [Google Scholar] [CrossRef] [Green Version]
  29. Symes, D. Sonoelectrochemical (20 kHz) Production of Hydrogen from Aqueous Solutions; University of Birmingham: Birmingham, UK, 2011. [Google Scholar]
  30. Pollet, B.G.; Foroughi, F.; Faid, A.Y.; Emberson, D.R.; Islam, M.H. Does power ultrasound (26 kHz) affect the hydrogen evolution reaction (HER) on Pt polycrystalline electrode in a mild electrolyte? Ultrason. Sonochem. 2020, 69, 105238. [Google Scholar] [CrossRef] [PubMed]
  31. Mekhilef, S.; Saidur, R.; Safari, A. Comparative study of different fuel cell technologies. Renew. Sustain. Energy Rev. 2012, 16, 981–989. [Google Scholar] [CrossRef]
  32. Comparison of Fuel Cell Technologies. Available online: https://www1.eere.energy.gov/hydrogenandfuelcells/fuelcells/pdfs/fc_comparison_chart (accessed on 12 February 2021).
  33. Pollet, B.G. A novel method for preparing PEMFC electrodes by the ultrasonic and sonoelectrochemical techniques. Electrochem. Commun. 2009, 11, 1445–1448. [Google Scholar] [CrossRef]
  34. Pollet, B.G.; Ashokkumar, M. Introduction to Ultrasound, Sonochemistry and Sonoelectrochemistry; Springer Nature Switzerland AG: Cham, Switzerland, 2019. [Google Scholar]
  35. Bessarabov, D.; Millet, P. PEM Water Electrolysis, in Hydrogen and Fuel Cells Primers Series; Pollet, B.G., Ed.; Academic Press: Cambidge, UK, 2018. [Google Scholar]
  36. Zin, V.; Pollet, B.G.; Dabalà, M. Sonoelectrochemical (20 kHz) production of platinum nanoparticles from aqueous solutions. Electrochim. Acta 2009, 54, 7201–7206. [Google Scholar] [CrossRef]
  37. Pollet, B.G. The use of power ultrasound for the production of PEMFC and PEMWE catalysts and low-Pt loading and high-performing electrodes. Catalysts 2019, 9, 246. [Google Scholar] [CrossRef] [Green Version]
  38. Foroughi, F.; Kékedy-Nagy, L.; Islam, M.H.; Lamb, J.J.; Greenlee, L.F.; Pollet, B.G. The use of ultrasound for the electrochemical synthesis of magnesium ammonium phosphate hexahydrate (Struvite). ECS Trans. 2019, 92, 47. [Google Scholar] [CrossRef]
  39. Bock, C.; Halvorsen, H.; MacDougall, B. Catalyst Synthesis Techniques. In PEM Fuel Cell Electrocatalysts and Catalyst Layers: Fundamentals and Applications; Zhang, J., Ed.; Springer Science & Business Media: Berlin, Germany, 2008; p. 1137. [Google Scholar]
  40. Litster, S.; McLean, G. PEM fuel cell electrodes. J. Power Sources 2004, 130, 61–76. [Google Scholar] [CrossRef]
  41. Wee, J.-H.; Lee, K.-Y.; Kim, S.H. Fabrication methods for low-Pt-loading electrocatalysts in proton exchange membrane fuel cell systems. J. Power Sources 2007, 165, 667–677. [Google Scholar] [CrossRef]
  42. Pollet, B.G.; Hihn, J.-Y. Sonoelectrochemistry: From theory to applications. In Handbook on Applications of Ultrasound; CRC Press: Boca Raton, FL, USA, 2011; pp. 625–659. [Google Scholar]
  43. Pollet, B.G.; Valzer, E.F.; Curnick, O.J. Platinum sonoelectrodeposition on glassy carbon and gas diffusion layer electrodes. Int. J. Hydrog. Energy 2011, 36, 6248–6258. [Google Scholar] [CrossRef]
  44. Hoffmann, M.R.; Martin, S.T.; Choi, W.; Bahnemann, D.W. Environmental applications of semiconductor photocatalysis. Chem. Rev. 1995, 95, 69–96. [Google Scholar] [CrossRef]
  45. Mohapatra, S.; Misra, M.; Mahajan, V.; Raja, K. A novel method for the synthesis of titania nanotubes using sonoelectrochemical method and its application for photoelectrochemical splitting of water. J. Catal. 2007, 246, 362–369. [Google Scholar] [CrossRef]
  46. Yang, C.-M.; Kim, Y.-J.; Endo, M.; Kanoh, H.; Yudasaka, M.; Iijima, S.; Kaneko, K. Nanowindow-regulated specific capacitance of supercapacitor electrodes of single-wall carbon nanohorns. J. Am. Chem. Soc. 2007, 129, 20–21. [Google Scholar] [CrossRef] [PubMed]
  47. Xu, C.; Zhao, Y.; Yang, G.; Li, F.; Li, H. Mesoporous nanowire array architecture of manganese dioxide for electrochemical capacitor applications. Chem. Commun. 2009, 48, 7575–7577. [Google Scholar] [CrossRef] [PubMed]
  48. Li, S.; Han, K.; Li, J.; Li, M.; Lu, C. Preparation and characterization of super activated carbon produced from gulfweed by KOH activation. Microporous Mesoporous Mater. 2017, 243, 291–300. [Google Scholar] [CrossRef]
  49. Wu, X.; Han, Z.; Zheng, X.; Yao, S.; Yang, X.; Zhai, T. Core-shell structured Co3O4@ NiCo2O4 electrodes grown on flexible carbon fibers with superior electrochemical properties. Nano Energy 2017, 31, 410–417. [Google Scholar] [CrossRef]
  50. Liu, H.; Zhao, D.; Liu, Y.; Hu, P.; Wu, X.; Xia, H. Boosting energy storage and electrocatalytic performances by synergizing CoMoO4@ MoZn22 core-shell structures. Chem. Eng. J. 2019, 373, 485–492. [Google Scholar] [CrossRef]
  51. Zhao, D.; Liu, H.; Wu, X. Bi-interface induced multi-active MCo2O4@ MCo2S4@ PPy (M= Ni, Zn) sandwich structure for energy storage and electrocatalysis. Nano Energy 2019, 57, 363–370. [Google Scholar] [CrossRef]
  52. Teng, Z.; Han, K.; Li, J.; Gao, Y.; Li, M.; Ji, T. Ultrasonic-assisted preparation and characterization of hierarchical porous carbon derived from garlic peel for high-performance supercapacitors. Ultrason. Sonochem. 2020, 60, 104756. [Google Scholar] [CrossRef]
  53. El-Khodary, S.A.; Abomohra, A.E.-F.; El-Enany, G.M.; Aboalhassan, A.A.; Ng, D.H.; Wang, S.; Lian, J. Sonochemical assisted fabrication of 3D hierarchical porous carbon for high-performance symmetric supercapacitor. Ultrason. Sonochem. 2019, 58, 104617. [Google Scholar] [CrossRef] [PubMed]
  54. Iqbal, M.Z.; Khan, A.; Numan, A.; Haider, S.S.; Iqbal, J. Ultrasonication-assisted synthesis of novel strontium based mixed phase structures for supercapattery devices. Ultrason. Sonochem. 2019, 59, 104736. [Google Scholar] [CrossRef] [PubMed]
  55. Hong, W.T.; Risch, M.; Stoerzinger, K.A.; Grimaud, A.; Suntivich, J.; Shao-Horn, Y. Toward the rational design of non-precious transition metal oxides for oxygen electrocatalysis. Energy Environ. Sci. 2015, 8, 1404–1427. [Google Scholar] [CrossRef] [Green Version]
  56. Wang, X.; Zhang, H.; Yang, Z.; Zhang, C.; Liu, S. Ultrasound-treated metal-organic framework with efficient electrocatalytic oxygen evolution activity. Ultrason. Sonochem. 2019, 59, 104714. [Google Scholar] [CrossRef]
  57. Chen, R.; Sun, G.; Yang, C.; Zhang, L.; Miao, J.; Tao, H.; Yang, H.; Chen, J.; Chen, P.; Liu, B. Achieving stable and efficient water oxidation by incorporating NiFe layered double hydroxide nanoparticles into aligned carbon nanotubes. Nanoscale Horiz. 2016, 1, 156–160. [Google Scholar] [CrossRef] [PubMed]
  58. Munonde, T.S.; Zheng, H.; Nomngongo, P.N. Ultrasonic exfoliation of NiFe LDH/CB nanosheets for enhanced oxygen evolution catalysis. Ultrason. Sonochem. 2019, 59, 104716. [Google Scholar] [CrossRef] [PubMed]
Figure 1. The evolution of a cavitation bubble during ultrasonication.
Catalysts 11 00284 g001
Figure 2. Schematic diagram of a sonoelectrochemical reactor experimental set-up. CE, counter electrode; WE, working electrode; and RE, reference electrode.
Catalysts 11 00284 g002
Figure 3. A simplified water electrolyzer (containing a protonic conducting membrane) showing the HER at the cathode and the OER at the anode, subjected to ultrasound. (a) DC applied, (b) DC applied and oxygen and hydrogen bubbles produced at the anode and cathode, respectively, (c) DC and ultrasonic applied leading to effective removal of gas bubbles from the electrode surfaces.
Catalysts 11 00284 g003
Figure 4. Hydrogen evolution on a Pt wire in the absence (top left corner) and presence of ultrasound (26 kHz, 100% ultrasonic amplitude). The applied potential was set at −1.30 V vs. RHE (a) 0 μs, (b) 100 μs, (c) 200 μs, (d) 300 μs, (e) 400 μs, (f) 500 μs, (g) 600 μs. The time between each image is 10−4 s (100 μs) filmed at 10,000 frames per second [30].
Catalysts 11 00284 g004
Figure 5. Polarization impedance of different electrolyte concentrations with a 2 V cell voltage and electrode distance of 2 mm. (a) 10 wt%; (b) 20 wt%; (c) 30 wt%; (d) 40 wt% KOH [11].
Catalysts 11 00284 g005
Figure 6. Sonoelectrochemical set-up for the production of PEMFC and proton exchange membrane water electrolyzer (PEMWE) catalysts.
Catalysts 11 00284 g006
Figure 7. TEM images of the Pt nanostructures at different current densities: (a) 5; (b) 20; and (c) 40 mA.cm−2. The inset in panel a is the particle size distribution of the monodisperse Pt nanoparticles [13].
Catalysts 11 00284 g007
Figure 8. TEM images showing the time development of the dendritic Pt nanostructures (DPNs) synthesized using the sonoelectrochemical method after (a) 10, (b) 30, (c) 60 and (d) 90 min [13].
Catalysts 11 00284 g008
Figure 9. TEM images of (A) Pt nanoparticles, and (B) Pt nanoparticles formed sonoelectrochemically directly onto the carbon particles. Inset is the particle size distribution of the carbon supported Pt nanoparticles [17].
Catalysts 11 00284 g009
Figure 10. Comparison of membrane electrode assembly (MEA) performance between anodes prepared by: (1) the galvanostatic pulse method without ultrasound [▲], (2) the sono-galvanostatic pulse method (20 kHz, 40W.cm−2) [■], and (3) the conventional method (0.30 mg Pt cm−2 electrodes) [♦]. The MEA testing parameters were H2/O2 (1.5/2 stoics), 343 K and 1 atm [33].
Catalysts 11 00284 g010
Figure 11. SEM images of PEMFC anodes prepared by (a) the galvanostatic pulse method without ultrasound and (b) the sono-galvanostatic pulse method (20 kHz, 40 W·cm−2) [33].
Catalysts 11 00284 g011
Figure 12. SEM images of Pt/GC electrodes prepared: (a) under silent conditions (no rotation), (b) under maximum rotation (2000 rpm) and (c) in the presence of ultrasound (2.3 W), Pt electrodeposited on GDL (d-a) under silent and (d-b) ultrasonic (4.4 W) conditions [43].
Catalysts 11 00284 g012
Figure 13. Experimental set-up for anodization of titanium by ultrasonic treatment; representation modified from [45].
Catalysts 11 00284 g013
Figure 14. A schematic diagram of the possible sonoelectrochemical deposition interaction; representation modified from [15].
Catalysts 11 00284 g014
Figure 15. Microscopic process of garlic peel-based 3D hierarchical porous carbon (GBPC) synthesis [52].
Catalysts 11 00284 g015
Figure 16. FESEM images of Sr-based nanomaterials calcined at different temperatures for (a) S1 (60 °C); (b) S2 (200 °C); (c) S3 (400 °C); (d) S4 (600 °C); and (e) S5 (800 °C). Insets show a higher-magnification of materials [54].
Catalysts 11 00284 g016
Table 1. Summary of major influencing factors of ultrasound on electrochemical systems.
Influencing Factors of Ultrasound on ElectrochemistryRef
Acoustic StreamingTurbulent FlowMicrojets and MicrostreamingShock WavesChemical
Effects
[4,5,6,7,8]
CauseThe power of acoustic streaming is directly proportional to the intensity of the ultrasound, the surface area of the ultrasonic emitting device and the attenuation coefficient of the medium.
It is inversely proportional to the bulk solution viscosity and the speed of sound.
The movement of the acoustic cavitation bubble.The collapsing of acoustic bubbles on a solid surface leads to the formation of microjets being directed towards the surface of the solid material at speeds of up to 200 m/s.Produced at the end of the strong collapse of bubbles.“Sonolytic” effects in electrochemistry due to acoustic cavitation in aqueous media.
EffectThe enhancement of the movement of the solution.
Reducing the diffusion boundary layer.
Promoting the mass transfer of electroactive species to the electrode surface.
Increases the mass transport process within the solution and the electrode surface, similar to acoustic streaming.If the surface is an electrode, the combined effects of the microjet and microstreaming enhance mass transport to the electrode surface.
Electrode and surface cleaning that prevents fouling of the electrode surface (and accumulation of gas bubbles at the electrode surface).
Enhance the electrodeposition process.
The erosion of the electrode surface leading to an increase in the current.The formation of highly reactive radicals such as OH•, H2O2•, and O•.
Table 2. The hydrogen evolution reaction (HER) and oxygen evolution reaction (OER) occurring in aqueous acidic and alkaline conditions.
Half-Cell ReactionRedoxAcidAlkaline
HERReduction 2 H + + 2 e = H 2
E o = 0.000   V S H E
2 H 2 O + 2 e = H 2 + 2 OH
E o = 0.828   V S H E  
OEROxidation H 2 = 1 2 O 2 + 2 H + + 2 e
E o = + 1.229   V S H E
2 OH = 1 2 O 2 + H 2 O + 2 e
E o = + 0.401   V S H E
Table 3. Comparison of technical specifications of different fuel cells [31,32].
Fuel Cell TypeCommon ElectrolyteOperating TemperatureTypical Stack SizeEfficiencyApplicationsAdvantagesDisadvantages
Polymer Electrolyte Membrane (PEMFC)Solid polymer membrane (e.g., perfluorosulfonic acid)50–100 °C
typically, 80
°C
< 1 100 kW 60% transportation 35% stationaryBackup power
Portable power
Distributed generation
Transportation
Specialty vehicles
Solid electrolyte reduces corrosion and electrolyte management problems
Low temperature
Quick start-up
Expensive catalysts
Sensitive to fuel impurities
Low-temperature waste heat
Direct Methanol Fuel Cell (DMFC)Solid polymer membrane50–100 °C0.001–100 kW40%Replace batteries in portable systems, e.g., mobiles, computers and other portable devicesReduced cost due to absence of fuel reformerDehydration of the membrane
Toxic and flammable fuel
CO poisoning
Systems design
Alkaline (AFC)Aqueous solution of potassium hydroxide90–100 °C10–100 kW60%Military
Space
Cathode reaction is faster in alkaline electrolyte, which leads to high performance
Low-cost components
Sensitive to CO2 in fuel and air
Electrolyte management
Phosphoric Acid (PAFC)Phosphoric acid150–200 °C400 kW
100 kW
module
40%Distributed generationHigher temperature enables CHP *
Increased tolerance to fuel impurities
Pt catalyst
Long start uptime
Low current and power
Molten Carbonate (MCFC)A solution of lithium, and/or potassium carbonates600–700 °C300 kW–3 MW
300 kW
module
45–50%Electric utility
Distributed generation
High efficiency
Fuel flexibility
Can use a variety of catalysts
Suitable for CHP
High-temperature corrosion and breakdown of cell components
Long start-up time
Low power density
Solid Oxide (SOFC)Yttria stabilized zirconia700–1000 °C1 kW–2 MW60%Auxiliary power
Electric utility
Distributed generation
High efficiency
Fuel flexibility
Can use a variety of catalysts
Solid electrolyte
Suitable for CHP
Hybrid/gas turbine cycle
High-temperature corrosion and breakdown of cell components
High-temperature operation requires long start-up time and limits
* Combined heat and power.
Publisher’s Note: MDPI stays neutral with regard to jurisdictional claims in published maps and institutional affiliations.

