Article

Hollow TiO2 Microsphere/Graphene Composite Photocatalyst for CO2 Photoreduction

Department of Chemical and Materials Engineering, National Chin-Yi University of Technology, Taichung 411030, Taiwan
*
Author to whom correspondence should be addressed.
Both authors contributed equally to this work.
Catalysts 2021, 11(12), 1532; https://doi.org/10.3390/catal11121532
Submission received: 9 November 2021 / Revised: 7 December 2021 / Accepted: 11 December 2021 / Published: 16 December 2021
(This article belongs to the Special Issue Organic-Inorganic Hybrid Catalysts for Energy Applications)

Abstract

:
In an attempt to improve the photocatalytic activity of anatase TiO2, we developed a composite photocatalyst composed of hollow TiO2 microspheres (hTS) and graphene. The hTS were prepared through a two-step hydrothermal process, where SiO2 microspheres with desirable diameters of 100–400 nm were used as sacrificial templates. Accordingly, the effect of the hTS cavity size on the activity of the catalyst in wet CO2 photoreduction (CO2PR) was studied. Furthermore, it was established that the hydrothermal pH value crucially influences the photocatalytic activity of the hTS photocatalyst, as well as its composition and microstructure. The hTS photocatalyst was also combined with graphene (0–90 wt%) to improve its photocatalytic activity. This study provides insight into the optimal microsphere diameter, hydrothermal pH value, and graphene/hTSx ratio required for designing hollow microsphere-based photocatalysts with enhanced CO2PR performances.

1. Introduction

Scientists and engineers have been developing diverse green technologies, ranging from CO2 capture to renewable energy and energy conversion devices, to combat the ever-increasing impact of the greenhouse effect and energy crisis on the environment [1,2,3,4,5,6,7,8]. CO2 photoreduction (CO2PR) is the only technology that can consume CO2 to produce valuable fuels using solar energy. Since the 1990s, research interest in CO2PR has grown exponentially owing to the rapid development of semiconductor photocatalysts [9].
Anatase TiO2 is the most widely adopted semiconductor material for CO2PR owing to its excellent stability, nontoxicity, and low cost [10,11]. However, its performance is limited by its large bandgap of approximately 3.2 eV [12,13]. Strategies to improve the photocatalytic performance of anatase TiO2 commonly involve incorporating it into various materials or implementing nanoporosity [5,12,14,15]. Some of these methods include heteroatom doping [15,16,17], quantum dot decoration [18], additional semiconductor hybridization [19], and dye sensitization [20]. As these methods combine photocatalysts with sophisticated materials, coupling them with a simpler material, such as graphene, is a more straightforward approach. Graphene is an effective catalyst support that can improve the CO2PR performance of a catalyst by accelerating electron–hole separation, enhancing CO2 adsorption through π–π conjugation, improving the catalyst specific surface area (SSA), enhancing the catalyst light utilization, and activating CO2 molecules [21,22]. Mesoporous and microporous materials have also been widely studied as photocatalysts for CO2PR owing to their high SSAs and ability to rapidly diffuse reactants/products; however, they have relatively slow convection rates, which limits their overall mass transfer of reactants/products [12,15]. Therefore, developing a photocatalyst with an optimal-sized macroporous structure could elucidate the effect of the photocatalyst pore size on CO2PR.
In this study, we present a simple approach for the preparation of a photocatalyst for gas-phase wet CO2PR. The photocatalyst comprises hollow TiO2 microspheres that are coupled with graphene (0–90 wt%; denoted as hTSx-yGz, where subscript x, y, and z represent the average diameter, processing pH value, and graphene mass fraction, respectively) to effectively improve the photocatalytic activity of the TiO2 microspheres. Notably, the hTS used in this study possess desirable diameters of 100–400 nm, and an optimal graphene/hTSx ratio was achieved. This protocol also serves as a guideline for the design of hollow microsphere-based photocatalysts for CO2PR.

2. Results and Discussion

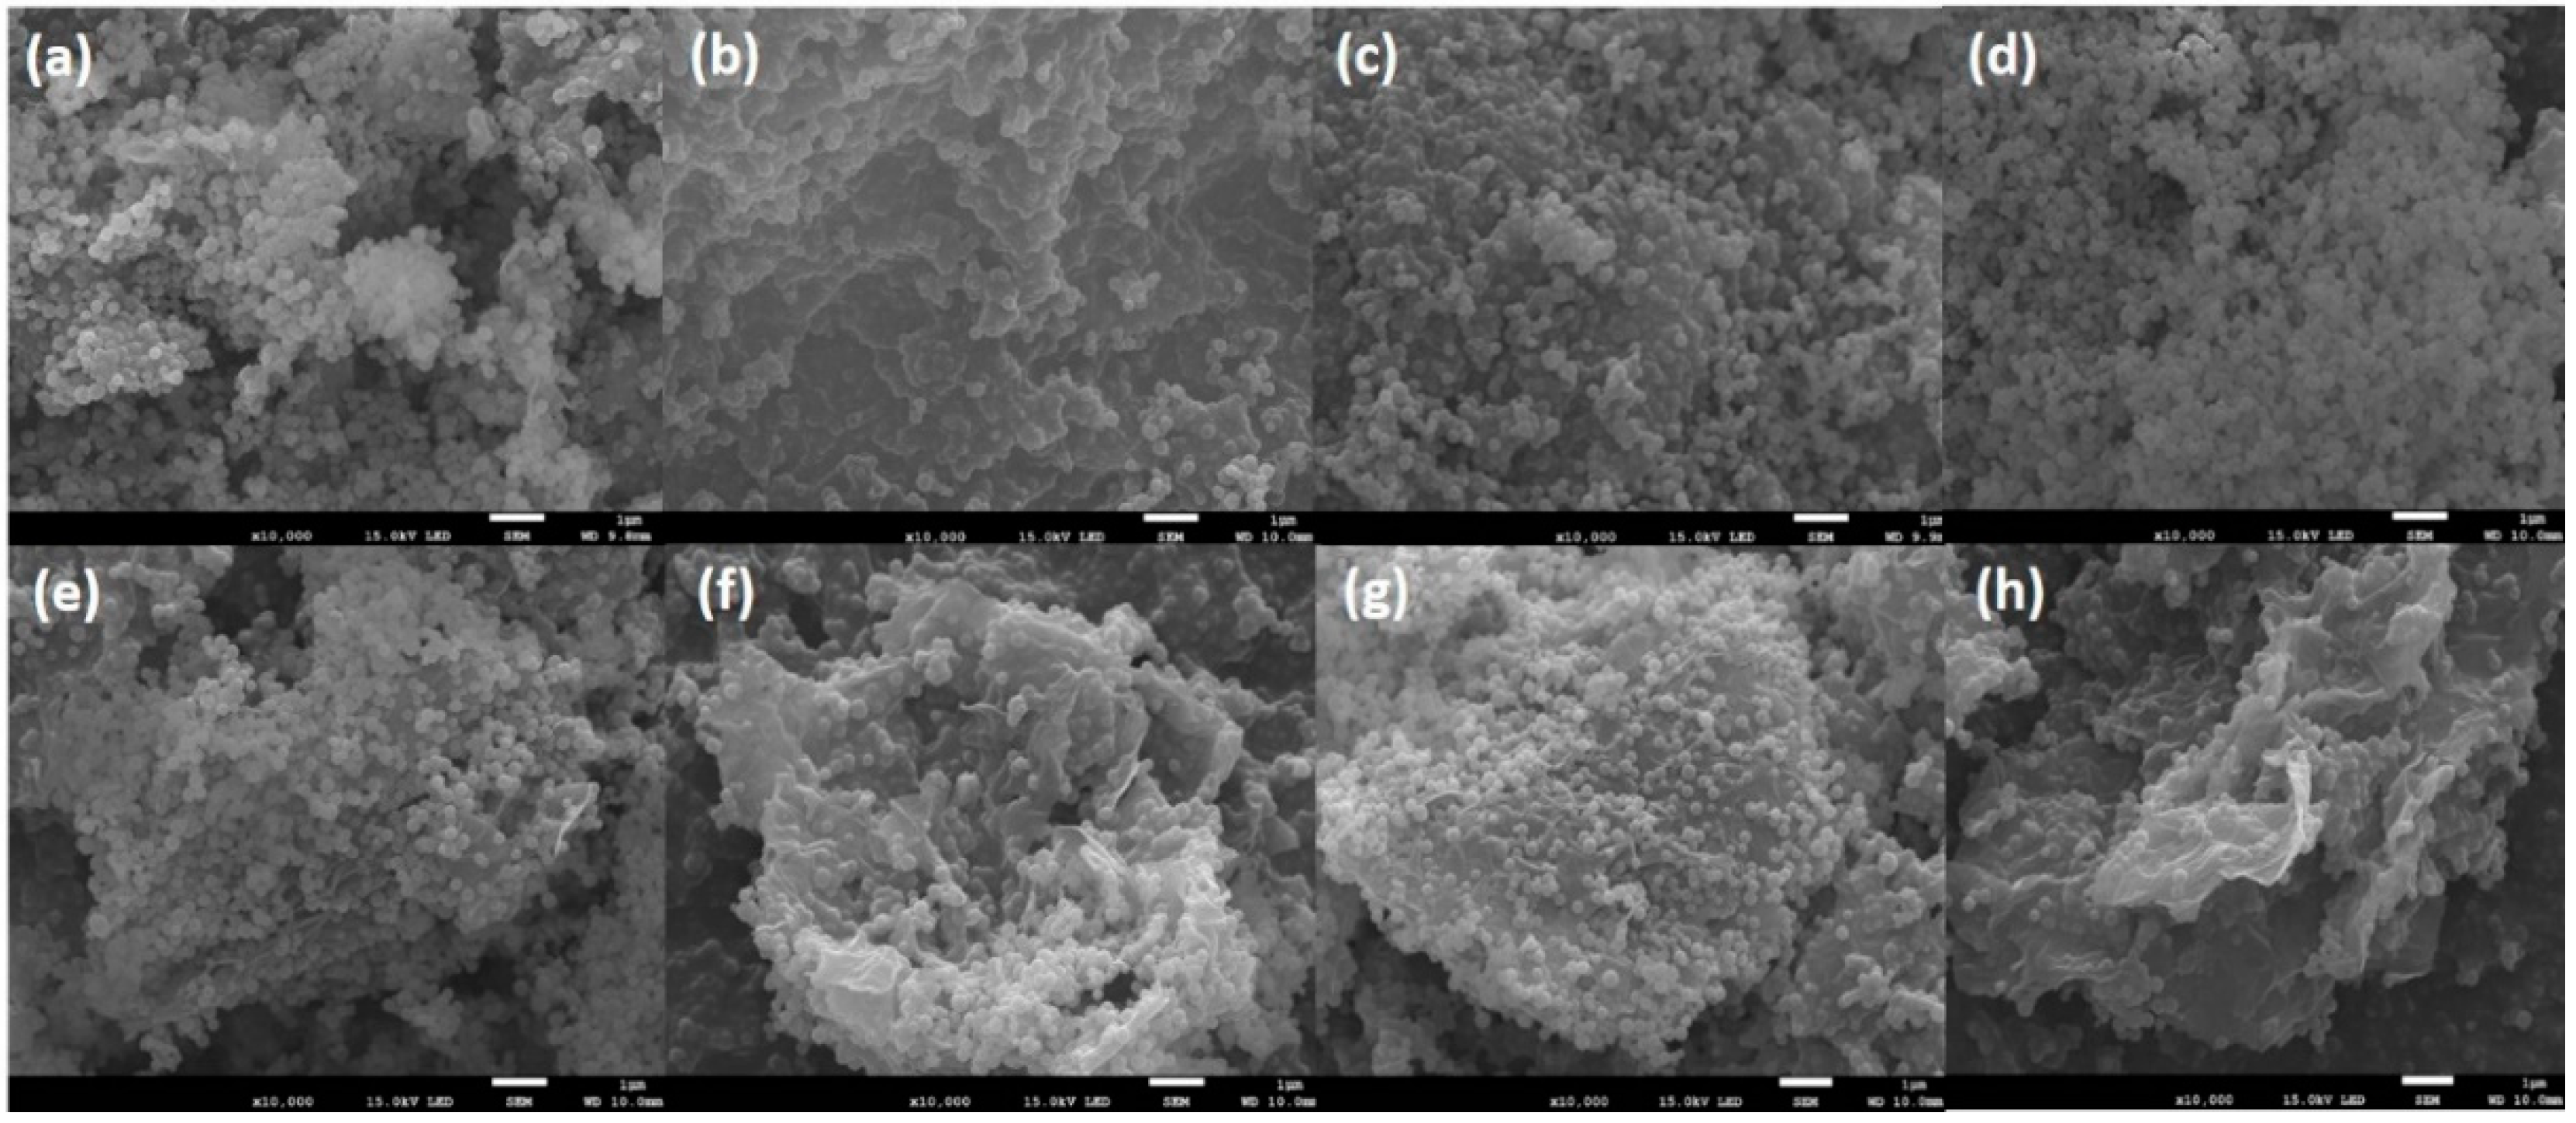
2.1. Structure and Crystalline Properties

The surface morphologies of the silica microspheres (SSx, where x refers to the average diameter), with average particle sizes of 100, 200, 300, and 400 nm (designated as SS100, SS200, SS300, and SS400, respectively), were analyzed via scanning electron microscopy (SEM; Figure 1a–d); the processing parameters and diameter ranges are listed in Table S1. A hydrothermal process was then used to apply a TiO2-shell over each SSx core, using titanium (IV) butoxide (TBT) as the TiO2 precursor, to give the corresponding core-shell SiO2-TiO2 microspheres (TSx). The surface morphologies of TS100, TS200, TS300, and TS400 were also examined via SEM (Figure 1e–h), revealing rougher surfaces than those of their corresponding SS100, SS200, SS300, and SS400 cores. In addition, it is clear that the particle sizes increased by 20–60 nm upon addition of the TiO2-shells, indicating that the thicknesses of the shells are approximately 10–30 nm. X-ray diffraction (XRD) analyses also confirmed the successful coating of the SSx with the desired TiO2 species. Specifically, comparing the XRD patterns of the SSx and TSx (Figure S1a,b, respectively) verified the presence of weak but characteristic anatase peaks in the latter.
The pH values of the catalyst solutions were adjusted to 8, 10, 12, or 14 for the subsequent hydrothermal process applied to remove the SiO2 core, followed by calcination at 470 °C. The SEM images of the resultant hollow TiO2 microsphere (hTSx-y in which y refers to the pH; hTS200-8, hTS200-10, hTS200-12, and hTS200-14) photocatalyst surfaces are shown in Figure 2a–d, and the mass fraction of residual SiO2 in each sample is provided in Table S2. At pH 8 and 10, the sodium hydroxide concentration was too low to remove the SiO2 core from the TiO2 shell. As a result, there are large amounts of residual SiO2 in hTS200-8 (65 wt%) and hTS200-10 (51 wt%), as indicated in the scanning electron microscopy-energy dispersive spectroscopy (EDS) results. With an increase in the pH to 12, the morphology of the TiO2 shell became nanoflake-like (Figure 2c), which greatly improved the SSA (141.88 m2/g) of the photocatalyst. As a result, the majority of the SiO2 core was removed (4.1 wt% residual SiO2) while maintaining the hierarchical structure of the microsphere. At a hydrothermal pH ≤ 12, the EDS and Fourier-transform infrared (FTIR) (Figure S2) analyses showed similar results regarding the effect of the processing pH on the hTSx-y structures; however, a further increase in the pH to 14 destroys the microspheres. The hollow microsphere structure of hTSx-y was clearly observed via transmission electron microscopy (TEM) (Figure S3), indicating that our proposed two-step hydrothermal method can effectively remove the SiO2 core and produce the desired TiO2 shell, resulting in the target hollow microspheres.
The XRD patterns of hTS200-8, hTS200-10, hTS200-12, and hTS200-14 (Figure 3) only show characteristic TiO2 diffraction peaks when a hydrothermal pH of at least 12 is used. Specifically, the XRD pattern of hTS200-12 exhibits diffraction peaks corresponding to the (101), (103), (004), (112), (200), (105), (211), and (204) planes of anatase TiO2 (JCPDS no. 00-021-1272). However, an increase in the pH to 14 (i.e., hTS200-14) slightly shifts the peaks to lower two theta values, resulting in a pattern that better resembles that of the anatase phase. This indicates the presence of lattice strain in hTS200-12, which is likely owing to stress induced by its lattice defects; although such defects have reportedly resulted in improved photocatalytic activity [23]. In contrast, 77 K N2 adsorption/desorption evaluations indicated that the SSAs of the resultant photocatalysts follow the order: hTS200-12 (141.88 m2/g) >> hTS200-14 (64.93 m2/g) > hTS200-10 (41.64 m2/g) > hTS200-8 (37.92 m2/g). The low SSAs of hTS200-10 and hTS200-8 are attributed to the large amounts of residual SiO2 present in the materials; this is supported by the larger SSA of hTS200-12, as it contained less residual SiO2 than hTS200-10 and hTS200-8. The maximum SSA was observed for hTS200-12, as increasing the processing pH to 14 leads to the collapse of the microsphere and thus a reduced SSA. Therefore, the characterization results suggest that among these four samples, hTS200-12 would perform best as a photocatalyst.

2.2. Photocatalytic CO and CH4 Production

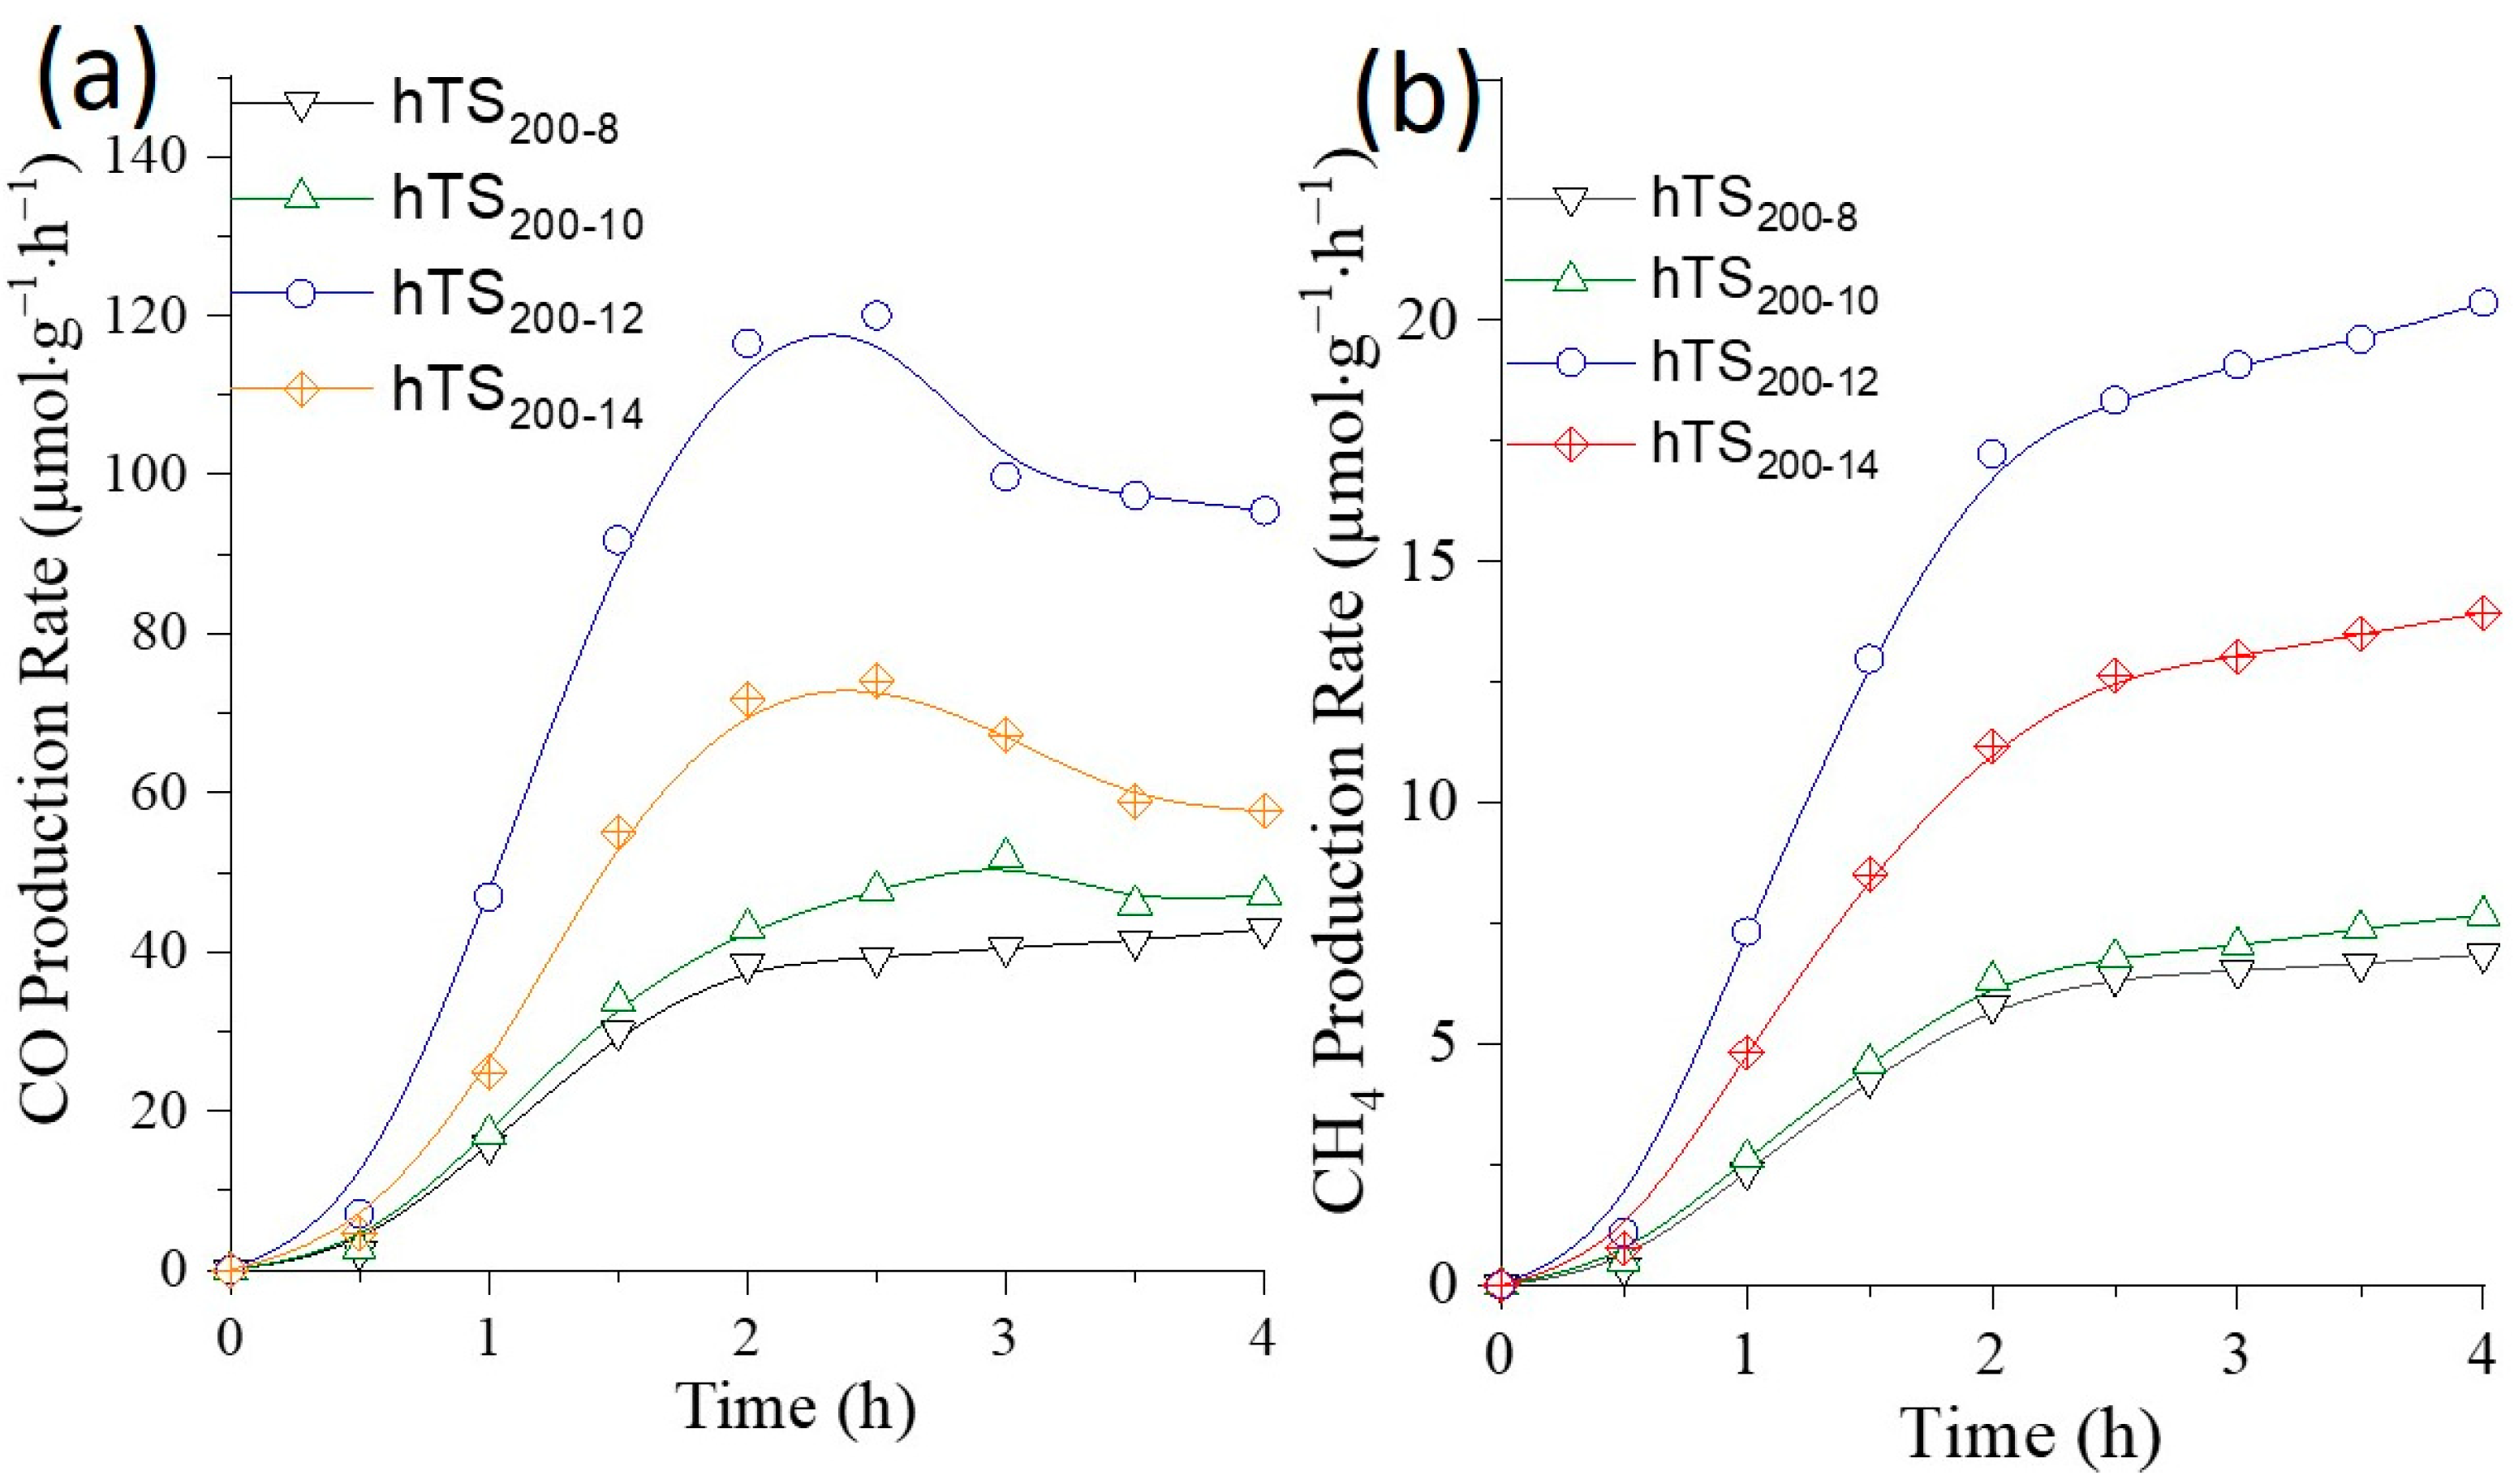
2.2.1. Effect of the Processing pH of the Catalyst on Its Photocatalytic Performance

The UV-vis diffuse reflectance spectroscopy (UV-DRS) spectra of the hTS200-y samples (Figure 4) show that the absorption edges continuously red-shift with a gradual increase in the processing pH of the catalysts; this implies a narrowing of their band gaps. Further analysis using Tauc plots indicated that the band gaps followed the order: hTS200-12 (3.4 eV) < hTS200-14 (3.6 eV) < hTS200-8 (3.9 eV) = hTS200-10 (3.9 eV). Therefore, the large band gaps of the samples processed at pH 8 and 10 can be attributed to the large amounts of residual SiO2 they contain (hTS200-8, 65 wt%; hTS200-10, 51 wt%). However, only 4.1 wt% SiO2 remained in the sample prepared at a pH of 12 (hTS200-12). This Si impurity induced the lattice strain observed in the XRD pattern of hTS200-12 (as discussed in Section 3.1) and resulted in this catalyst exhibiting the smallest band gap. A further increase in the pH to 14 led to enhanced anatase TiO2 crystallization (as discussed in Section 3.1), and, thus, an increase in the hTS200-14 band gap.
The effects of the hydrothermal pH on the actual performance of the hTS200-8, hTS200-10, hTS200-12, and hTS200-14 photocatalysts in CO2PR were subsequently examined (Figure 5). Both the CO and CH4 production rates increase with an increase in the processing pH up to a pH > 12. Owing to their poor anatase crystallinities (Figure 3), hTS200-8 and hTS200-10 exhibit much poorer overall performances than the other photocatalysts. Although hTS200-14 exhibits the highest level of crystallinity, its inferior band gap and SSA to those of hTS200-12 result in its CO and CH4 production efficiencies being lower than those of hTS200-12. The CO and CH4 production efficiencies of the photocatalysts follow the order: hTS200-12 >> hTS200-14 >> hTS200-8 > hTS200-10, which coincides with the variations in their band gaps and SSAs (Table S2).

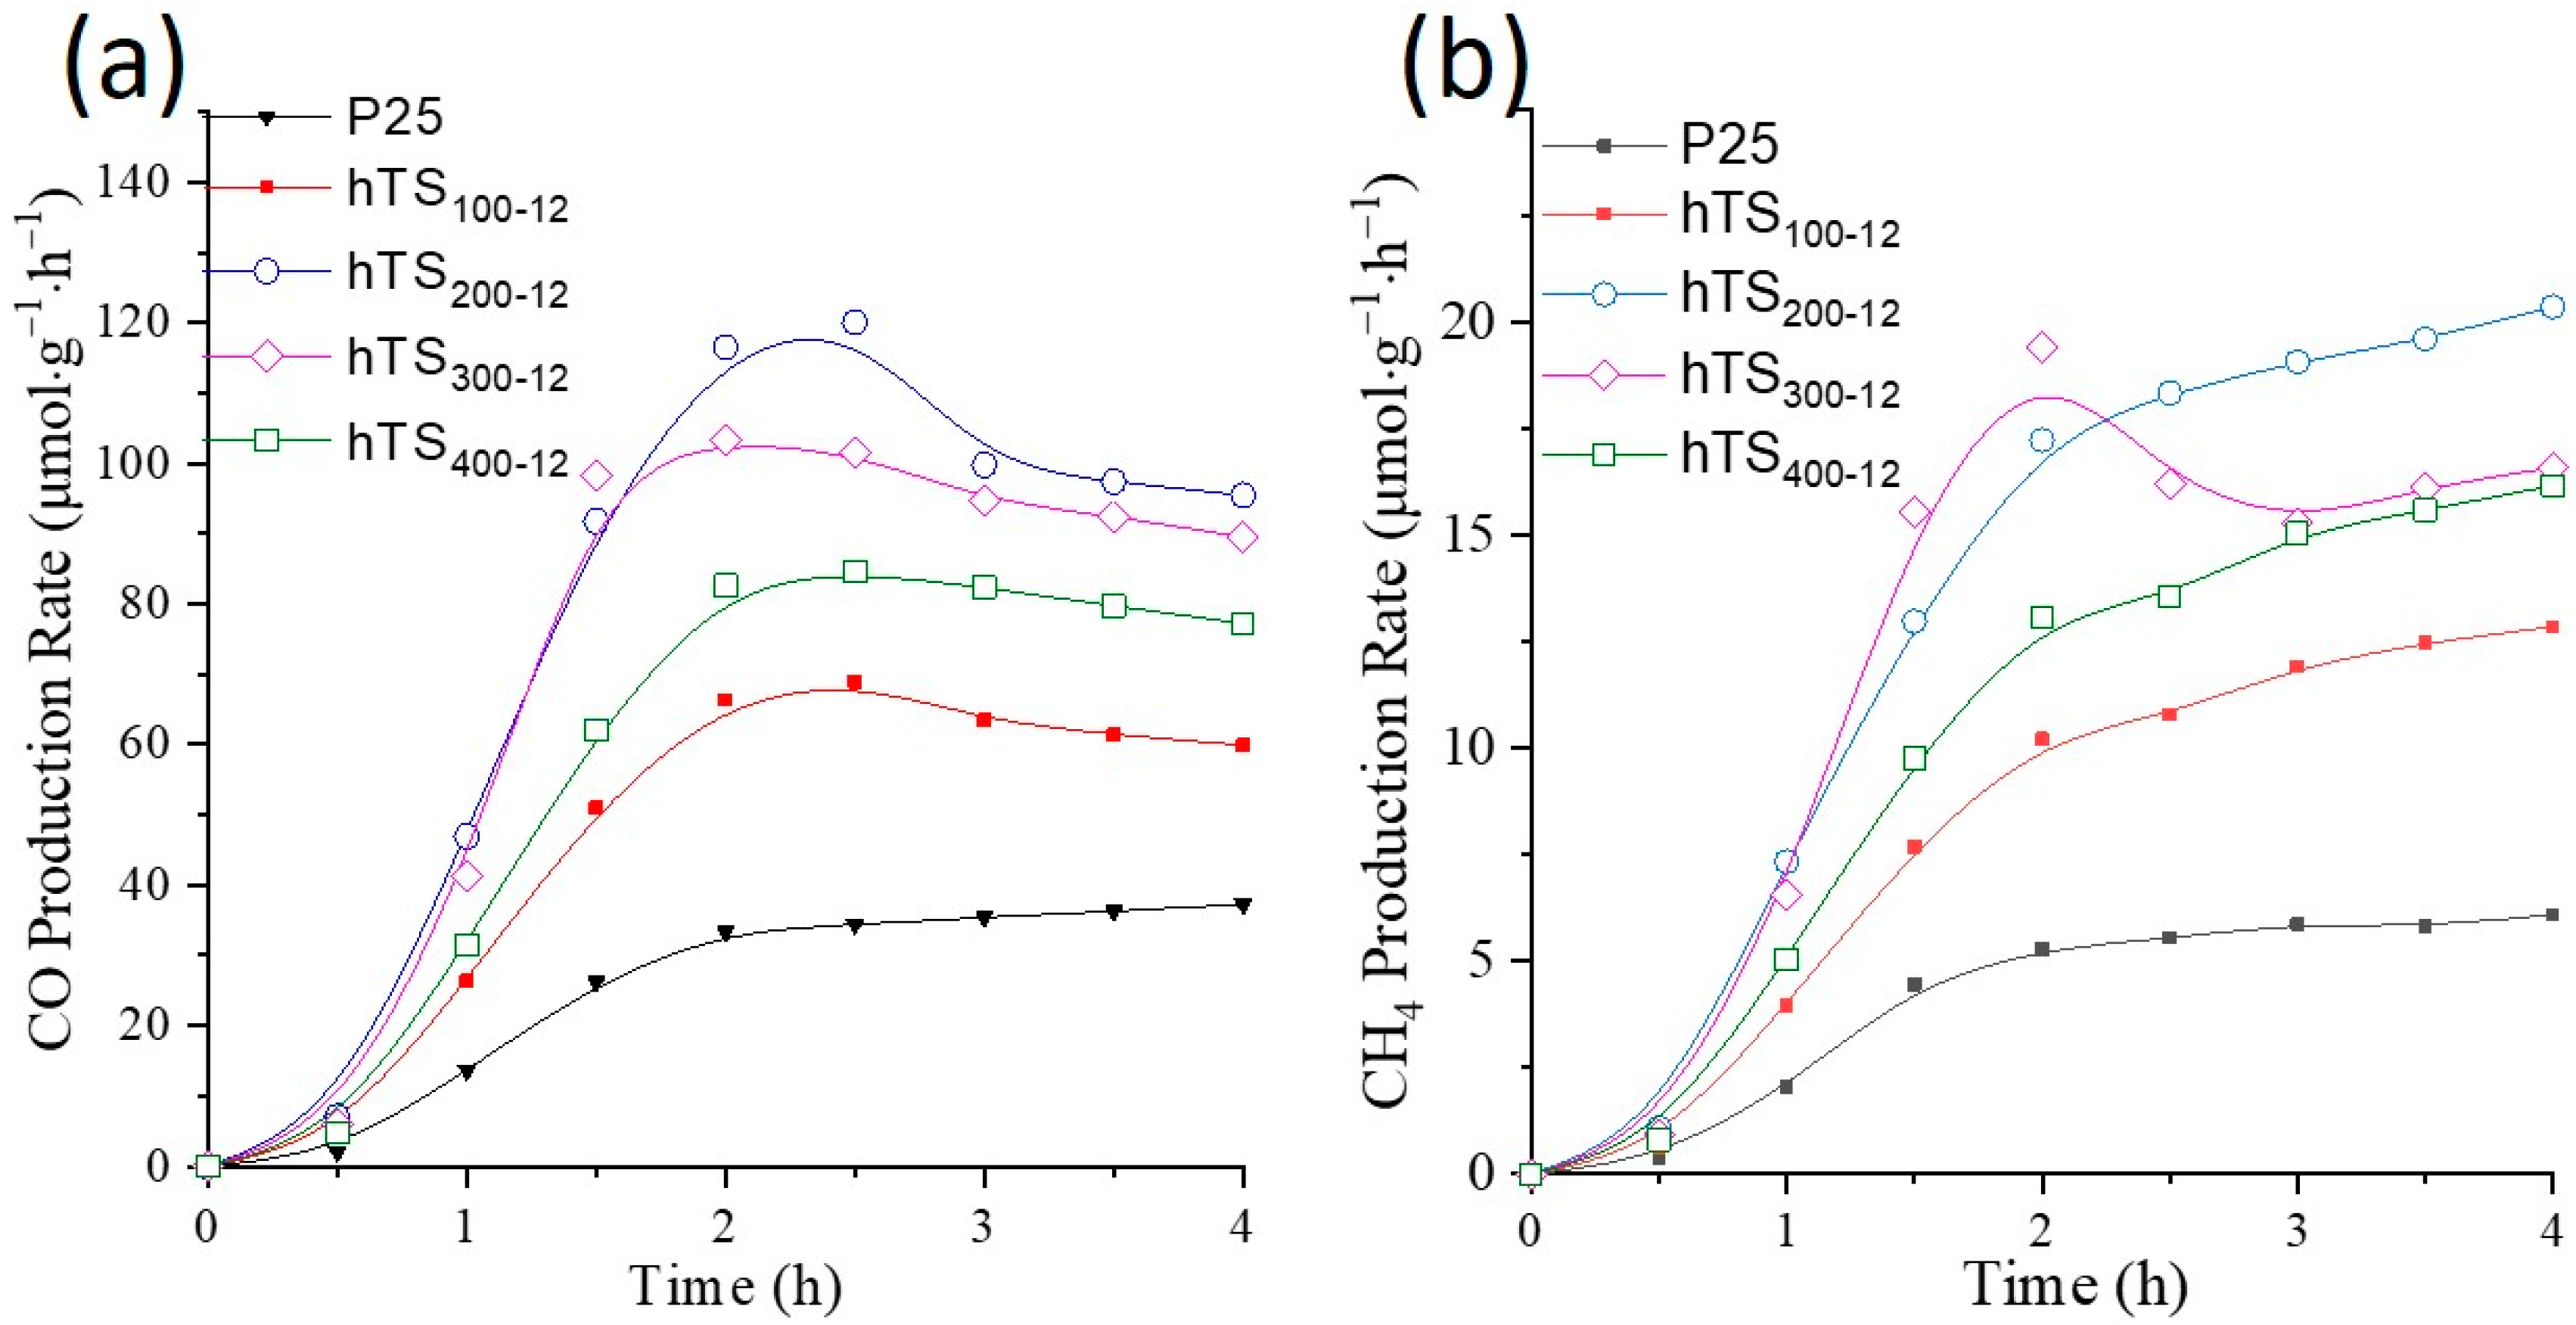
2.2.2. Effect of the Catalyst Cavity Size on Its Photocatalytic Performance

Employing the optimal catalyst processing pH (12), the effect of the cavity sizes of the hTS100-12, hTS200-12, hTS300-12, and hTS400-12 photocatalysts (i.e., the macropore size) on their CO2PR activity was evaluated in our homemade CO2PR system. Figure 6 shows the CO and CH4 production rates achieved during irradiation in the presence of the photocatalysts; CO is the major product. The CO/CH4 production rates achieved by the hTSx-12 photocatalysts increase during the first 2 h, owing to irradiation-induced catalyst activation. Upon reaching their maximum values after approximately 2 h of irradiation, the CO production rates leveled off and those of CH4 increased at a much slower rate; the CO and CH4 production rates with hTS200-12 and hTS300-12, respectively, first achieved decrease before levelling off. The results in Figure 5 show a similar trend. After 4 h, the maximum CO yields obtained using commercial P25, hTS100-12, hTS200-12, hTS300-12, and hTS400-12 were 37.2, 60.1, 95.2, 89.7, and 77.4 µmole/g h, respectively. The hTS200-12 sample achieved the highest CO production rate, which could be due to various factors, including its light utilization efficiency, SSA, mass transfer abilities, and catalyst utilization rate. For example, it is well known that the SSA of particles decrease with an increase in their size; in contrast, the convection and diffusion rates of products/reactants increase and decrease, respectively, with an increase in the particle size. Consequently, the optimized performance was achieved using microspheres with a diameter of 200 nm. Notably, all the hTSx-12 photocatalysts outperformed the commercial P25 nanoparticles, which emphasizes the advantages of applying hollow microspheres as photocatalysts for CO2PR.
Other than the cavity size, photogenerated electrons with higher reduction potentials offer overpotential for chemical reactions, e.g., the production of CO (2e, −0.53 V) and CH4 (8e, −0.24 V). The reduction potential of a species is a measure of its ability to gain electrons. To reduce CO2 into CO or CH4, the electrons in the conducting band should have a more negative chemical potential than the reduction potentials [24]. From a thermodynamic perspective, the production of CH4 is more favorable than that of CO, as CH4 is produced at a lower potential. However, the kinetic limitation makes CH4 production more difficult than CO production because more electrons are required for the production of CH4 [25]. Moreover, the actual redox potential of the reaction is determined by the reaction pathway followed; a series of one-electron processes or a one-step multi-electron process can occur between the photocatalyst and absorbed CO2. Therefore, an excited electron with a more negative reduction potential will result in the formation of multiple products during CO2PR. Generally, the overall production rate is related to the active surface area of the catalyst and the selectivity of each product is related to complex surface properties, including excitation/recombination of electron-hole pairs and the charge transfer efficiency of the photocatalysts [26]. Over our proposed hTSx-12 photocatalysts, the production rates of CO and CH4 show similar trends, suggesting that the product selectivity did not change over time; this has also been reported in the literature [27].
Considering the long-term stability, the hTS200-12 photocatalyst with optimized hydrothermal pH value and cavity size was examined under irradiation for 24 h. As can be seen in Figure S4, there was no decay observed on CO and CH4 production rates within 24 h, which shows computable stability among the TiO2-based photocatalysts [28,29,30].

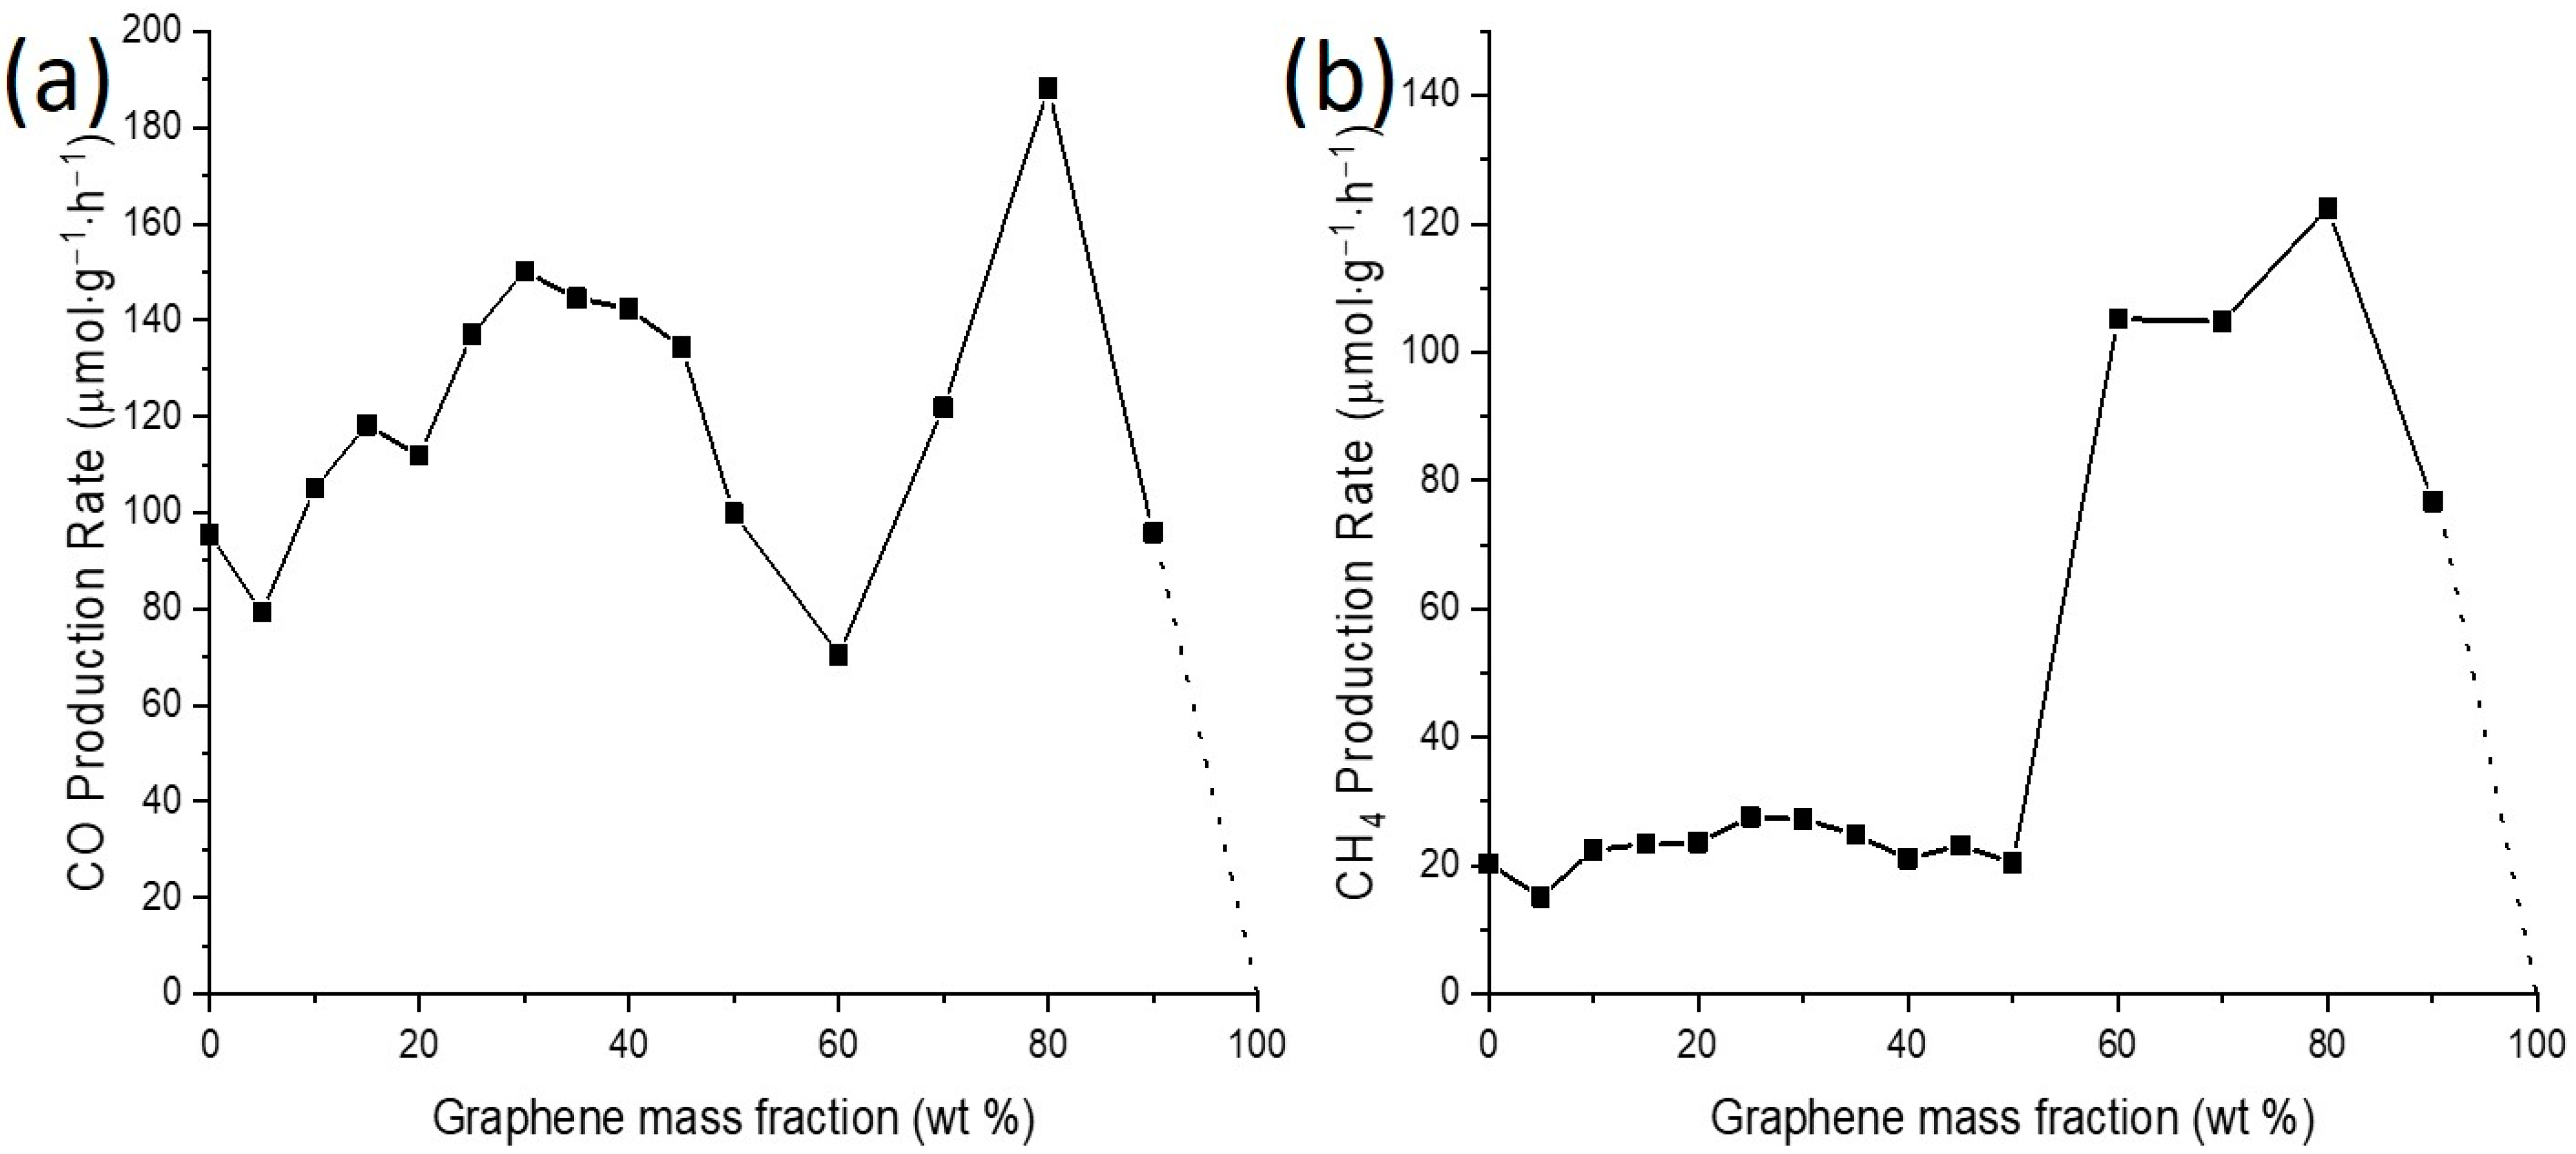
2.3. Effect of the hTS200-12/Graphene Ratio on Its Photocatalytic Performance

To improve the dispersion of the photocatalysts and enhance their light utilization and photoactivity, hTS200-12 was hybridized with 5, 30, 45, 50, 60, 70, 80, and 90 wt% graphene to produce hTS200-12/graphene composites (hTS200-12Gz; z = wt% graphene). The SEM images of the hybrids show that an increase in the amount of graphene from 5 to 50 wt% reduces the extent of hTS200-12 agglomeration (Figure 7a–d). Further increasing the graphene mass fraction gradually increased the exposure of the surface of hTS200-12Gz (Figure 7e–h). The CO/CH4 production rates during irradiation in the presence of the composites were evaluated (Figure S5). Interestingly, at a graphene amount of ≤50 wt%, the rate–time curves between 0 and 2 h are concave upward with small initial slopes. This can be attributed to hTS200-12 agglomeration, which leads to slow mass transfer of the reactants/products and inhibits activation of the photocatalyst. In contrast, the rate–time curves obtained over the same time range when using the composites comprising >50 wt% graphene are concave downward with high initial slopes. This suggests that the incorporation of >50 wt% graphene improves the dispersity of hTS200-12, allowing its efficient contact with the reaction gases; therefore, hTS200-12 is activated and reaches its maximum activity more quickly when coupled with >50 wt% graphene.
Most of the hTS200-12Gz photocatalysts exhibited stable photocatalytic activity between 2 and 4 h; however, to better evaluate the effect of the graphene amount in the composites on the CO and CH4 production rates, the activities of the composites were examined at the fourth hour (Figure 8a,b). Briefly, with an increase in the graphene content from 0 to 30 wt%, the CO production rate reaches its maximum value (150.5 µmole/g h); this value is 1.56 times greater than that achieved using hTS200-12. This result can be attributed to a reduction in the extent of agglomeration of hTS200-12 with an increase in the graphene content. This same graphene content range has a negligible effect on the CH4 production rate, while a further increase in the graphene content to 60 wt% results in a dramatic increase in the production of CH4 but a decrease in the production of CO. Figure 8a,b also shows that the CO production rate is more sensitive to a change in the composite graphene content than the CH4 production rate. There are three possible reasons for this observation: firstly, it has been reported that the band gap of TiO2/graphene can decrease with an increase in the graphene content or bond strength between graphene and TiO2 [31,32]; the bandgap is key when considering product selectivity [5,12,15]. Secondly, improving the degree of dispersion of hTS200-12 on graphene can result in an overall higher catalytic activity potential for the composites. Thirdly, it has been reported that TiO2 can cause the photodegradation of graphene oxide under irradiation [33], or the formation of Ti-C and Ti-O-C bonds between the C atoms of graphene and Ti atoms in TiO2 [34], which could lead to changes in the photocatalytic activity of the composite. According to Akhavan et al., the D, G, and 2D bands in the Raman spectrum of graphene oxide change as a function of the irradiation time [33]; this suggests that photodegradation of graphene could also occur for our hTS200-12Gz photocatalysts. This hypothesis was in agreement with the long-term stability test of hTS200-12G80 (Figure S6), which indicates the decay on both CO and CH4 production rates. In addition, these three factors can influence each other; however, overall, changes in the CO/CH4 production rates are correlated. Notably, using a graphene mass fraction of 80 wt% in the composite photocatalyst resulted in optimal CO (187.9 µmole/g h; twice that achieved with hTS200-12) and CH4 (6 times that achieved with hTS200-12) production rates, which could be attributed to the excellent dispersion of hTS200-12 on graphene at this ratio.

3. Materials and Methods

3.1. Preparation of Silica Microspheres (SSx)

The silica microspheres (SSx; x = average diameter) were prepared using a modified version of the procedure reported by Jiang et al., [35]. Briefly, tetraethoxysilane (TEOS; 1.0, 2.4, 5.0, 10.0, or 20.0 mL), the silicon source, was added to a solution containing absolute ethanol (100 mL), deionized water (5, 10, 15, 20, or 30 mL), and ammonia (4.5, 10.0, 15.0, or 20.0 mL) and stirred for approximately 10 min until the liquid became cloudy and white. After stirring for 12 h at room temperature, the suspension was centrifuged (7000 rpm; 10 min), washed with deionized water, and dried. The detailed processing parameters and corresponding specifications of the resultant SSx are listed in Table S1.

3.2. Preparation of TiO2/SiO2 Microspheres (TSx)

The core-shell SiO2-TiO2 microspheres (TSx) were prepared by a hydrothermal process similar to that reported by Tim et al. [36]. First, SSx (0.1 g) were suspended in absolute ethanol (100 mL) while stirring vigorously, followed by sonication (30 min) to completely disperse the SSx. Then, ammonia (0.25 mL) was added dropwise while stirring, followed by the addition of titanium (IV) butoxide (TBT; 0.9 mL) as the titanium source; the mixture was stirred at room temperature for 12 h. The resultant white colloidal spheres were separated by centrifugation (7000 rpm) over 10 min, washed several times with deionized water, and then dried to give the core–shell TSx microspheres.

3.3. Preparation of Hollow TiO2 Microspheres (hTSx-y)

To remove the silica cores of the hybrid microspheres, 10 mg/mL microsphere suspensions were prepared, shaken in an ultrasonic oscillator for 10 min, and their pH values adjusted to 8, 10, 12, or 14 using 1 M sodium hydroxide and 1 M hydrochloric acid. The solutions were transferred to a Teflon-lined stainless-steel autoclave and heated at 180 °C for 6 h in a programmable oven. The solutions were then centrifuged at 7000 rpm for 10 min, and each separated product washed several times with deionized water, giving the desired hTSx-y (x = average diameter of the cavity, y = processing pH used during the hydrothermal process) after calcination at 470 °C. The detailed processing parameters and corresponding specifications of the resultant hTSx-y materials are listed in Table S2.

3.4. Preparation of the Hollow Titanium Dioxide Microsphere/Graphene Composite Photocatalysts on Quartz Wool (hTS200-12Gz)

To further improve the overall photocatalytic activity of hTSx-y, they were modified with commercially available graphene (N002-PDR, Angstron Materials Inc. (AMI, Taoyuan, Taiwan), as described in the Supplemental Information (Figures S7 and S8)). Briefly, slurries of the photocatalysts, containing designated ratios of hTSx-y/graphene, were prepared in anhydrous ethanol under ultrasonic treatment over 10 min. After drying, the obtained hTSx-yGz (z = mass fraction of graphene in hTSx-y/graphene) photocatalysts were dispersed on quartz wool. The designated parameters of hTSx-yGz and the corresponding CO2PR results are listed in Table 1.

3.5. Material Characterization

The micro-morphologies and compositions of each photocatalyst were examined by SEM and EDS, respectively, using a JSM-7100F thermal field emission electron microscope. Microscopic structure information was collected using high-resolution TEM (JEOL, Taichung, Taiwan, JEM-1400). Nitrogen adsorption isotherms (77 K) and the Brunauer–Emmett–Teller (BET) method were used to examine the SSAs of the samples (Micromeritics ASAP 2460 volumetric adsorption analyzer, Taichung, Taiwan). The crystalline structures of the TiO2-related phases were examined by powder XRD using an X’Pert³ powder diffractometer (Cu Kα; λ = 0.15405 nm, Taichung, Taiwan). UV-DRS was performed in the 200–800 nm wavelength range on a dual beam UV-Vis spectrophotometer (DS5, Taichung, Taiwan) equipped with an integrating sphere assembly (BaSO4 was used as the reflectance standard). FTIR spectra were recorded on a Nicolet™ iS20 (Taichung, Taiwan) spectrometer on powder samples embedded in KBr disks. The photoluminescence (PL) spectra of the samples were obtained using a JASCO FP-8200 (Taichung, Taiwan) fluorescence spectrometer equipped with a 150 W Xe lamp (270 V), using a shielded lamp house as the excitation source.

3.6. Photocatalytic Reaction

The CO2PR performances of commercial P25 (shown in Figure S9) and the hTSx-yGz samples were examined using a homemade photoreaction system. Generally, the volume of the reaction chamber was 240 mL with a quartz cover serving as the window for light irradiation from a 100 W Hg lamp. The compositions of the produced gases were analyzed using a gas chromatograph (Agilent 6890 N, Taichung, Taiwan, with He as the carrier gas).

4. Conclusions

In this study, composite photocatalysts composed of hTS and graphene were prepared. The effects of the hTS size, processing pH value, and graphene ratio on the CO2PR performance of the catalysts were examined. The catalyst cavity size that resulted in the optimal hTS photocatalytic activity was established to be 200 nm (i.e., hTS200-y). Furthermore, the processing pH was found to influence the SSA of the catalyst; the SSAs of the catalysts follow the order: hTS200-12 > hTS200-14 > hTS200-10 > hTS200-8 > p25. The SiO2 core was not dissolved at a pH < 12, while pH 14 caused the hTS structure to collapse. The photocatalyst band gaps are similarly ordered: hTS200-12 < hTS200-14 < hTS200-10 < hTS200-8. The XRD analysis suggested greater lattice strain in hTS200-12 than hTS200-14 owing to residual SiO2 in the former; this led to hTS200-12 having a smaller band gap and higher photocatalytic activity. As a result, hTS200-12 exhibited the best CO2PR efficiency. Finally, the hTS200-12/graphene ratio use for the composite photocatalysts was studied; a graphene content of 80 wt% resulted in the best hTS200-12 dispersion, reducing the extent of agglomeration. As a result, the CO and CH4 yields obtained via CO2PR over hTS200-12G80 were two and six times greater, respectively, than that achieved when using hTS100-12. In short, this study optimized the cavity diameter, processing pH value, and graphene content of hTS/graphene composite photocatalysts, providing a general guideline for the design of hollow microsphere-based photocatalysts for CO2PR.

Supplementary Materials

The following are available online at https://www.mdpi.com/article/10.3390/catal11121532/s1, Table S1: Processing parameters and diameter ranges of silica microspheres. Table S2: Analysis of the Pore Properties of Silica Balls with Different Particle Sizes. Figure S1: XRD patterns of (a) SSx and (b) TSx. Figure S2: FTIR spectra of hTS200-y samples. Figure S3: TEM image of hTSx-y. Figure S4: Long-term stability test of hTS200-12 photocatalyst for the production rates of (a) CO and (b) CH4. The long-term irradiation was conducted in a commercial photocatalytic system (PCX50BDiscover, PerfectLight) with wavelength of 365 nm, and 50 ml quartz reactor. Figure S5: Effect of CO2PR reaction time over hTS200-12Gz on (a) CO and (b) CH4 yields. The photoreduction experiments were conducted in a homemade photoreaction system, where the volume of the reaction chamber was 240 mL with a quartz cover serving as the window for light irradiation from a 100 W Hg lamp. Figure S6: Long-term stability test of hTS200-12G80 photocatalyst for the production rates of (a) CO and (b) CH4. Figure S7: (a) SEM and (b) TEM image of graphene. Figure S8: Raman spectrum of N002-PDR graphene powder provided from Angstron Materials Inc. (AMI). Figure S9: Figure S1 SEM image of P25.

Author Contributions

Y.-C.C. and P.-J.X. partially conducted the experiments and wrote the manuscript. Y.-W.L. initiated the study and conducted sections of the experiments. A.-Y.L. provided experimental resources, and reviewed and edited the manuscript. All authors have read and agreed to the published version of the manuscript.

Funding

This research was funded by the Ministry of Science and Technology (MOST 108-2221-E-167-009-MY3; Taiwan).

Data Availability Statement

Data is contained within the article.

Conflicts of Interest

The authors declare no conflict of interest.

References

  1. Lo, A.-Y.; Chang, C.-C.; Lai, Y.-W.; Chen, P.-R.; Xu, B.-C. Improving the Supercapacitor Performance by Dispersing SiO2 Microspheres in Electrodes. ACS Omega 2020, 5, 11522–11528. [Google Scholar] [CrossRef]
  2. Lo, A.-Y.; Saravanan, L.; Tseng, C.-M.; Wang, F.-K.; Huang, J.-T. Effect of Composition Ratios on the Performance of Graphene/Carbon Nanotube/Manganese Oxide Composites toward Supercapacitor Applications. ACS Omega 2020, 5, 578–587. [Google Scholar] [CrossRef] [PubMed] [Green Version]
  3. Lo, A.-Y.; Huang, C.-Y.; Sung, L.-Y.; Louh, R.-F. Low Humidifying Proton Exchange Membrane Fuel Cells with Enhanced Power and Pt–C–h-SiO2 Anodes Prepared by Electrophoretic Deposition. ACS Sustain. Chem. Eng. 2016, 4, 1303–1310. [Google Scholar] [CrossRef]
  4. Ran, J.; Jaroniec, M.; Qiao, S.-Z. Cocatalysts in semiconductor-based photocatalytic CO2 reduction: Achievements, challenges, and opportunities. Adv. Mater. 2018, 30, 1704649. [Google Scholar] [CrossRef]
  5. Li, X.; Yu, J.; Jaroniec, M.; Chen, X. Cocatalysts for selective photoreduction of CO2 into solar fuels. Chem. Rev. 2019, 119, 3962–4179. [Google Scholar] [CrossRef] [PubMed]
  6. Sohn, Y.; Huang, W.; Taghipour, F. Recent progress and perspectives in the photocatalytic CO2 reduction of Ti-oxide-based nanomaterials. Appl. Surf. Sci. 2017, 396, 1696–1711. [Google Scholar] [CrossRef]
  7. Sun, W.; Meng, X.; Xu, C.; Yang, J.; Liang, X.; Dong, Y.; Dong, C.; Ding, Y. Amorphous CoOx coupled carbon dots as a spongy porous bifunctional catalyst for efficient photocatalytic water oxidation and CO2 reduction. Chin. J. Catal. 2020, 41, 1826–1836. [Google Scholar] [CrossRef]
  8. Wang, L.; Zhu, B.; Cheng, B.; Zhang, J.; Zhang, L.; Yu, J. In-situ preparation of TiO2/N-doped graphene hollow sphere photocatalyst with enhanced photocatalytic CO2 reduction performance. Chin. J. Catal. 2021, 42, 1648–1658. [Google Scholar] [CrossRef]
  9. Thompson, W.A.; Sanchez Fernandez, E.; Maroto-Valer, M.M. Review and analysis of CO2 photoreduction kinetics. ACS Sustain. Chem. Eng. 2020, 8, 4677–4692. [Google Scholar] [CrossRef] [Green Version]
  10. Liu, J.; Niu, Y.; He, X.; Qi, J.; Li, X. Photocatalytic Reduction of CO2 Using TiO2-Graphene Nanocomposites. J. Nanomater. 2016, 2016, 6012896. [Google Scholar] [CrossRef] [Green Version]
  11. Fujishima, A.; Honda, K. Electrochemical Photolysis of Water at a Semiconductor Electrode. Nature 1972, 238, 37–38. [Google Scholar] [CrossRef]
  12. Lo, A.-Y.; Taghipour, F. Review and prospects of microporous zeolite catalysts for CO2 photoreduction. Appl. Mater. Today 2021, 23, 101042. [Google Scholar] [CrossRef]
  13. Mikrut, P.; Kobielusz, M.; Macyk, W. Spectroelectrochemical characterization of euhedral anatase TiO2 crystals—Implications for photoelectrochemical and photocatalytic properties of {001} {100} and {101} facets. Electrochim. Acta 2019, 310, 256–265. [Google Scholar] [CrossRef]
  14. Balayeva, N.O.; Mamiyev, Z.; Dillert, R.; Zheng, N.; Bahnemann, D.W. Rh/TiO2-Photocatalyzed Acceptorless Dehydrogenation of N-Heterocycles upon Visible-Light Illumination. ACS Catal. 2020, 10, 5542–5553. [Google Scholar] [CrossRef]
  15. Lo, A.-Y.; Taghipour, F. Ordered Mesoporous Photocatalysts for CO2 Photoreduction. J. Mater. Chem. A 2021, 9, 26430–26453. [Google Scholar] [CrossRef]
  16. Li, Y.; Fu, R.; Gao, M.; Wang, X. B–N co-doped black TiO2 synthesized via magnesiothermic reduction for enhanced photocatalytic hydrogen production. Int. J. Hydrogen Energy 2019, 44, 28629–28637. [Google Scholar] [CrossRef]
  17. Barkhade, T.; Banerjee, I. Optical Properties of Fe doped TiO2 Nanocomposites Synthesized by Sol-Gel Technique. Mater. Today: Proc. 2019, 18, 1204–1209. [Google Scholar] [CrossRef]
  18. Wu, T.; Zhen, C.; Wu, J.; Jia, C.; Haider, M.; Wang, L.; Liu, G.; Cheng, H.-M. Chlorine capped SnO2 quantum-dots modified TiO2 electron selective layer to enhance the performance of planar perovskite solar cells. Sci. Bull. 2019, 64, 547–552. [Google Scholar] [CrossRef] [Green Version]
  19. Nguyen, C.H.; Tran, M.L.; Tran, T.T.V.; Juang, R.-S. Enhanced removal of various dyes from aqueous solutions by UV and simulated solar photocatalysis over TiO2/ZnO/rGO composites. Sep. Purif. Technol. 2020, 232, 115962. [Google Scholar] [CrossRef]
  20. Diaz-Angulo, J.; Arce-Sarria, A.; Mueses, M.; Hernandez-Ramirez, A.; Machuca-Martinez, F. Analysis of two dye-sensitized methods for improving the sunlight absorption of TiO2 using CPC photoreactor at pilot scale. Mater. Sci. Semicond. Process. 2019, 103, 104640. [Google Scholar] [CrossRef]
  21. Low, J.; Cheng, B.; Yu, J. Surface modification and enhanced photocatalytic CO2 reduction performance of TiO2: A review. Appl. Surf. Sci. 2017, 392, 658–686. [Google Scholar] [CrossRef]
  22. Tan, L.-L.; Ong, W.-J.; Chai, S.-P.; Goh, B.T.; Mohamed, A.R. Visible-light-active oxygen-rich TiO2 decorated 2D graphene oxide with enhanced photocatalytic activity toward carbon dioxide reduction. Appl. Catal. B 2015, 179, 160–170. [Google Scholar] [CrossRef]
  23. Zhao, H.; Pan, F.; Li, Y. A review on the effects of TiO2 surface point defects on CO2 photoreduction with H2O. J. Mater. 2017, 3, 17–32. [Google Scholar] [CrossRef]
  24. Kubacka, A.; Fernández-García, M.; Colón, G. Advanced Nanoarchitectures for Solar Photocatalytic Applications. Chem. Rev. 2012, 112, 1555–1614. [Google Scholar] [CrossRef]
  25. Navalón, S.; Dhakshinamoorthy, A.; Álvaro, M.; Garcia, H. Photocatalytic CO2 Reduction using Non-Titanium Metal Oxides and Sulfides. ChemSusChem 2013, 6, 562–577. [Google Scholar] [CrossRef]
  26. Li, K.; An, X.; Park, K.H.; Khraisheh, M.; Tang, J. A critical review of CO2 photoconversion: Catalysts and reactors. Catal. Today 2014, 224, 3–12. [Google Scholar] [CrossRef] [Green Version]
  27. Wang, X.; Xuan, X.; Wang, Y.; Li, X.; Huang, H.; Zhang, X.; Du, X. Nano-Au-modified TiO2 grown on dendritic porous silica particles for enhanced CO2 photoreduction. Microporous Mesoporous Mater. 2021, 310, 110635. [Google Scholar] [CrossRef]
  28. Wang, T.; Meng, X.; Liu, G.; Chang, K.; Li, P.; Kang, Q.; Liu, L.; Li, M.; Ouyang, S.; Ye, J. In situ synthesis of ordered mesoporous Co-doped TiO2 and its enhanced photocatalytic activity and selectivity for the reduction of CO2. J. Mater. Chem. A 2015, 3, 9491–9501. [Google Scholar] [CrossRef]
  29. Xue, H.; Wang, T.; Gong, H.; Guo, H.; Fan, X.; Gao, B.; Feng, Y.; Meng, X.; Huang, X.; He, J. Constructing Ordered Three-Dimensional TiO2 Channels for Enhanced Visible-Light Photocatalytic Performance in CO2 Conversion Induced by Au Nanoparticles. Chem. Asian J. 2018, 13, 577–583. [Google Scholar] [CrossRef]
  30. Tahir, B.; Tahir, M.; Amin, N.A.S. Photocatalytic CO2 conversion over Au/TiO2 nanostructures for dynamic production of clean fuels in a monolith photoreactor. Clean Technol. Environ. Policy 2016, 18, 2147–2160. [Google Scholar] [CrossRef]
  31. Štengl, V.; Popelková, D.; Vláčil, P. TiO2–Graphene Nanocomposite as High Performace Photocatalysts. J. Phys. Chem. C 2011, 115, 25209–25218. [Google Scholar] [CrossRef]
  32. Lee, J.S.; You, K.H.; Park, C.B. Highly Photoactive, Low Bandgap TiO2 Nanoparticles Wrapped by Graphene. Adv. Mater. 2012, 24, 1084–1088. [Google Scholar] [CrossRef]
  33. Akhavan, O.; Abdolahad, M.; Esfandiar, A.; Mohatashamifar, M. Photodegradation of Graphene Oxide Sheets by TiO2 Nanoparticles after a Photocatalytic Reduction. J. Phys. Chem. C 2010, 114, 12955–12959. [Google Scholar] [CrossRef]
  34. Akhavan, O.; Ghaderi, E. Photocatalytic Reduction of Graphene Oxide Nanosheets on TiO2 Thin Film for Photoinactivation of Bacteria in Solar Light Irradiation. J. Phys. Chem. C 2009, 113, 20214–20220. [Google Scholar] [CrossRef]
  35. Jiang, X.; Tang, X.; Tang, L.; Zhang, B.; Mao, H. Synthesis and formation mechanism of amorphous silica particles via sol–gel process with tetraethylorthosilicate. Ceram. Int. 2019, 45, 7673–7680. [Google Scholar] [CrossRef]
  36. Leshuk, T.; Linley, S.; Baxter, G.; Gu, F. Mesoporous Hollow Sphere Titanium Dioxide Photocatalysts through Hydrothermal Silica Etching. ACS Appl. Mater. Interfaces 2012, 4, 6062–6070. [Google Scholar] [CrossRef]
Figure 1. Scanning electron microscopy (SEM) images of the silica microspheres (SSx; x = average diameter) and those of the corresponding TiO2-coated microspheres (TSx): (a) SS100, (b) SS200, (c) SS300, (d) SS400, (e) TS100, (f) TS200, (g) TS300, and (h) TS400.
Catalysts 11 01532 g001
Figure 2. SEM images of the prepared hollow TiO2 microspheres (hTSx-y; x = average diameter, y = pH used during the hydrothermal process): (a) hTS200-8, (b) hTS200-10, (c) hTS200-12, and (d) hTS200-14.
Catalysts 11 01532 g002
Figure 3. X-ray diffraction (XRD) patterns of the hTS200-8, hTS200-10, hTS200-12, and hTS200-14 samples.
Catalysts 11 01532 g003
Figure 4. UV-vis diffuse reflectance spectroscopy (UV-DRS) spectra of the hTS200-y photocatalysts.
Catalysts 11 01532 g004
Figure 5. CO2 photoreduction (CO2PR) performance of the hTS200-y photocatalysts as a function of the processing pH of the catalysts: (a) CO, and (b) CH4 yields.
Catalysts 11 01532 g005
Figure 6. CO and CH4 production via CO2PR as a function of the hTSx-12 diameter: (a) CO, and (b) CH4 yields.
Catalysts 11 01532 g006
Figure 7. SEM images of the hTS200-12/graphene composites (hTS200-12Gz; z = wt% of graphene): hTS200-12Gz containing (a) 5, (b) 30, (c) 45, (d) 50, (e) 60, (f) 70, (g) 80, and (h) 90 wt% graphene.
Catalysts 11 01532 g007
Figure 8. Effect of the graphene mass fraction in hTS200-12Gz on the CO and CH4 yields achieved through CO2PR (reaction time: 4 h): (a) CO, and (b) CH4 yields.
Catalysts 11 01532 g008
Table 1. Sample designation and corresponding processing parameters.
DesignationParameter
SiO2 Microsphere
Diameter
(x; nm)
Hydrothermal pH Value
(y)
Graphene Mass
Fraction
(z; wt%)
P25 *------
hTSx-12G0 *100, 200, 300, 400120
hTS200-yG0 *2008, 10, 12, 140
hTS200-12Gz *200120, 5, 10, 15, 20, 25, 30, 35, 40, 45, 50, 60, 70, 80, 90
* Prepared on a quartz wool substrate.
Publisher’s Note: MDPI stays neutral with regard to jurisdictional claims in published maps and institutional affiliations.

