Article

TiO2–Zeolite Metal Composites for Photocatalytic Degradation of Organic Pollutants in Water

1
Department of Chemical and Biomolecular Engineering, ETSIIyT, University of Cantabria, Avda. Los Castros s/n, 39005 Santander, Spain
2
Jerzy Haber Institute of Catalysis and Surface Chemistry, Polish Academy of Sciences, Niezapominajek 8, 30-239 Kraków, Poland
3
Graduate School of Science and Technology for Innovation, Graduate School Science and Engineering, Yamaguchi University, Ube 755-8611, Japan
*
Author to whom correspondence should be addressed.
Catalysts 2021, 11(11), 1367; https://doi.org/10.3390/catal11111367
Submission received: 30 September 2021 / Revised: 10 November 2021 / Accepted: 12 November 2021 / Published: 13 November 2021
(This article belongs to the Special Issue Advances in Zeolite Catalysts)

Abstract

:
Immobilization of photocatalysts in porous materials is an approach to significantly minimize the hazards of manipulation and recovery of nanoparticles. Inorganic materials, such as zeolites, are proposed as promising materials for photocatalyst immobilization mainly due to their photochemical stability. In this work, a green synthesis method is proposed to combine TiO2-based photocatalysts with commercial ZY zeolite. Moreover, a preliminary analysis of their performance as photocatalysts for the abatement of organic pollutants in waters was performed. Our results show that the physical mixture of TiO2 and zeolite maintains photocatalytic activity. Meanwhile, composites fabricated by doping TiO2–zeolite Y materials with silver and palladium nanoparticles do not contribute to improving the photocatalytic activity beyond that of TiO2.

1. Introduction

The global water demand is expected to grow about 20–30% by 2050 compared to the demand in 2010 [1,2]. However, access to clean freshwater is limited and many places are facing water scarcity [3]. Water is sometimes described as “the oil of the 21st century”, which implies the increasing shortage of clean and safe water. Water reuse is essential as well as reducing its consumption [4,5]. Water reclamation requires more advanced technologies than conventional treatment plants. The development of economic and environmentally friendly water treatment technology is a key to “ensure availability and management of water and sanitation for all” as declared in the global goals for sustainable development [6].
Advanced oxidation processes (AOPs) remove organic pollutants from water by oxidation. Some types of AOPs are commercially available to produce drinking water or treat wastewater [7,8]. AOPs are based on the in situ generation of oxidants, such as hydroxyl radicals that decompose organic pollutants. Ozone, hydrogen peroxide and ultraviolet (UV) irradiation, either individually or combined, are typically used in commercialized systems. Several other materials, such as Fe2+, Mn3+, and semiconductors, are also studied to promote the degradation of organics in water [9,10].
While ozone and hydrogen peroxide require a continuous supply of the oxidant agent as it is consumed during the water treatment, semiconductor-based AOPs need no additional chemicals. Moreover, some semiconductors absorb visible light, so the AOPs can be driven by solar energy. One of the drawbacks of the semiconductor-based AOPs is the mass transfer limitation between solid and liquid phases.
Among various types of semiconductors, TiO2 is still being widely used due to its cost-effectiveness [11,12,13]. Combining TiO2 and zeolites was reported to enhance the degradation of organics in water [14,15]. The enhancement is explained by the adsorption of organics or partially decomposed organics on the zeolite surface that increases the concentration of the organic compounds in the proximity of the TiO2 semiconductor and improves the photocatalytic decomposition rate [16]. The results reported by Jansson et al. [16] showed that the nature of the pollutant and physicochemical features of zeolites strongly influence the photocatalytic performance of the composites. FAU zeolite (including Y (ZY) and X) are often used for this purpose [17] due to its large pore size and tunable Si/Al ratio that affects the adsorption characteristics. In addition, zeolites can extend the photogenerated charge separation, which also facilitates photocatalytic activity [18]. Furthermore, the immobilization of TiO2 on silica materials was previously proposed to ameliorate the recovery of the catalysts in aqueous media [19]. Even further, immobilization of photocatalysts into membranes was introduced in the quest of process intensification and avoiding hazards associated with the manipulation of nanomaterials [20,21]. While polymer dense membranes are still the only type of membranes accomplishing sufficient rejection of small molecular weight compounds, polymers are highly sensitive to radical oxidation. Therefore, their protection by a photocatalytic inorganic (i.e., ceramic) layer was already proposed in the literature [22]. Zeolites, with molecular-sized pores, can be also considered as efficient and long-term stable materials to produce photocatalytic materials. However, the attempts of immobilizing photocatalysts on inorganic supports have usually led to the reduction of the photoactivity due to several factors: i) the possible presence of zeolite mesopores clogging by the TiO2 which might difficult the accessibility to the active phase, and ii) the introduction of additional diffusive resistances to the global kinetics of the process [19,23]. A rather large controversy still remains regarding the benefits in photoactivity of TiO2–zeolite materials, which moved us to explore novel approaches to combine TiO2 and zeolites that could overcome such handicaps. Further incorporation of plasmonic metal nanoparticles on TiO2–SiO2 composites were also studied into the quest of optimizing TiO2–SiO2 potential in the visible light region [24].
In this study, a green synthesis, combining mixtures of nanometal-TiO2 composites with zeolite powder under mild conditions was followed. Further, the new photocatalytic materials were evaluated with several organic molecules of different nature.

2. Results and Discussion

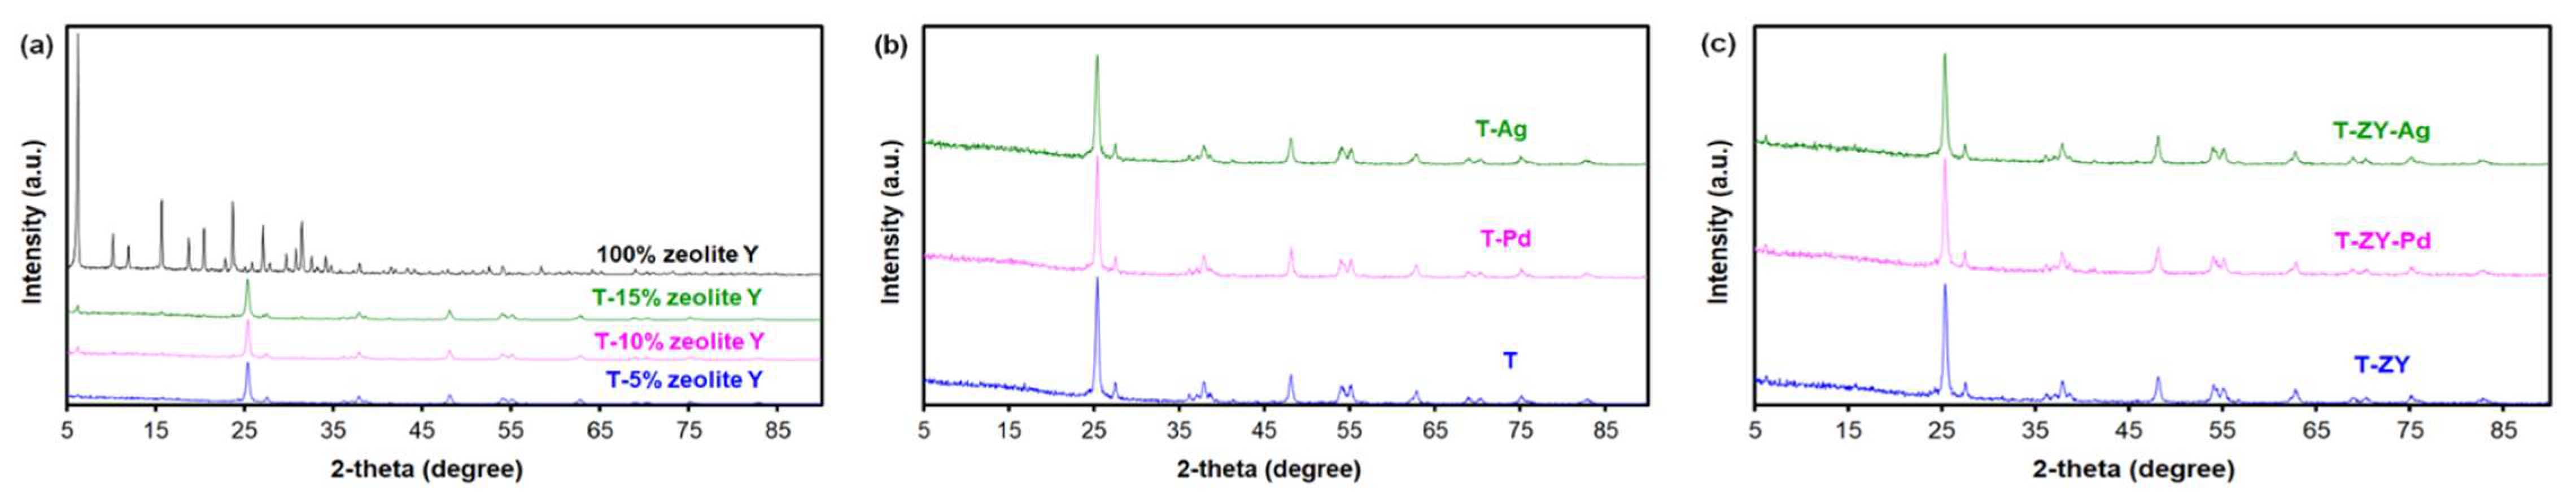
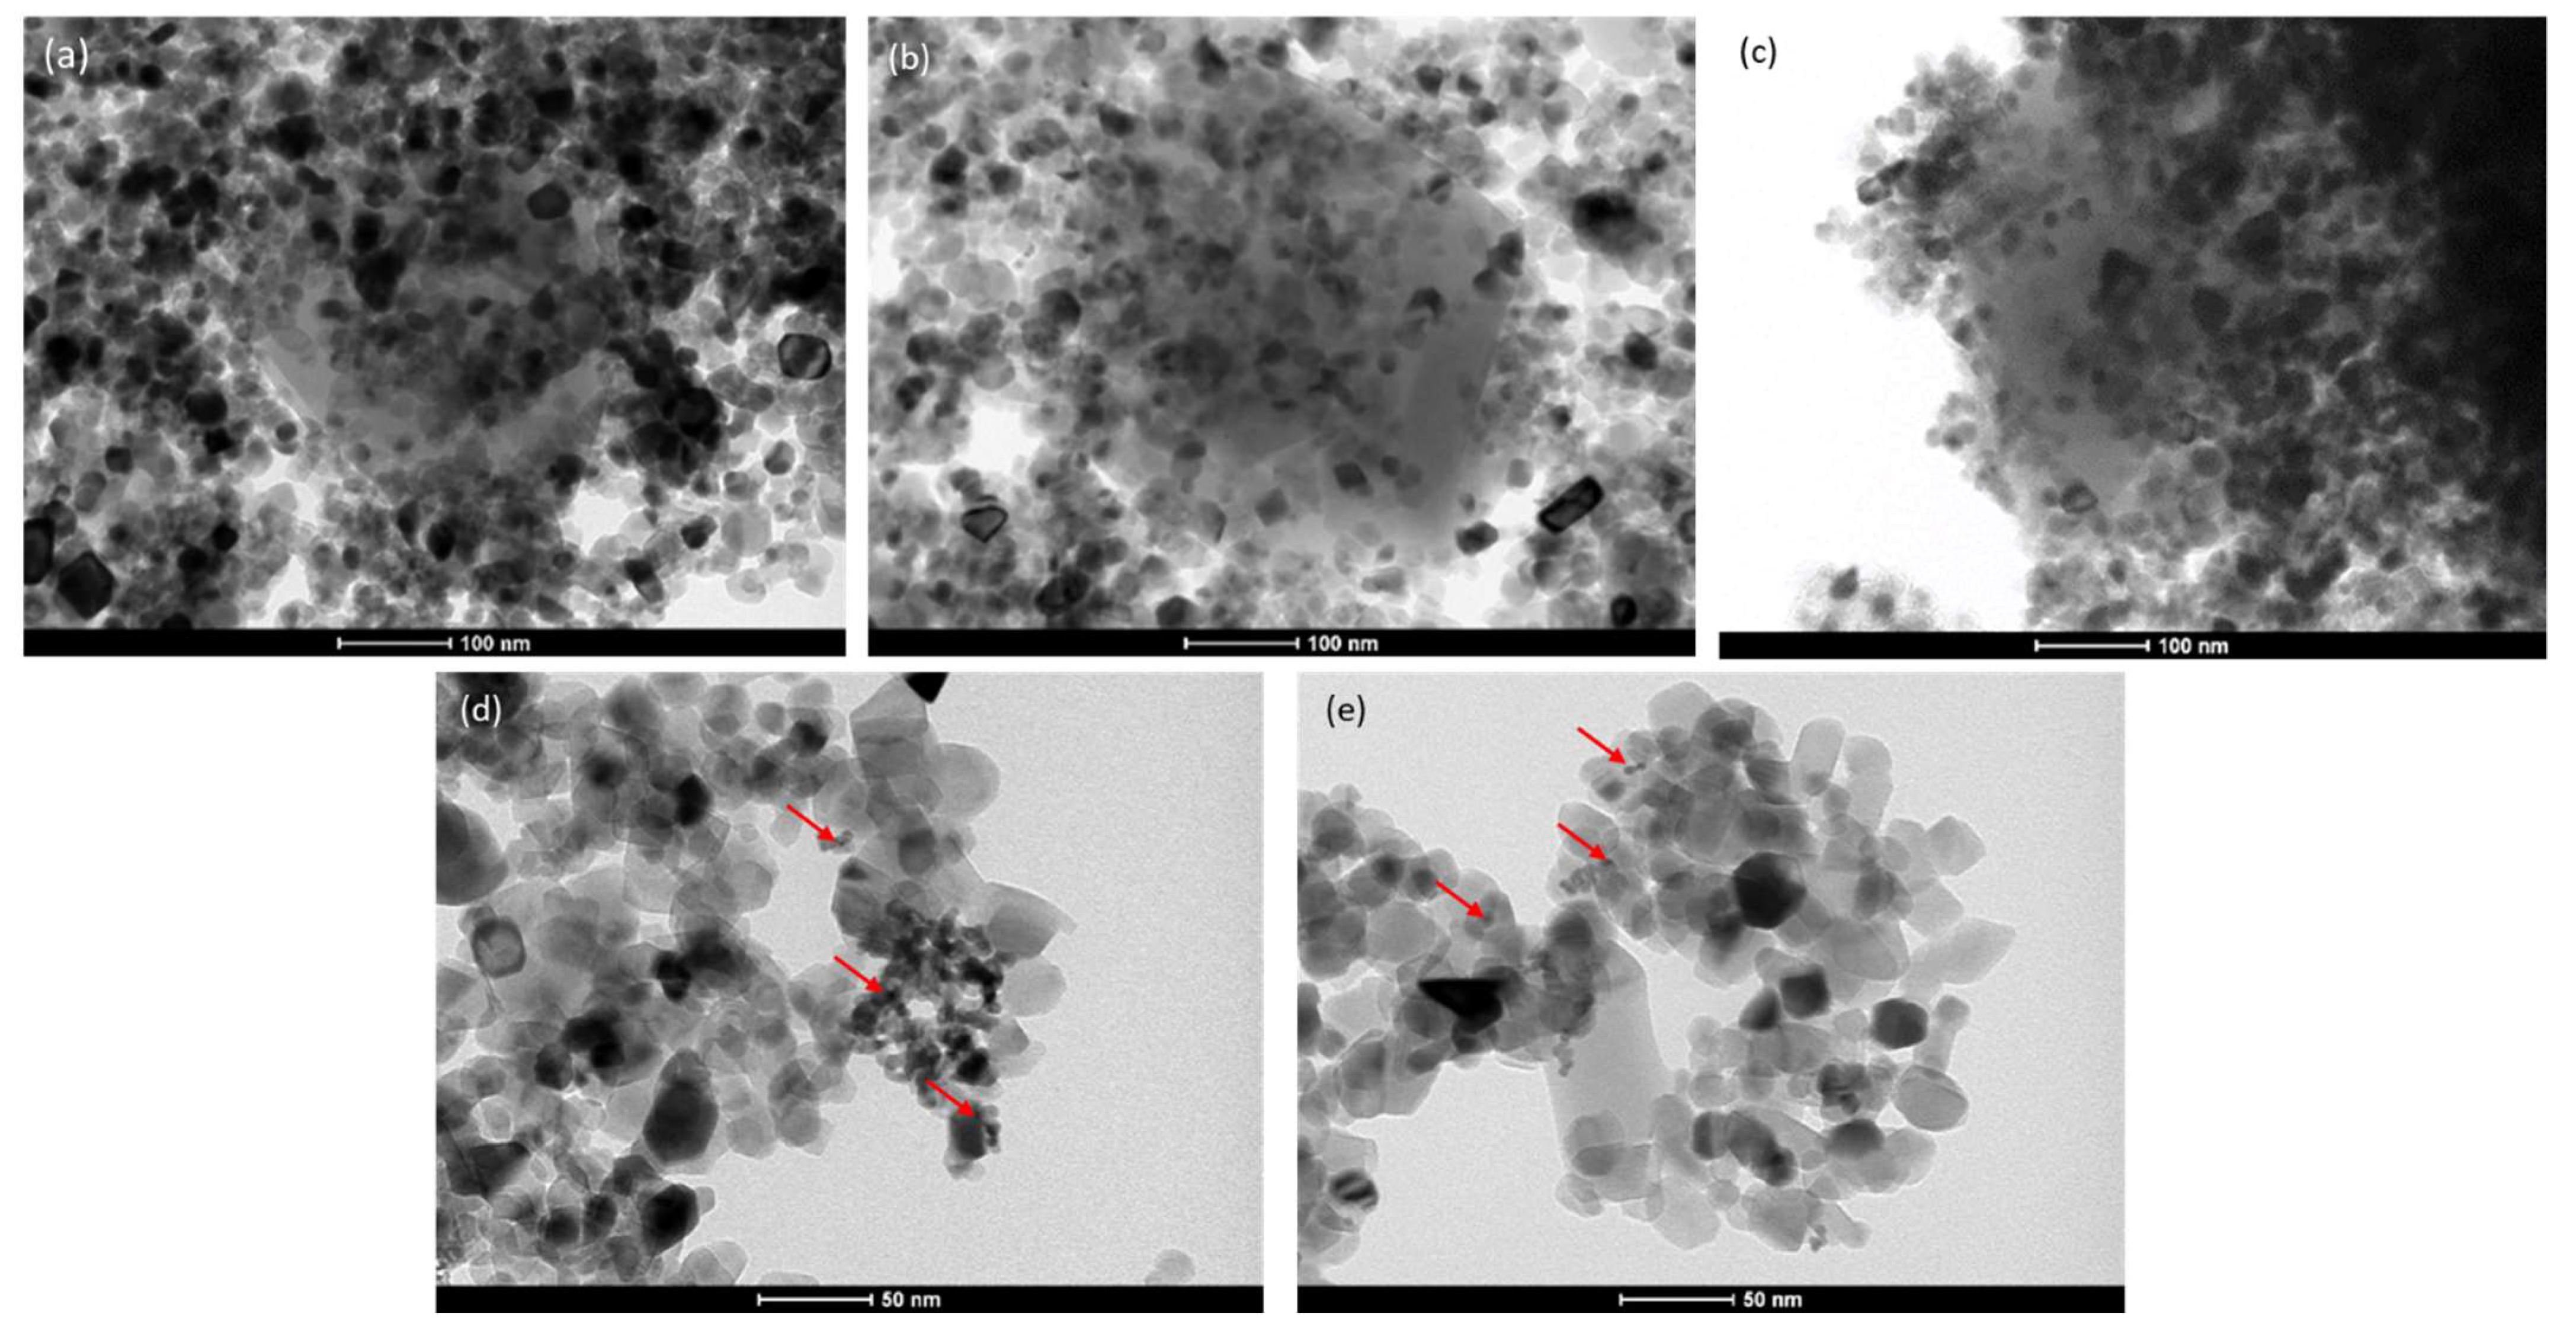
2.1. Materials Characterization

Table 1 presents the values of specific surface area and total pore volume for raw TiO2 and a selection of some materials namely TiO2-metal and TiO2–metal–zeolite Y. The nitrogen adsorption–desorption isotherms are shown in Figure S1 (Supplementary Material).
The composite 95 wt.%. TiO2 and 5 wt.%. zeolite Y shows a higher specific surface area (84 m2g−1) than TiO2 (59 m2g−1) because zeolite Y has a relatively high specific surface area (ca. 700 m2g−1), quite in agreement with theoretical calculations using a proportional rule (0.95 × 59 + 0.05 × 700 = 91 m2g−1). Deposition of metal nanoparticles (Pd or Ag) on TiO2 or on a mixture of TiO2 and zeolite Y does not affect the textural properties of the samples as illustrated by Figure S1. The pore size distribution, shown in Figure S2, clearly demonstrates the maximum centered at 130 Å (13 nm) for each studied photocatalyst, which indicates that the width of the pores existing in TiO2 is not affected by the deposition of metal nanoparticles and/or mixing with zeolite Y.
Figure 1a displays the XRD patterns of the zeolite Y and a set of T–ZY materials with different zeolite Y loadings. Diffraction reflections characteristic of TiO2 can be clearly observed in all patterns when TiO2 is present (Figure 1b). Additionally, diffraction reflection at 2 θ = 6° characteristic of zeolite Y is also found in T–ZY and T–ZY-metal materials. Further, in Figure 1a it is shown that the intensity of the zeolite Y diffraction reflection increases with the increasing concentration of zeolite Y from 5 wt.%. to 15 wt.%. Figure 1b,c depicts that spreading metal nanoparticles (Pd or Ag) on TiO2 or on T–ZY mixtures does not result in the presence of additional diffraction reflections besides those characteristics of TiO2. The reasons for such observation may be (a) low concentration of metal nanoparticles, and (b) formation of small crystals of metal (Ag and Pd) phase.
Figure 2a–c illustrate the morphology of zeolite Y and photocatalyst TiO2 and TiO2-metal composites particles being physically mixed. It can be seen that micron-sized particles of zeolite Y are mostly covered with nanometer-sized particles of TiO2. According to the specifications provided by the manufacturers, the average primary particle sizes are approximately 6 μm and 21 nm for zeolite Y and TiO2, respectively. It seems that TiO2 particles eagerly stick to the surface of zeolite Y particles, which suggests that zeolite Y can, to some extent, act as a support for TiO2 particles enhancing their exposure in photodegradation reaction. Perhaps spreading of TiO2 nanoparticles on the surface of zeolite Y may also prevent/inhibit their aggregation to a certain extent. The uncovered surface of zeolite Y may influence the adsorption of organic pollutants diluted in water and act as an adsorbent to enrich the pollutants. TEM micrographs in Figure 2d,e demonstrate that Pd nanoparticles exist in the form of small or large clusters preferentially deposited on TiO2 particles. The concentrations of Pd attached at the surface determined were estimated by XPS as 0.4 and 1.2 wt.% for T–Pd and T–ZY–Pd, respectively. STEM images (Figure S3a,b) combined with EDS analysis of Pd-containing catalysts confirm the presence of Pd species on the surface of TiO2 particles. It indicates that Pd nanoparticles are not distributed uniformly at the TiO2 surface. Although XPS detects Ag species in Ag-containing catalysts, their presence is not revealed by transmission microscope imaging as Ag surface concentrations are very low (0.08 and 0.15 wt.% for T–Ag and T–ZY–Ag, respectively).
The band gap of the semiconductor materials can be determined by analyzing their optical absorption spectra using Tauc plots representing (αhυ)2 versus and then doing the linear extrapolation of (αhυ)2 to zero value of (where α is absorption coefficient, is photon energy, h is Planck’s constant and υ is the frequency of photon) (Figure S4, Supplementary Material) [26]. The estimated band gap (Eg) values were tabulated (Table 1).
There are no significant changes observed in the estimated band gap values for the samples T–ZY, T–Ag and T–Pd with the band gap for bare TiO2 (3.27 eV) The deposition of metal nanoparticles (Pd or Ag) onto TiO2 and/or the addition of zeolite Y into TiO2 do not influence the band gap of semiconductor-TiO2, similarly to previously reported data [27].

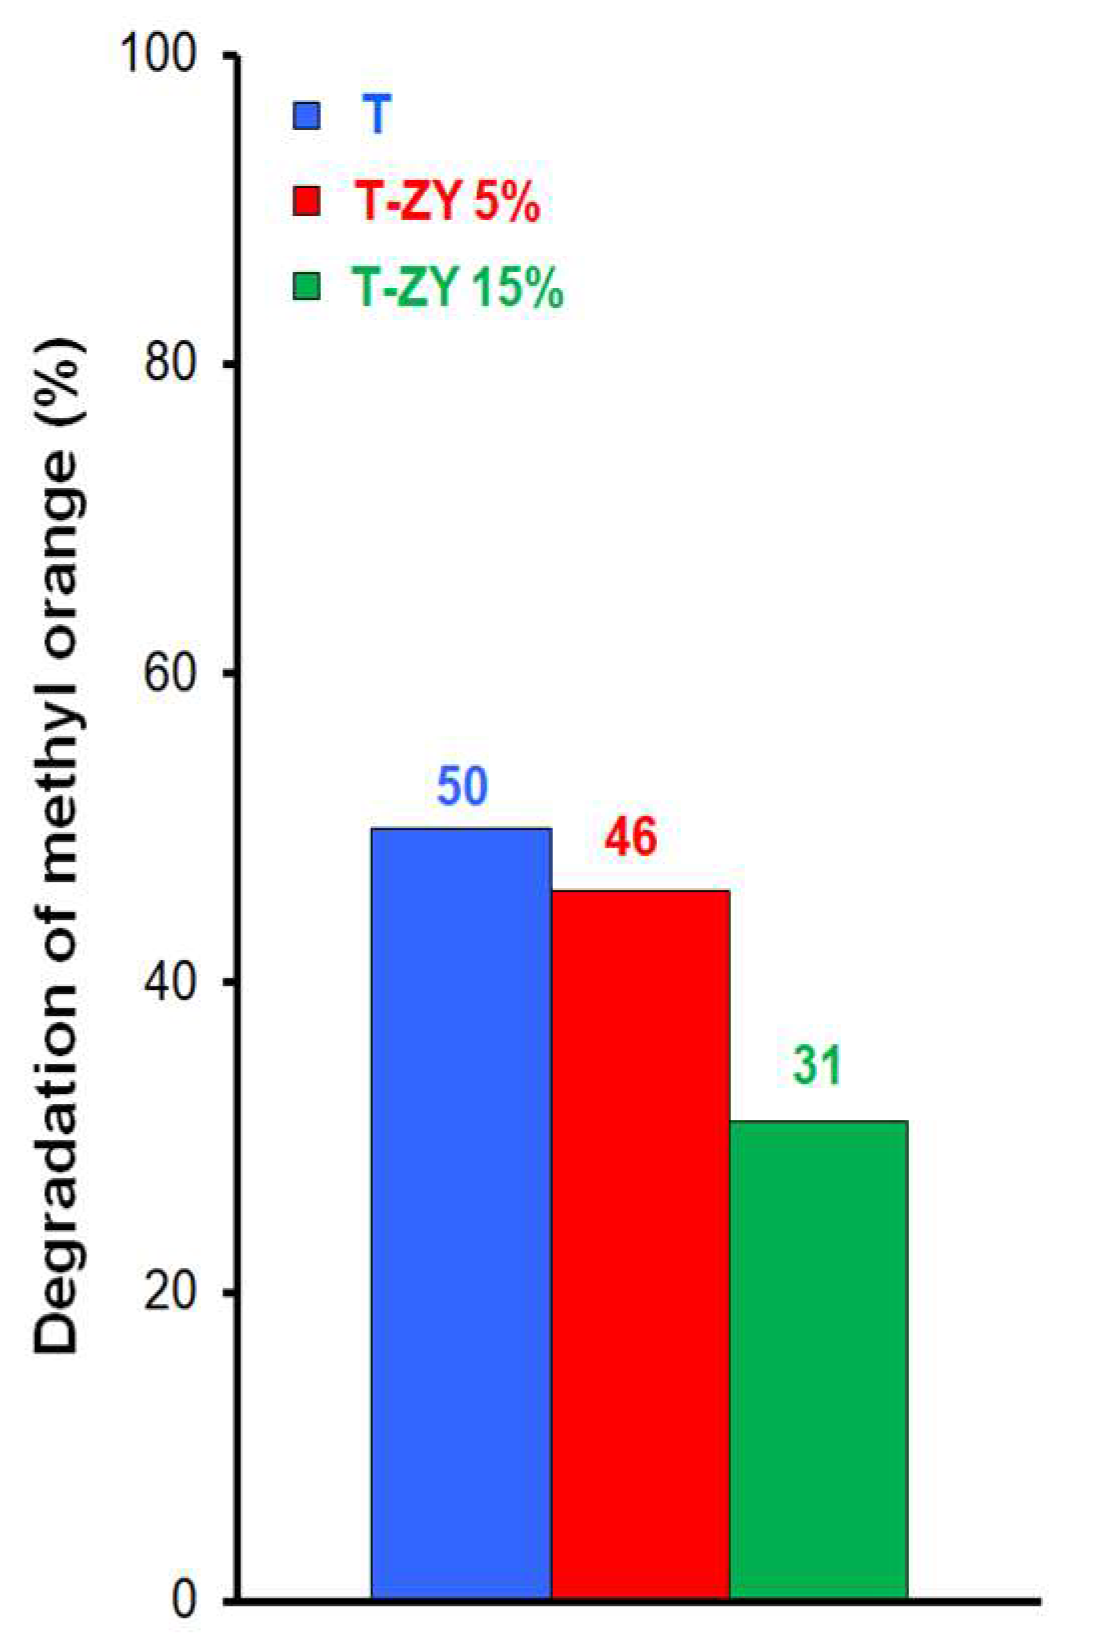
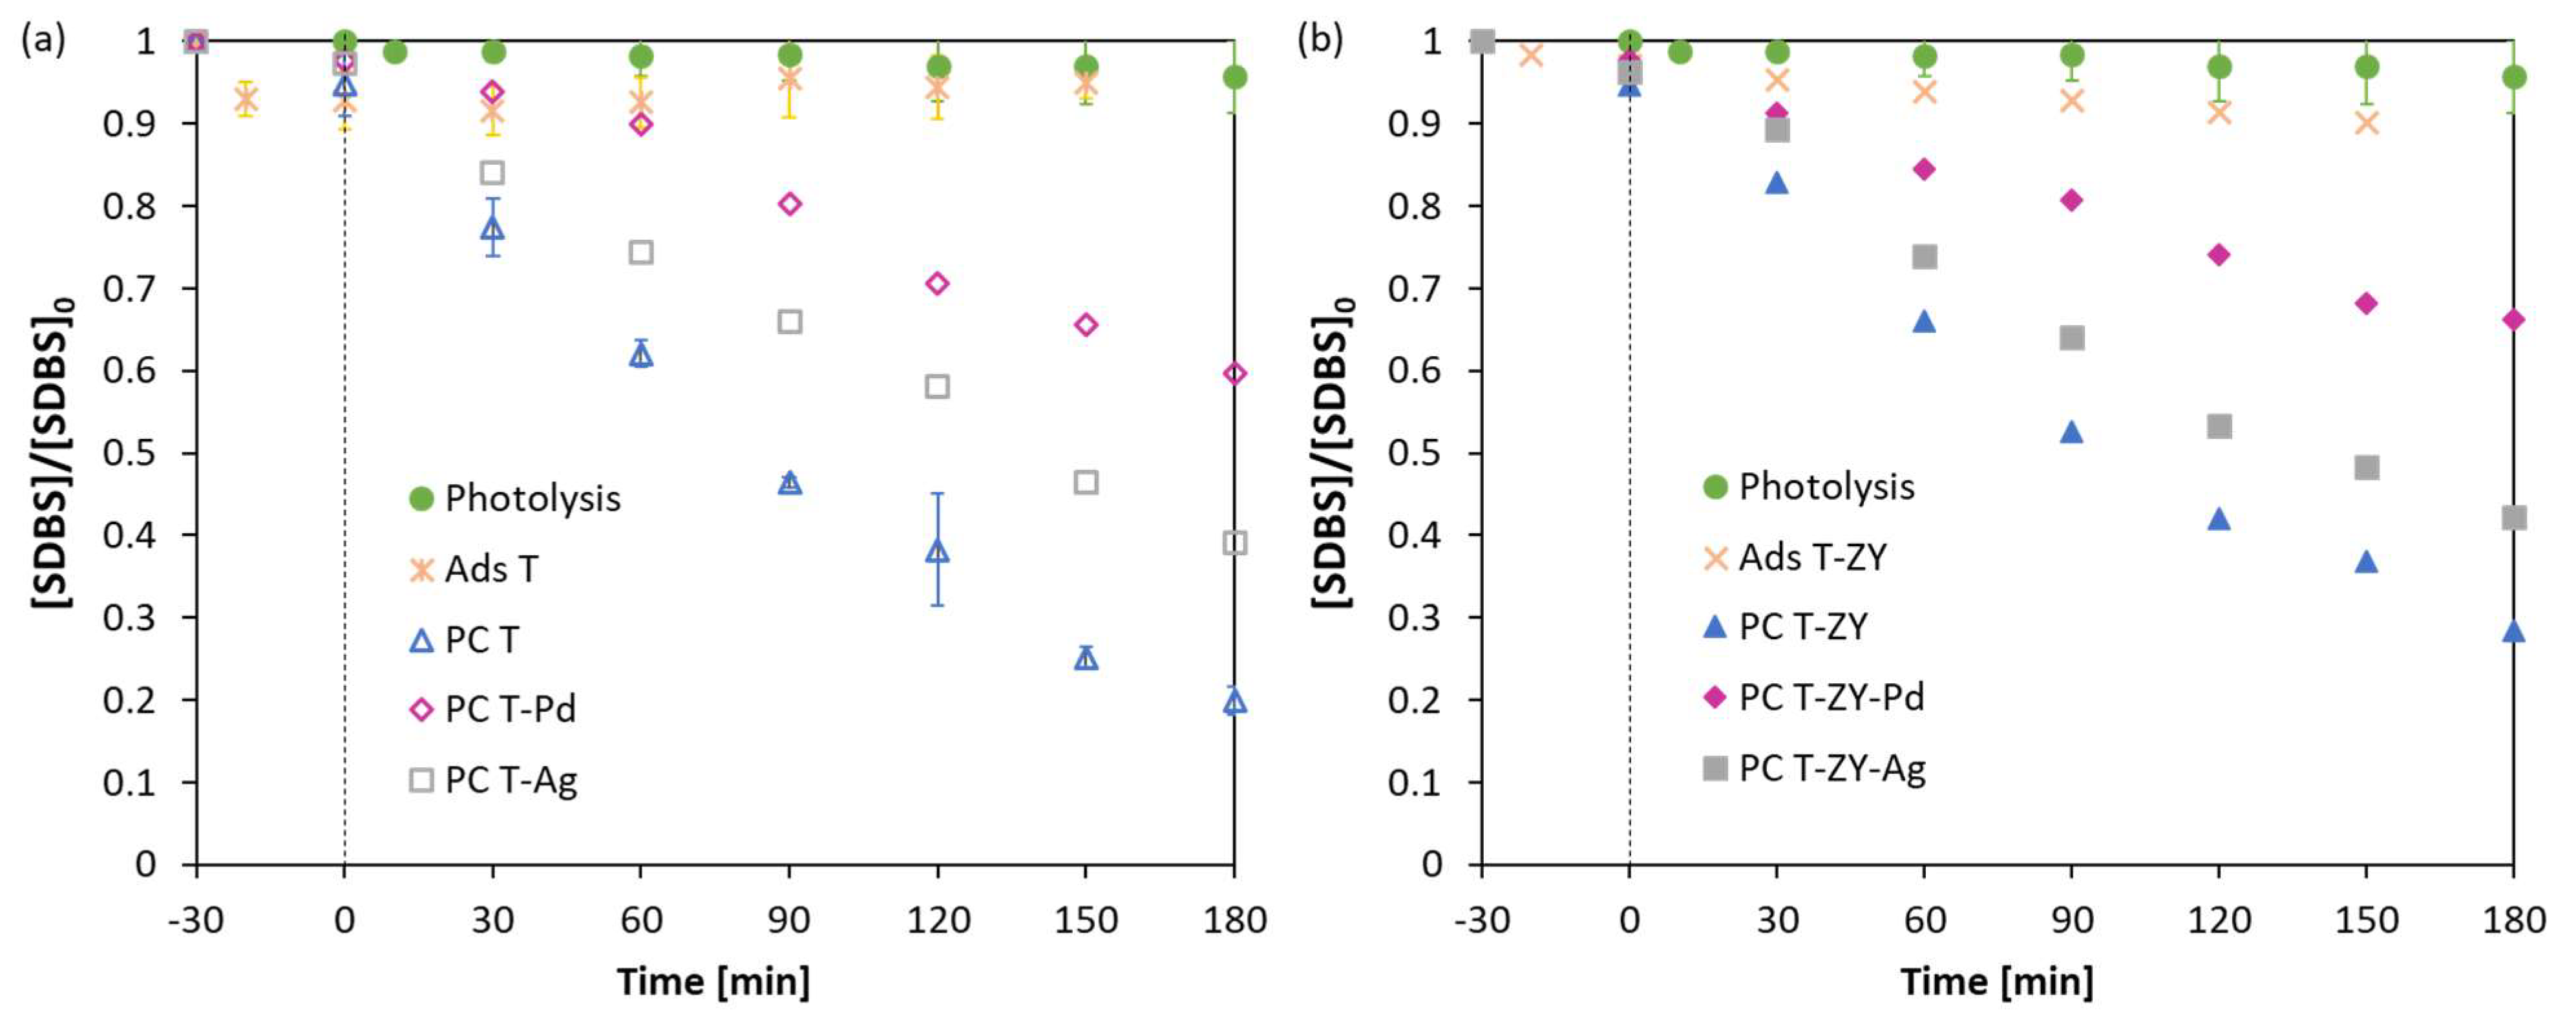
2.2. Photocatalytic Activity

First, the effect of the concentration between 5 to 15 wt.%. of zeolite Y incorporated into the T–ZY composites on the photocatalytic activity was evaluated. Figure 2 shows the degradation of methyl orange dye after 2 h of UV irradiation in the presence of bare TiO2 and physical mixtures T–ZY containing 5 and 15 wt.%. of zeolite Y, respectively.
Figure 3 illustrates that the degradation of methyl orange decreases gradually with the presence of zeolite Y in a physical mixture of TiO2 and zeolite Y. After 2 h of UV irradiation, the degradation of methyl orange with pure TiO2 is ca. 50%, while the incorporation of zeolite Y progressively drops down methyl orange degradation to ca. 46% and further ca. 31% for 5 and 15 wt.%. of zeolite Y in T–ZY mixtures, respectively. Zhang et al. [15] also reported a higher (81%) photodegradation of methyl orange for TiO2 than those (55 and 77%) for the composites of TiO2 and zeolites (natural zeolite (SiO2/Al2O3~8), and acid leaching zeolite (SiO2/Al2O3~71), respectively). This study also reported reductions in photoactivity of TiO2-natural zeolite composites for rhodamine B and phenol in water solutions. Meanwhile, the combination of TiO2 with dealuminated zeolites enhanced the photoactivity towards both organic compounds. These results were previously explained by the low adsorption ability of hydrophilic zeolites towards organic compounds [28]. Thereafter, a 5 wt.%. of zeolite Y was selected for further study.
Figure 4 depicts the change with time in the dimensionless concentration of dichloroacetic acid (DCA) during photocatalysis with TiO2–zeolite metal composites. The effect of photolysis of DCA under the light irradiation conditions is below 10% and similar to the contribution of DCA adsorption of TiO2 and T–ZY mixtures that could be considered stable after 30 min of contact with the nanoparticles. Despite zeolite presence increasing the specific BET surface area (Table 1), the adsorption capacity in dark conditions with or without zeolite is not significantly affected. Adsorption of 50 mg L−1 of DCA by 0.3 g L−1 of pure ZY was 40% (data not shown), therefore, the addition of as low as a 5 wt.% of ZY in the T–ZY mixtures is not expected to significantly affect the overall T–ZY adsorption. This is again in agreement with the low adsorption capacity of organic molecules attributed to hydrophilic zeolites with SiO2/Al2O3 ratios of about 5.
It is observed that T, T–Ag and T–ZY samples present the fastest DCA degradation kinetics. After 90 min of photocatalysis, these three materials present a complete degradation of DCA without significant changes among samples. T–ZY–Ag samples present an apparent slight reduction on DCA degradation kinetics, although complete DCA degradation is achieved after 90 min. On the other hand, Pd doping of TiO2 semiconductors, particularly in T–ZY–Pd composites, significantly reduces photocatalytic activity.
Figure 5 presents the change with time in the dimensionless concentration of sodium dodecylbenzenesulfonate (SDBS) during photocatalysis with TiO2–zeolite metal composites.
Similar to DCA, photolysis and adsorption of SDBS on TiO2 and T–ZY materials were always below 10% and therefore negligible. After 30 min of stirring in dark conditions, adsorption was considered to be stable and photocatalysis tests were performed. On the one hand, SDBS molecular weight might slow down the degradation kinetics in contrast to DCA, as expected. On the other hand, the neutral zero surface potential (pHzsp~7.6, Figure S5, Supplementary Material) of TiO2 could be also behind this decay on photocatalytic activity of TiO2 between DCA and SDBS. DCA solutions presented a natural pH of ~3.6 and thus TiO2 surface was charged positively, therefore attracting negatively charged DCA in solution. Meanwhile, the SDBS solution’s natural pH is ~6.5. At this working pH, TiO2 might present less positively charged sites, and consequently lower electrostatic attraction of negatively charged SDBS on the TiO2 surface might occur, therefore hampering the attack of the pollutants by the OH radicals. However, it is clear that the production of oxidative species via the photocatalytic mechanism of TiO2 and the T–ZY metal composites is still effective for SDBS degradation into intermediate and less harmful molecules. T and T–ZY presented the highest SDBS degradation, being 80 and 72% respectively after 180 min. When compared to reported results, the photocatalysis of organic metoprolol in water with TiO2–P25 and with a composite with natural zeolites reached about 30–40% degradation after 180 min at similar natural pH~6 and irradiation wavelength (λ~365 nm) as the values used in the present work while they further used 0.1 v/v% concentration of H2O2 to increase the production of OH radicals [29].
The worsening of the photocatalytic activity of TiO2 via the metal incorporation that was already observed for DCA (Figure 4a), is more evident in the SDBS degradation tests (Figure 5a), being again Pd the metal giving the lowest SDBS degradations of ca. 40% after 180 min. TiO2–Pd composites were reported to have an acidic pHzpc of about 5.4 [30]. Thus, the T–Pd material would present a lower positively charged surface area than TiO2 at the working pH of the DCA and, particularly in SDBS solutions, T–Pd surface would be negatively charged instead. This effect was reported to reduce the available photocatalyst surface for photogeneration of hydroxyl radicals due to the consequently lower attraction of water molecules. The incorporation of noble metals (Ag and Pt) on TiO2–P25 commercial semi-conductors was reported to usually improve DCA degradation activity over pure TiO2 [31]. However, this was observed at high Ag doping such as 10 wt.% on TiO2 and under combined UV and visible light irradiation. Additionally, Wodka et al. [27] observed the improved photocatalytic activity of TiO2–Ag composites in contrast to TiO2–P25 in the degradation of various organic compounds (oxalic acid, formic acid and humic acid) in waters with Ag contents of at least 1 wt.%. Wodka et al. [27] also found that TiO2–P25 and TiO2–Ag composites presented, respectively, 1.5 and 2.4 times higher photoactivity for oxalic acid (solutions natural pH~3.3) than for humic acid (solutions natural pH~6.5), similarly as the results reported in the present study for DCA and SDBS solutions. In this regard, it is important to note that, according to Wodka et al. [27], it is not expected an important change in the pHzpc in T–Ag materials in contrast to plain TiO2, therefore the pH of the solution might not affect importantly the surface electrophilicity of T and T–Ag materials. Overall, the benefits of the plasmonic effect accounted by metal nanoparticles doping are usually more evident when using visible light irradiation [24,27], and not under UV light as herein employed.
Analogous to what occurred between TiO2 and T–ZY mixtures, the rate of photocatalytic reaction of TiO2 metal composites deposited on zeolites (T–ZY metal) was slightly slower than T metal composites without the presence of zeolites for both DCA and SDBS solutions. As was previously mentioned, ZY presents a low adsorption capacity for organic molecules that was responsible for the lower photocatalytic efficiency of TiO2–zeolite composites [15,28]. Further, this reduction in photoactivity observed in the T–ZY mixtures might also respond to the lower content of photocatalyst and the consequent reduction in the generation of hydroxyl radical species in the media.
The general mechanism for the removal of organic compounds in heterogeneous photocatalysis is mainly based on the generation of reactive oxygen species (ROS), such as the superoxide radical (O2●−), hydroxyl radical (OH), and positive valence band holes (h+VB). Moreover, hydroxyl ions can be either on the catalyst surface or in solution, leading to hydroxyl radicals on the catalyst surface or free radicals in solution. When the organic compound is adsorbed onto the catalyst direct oxidation thanks to positive holes and adsorbed hydroxyl radicals can be the main mechanisms. Nevertheless, when the contaminants are poorly adsorbed most of their removal could be attributed to superoxide radicals and hydroxyl radicals in solution. Therefore, diffusion and mass transfer limitations could play an important role in limiting the removal kinetics. That is why the development of enhanced photocatalysts should focus on this issue. Previous works have addressed that the mechanism for the removal of DCA with TiO2 modified with metals such as platinum and silver cannot proceed by photogenerated holes and hydroxyl radicals in solution play the leading role [31]. A similar influence of hydroxyl radicals in solution on DBS photocatalytic removal with TiO2 was also reported [32]. Nevertheless, in this work, the synthesis method has not succeeded in an adequate metal distribution on the catalyst. So, the beneficial aspects of their interactions have not been achieved, neither did the adsorption of the contaminants with the contribution of the zeolite.

3. Materials and Methods

3.1. Preparation of Physical Mixture of TiO2 and Zeolite Y

The physical mixture of TiO2 and zeolite Y was prepared by grinding in an agate mortar two powders, i.e., TiO2 (Sigma Aldrich, consisting of 21 wt.% of rutile and 79 wt.% of anatase according to the analysis of the powder XRD diffraction patterns by means of the Rietveld method using TOPAS software) and zeolite Y (sodium Y, HS-320, FUJIFILM Wako Chemical Corporation, Tokyo, Japan), SiO2/Al2O3 (mol/mol): 5.5), for 30 min.

3.2. Synthesis of Pd Nanoparticles and Preparation of Pd-Containing Photocatalysts

Palladium (Pd) nanoparticles were prepared via chemical reduction of palladium ions (Pd2+) by the reverse “water-in-oil” microemulsion method described elsewhere [33]. The microemulsion was prepared in a glass flask by dissolving non-ionic surfactant (1,1,3,3 tetramethylbutyl) phenyl-polyethylene glycol, i.e., TritonTM X-114 in non-polar cyclohexane. To this mixture, an aqueous solution of 0.2 M PdCl2 and 0.4 M NaCl was added. The mixture was stirred for 30 min and then sodium borohydride (NaBH4) was introduced. The reduction of Pd2+ ions was fast, and the color of the microemulsion quickly changed from brown to almost black due to Pd metal particles’ formation. The suspension was stirred for 60 min to ensure complete reduction and finish metal nanoparticles growth. Then, the powder of TiO2 (Sigma-Aldrich) or the physical mixture of TiO2 and zeolite Y (5 wt.% of zeolite sodium Y) was introduced into the suspension and the mixture was stirred for 60 min. Next, acetone was slowly (10–100 mL/h) added using syringe pump. Then, the suspension was separated by using filter with 0.45 µm pore size hydrophilic PTFE membrane. The obtained powder was washed with acetone and distilled water to remove the surfactant. Finally, the catalyst was dried in air at 50 °C overnight. As a result, two Pd-containing photocatalysts were obtained: T–Pd, 1 wt.%. of Pd deposited on TiO2 and T-ZY-Pd, 1 wt.%. of Pd deposited on the physical mixture of TiO2 and zeolite Y (5 wt.%. of zeolite Y).

3.3. Synthesis of Ag Nanoparticles and Preparation of Ag-Containing Photocatalysts

Silver (Ag) nanoparticles were prepared via chemical reduction of silver ions (Ag+), delivered in the form of silver nitrate, by sodium borohydride (reducing agent) in the presence of trisodium citrate (stabilizing agent) [34]. Briefly, sodium borohydride (NaBH4) and trisodium citrate dihydrate were dissolved in ultrapure water. Silver nitrate solution was prepared by dissolving silver nitrate in ultrapure water (Millipore-Q Elix and Simplicity 185 purification system, Millipore S.A., Molsheim, France). The mixture of reducing and stabilizing agents was placed in a glass reactor and stirred at speed of 170 rpm using a mechanical stirrer equipped with a glass paddler stirrer. Continuing the stirring, the silver nitrate solution was added dropwise to the solution of sodium borohydride and trisodium citrate. The flow rate of silver nitrate solution (3.3 mL min−1) was controlled by a peristaltic pump.
The suspension of Ag nanoparticles was purified from unreacted silver ions and other low molar mass compounds using ultrafiltration method. For this purpose, the suspension was washed with ultrapure water with the use of a filtration cell Amicon (model 8400, Millipore) equipped with a regenerated cellulose membrane (PLHK7610). The purification procedure was carried out until the conductivity of obtained effluent stabilized at 15 μS cm−1 (determined by CPC-505 pH-meter/conductometer, Elmetron, Zabrze, Poland, equipped with a conductometric sensor EC-60).
The mass concentration of Ag nanoparticles dispersed in the purified suspension was determined based on the measurements of density of the suspension and its dispersive medium (the effluent obtained in the purification procedure).
Ag-containing photocatalysts (T–Ag and T–ZY–Ag) were prepared in aqueous medium. At the beginning, TiO2 was dispersed in the ultrapure water by mixing a proper amount of TiO2 or TiO2–ZY powder (~4 g) with given volume of ultrapure water (150 mL). Obtained suspensions were mixed using magnetic stirrer (170 rpm) for 30 min under ambient conditions. Then, the suspensions were sonicated in an ultrasonic bath (40 kHz) over 10 min. It was established that the suspensions containing TiO2 of average hydrodynamic diameters in the range 120–190 nm by dynamic light scattering, were suitable for further studies. In order to ensure electrostatically-driven deposition of negatively charged silver nanoparticles on positively charged TiO2, the suspensions were mixed at pH value where the nanoparticles exhibited opposite surface charge (usually 4.1–4.4). After mixing 21.5 mL of Ag NPs suspension (93 mg L−1) and 150 mL of TiO2 or T–ZY suspension (26 g L−1), the suspensions were vigorously mixed over 30 min. Then, the precipitates were obtained via ultrafiltration. Then, the wet precipitates were introduced to glass crystallizers and dried in a laboratory drier at 50 °C overnight. As a result, two Ag-containing photocatalysts were obtained: T–Ag, 0.05 wt.%. of Ag deposited on TiO2 and T–ZY–Ag, 0.05 wt.%. of Ag deposited on the physical mixture of TiO2 and zeolite Y (5 wt.%. of zeolite Y).

3.4. Characterization Methods

3.4.1. Nitrogen Sorption

Nitrogen adsorption/desorption analysis was carried out at −196 °C using an Autosorb-1 (Quantachrome, Anton Paar GmbH, Graz, Austria) surface area and pore size analyzer. Prior to volumetric adsorption/desorption measurement, the samples were preheated and degassed under vacuum at 100 °C for 18 h. Specific surface area (SBET) was calculated using BET (Brunauer–Emmett–Teller) method based on adsorption data in the partial pressure of 0.1 < p/p0 < 0.35. Total pore volume (Vtot) was determined by the amount of nitrogen adsorbed at p/p0 = 0.99. Pore size distribution (PSD) in the region of mesopores (2–50 nm) was calculated by using the data from the desorption branch of nitrogen isotherm and the BJH (Barret–Joyner–Halenda) method. The pore diameter was estimated using BJH method desorption pore diameter mode.

3.4.2. X-ray Diffraction

Powder X-ray diffraction (XRD) analysis was performed using a PANalytical X’Pert PRO powder diffractometer (Malvern Panalytical, Almelo, The Netherlands) with Cu Kα radiation (40 kV, 30 mA). The XRD patterns were recorded in the range of 2–90° (2 θ) with a step size of 0.05°.

3.4.3. TEM/STEM

Transmission electron microscopy (TEM) images were recorded using an FEI Tecnai G2 F20 (200 kV) apparatus (with an operating voltage of 200 kV). Energy dispersive spectroscopy (EDS) analysis of STEM (scanning transmission electron microscopy) micrographs was performed.

3.4.4. XPS

X-ray photoelectron spectroscopic (XPS) measurements were conducted using a spectrometer equipped with Al Kα X-ray source (1486 eV, 12 kV, 20 mA) and a hemispherical analyzer (R4000, Gammadata Scienta, Uppsala, Sweden).

3.4.5. UV-Vis Measurements

Ultraviolet–visible (UV–Vis) diffuse reflectance spectra were recorded in the wavelength range of 200–700 nm using a Shimadzu UV-2600 spectrometer (Shimadzu Europa GmbH, Duisburg, Germany) equipped with a reflectance chamber with a 5 mm slit. The samples for analysis were pressed in a powder sample holder. BaSO4 was used as a reference.

3.4.6. Photocatalytic Experiments

Photocatalytic experiments of methyl orange dye were conducted in a glass beaker placed on a magnetic stirring plate (1000 rpm). A UV lamp (50 W, 230 V AC, HQ45mil LED chip) with an emission spectrum between 365 and 367.5 nm was used as irradiation source. A total of 50 mL of methyl orange aqueous solution (1 × 10⁻⁵ mol L−1) was used as feed in all experiments at natural solution pH 7. The catalyst dose was 15 mg (0.3 g L−1). Photocatalysis experiments were conducted after the suspension of the catalyst and the solution of methyl orange was magnetically stirred in the dark for 2 h to achieve adsorption–desorption equilibrium. The samples were withdrawn from the suspension at different time intervals (after 2 h of adsorption and after 2 h of UV irradiation) and centrifugated to remove the catalyst particles before analysis by means of UV/VIS spectrometer (SPECORD® 40, Analytik Jena AG, Jena, Germany). The absorbance of the liquid sample with the addition of 1 drop of HCl aqueous solution (1 mol L−1) to quartz cuvette was recorded in the wavelength range of 350–650 nm.
Dichloroacetic acid (DCA) and sodium dodecylbenzenesulfonate (SDBS) were purchased from Acros Organics (ThermoFisher Scientific, Waltham, MA, USA) and Sigma Aldrich (St. Louis, MO, USA) respectively. Photocatalytic experiments were carried out in a reactor consisting of four PL-S 9 W UV-A lamps (Philips, Amsterdam, The Netherlands) with a maximum wavelength emission of 365 nm. The irradiance of the system was measured as 7.5 W m−2 by Corredor et al. [21]. The working volume was 150 mL. Pollutants concentration was 50 mg L−1 with a catalyst concentration of 0.3 g L−1. DCA and SDBS solutions were mixed with the catalysts and kept in the dark while mixing for 30 min until adsorption equilibrium was reached. Experiments were treated at natural pH (3.5–3.6 for DCA solutions and 6.4–6.6 for SDBS solutions) and no remarkable variation was observed. All experiments were performed in duplicate. Once the photocatalytic degradation started, samples were collected at different time intervals and filtered through a 0.45 µm PTFE syringe filter (VWR). SDBS was measured by UV spectrophotometry (UV-1800, Shimadzu, Shimadzu Europe, Duisburg, Germany) at a wavelength of 223 nm. DCA concentration was measured in an ICS-1100 (Dionex, ThermoFisher Scientific, Waltham, MA, USA) ion chromatograph with an AS9-HC column, using a 9 mM Na2CO3 solution as eluent, with a flow rate of 1 mL min−1 and a pressure of approximately 2000 psi.

4. Conclusions

The present work reports a green synthesis methodology to combine electrostatically commercial TiO2 or modified TiO2 metal-loaded materials with ZY commercial zeolites. The objective aimed at evaluating if using simple, mild and cheap synthesis conditions could circumvent the zeolites pore-clogging and diffusive drawbacks caused by immobilizing TiO2-based photocatalyst on porous materials, such as zeolites, frequently reported. The mixtures of TiO2 and ZY zeolites prepared in the present work do not present evidence of pore-clogging or adsorptive limitations and have demonstrated similar photocatalytic behavior for organic pollutants in waters, as in previously reported literature. Nevertheless, the hydrophobic character of the ZY herein used might be behind the worse photoactivity presented by T–ZY mixtures in contrast to the TiO2 photocatalyst.
Overall, the methodology of synthesis seems to be promising due to its simplicity and adequate performance. In future studies, the dealumination of zeolites will be further explored.

Supplementary Materials

The following are available online at https://www.mdpi.com/article/10.3390/catal11111367/s1, FigureS1. Nitrogen adsorption/desorption isotherms of (a) TiO2 and TiO2 metal composites (after deposition of metal nanoparticles Pd–1 wt.%., or Ag–0.05 wt.%.) without zeolite Y and (b) after their deposition onto a physical mixture of TiO2 and 5 wt.%. zeolite Y. Figure S2. Pore size distribution (PSD) in the region of mesopores (20–500 Å) of (a) TiO2 and T metal composites (Pd–1 wt.%., or Ag–0.05 wt.%.) without zeolite Y and (b) after their deposition onto a physical mixture of TiO2 and 5 wt.%. zeolite Y was calculated by using nitrogen sorption data from the desorption branch of nitrogen isotherm and the BJH (Barret–Joyner–Halenda) method. Figure S3. STEM image (a) and EDX spectrum (inset) of T–Pd and STEM image (b) of T–ZY–Pd and EDX spectra (insets for area 1 and area 2). Figure S4. Tauc plots of (a) TiO2 and a mixture of TiO2 and zeolite Y (5 wt.%.) with deposited metal nanoparticles (Pd–1 wt.%., Ag–0.05 wt.%.); and (b) TiO2 and a mixture of TiO2 and zeolite Y (5 wt.%) with deposited metal (Pd–1 wt.%. and Ag–0.05 wt.%.) nanoparticles. Figure S5. Dependence of zeta potential on pH of an aqueous suspension of TiO2 (Sigma Aldrich) at a concentration of 0.3 g L−1. The natural pH of the suspension is 4–5. pH adjusted by means of aqueous solutions of DCA (0.01 mol L−1, 0.1 mol L−1) or NaOH (0.01 mol L−1, 0.1 mol L−1). Figure S3. STEM image (a) and EDS spectrum (inset) of T-Pd and STEM image (b) and EDS spectra (insets area 1 and area 2) of T-ZY-Pd. Figure S4. Tauc plots of (a) TiO2 and a mixture of TiO2 and zeolite Y (5 wt.%.) with deposited metal nanoparticles (Pd – 1 wt.%., Ag – 0.05 wt.%.); and (b) TiO2 and mixture of TiO2 and zeolite Y (5 wt.%) with deposited metal (Pd-1 wt.%. and Ag-0.05 wt.%.) nanoparticles. Figure S5. Dependence of zeta potential on pH of aqueous suspension of TiO2 (Sigma Aldrich) at a concentration of 0.3 g L-1. Natural pH of the suspension is 4-5. pH adjusted by means of aqueous solutions of DCA (0.01 mol L-1, 0.1 mol L-1) or NaOH (0.01 mol L-1, 0.1 mol L-1).

Author Contributions

N.D., I.K., A.P. and M.J.R. participated in the conceptualization and supervision; investigation, A.P. and C.B.; writing—original draft, N.D., I.K. and A.P.; funding acquisition, N.D., I.K. and A.P.; writing—review and editing, N.D., I.K., A.P., M.J.R., A.U. and I.O. All authors have read and agreed to the published version of the manuscript.

Funding

This work was supported by JST SICORP Grant Number JPMJSC18C5 (Japan), the grant number PCI2018-092929 funded by MCIN/ AEI/10.13039/501100011033/ (Spain), and the National Centre for Research and Development (NCBiR, Poland) agreement number EIG CONCERT-JAPAN/1/2019.

Acknowledgments

Authors want to thank Magdalena Oćwieja for the preparation of Ag nanoparticles and Ag-containing photocatalysts; Aneta Medaj for the preparation of Pd nanoparticles and Pd-containing photocatalysts and XRD measurements; Małgorzata Ruggiero-Mikołajczyk for the nitrogen sorption measurements; Robert Socha and Jacek Gurgul for X-ray photoelectron spectroscopy measurements.

Conflicts of Interest

The authors declare no conflict of interest.

References

  1. Boretti, A.; Rosa, L. Reassessing the projections of the World Water Development Report. NPJ Clean Water 2019, 2, 15. [Google Scholar] [CrossRef]
  2. Burek, P.; Satoh, Y.; Fischer, G.; Kahil, M.T.; Scherzer, A.; Tramberend, S.; Nava, L.F.; Wada, Y.; Eisner, S.; Flörke, M.; et al. Water Futures and Solution. Fast Track Initiative—Final Report ADA Project Number 2725-00/2014. Water Futur. Solut. 2016, 1–113. Available online: http://dare.iiasa.ac.at/111/ (accessed on 10 November 2021).
  3. Veldkamp, T.I.E.; Wada, Y.; Aerts, J.C.J.H.; Döll, P.; Gosling, S.N.; Liu, J.; Masaki, Y.; Oki, T.; Ostberg, S.; Pokhrel, Y.; et al. Water scarcity hotspots travel downstream due to human interventions in the 20th and 21st century. Nat. Commun. 2017, 8, 15697. [Google Scholar] [CrossRef] [PubMed]
  4. Angelakis, A.N.; Durham, B. Water recycling and reuse in EUREAU countries: Trends and challenges. Desalination 2008, 218, 3–12. [Google Scholar] [CrossRef]
  5. Garcia, X.; Pargament, D. Reusing wastewater to cope with water scarcity: Economic, social and environmental considerations for decision-making. Resour. Conserv. Recycl. 2015, 101, 154–166. [Google Scholar] [CrossRef]
  6. United Nations Development Programme (UNDP). Sustainable Development Goals. Available online: https://www.undp.org/sustainable-development-goals (accessed on 28 September 2021).
  7. WEDECO, ITT Industries. UV Disinfection and Ozone Oxidation Systems. Available online: https://www.water-technology.net/contractors/disinfection/wedeco2/ (accessed on 28 September 2021).
  8. MetaWater: Development of Environmentally Friendly Products: Water Technologies. Available online: https://www.metawater.co.jp/eng/csr/environment/product_development/ (accessed on 28 September 2021).
  9. Chan, S.H.S.; Wu, T.Y.; Juan, J.C.; Teh, C.Y. Recent developments of metal oxide semiconductors as photocatalysts in advanced oxidation processes (AOPs) for treatment of dye waste-water. J. Chem. Technol. Biotechnol. 2011, 86, 1130–1158. [Google Scholar] [CrossRef]
  10. Fang, J.; Zhao, R.; Rao, B.; Rakowska, M.; Athanasiou, D.; Millerick, K.; Wei, S.; Lei, X.; Lou, H.H.; Reible, D.D. Removal of Polycyclic Aromatic Hydrocarbons from Water Using Mn(III)-Based Advanced Oxidation Process. J. Environ. Eng. 2021, 147, 04021002. [Google Scholar] [CrossRef]
  11. Wang, S.; Yi, L.; Halpert, J.E.; Lai, X.; Liu, Y.; Cao, H.; Yu, R.; Wang, D.; Li, Y. A novel and highly efficient photocatalyst based on P 25- graphdiyne nanocomposite. Small 2012, 8, 265–271. [Google Scholar] [CrossRef]
  12. Moreira, N.F.F.; Narciso-da-Rocha, C.; Polo-López, M.I.; Pastrana-Martínez, L.M.; Faria, J.L.; Manaia, C.M.; Fernández-Ibáñez, P.; Nunes, O.C.; Silva, A.M.T. Solar treatment (H2O2, TiO2-P25 and GO-TiO2 photocatalysis, photo-Fenton) of organic micropollutants, human pathogen indicators, antibiotic resistant bacteria and related genes in urban wastewater. Water Res. 2018, 135, 195–206. [Google Scholar] [CrossRef] [PubMed]
  13. Gomez-Ruiz, B.; Ribao, P.; Diban, N.; Rivero, M.J.; Ortiz, I.; Urtiaga, A. Photocatalytic degradation and mineralization of perfluorooctanoic acid (PFOA) using a composite TiO2 −rGO catalyst. J. Hazard. Mater. 2018, 344, 950–957. [Google Scholar] [CrossRef] [PubMed] [Green Version]
  14. Fukahori, S.; Ichiura, H.; Kitaoka, T.; Tanaka, H. Capturing of bisphenol A photodecomposition intermediates by composite TiO2-zeolite sheets. Appl. Catal. B Environ. 2003, 46, 453–462. [Google Scholar] [CrossRef]
  15. Zhang, G.; Song, A.; Duan, Y.; Zheng, S. Enhanced photocatalytic activity of TiO2/zeolite composite for abatement of pollutants. Microporous Mesoporous Mater. 2018, 255, 61–68. [Google Scholar] [CrossRef]
  16. Jansson, I.; Suárez, S.; Garcia-Garcia, F.J.; Sánchez, B. Zeolite-TiO2 hybrid composites for pollutant degradation in gas phase. Appl. Catal. B Environ. 2015, 178, 100–107. [Google Scholar] [CrossRef]
  17. Jiang, N.; Shang, R.; Heijman, S.G.J.; Rietveld, L.C. High-silica zeolites for adsorption of organic micro-pollutants in water treatment: A review. Water Res. 2018, 144, 145–161. [Google Scholar] [CrossRef] [PubMed]
  18. Dubey, N.; Rayalu, S.S.; Labhsetwar, N.K.; Devotta, S. Visible light active zeolite-based photocatalysts for hydrogen evolution from water. Int. J. Hydrog. Energy 2008, 33, 5958–5966. [Google Scholar] [CrossRef]
  19. López-Muñoz, M.-J.; Van Grieken, R.; Aguado, J.; Marugán, J. Role of the support on the activity of silica-supported TiO2 photocatalysts: Structure of the TiO2/SBA-15 photocatalysts. Catal. Today 2005, 101, 307–314. [Google Scholar] [CrossRef]
  20. Romay, M.; Diban, N.; Rivero, M.J.; Urtiaga, A.; Ortiz, I. Critical Issues and Guidelines to Improve the Performance of Photocatalytic Polymeric Membranes. Catalysts 2020, 10, 570. [Google Scholar] [CrossRef]
  21. Corredor, J.; Perez-Peña, E.; Rivero, M.J.; Ortiz, I. Performance of rGO/TiO2 Photocatalytic Membranes for Hydrogen Production. Membranes 2020, 10, 218. [Google Scholar] [CrossRef] [PubMed]
  22. Janssens, R.; Mandal, M.K.; Dubey, K.K.; Luis, P. Slurry photocatalytic membrane reactor technology for removal of pharmaceutical compounds from wastewater: Towards cytostatic drug elimination. Sci. Total Environ. 2017, 599–600, 612–626. [Google Scholar] [CrossRef]
  23. Marugán, J.; Hufschmidt, D.; López-Muñoz, M.J.; Selzer, V.; Bahnemann, D. Photonic efficiency for methanol photooxidation and hydroxyl radical generation on silica-supported TiO2 photocatalysts. Appl. Catal. B Environ. 2006, 62, 201–207. [Google Scholar] [CrossRef]
  24. Joseph, C.G.; Taufiq-Yap, Y.H.; Musta, B.; Sarjadi, M.S.; Elilarasi, L. Application of Plasmonic Metal Nanoparticles in TiO2-SiO2 Composite as an Efficient Solar-Activated Photocatalyst: A Review Paper. Front. Chem. 2021, 8, 1283. [Google Scholar] [CrossRef] [PubMed]
  25. Makuła, P.; Pacia, M.; Macyk, W. How To Correctly Determine the Band Gap Energy of Modified Semiconductor Photocatalysts Based on UV-Vis Spectra. J. Phys. Chem. Lett. 2018, 9, 6814–6817. [Google Scholar] [CrossRef] [PubMed] [Green Version]
  26. Abbas, H.A.; Nasr, R.A.; Vannier, R.-N.; Jamil, T.S. Improving of photocatalytic activity of barium ferrate via bismuth and copper co-doping for degradation of paracetamol under visible light irradiation. J. Environ. Sci. 2022, 112, 331–342. [Google Scholar] [CrossRef]
  27. Wodka, D.; Bielaníska, E.; Socha, R.P.; Elzbieciak-Wodka, M.; Gurgul, J.; Nowak, P.; Warszyníski, P.; Kumakiri, I. Photocatalytic activity of titanium dioxide modified by silver nanoparticles. ACS Appl. Mater. Interfaces 2010, 2, 1945–1953. [Google Scholar] [CrossRef] [PubMed]
  28. Kuwahara, Y.; Aoyama, J.; Miyakubo, K.; Eguchi, T.; Kamegawa, T.; Mori, K.; Yamashita, H. TiO2 photocatalyst for degradation of organic compounds in water and air supported on highly hydrophobic FAU zeolite: Structural, sorptive, and photocatalytic studies. J. Catal. 2012, 285, 223–234. [Google Scholar] [CrossRef]
  29. Piedra López, J.G.; González Pichardo, O.H.; Pinedo Escobar, J.A.; de Haro del Río, D.A.; Inchaurregui Méndez, H.; González Rodríguez, L.M. Photocatalytic degradation of metoprolol in aqueous medium using a TiO2/natural zeolite composite. Fuel 2021, 284, 119030. [Google Scholar] [CrossRef]
  30. Nguyen, C.H.; Fu, C.C.; Juang, R.S. Degradation of methylene blue and methyl orange by palladium-doped TiO2 photocatalysis for water reuse: Efficiency and degradation pathways. J. Clean. Prod. 2018, 202, 413–427. [Google Scholar] [CrossRef]
  31. Ribao, P.; Corredor, J.; Rivero, M.J.; Ortiz, I. Role of reactive oxygen species on the activity of noble metal-doped TiO2 photocatalysts. J. Hazard. Mater. 2019, 372, 45–51. [Google Scholar] [CrossRef] [PubMed]
  32. Dominguez, S.; Ribao, P.; Rivero, M.J.; Ortiz, I. Influence of radiation and TiO2 concentration on the hydroxyl radicals generation in a photocatalytic LED reactor. Application to dodecylbenzenesulfonate degradation. Appl. Catal. B Environ. 2015, 178, 165–169. [Google Scholar] [CrossRef] [Green Version]
  33. Kosydar, R.; Szewczyk, I.; Natkański, P.; Duraczyńska, D.; Gurgul, J.; Kuśtrowski, P.; Drelinkiewicz, A. New insight into the effect of surface oxidized groups of nanostructured carbon supported Pd catalysts on the furfural hydrogenation. Surf. Interfaces 2019, 17, 100379. [Google Scholar] [CrossRef]
  34. Oćwieja, M.; Adamczyk, Z.; Morga, M.; Michna, A. High density silver nanoparticle monolayers produced by colloid self-assembly on polyelectrolyte supporting layers. J. Colloid Interface Sci. 2011, 364, 39–48. [Google Scholar] [CrossRef] [PubMed]
Figure 1. The XRD patterns of (a) the powders: zeolite Y and the mixtures of TiO2 and zeolite Y containing 5, 10 and 15 wt.% of zeolite; (b) TiO2 before and after deposition of metal nanoparticles (Pd or Ag); and (c) a mixture of TiO2 and 5 wt.% zeolite Y before and after deposition of metal nanoparticles (Pd or Ag).
Catalysts 11 01367 g001
Figure 2. TEM images of (a) T–ZY, (b) T–ZY–Pd, (c) T–ZY–Ag, and higher magnification of (d) T–Pd and (e) T–ZY–Pd. Arrows indicate the presence of Pd-containing nanoparticles/clusters.
Catalysts 11 01367 g002
Figure 3. Degradation of methyl orange dye aqueous solutions after being UV irradiated for 2 h in the presence of TiO2 and the physical mixtures of TiO2–ZY containing 5 and 15 wt.%. of zeolite.
Catalysts 11 01367 g003
Figure 4. Change with time in dimensionless DCA concentration in aqueous solutions in the presence of (a) TiO2 and TiO2-metal composites and (b) T–ZY and T–ZY metal composites irradiated with UV–A source at 365 nm. Additionally, control experiments evaluating DCA adsorption in pure TiO2 (a) and TiO2–5%ZY mixtures (b) in absence of light and photolysis of DCA (a) are included.
Catalysts 11 01367 g004
Figure 5. Change with time in dimensionless SDBS concentration in aqueous solutions in the presence of TiO2 and TiO2 metal composites (a) and T–ZY and T–ZY metal photocatalysts (b) irradiated with UV–A source at 365 nm. Additionally, control experiments evaluating (i) SDBS adsorption in pure TiO2 (a) and TiO2–ZY 5% mixtures (b) in absence of light and (ii) photolysis of SDBS are included.
Catalysts 11 01367 g005
Table 1. Specific surface area (SBET), pore volume (Vtot) (determined by nitrogen adsorption) and experimental band gap energy (Eg) values obtained from the analysis of Tauc plot [25].
SampleCompositionSpecific Surface Area, SBET
(m2g−1)
Total Pore Volume
Vtot
(cm3g−1)
Eg (eV)
TTiO2590.313.27
T–ZYTiO2–5% zeolite Y840.263.20
T–PdTiO2-1% Pd600.253.20
T–ZY–PdTiO2–5% zeolite Y-1% Pd840.273.28
T–AgTiO2–0.05% Ag590.263.22
T–ZY–AgTiO2–5% zeolite Y-0.05% Ag840.243.17
Publisher’s Note: MDPI stays neutral with regard to jurisdictional claims in published maps and institutional affiliations.

