
The Effect of Cobalt Catalyst Loading at Very High Pressure Plasma-Catalysis in Fischer-Tropsch Synthesis


Abstract
:1. Introduction
2. Results and Discussion
2.1. Pressure Variation Study
2.1.1. The Influence of Pressure on FTS Product Yields
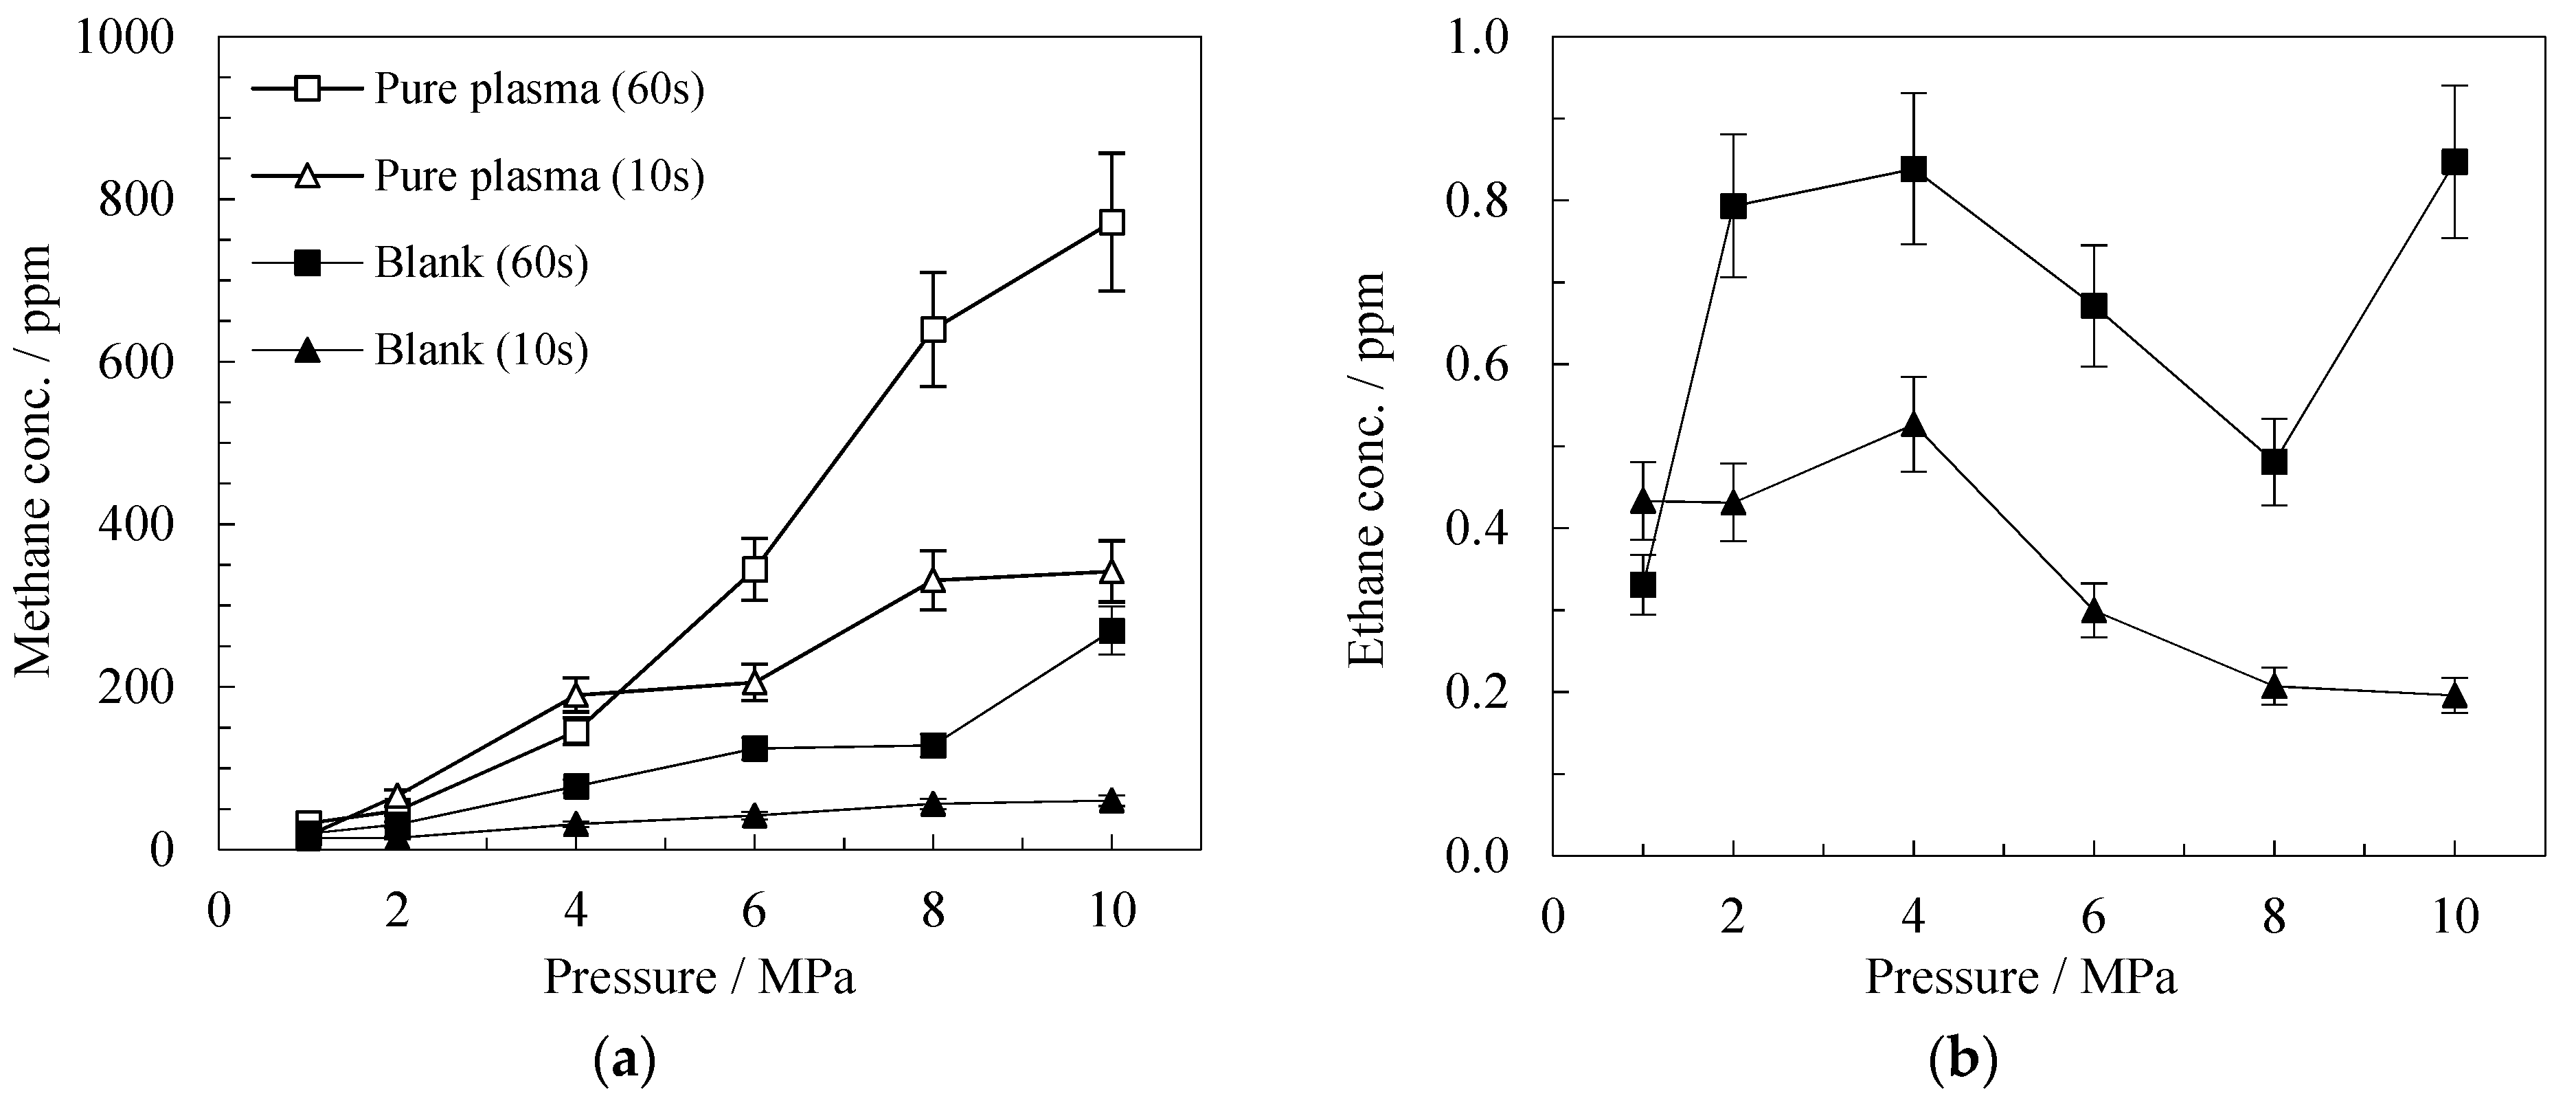
Blank Catalyst
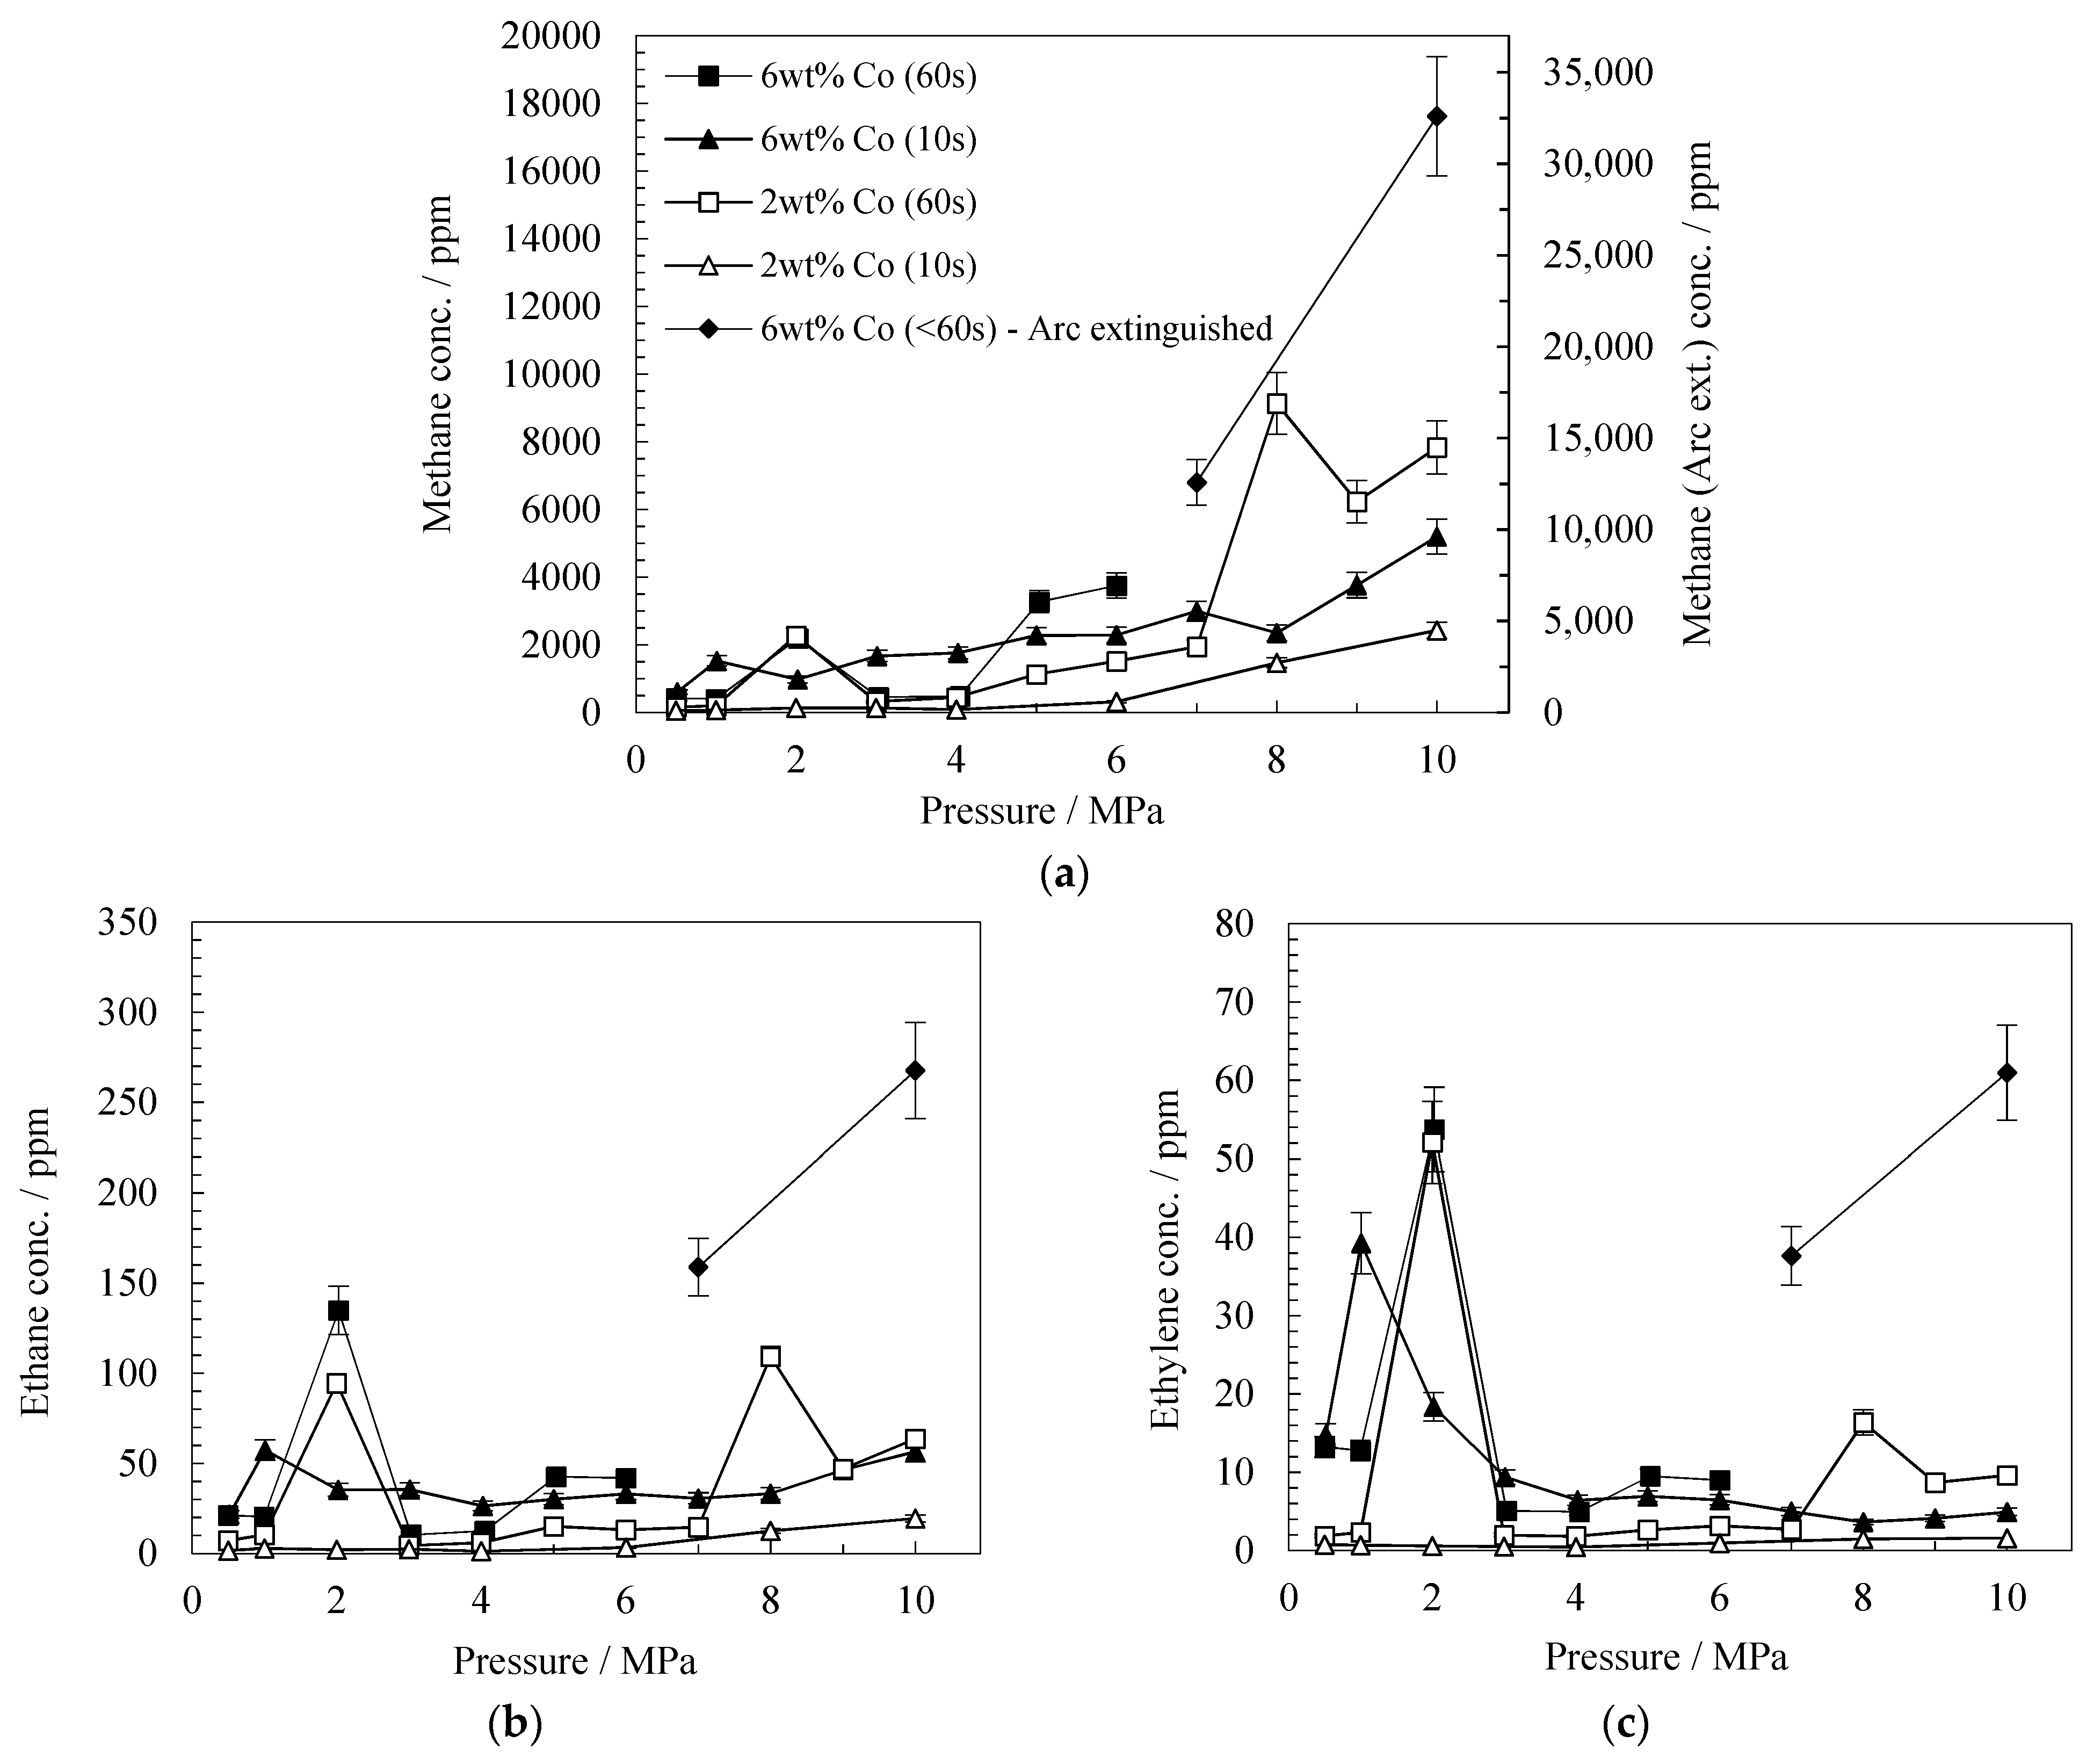
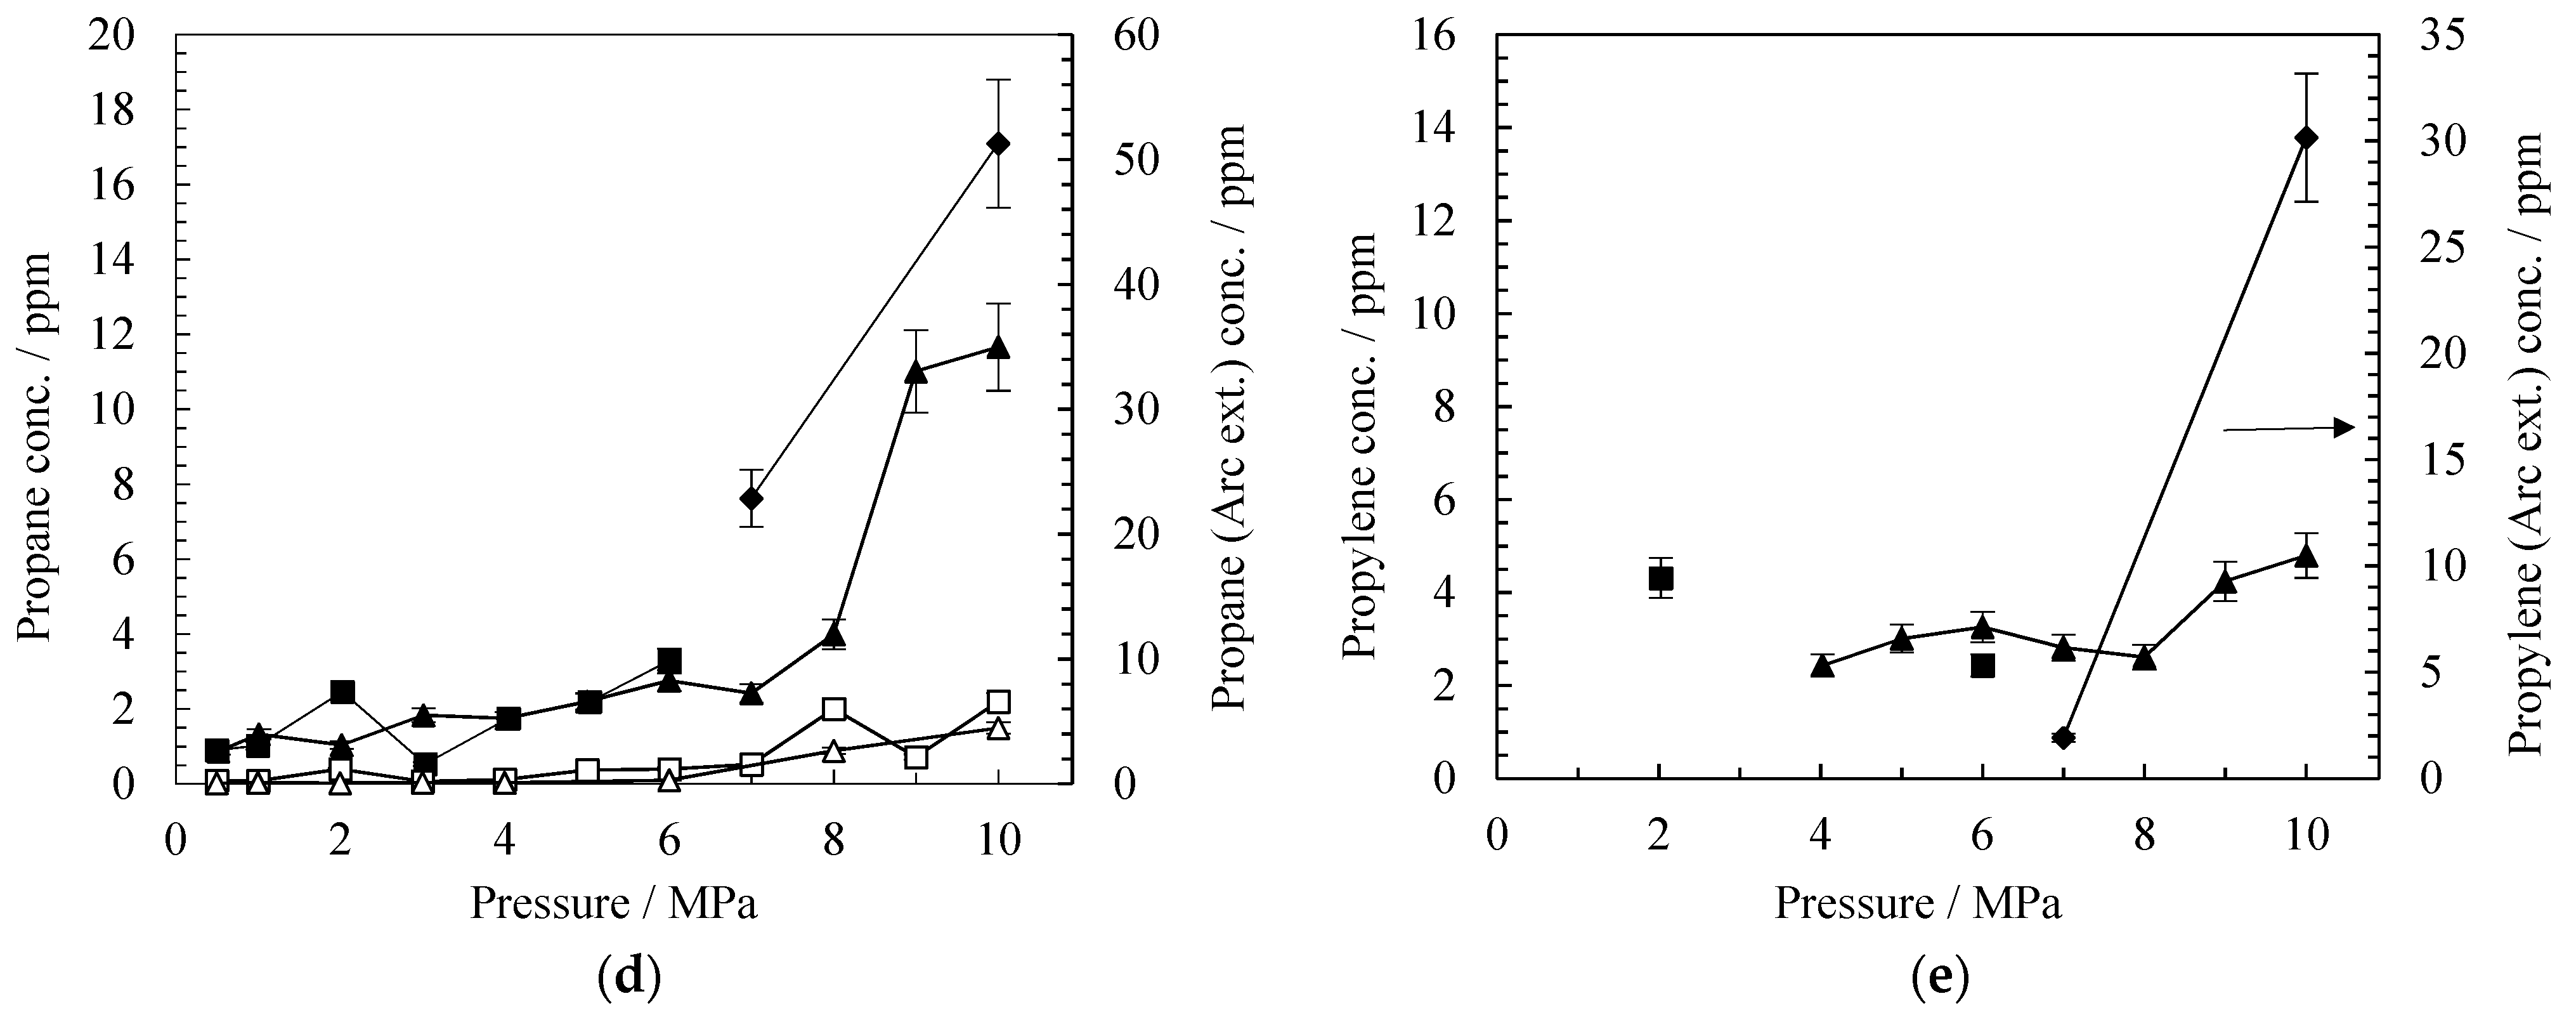
2 wt% and 6 wt% Co Catalyst
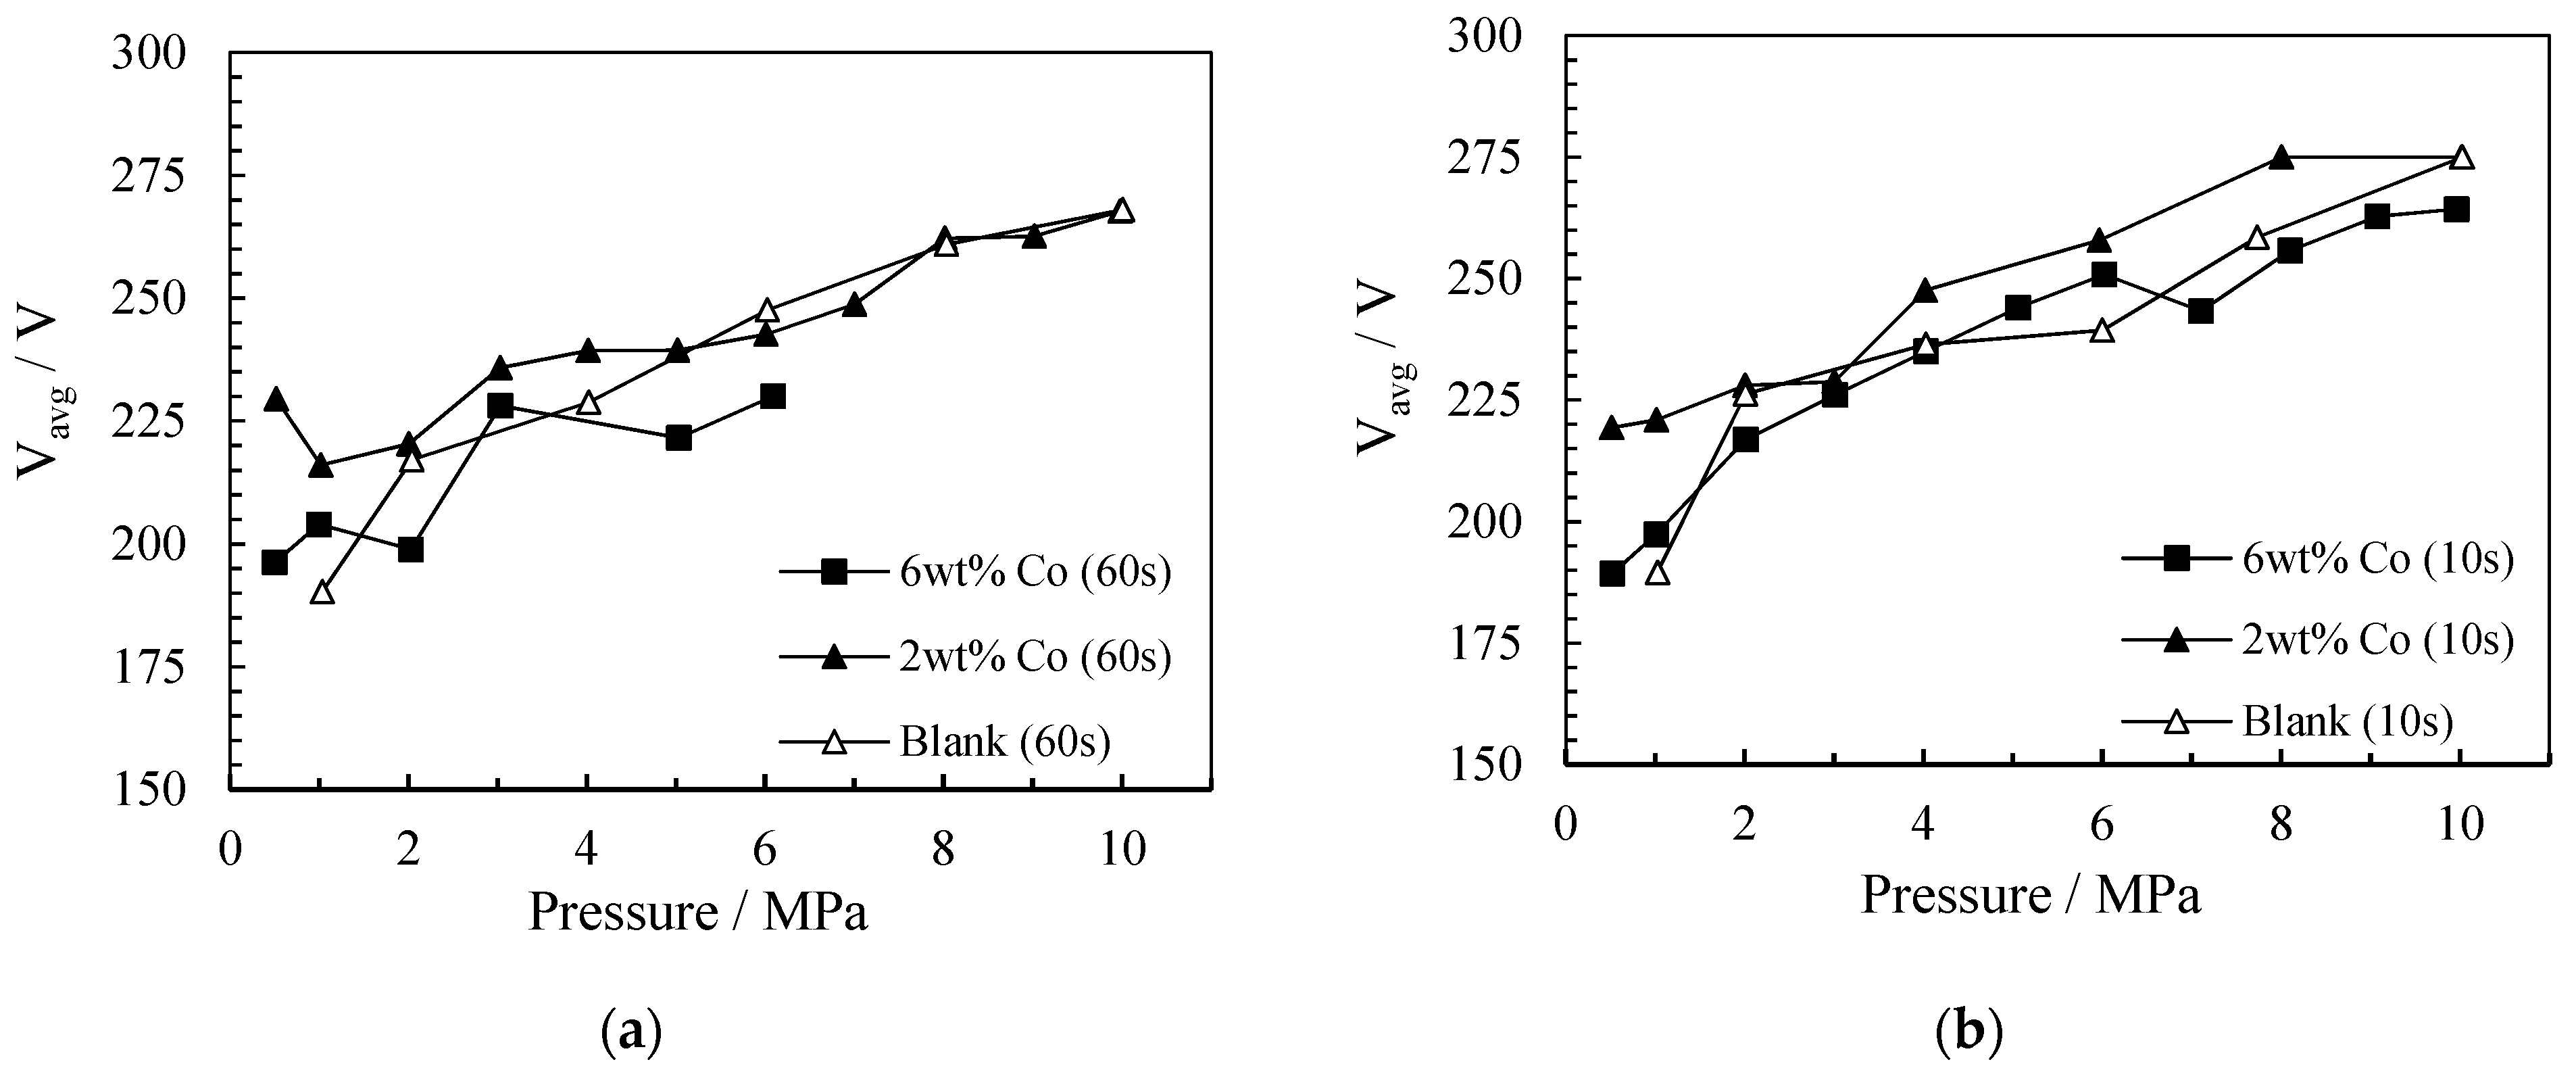
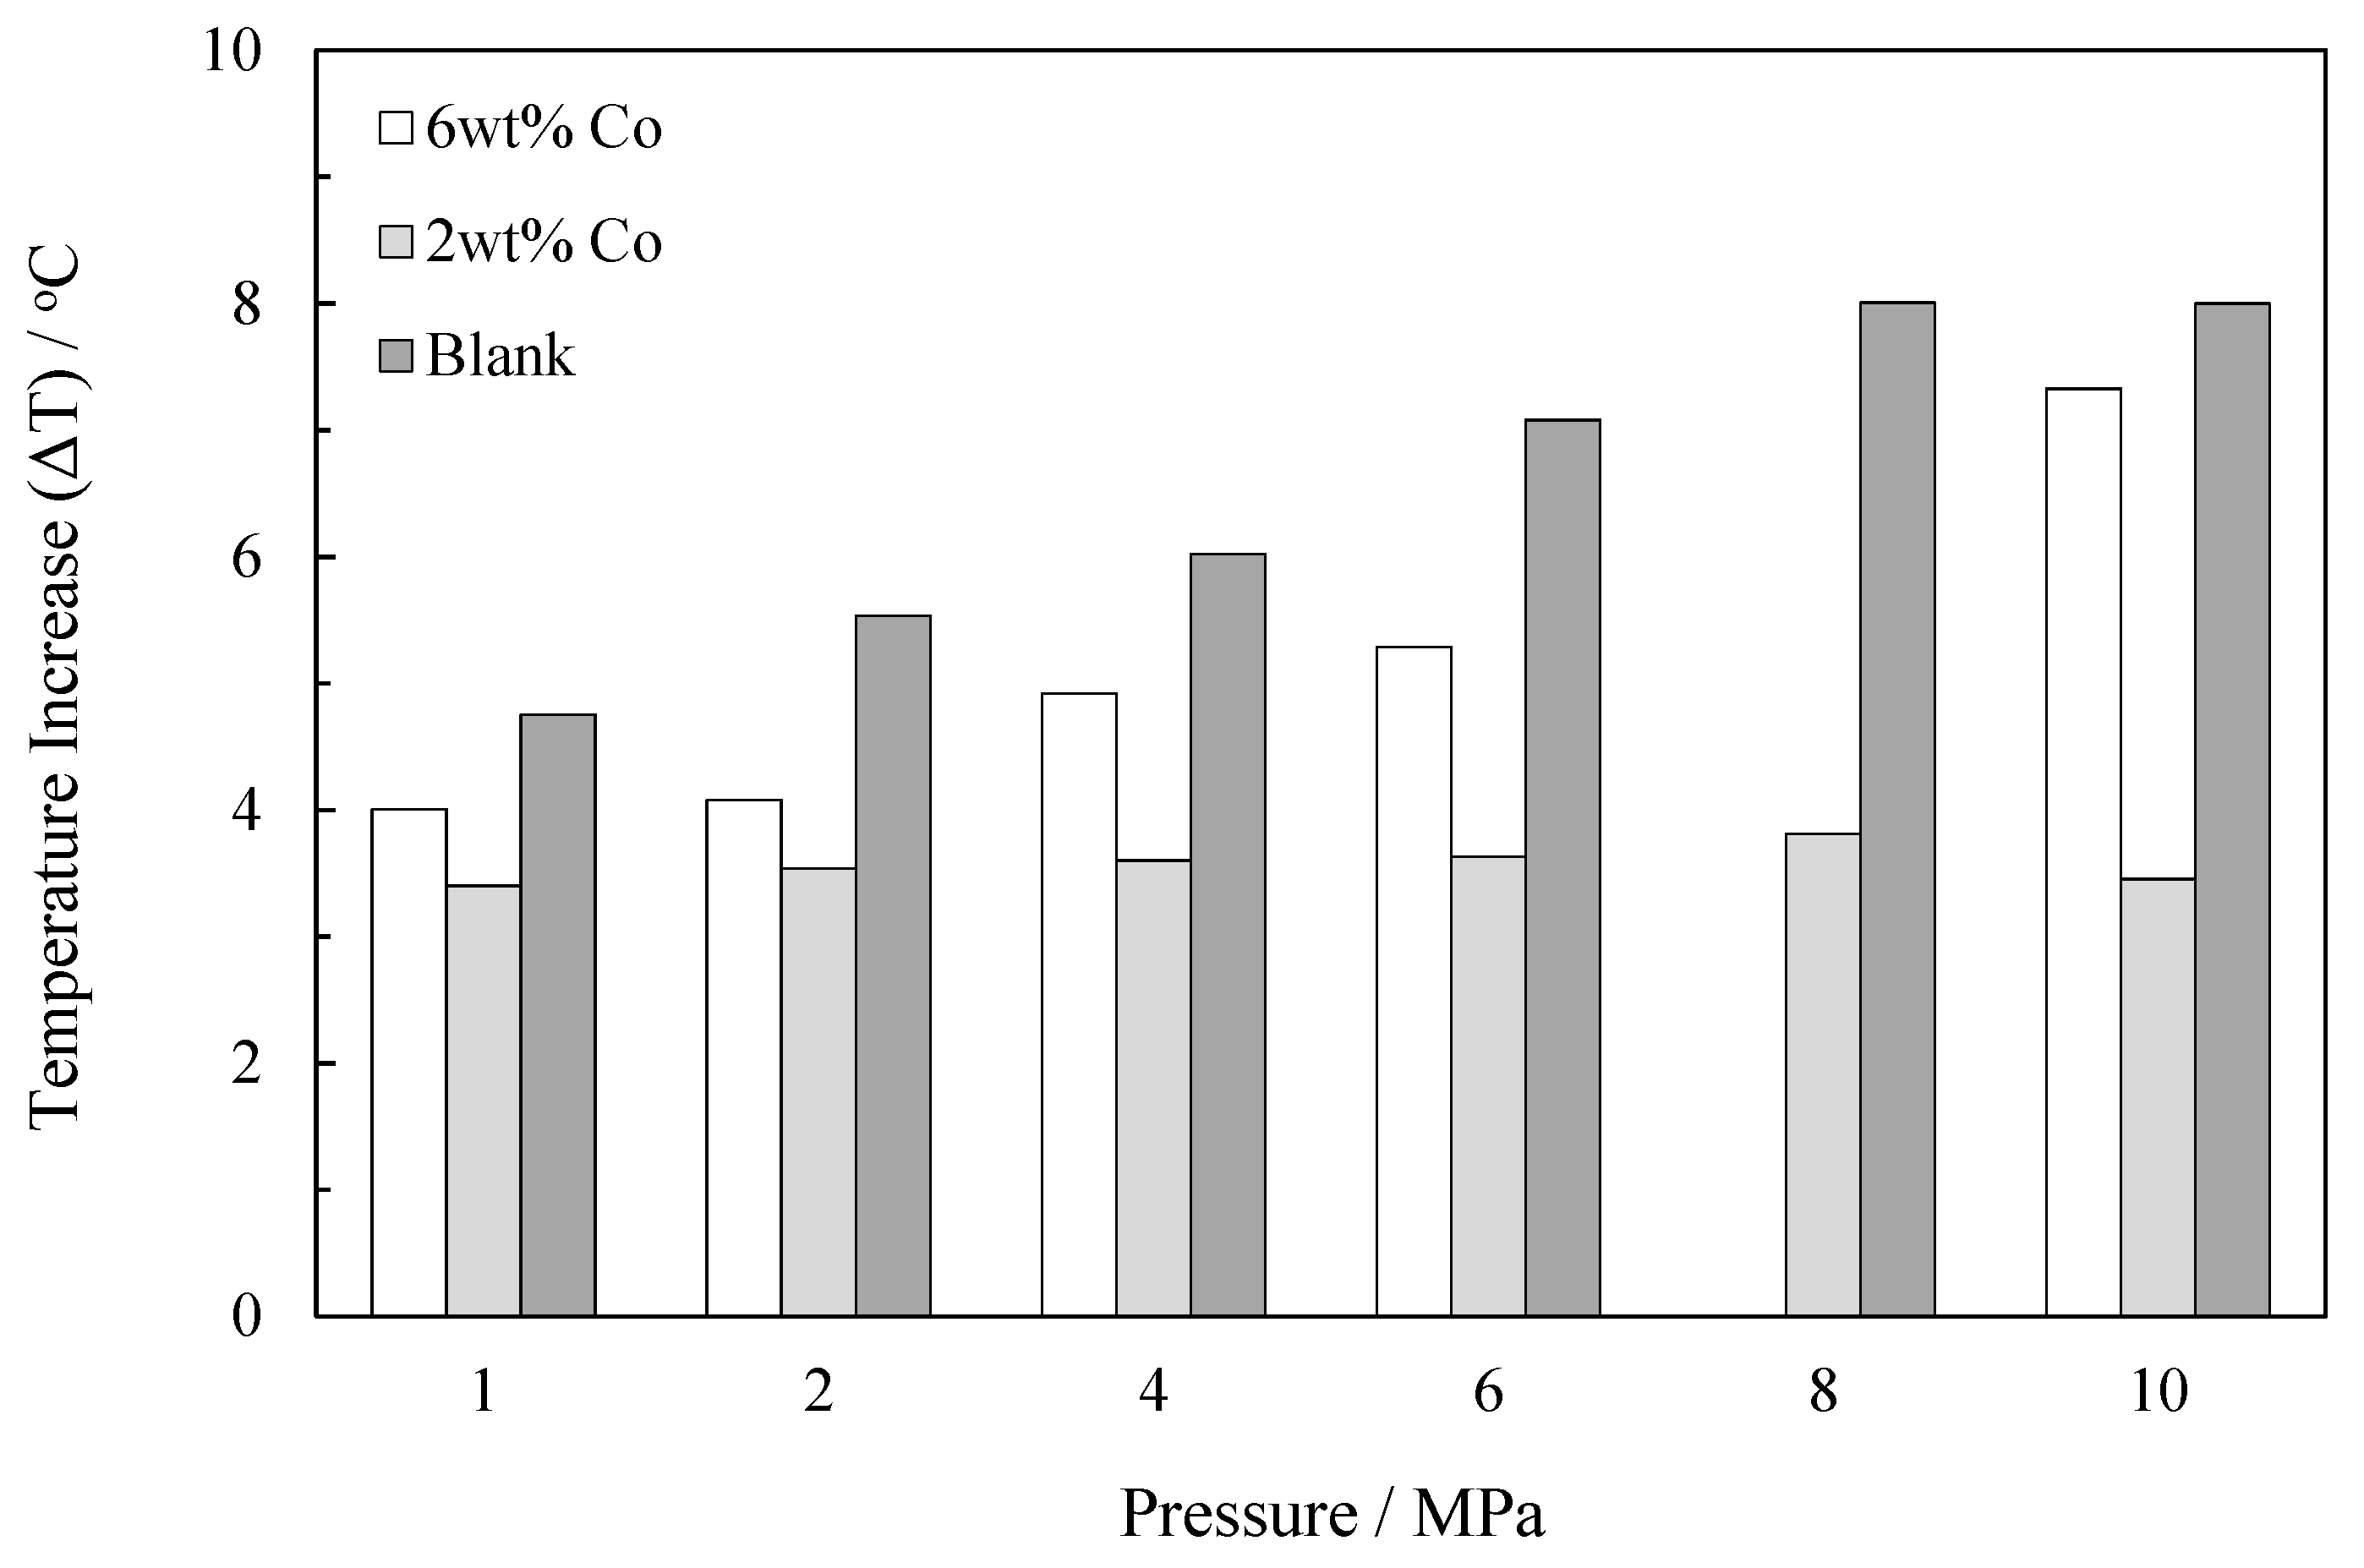
2.1.2. The Influence of Pressure on Energy Consumption
Specific Input Energy (SIE)
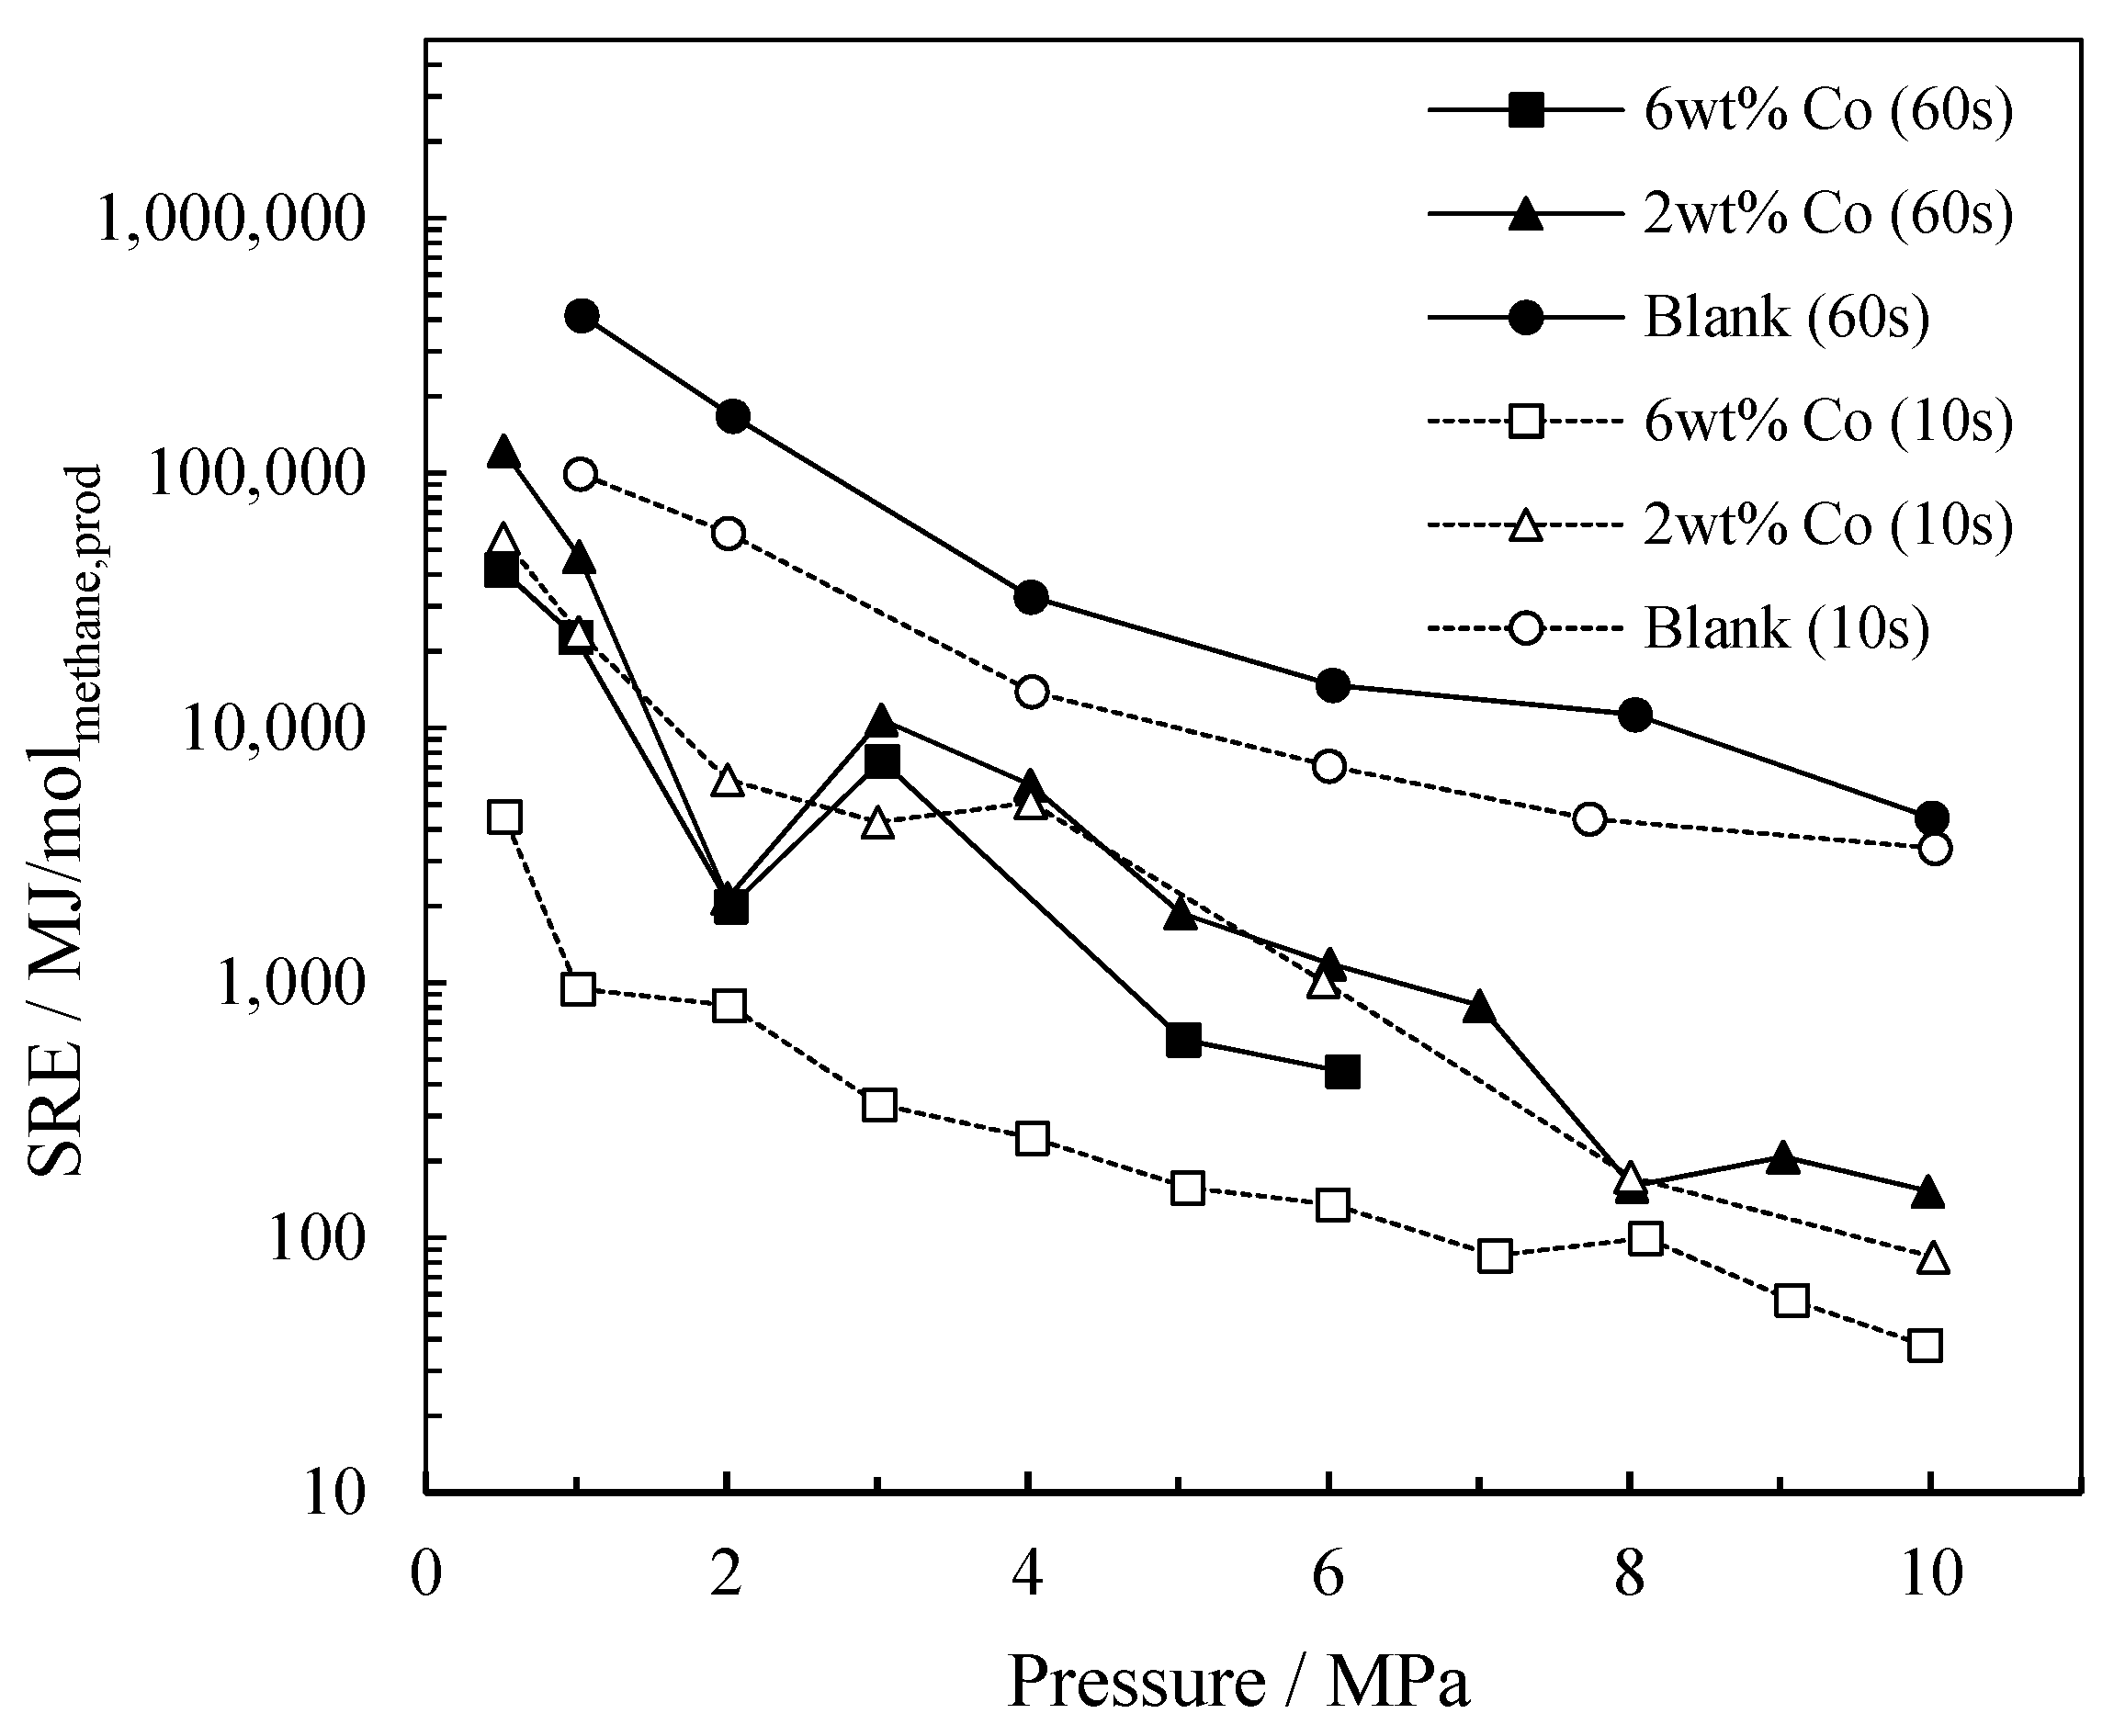
Specific Required Energy (SRE)
2.1.3. Optimum Conditions
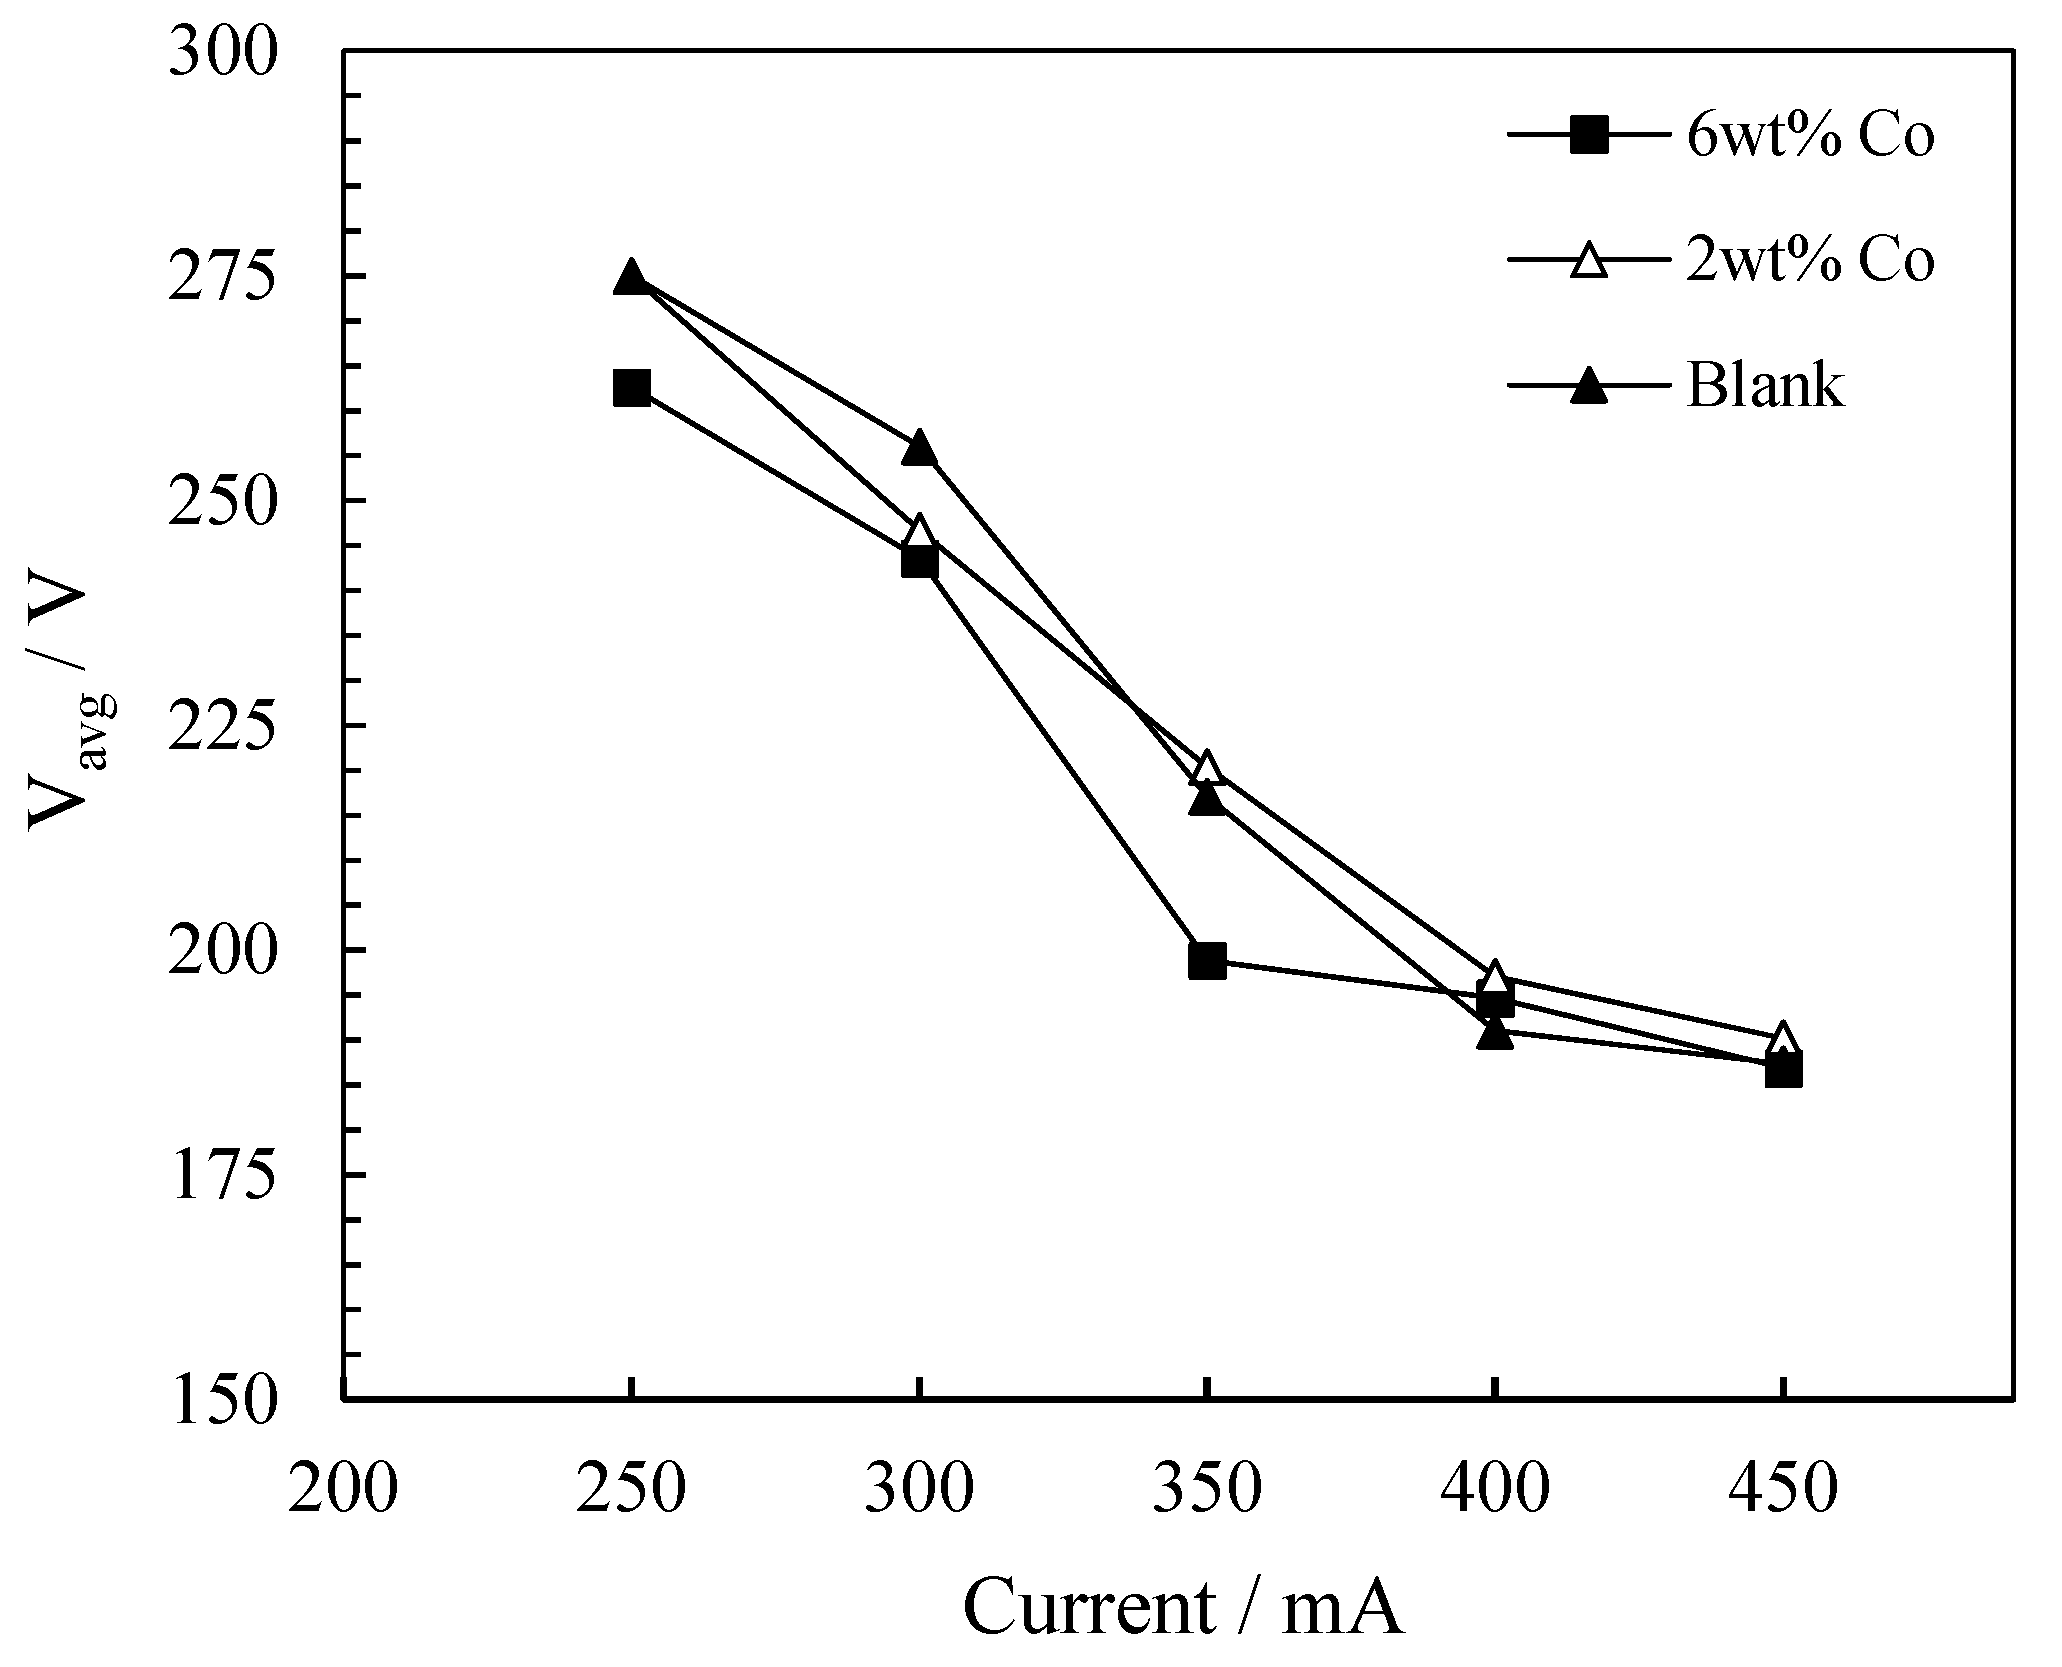
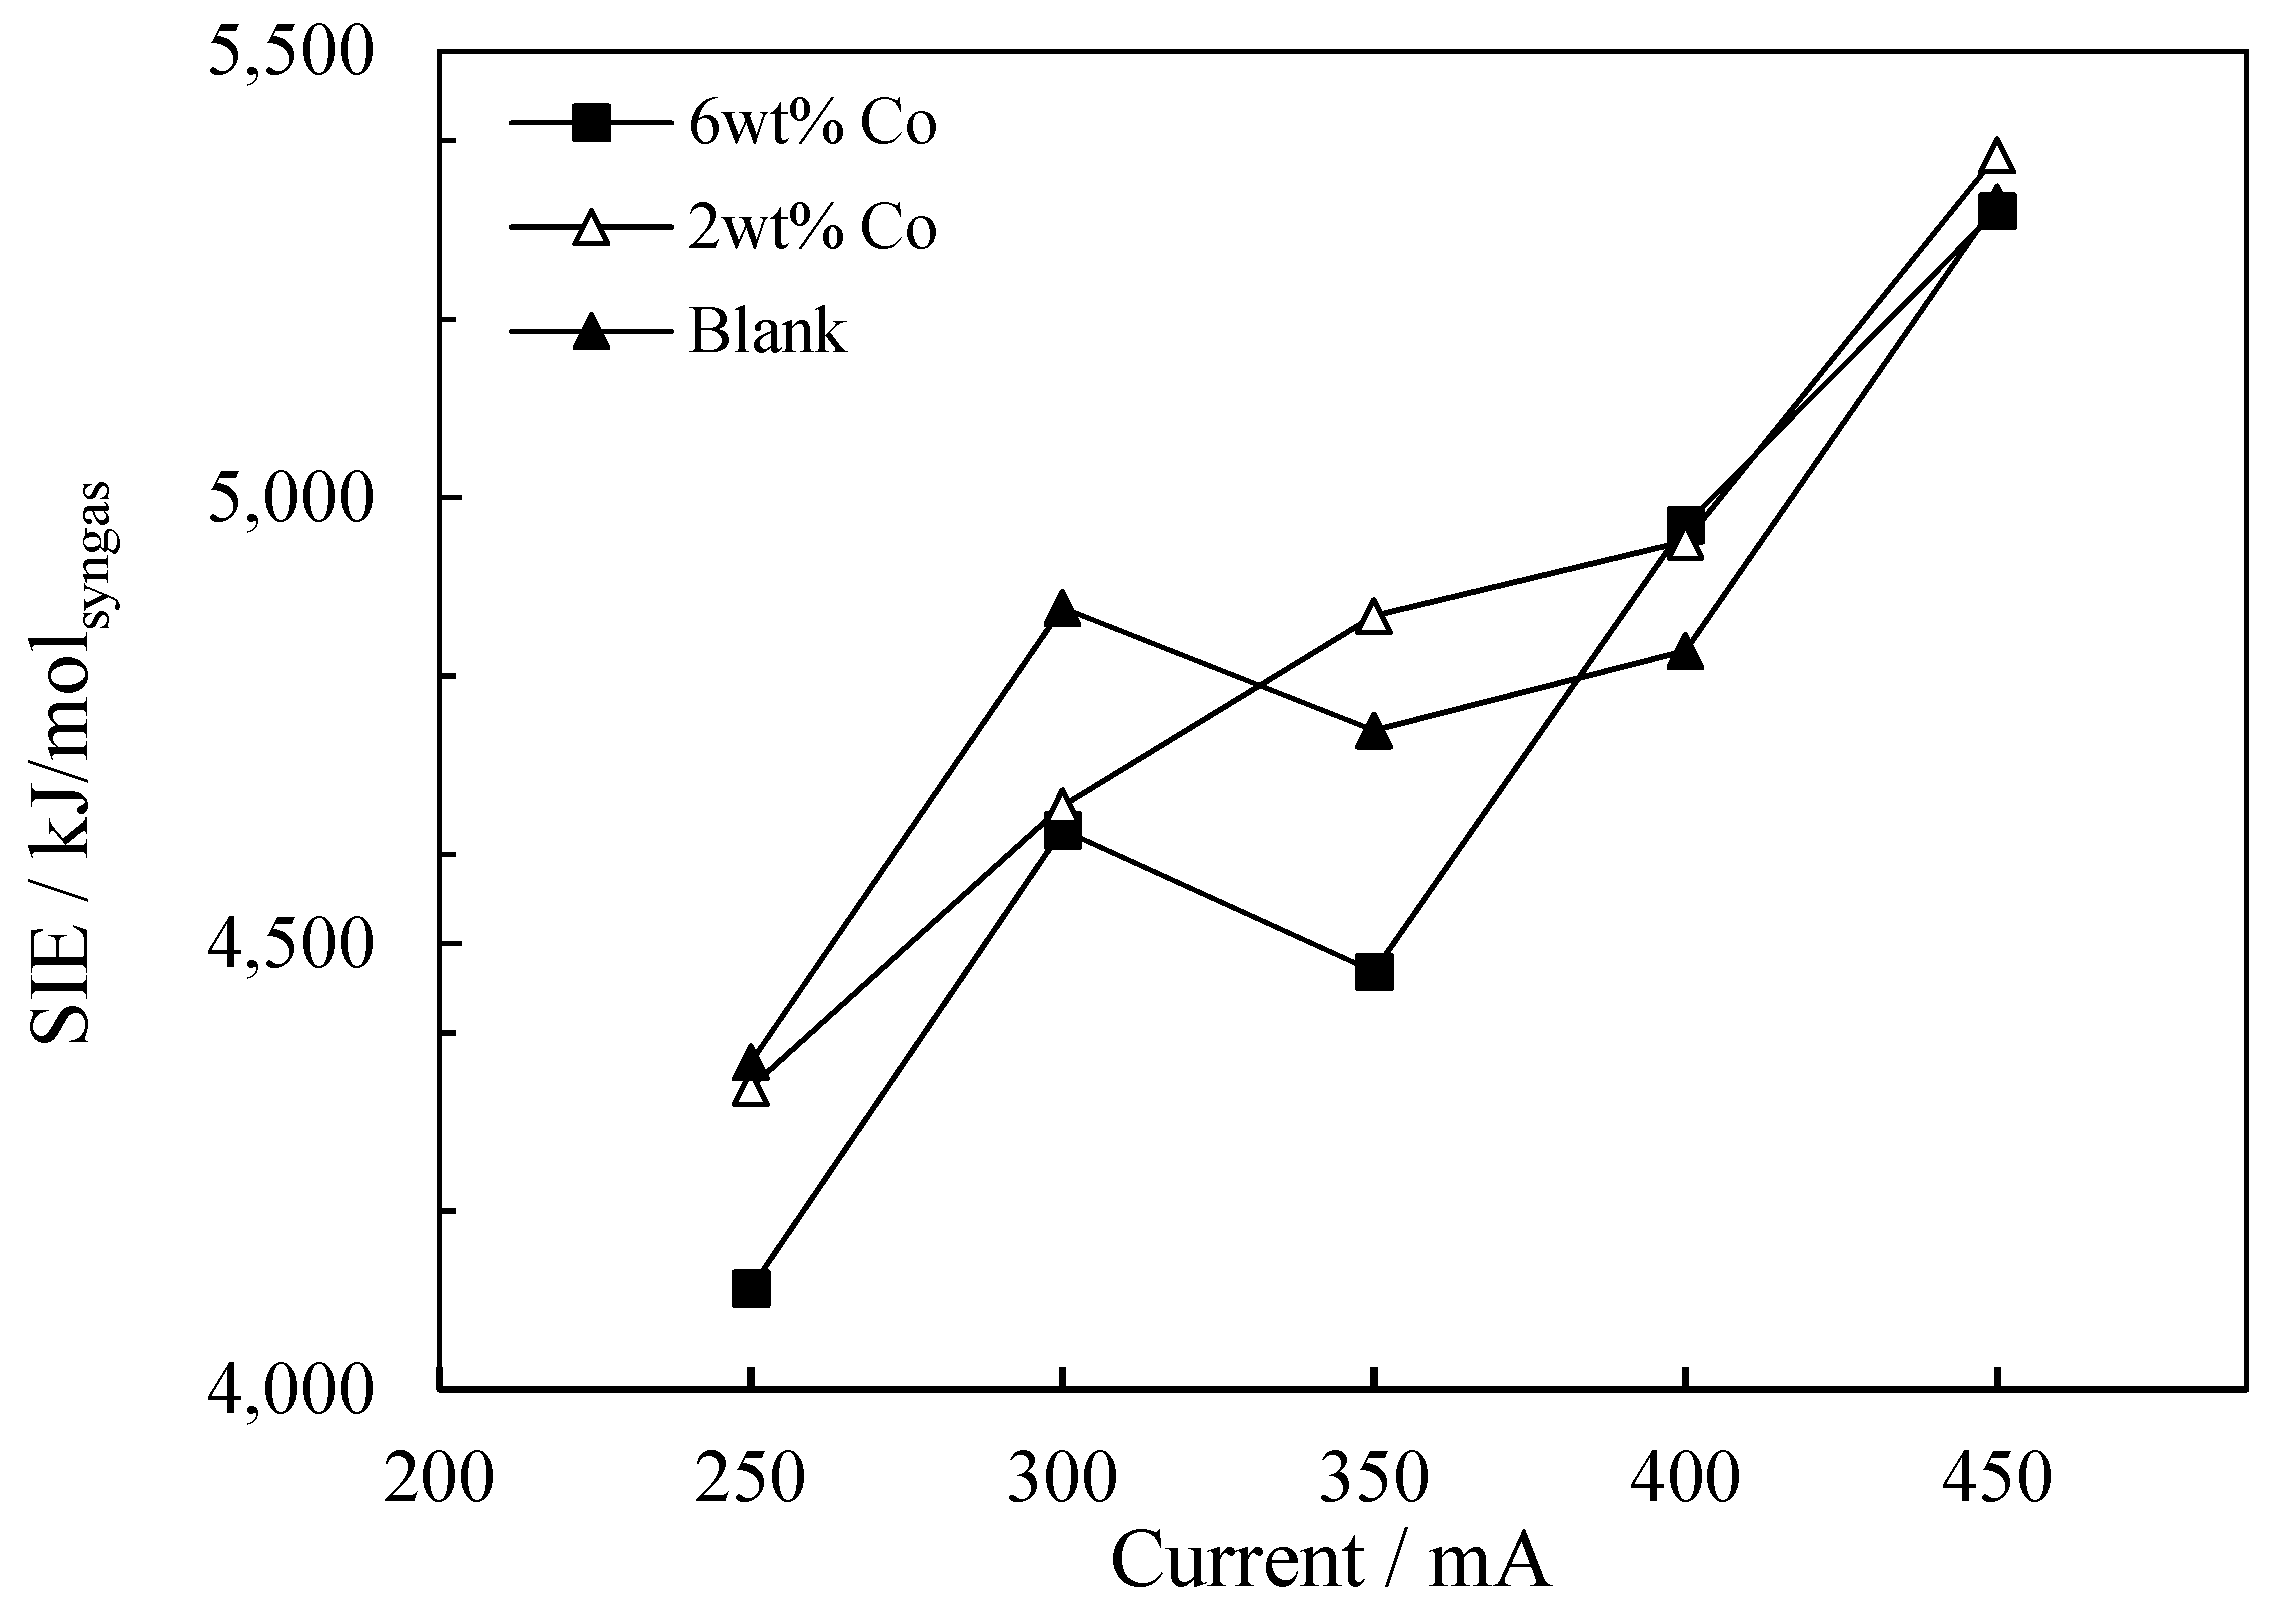
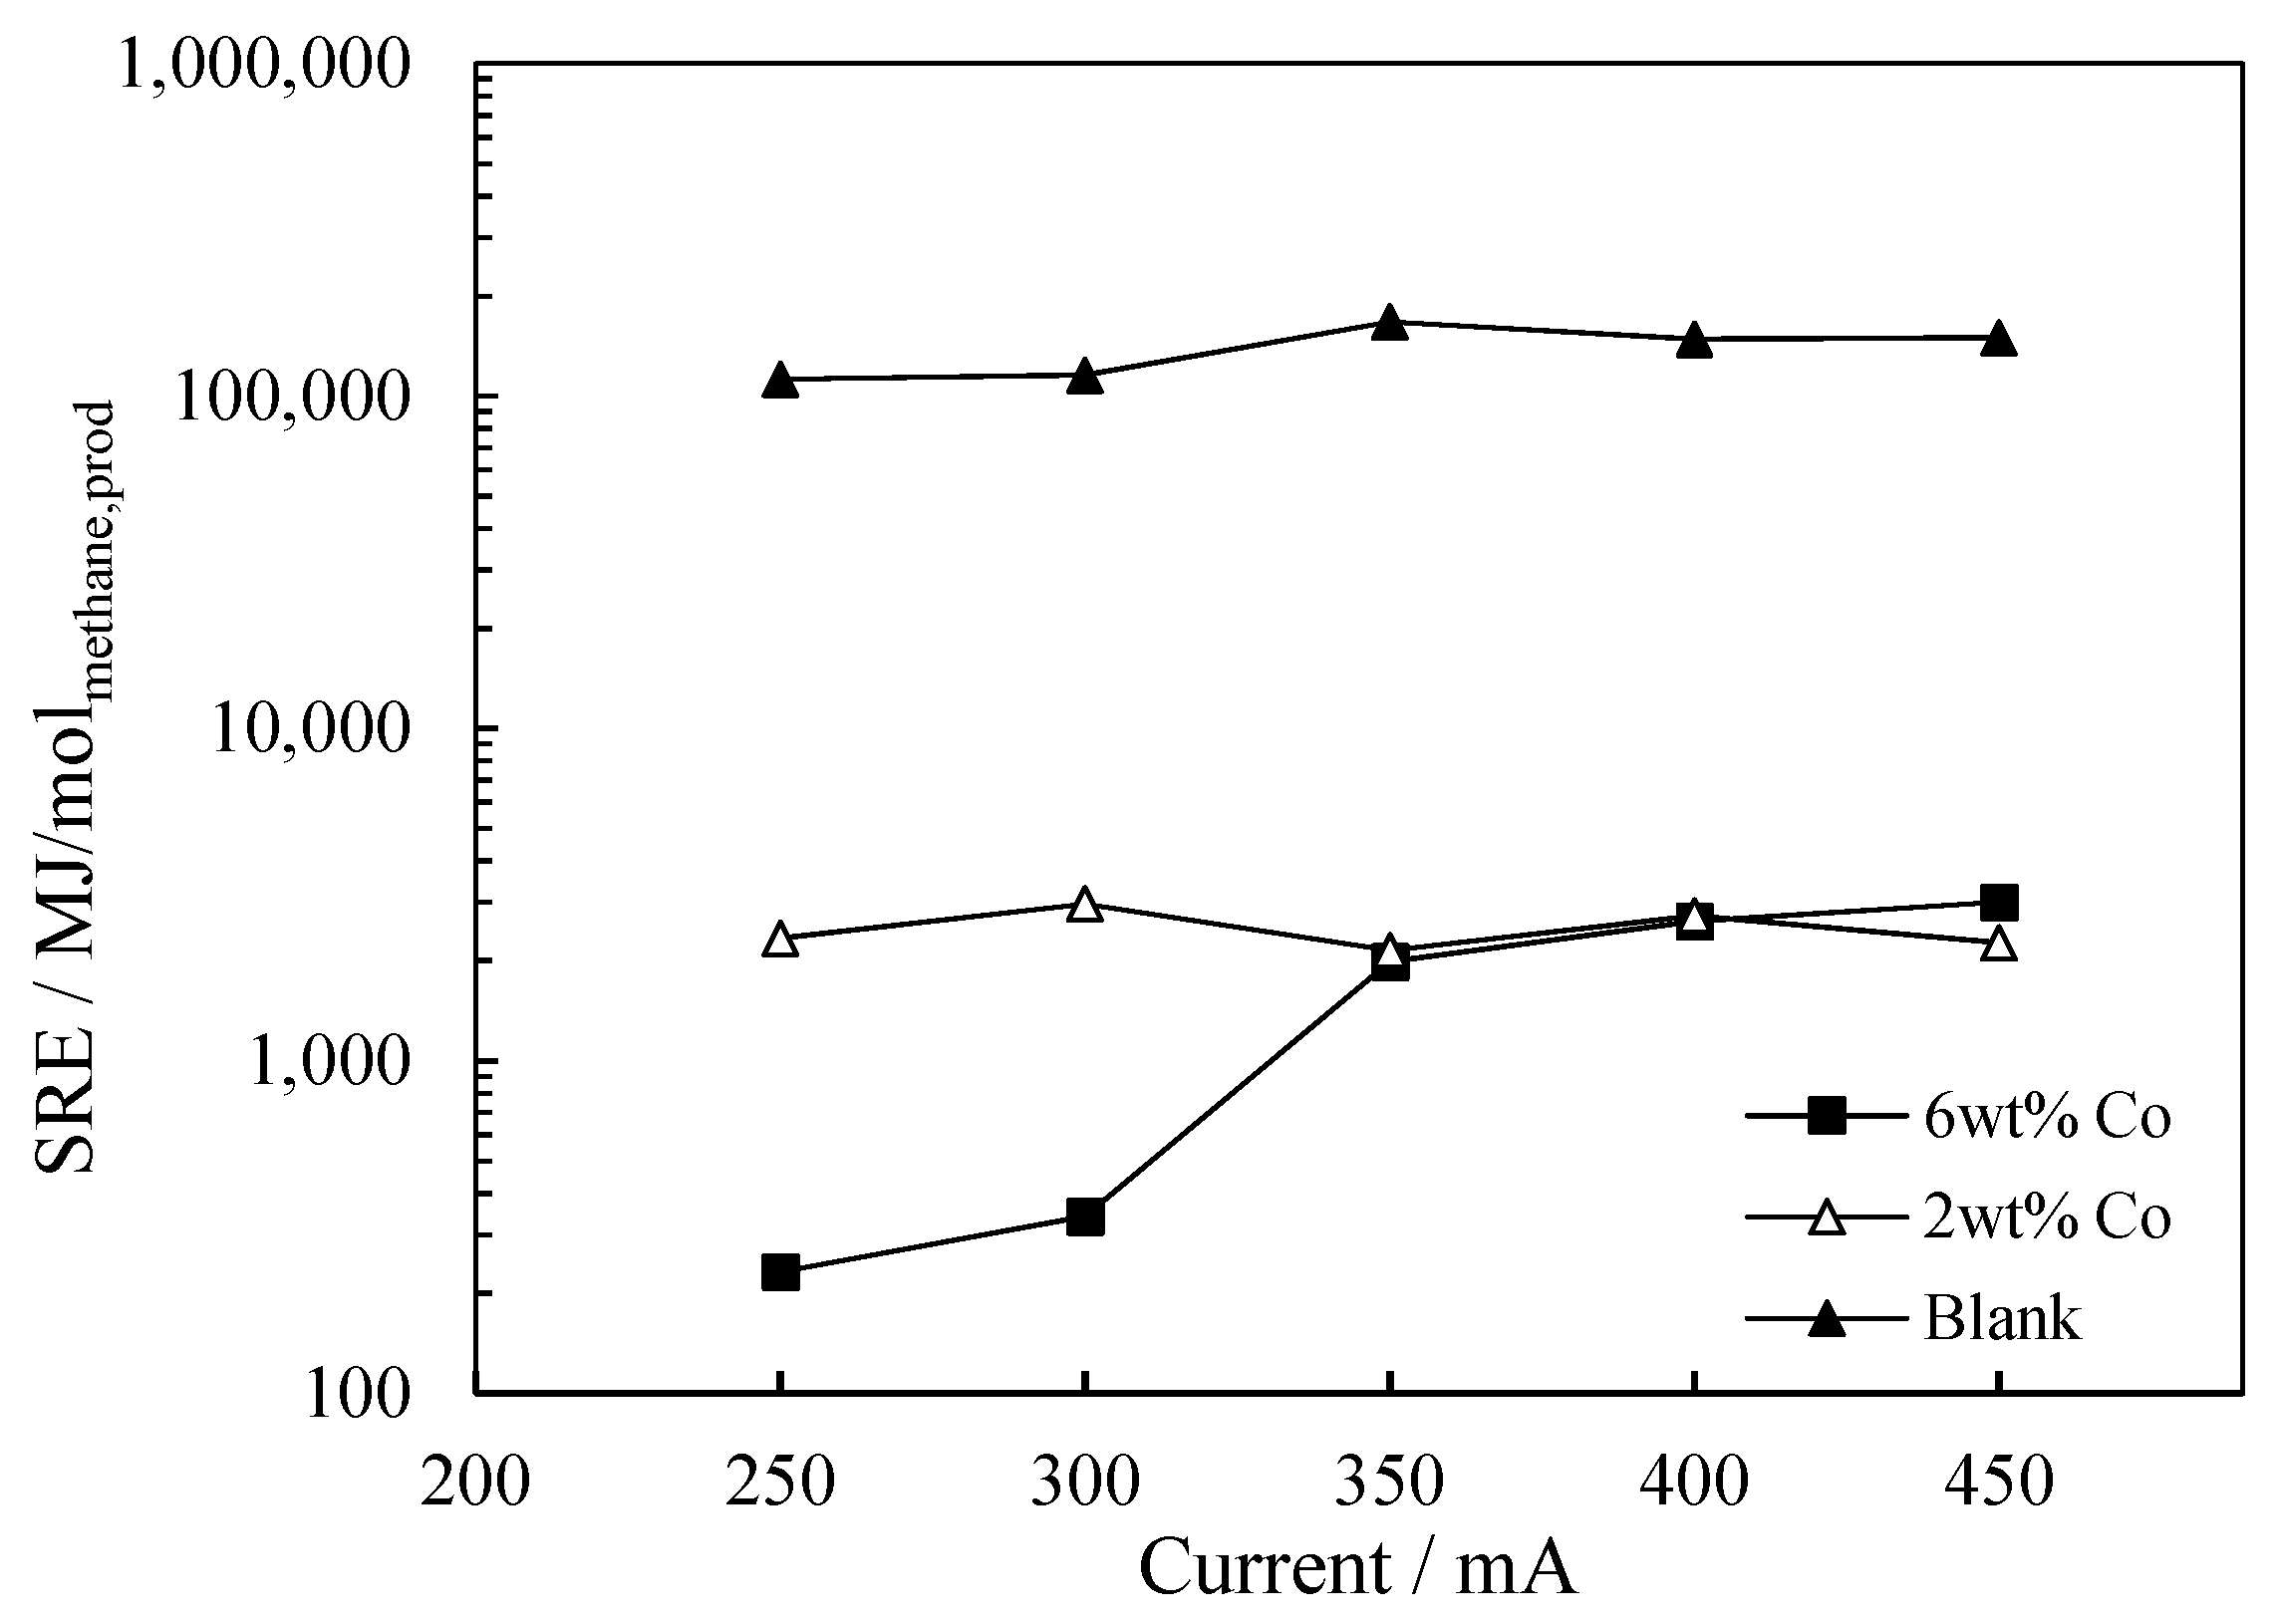
2.2. Current Variation Study
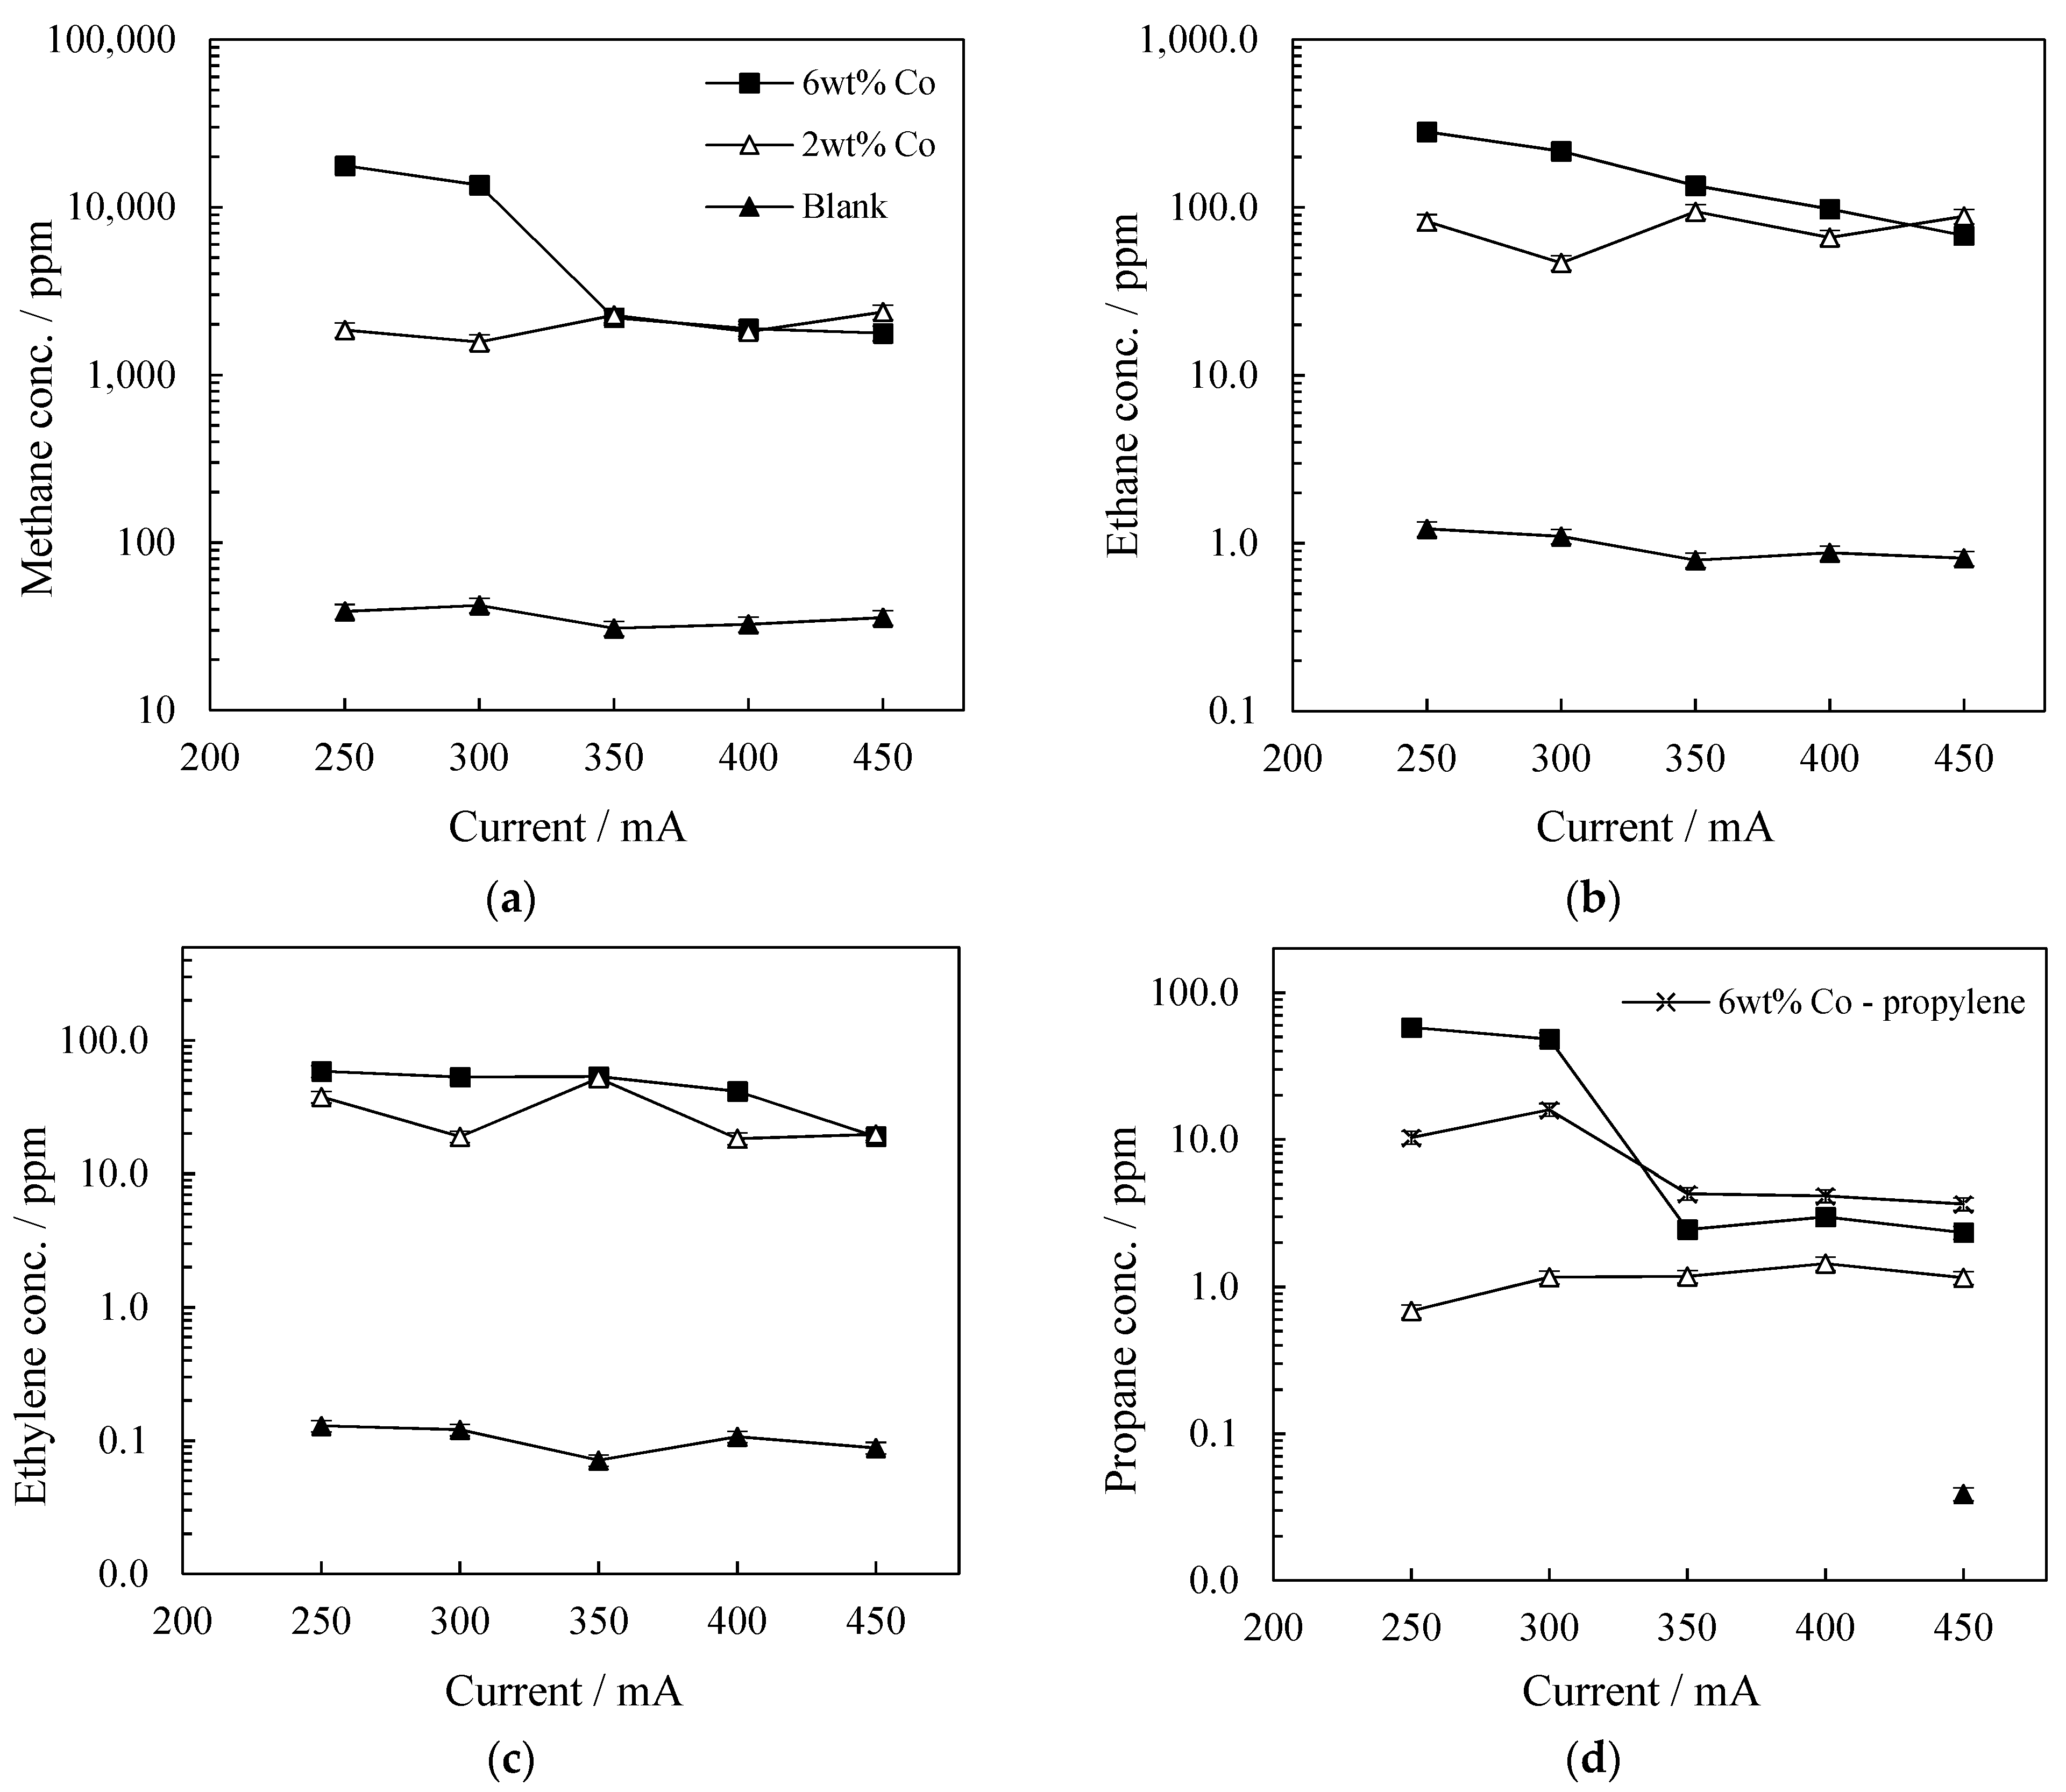
2.2.1. The Influence of Current on FTS Products Yields
2.2.2. The Influence of Current on Energy Consumption
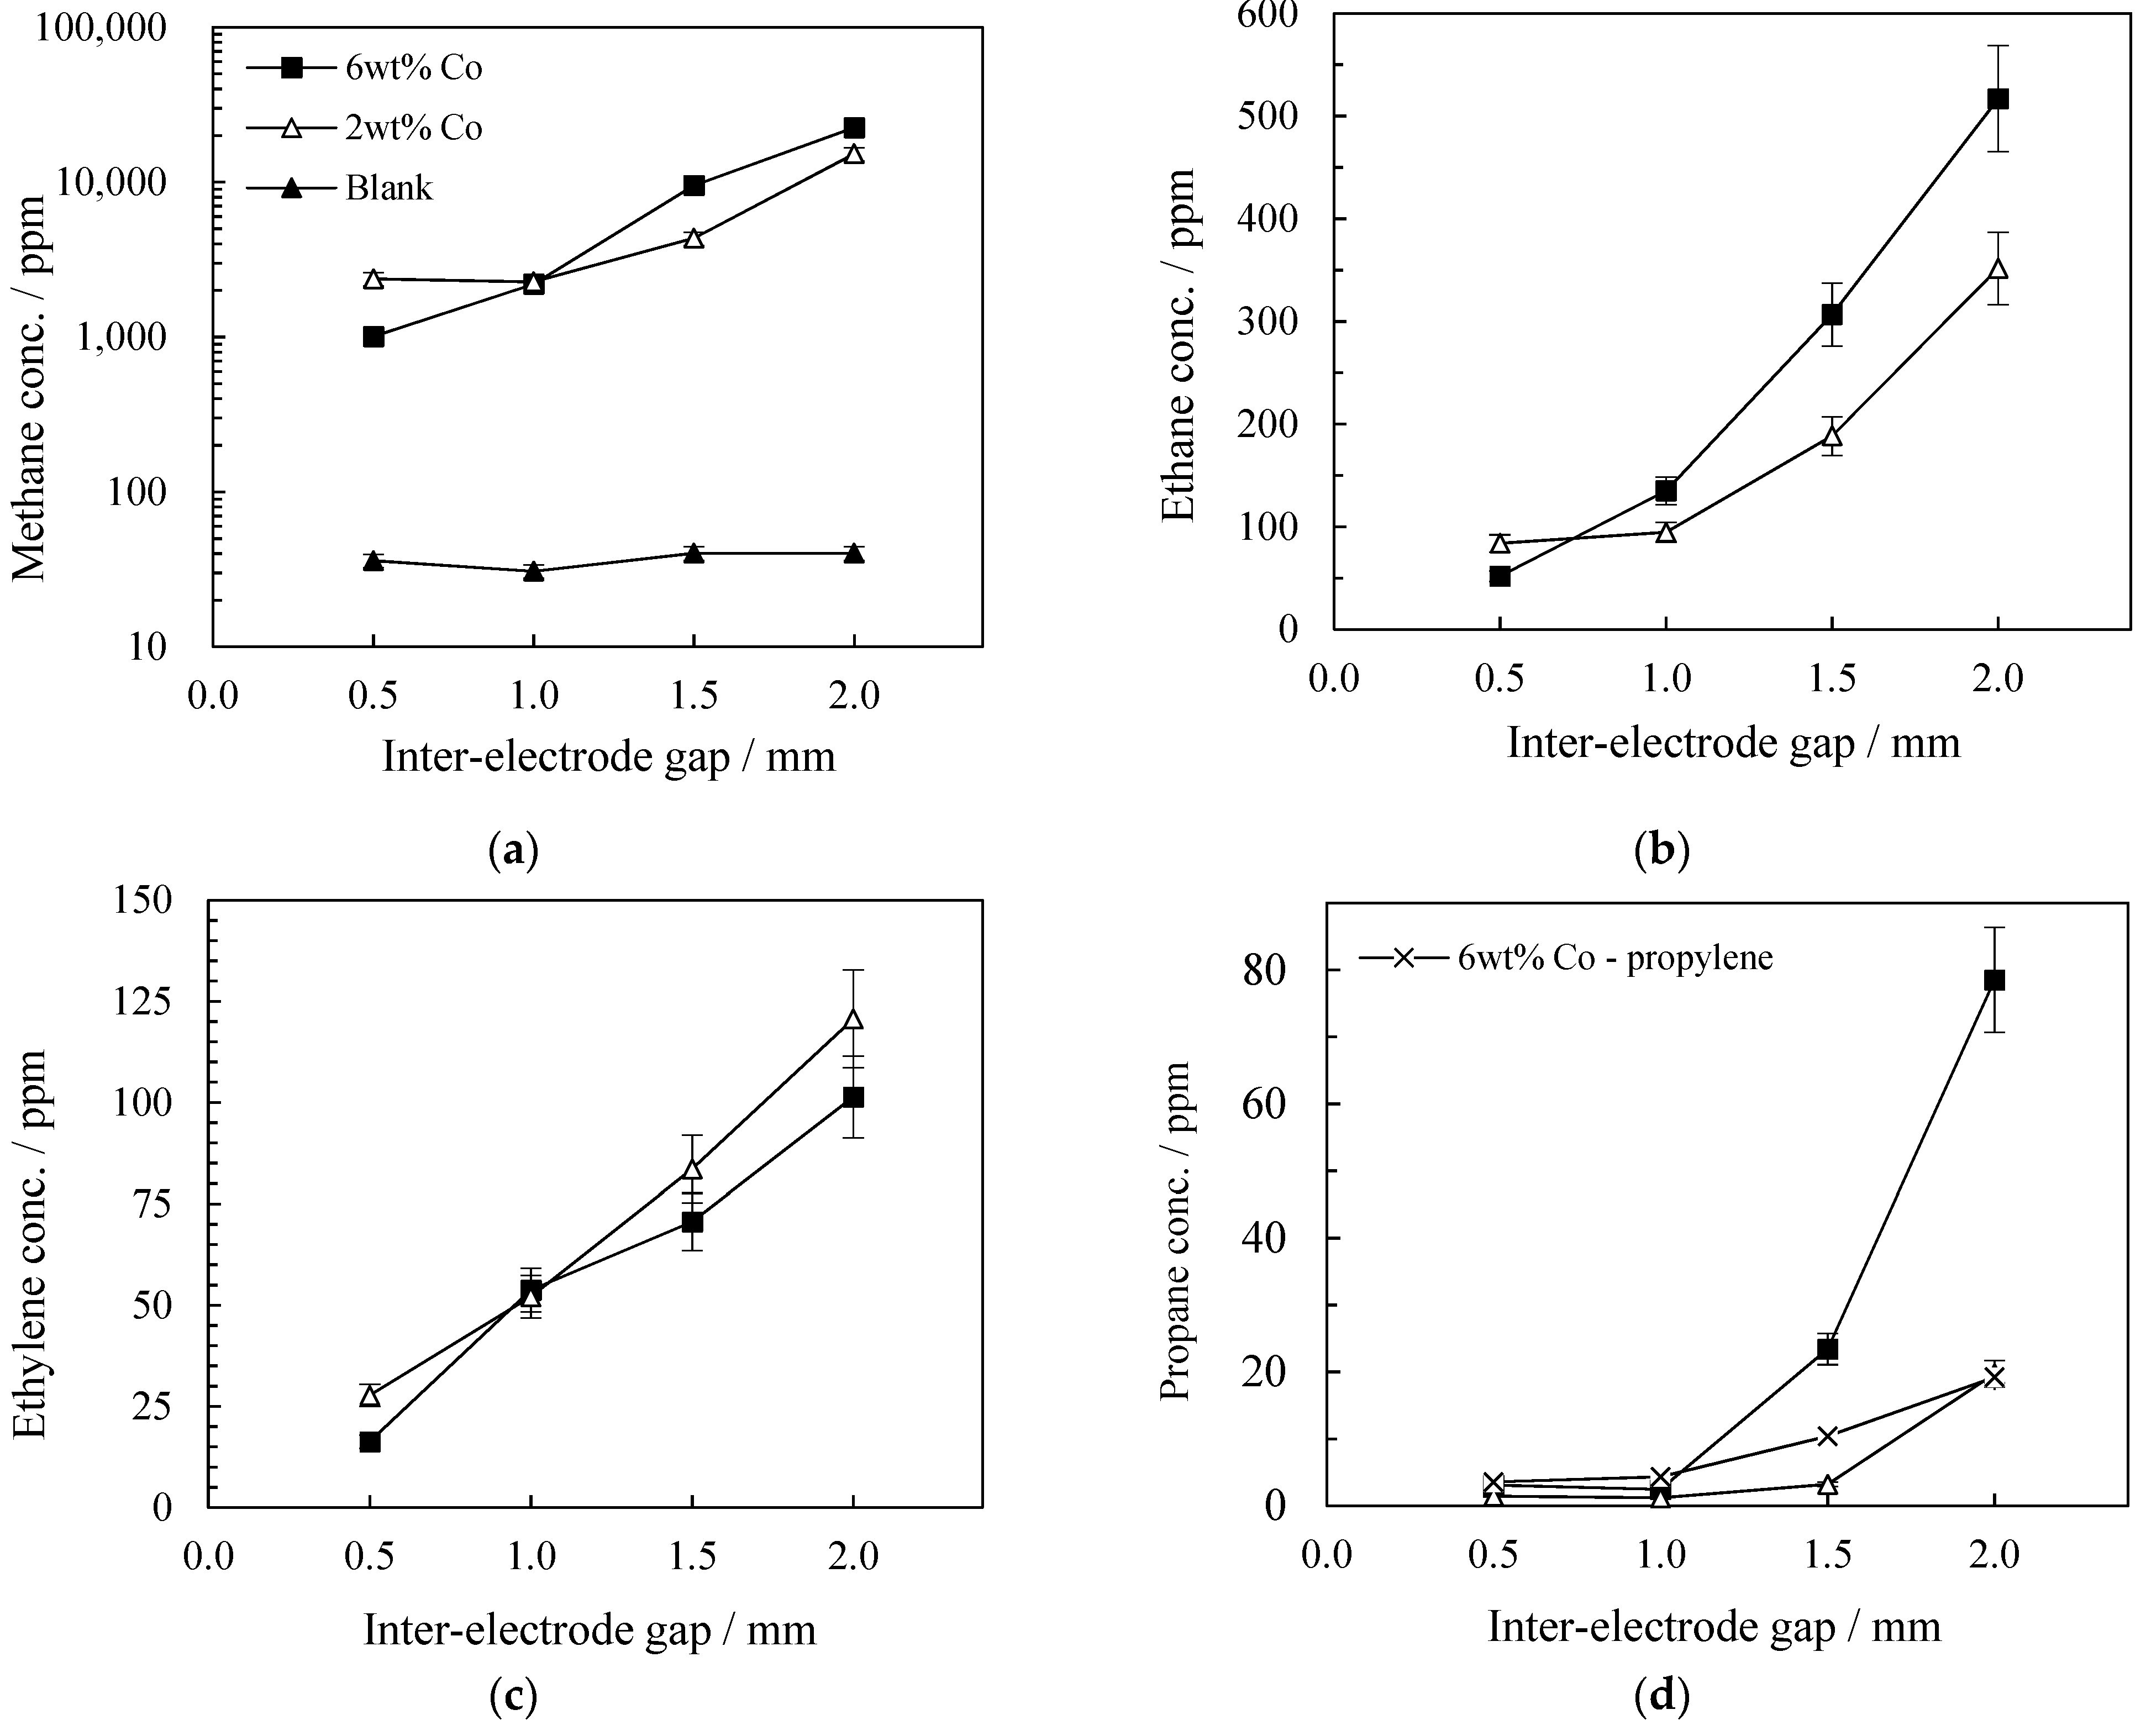
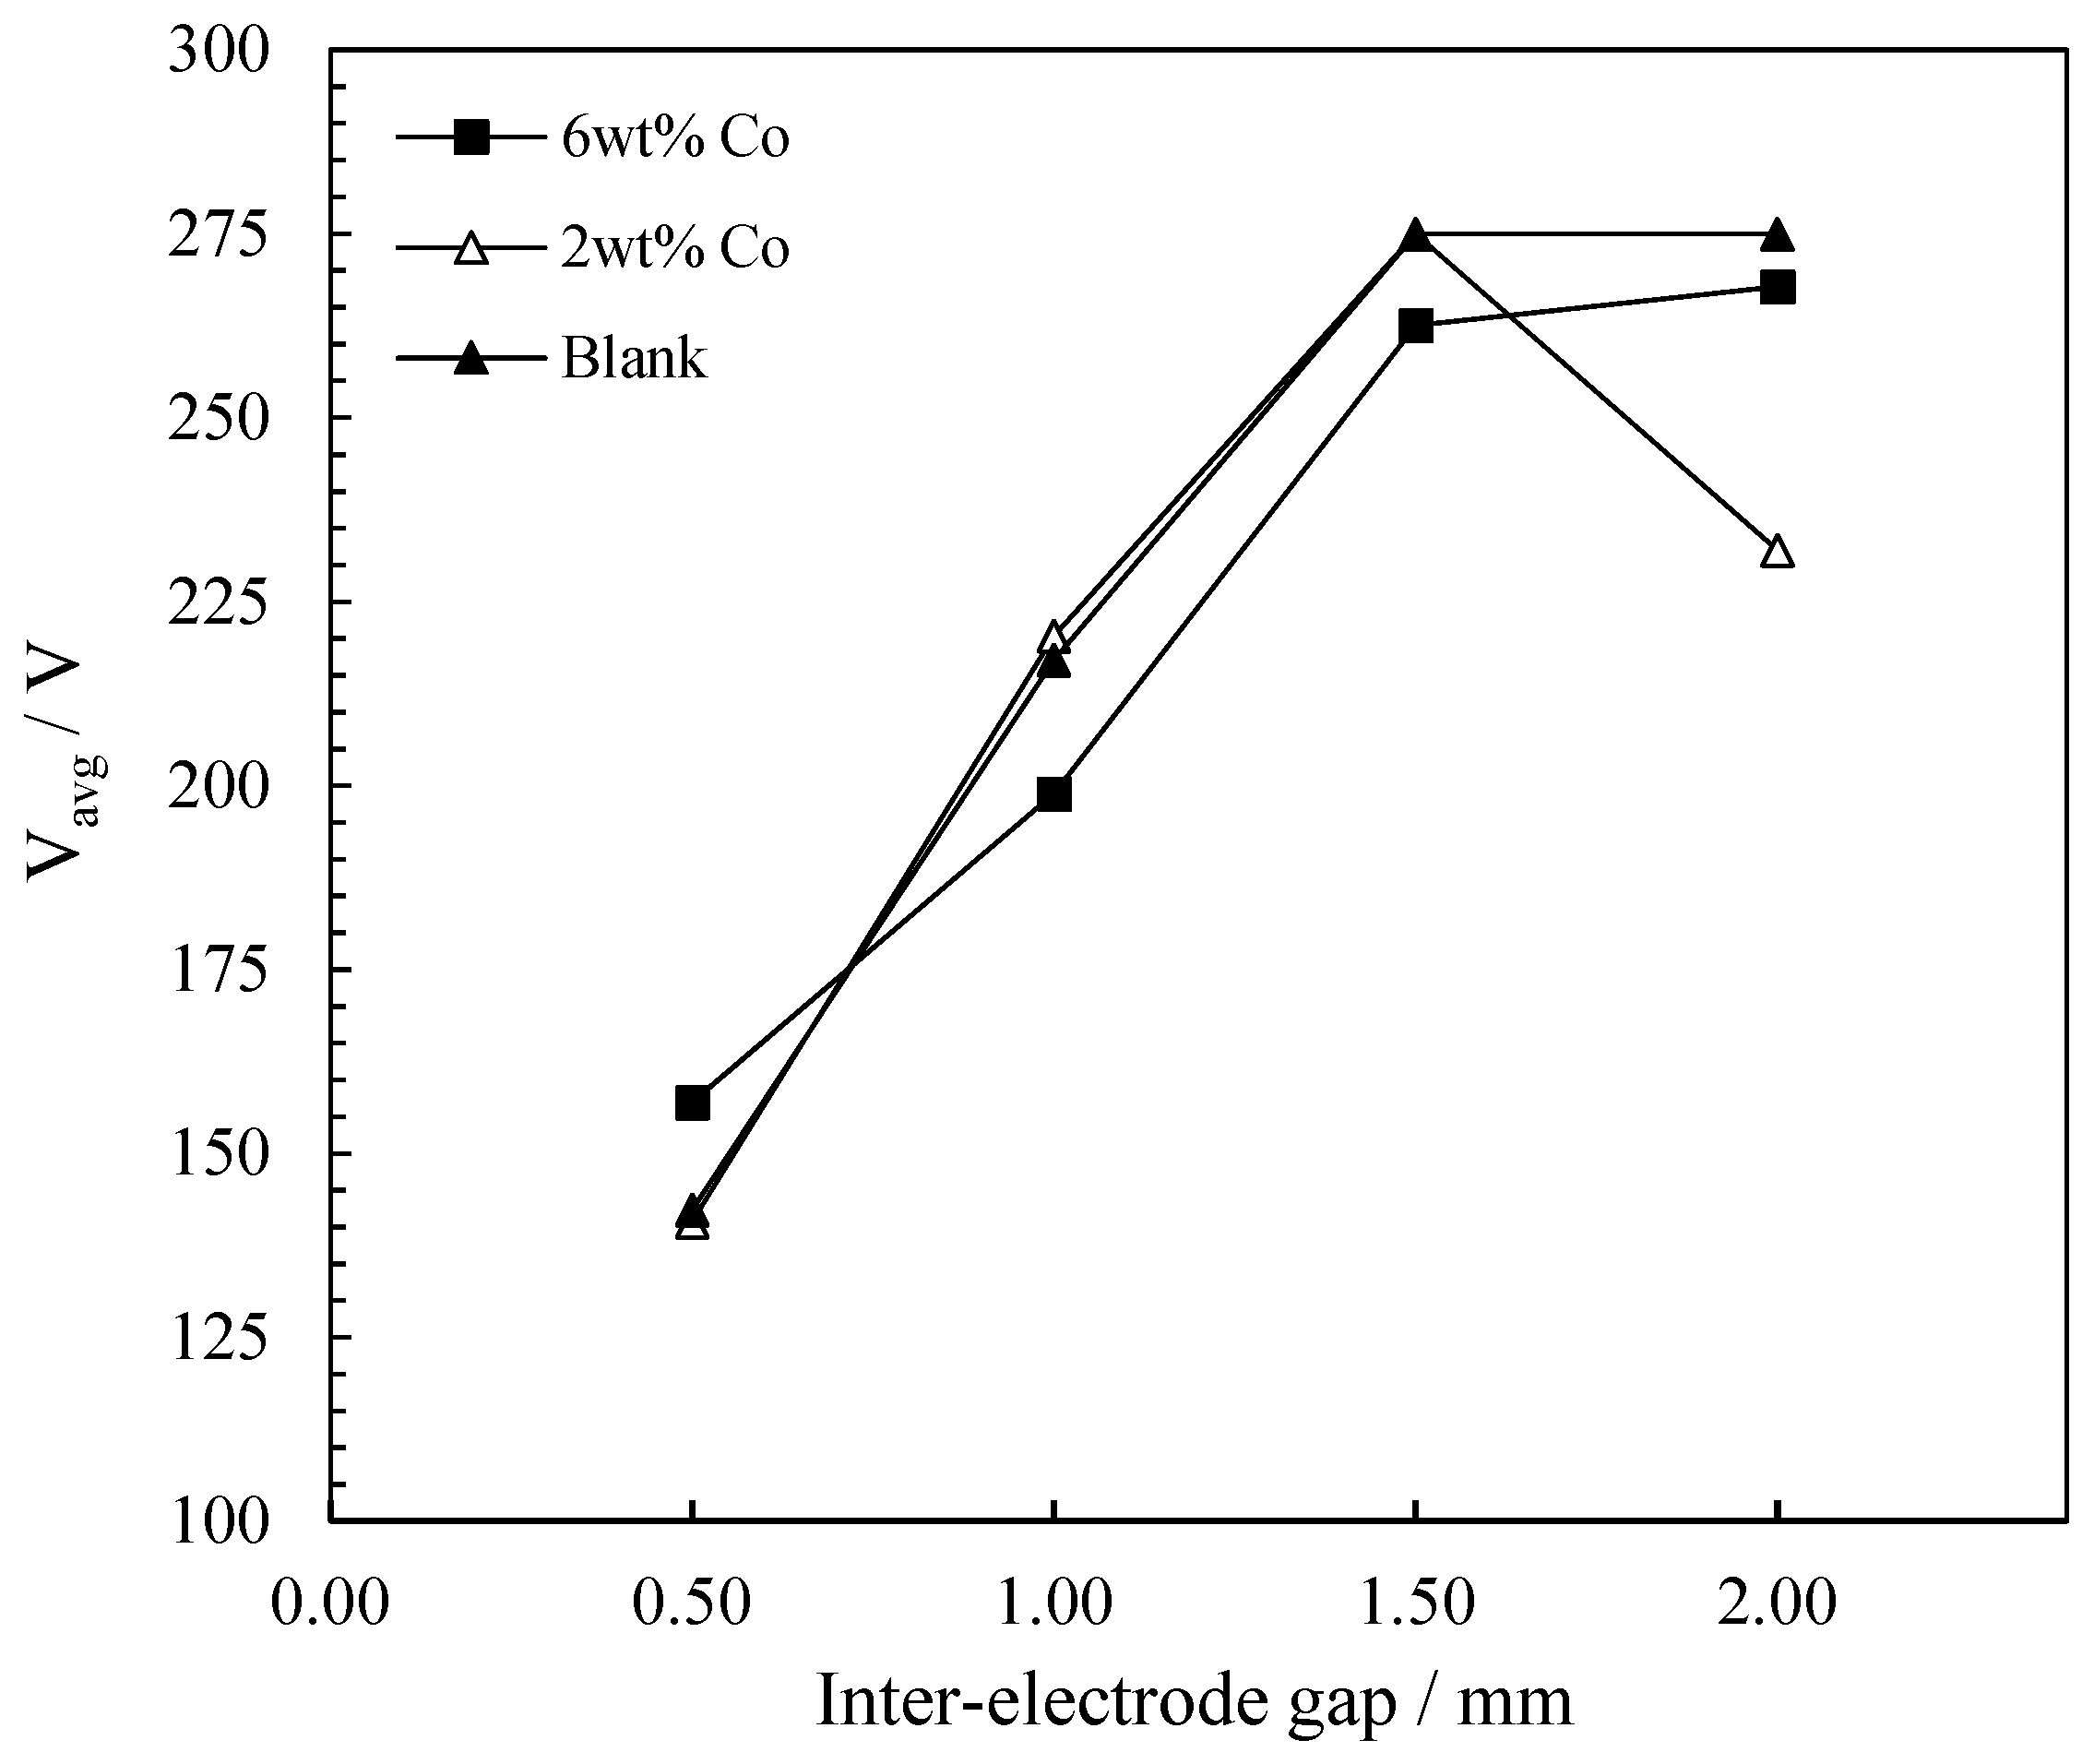
2.3. Inter-Electrode Gap Variation Study
2.3.1. The Influence of Inter-Electrode Gap on FTS Products Yields
2.3.2. The Influence of Inter-Electrode Gap on Energy Consumption
2.4. Catalyst Characterisation
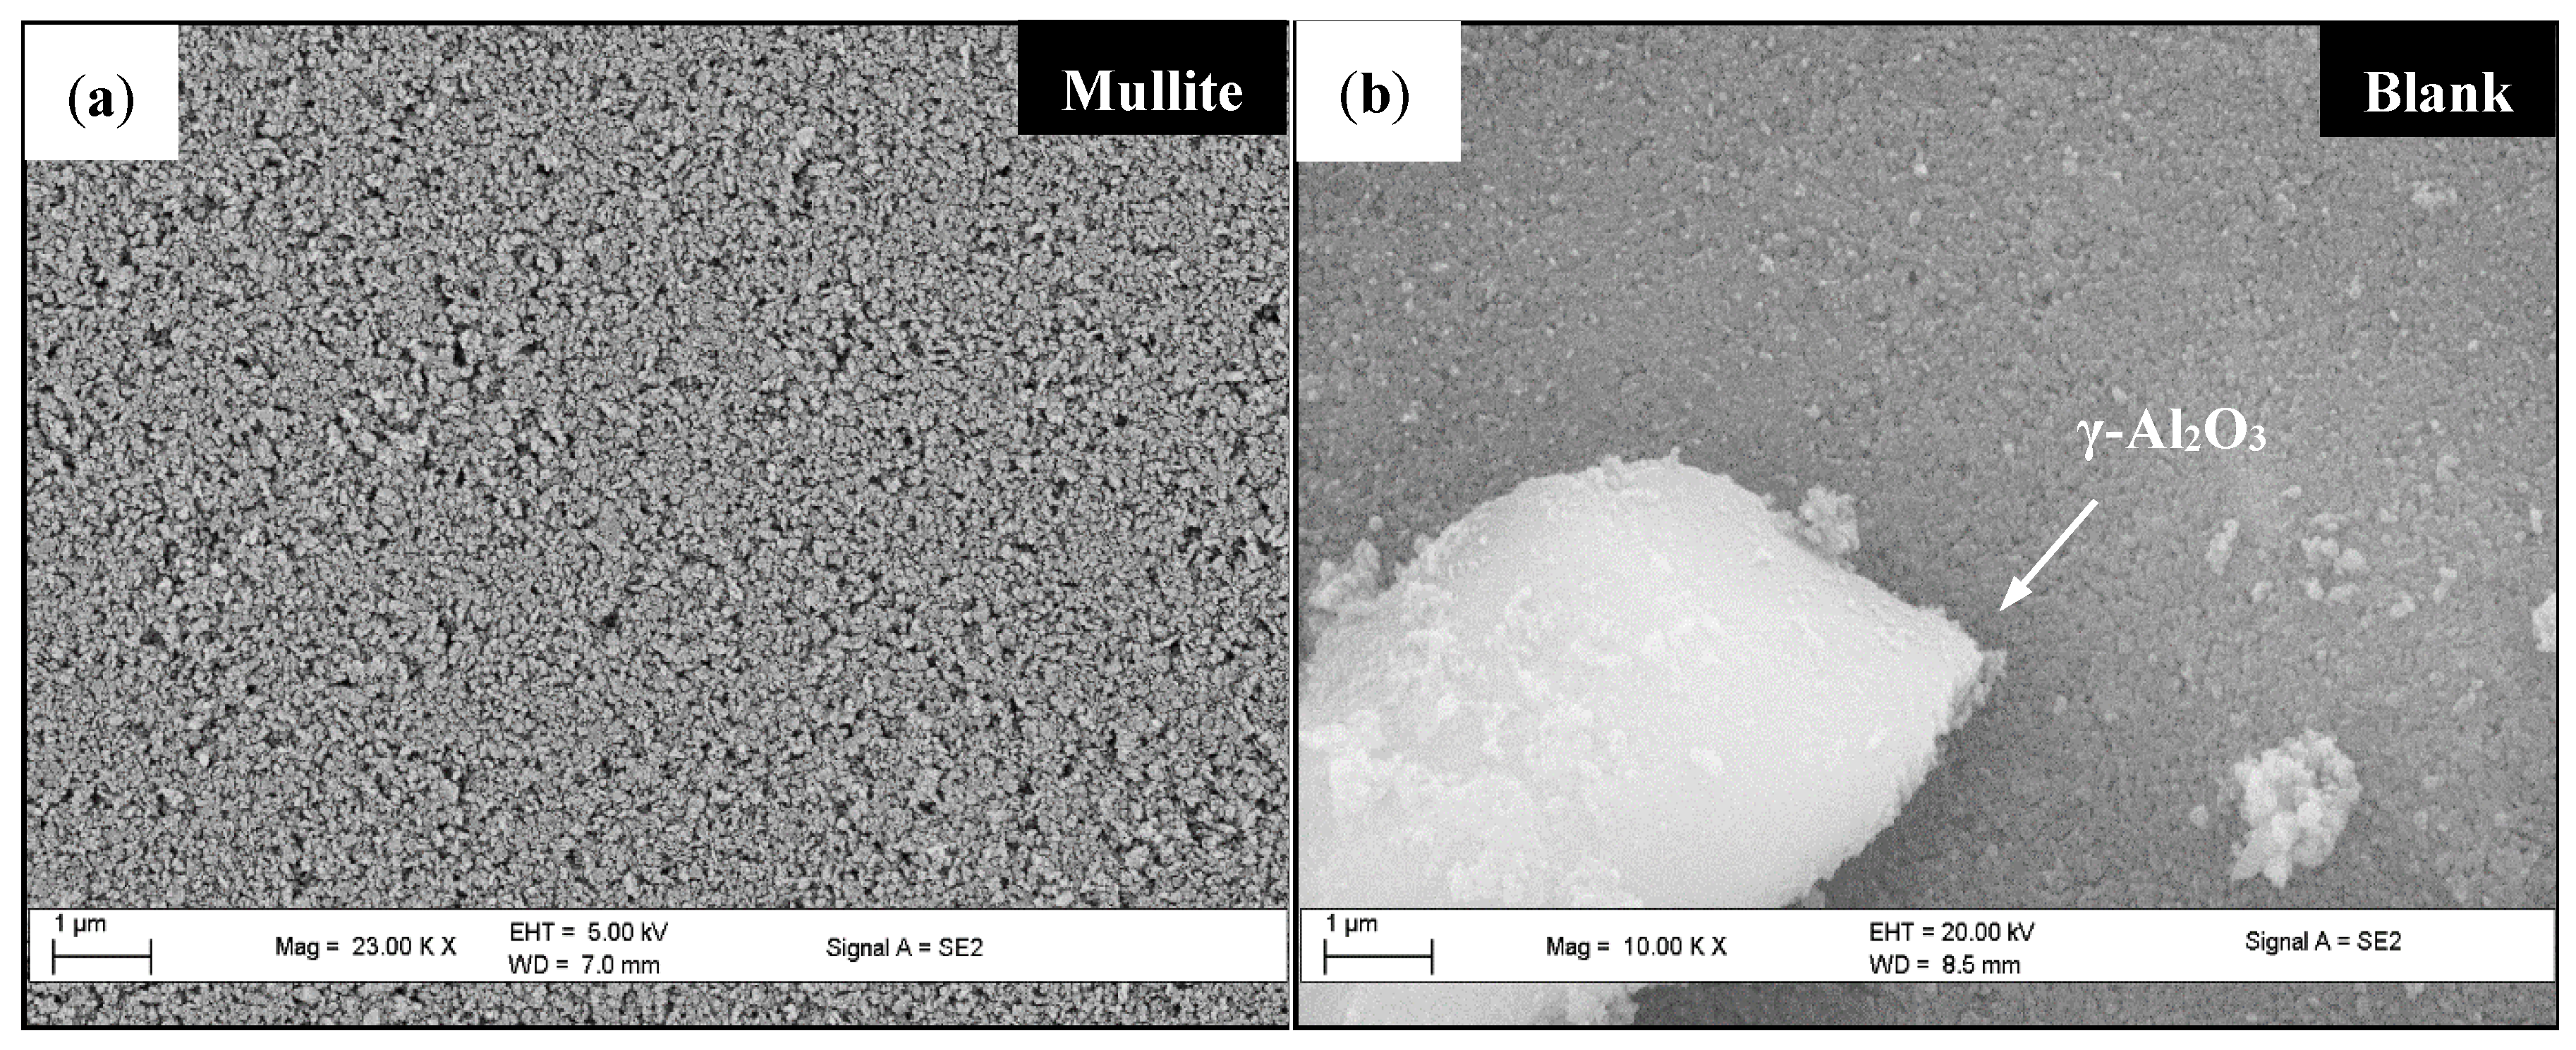
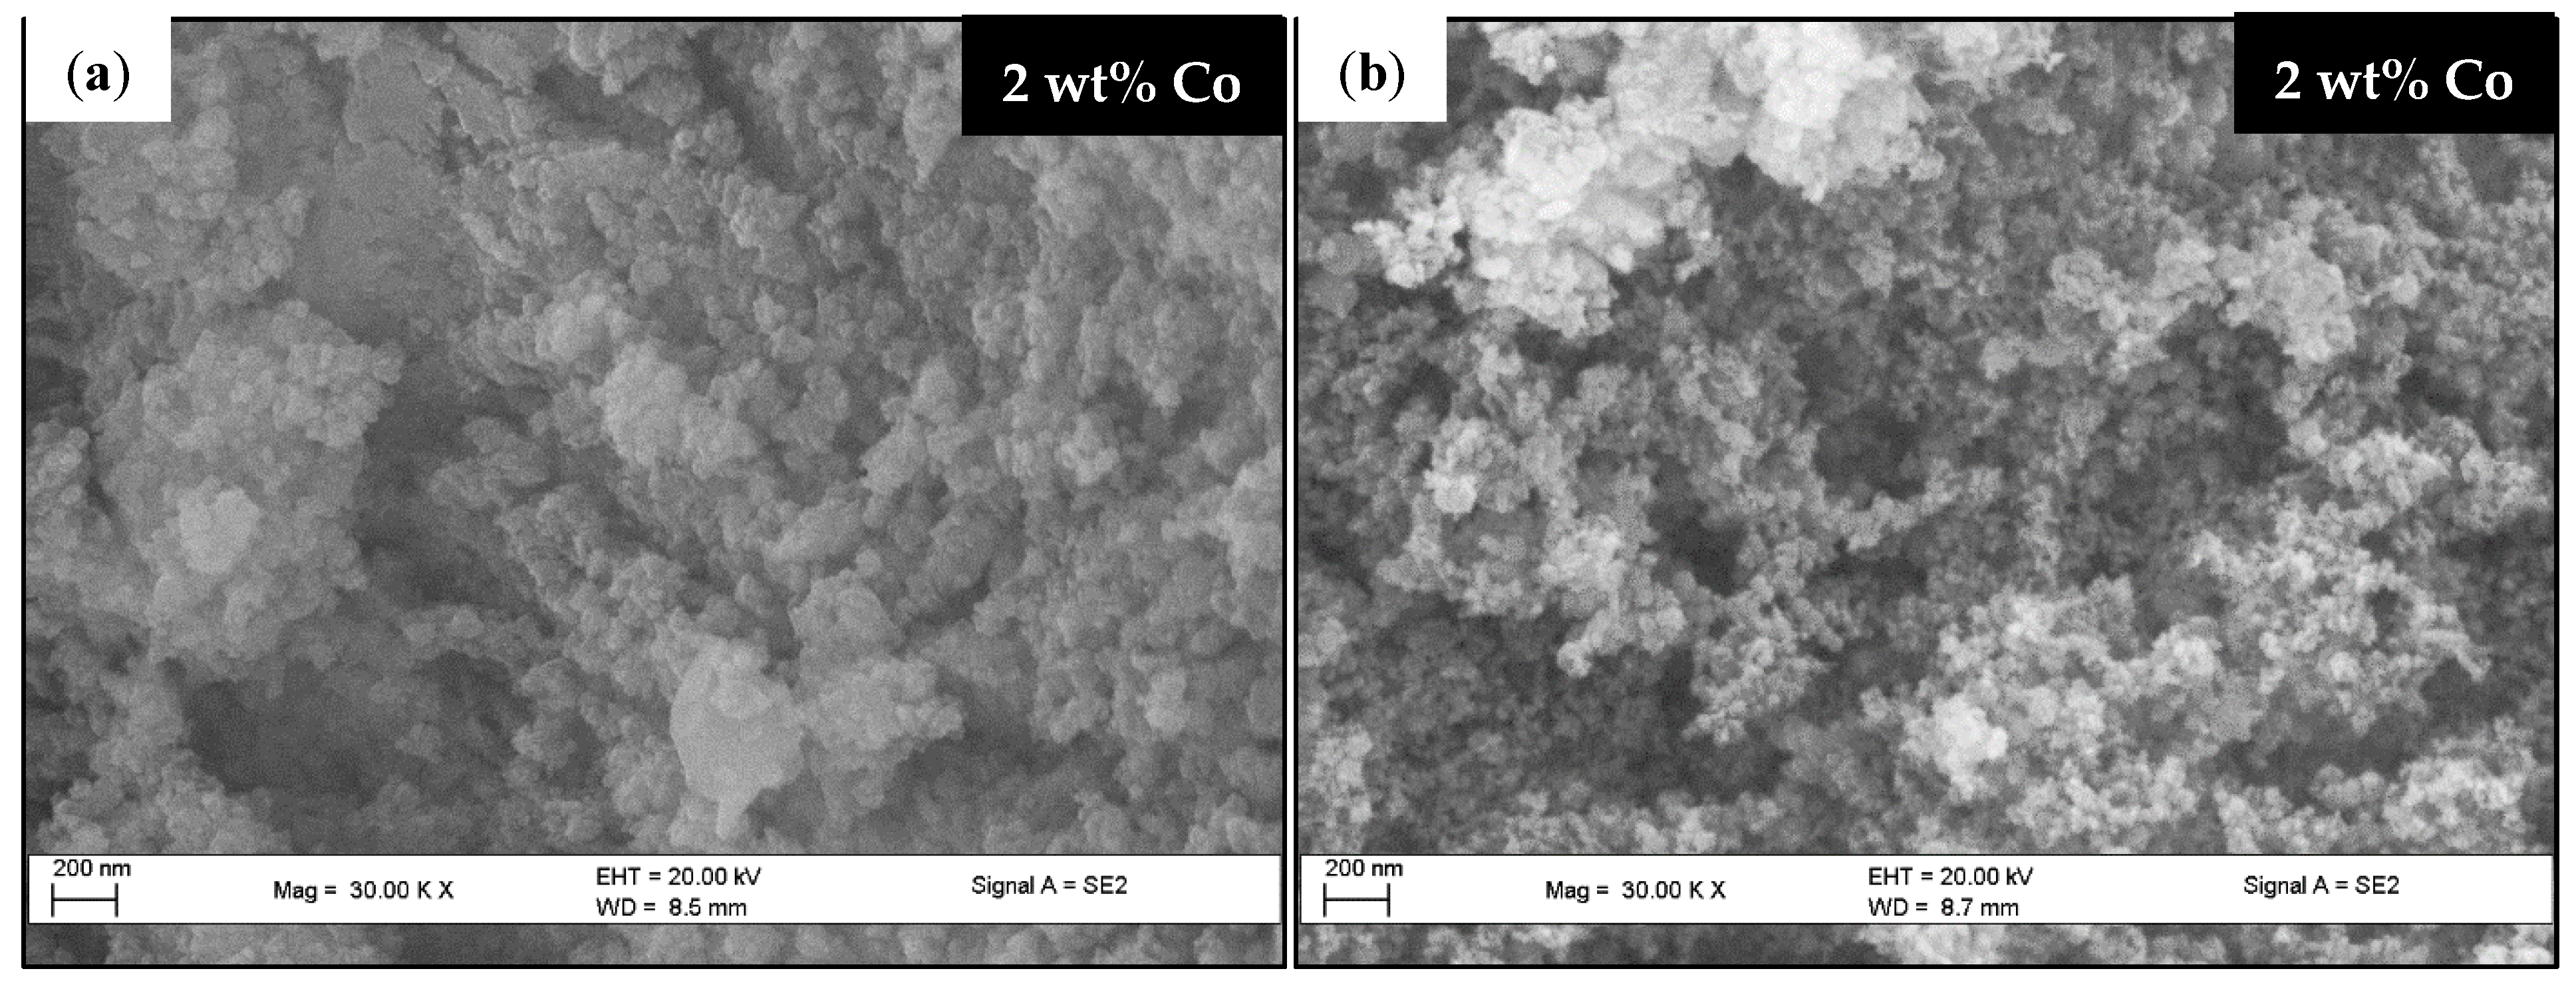
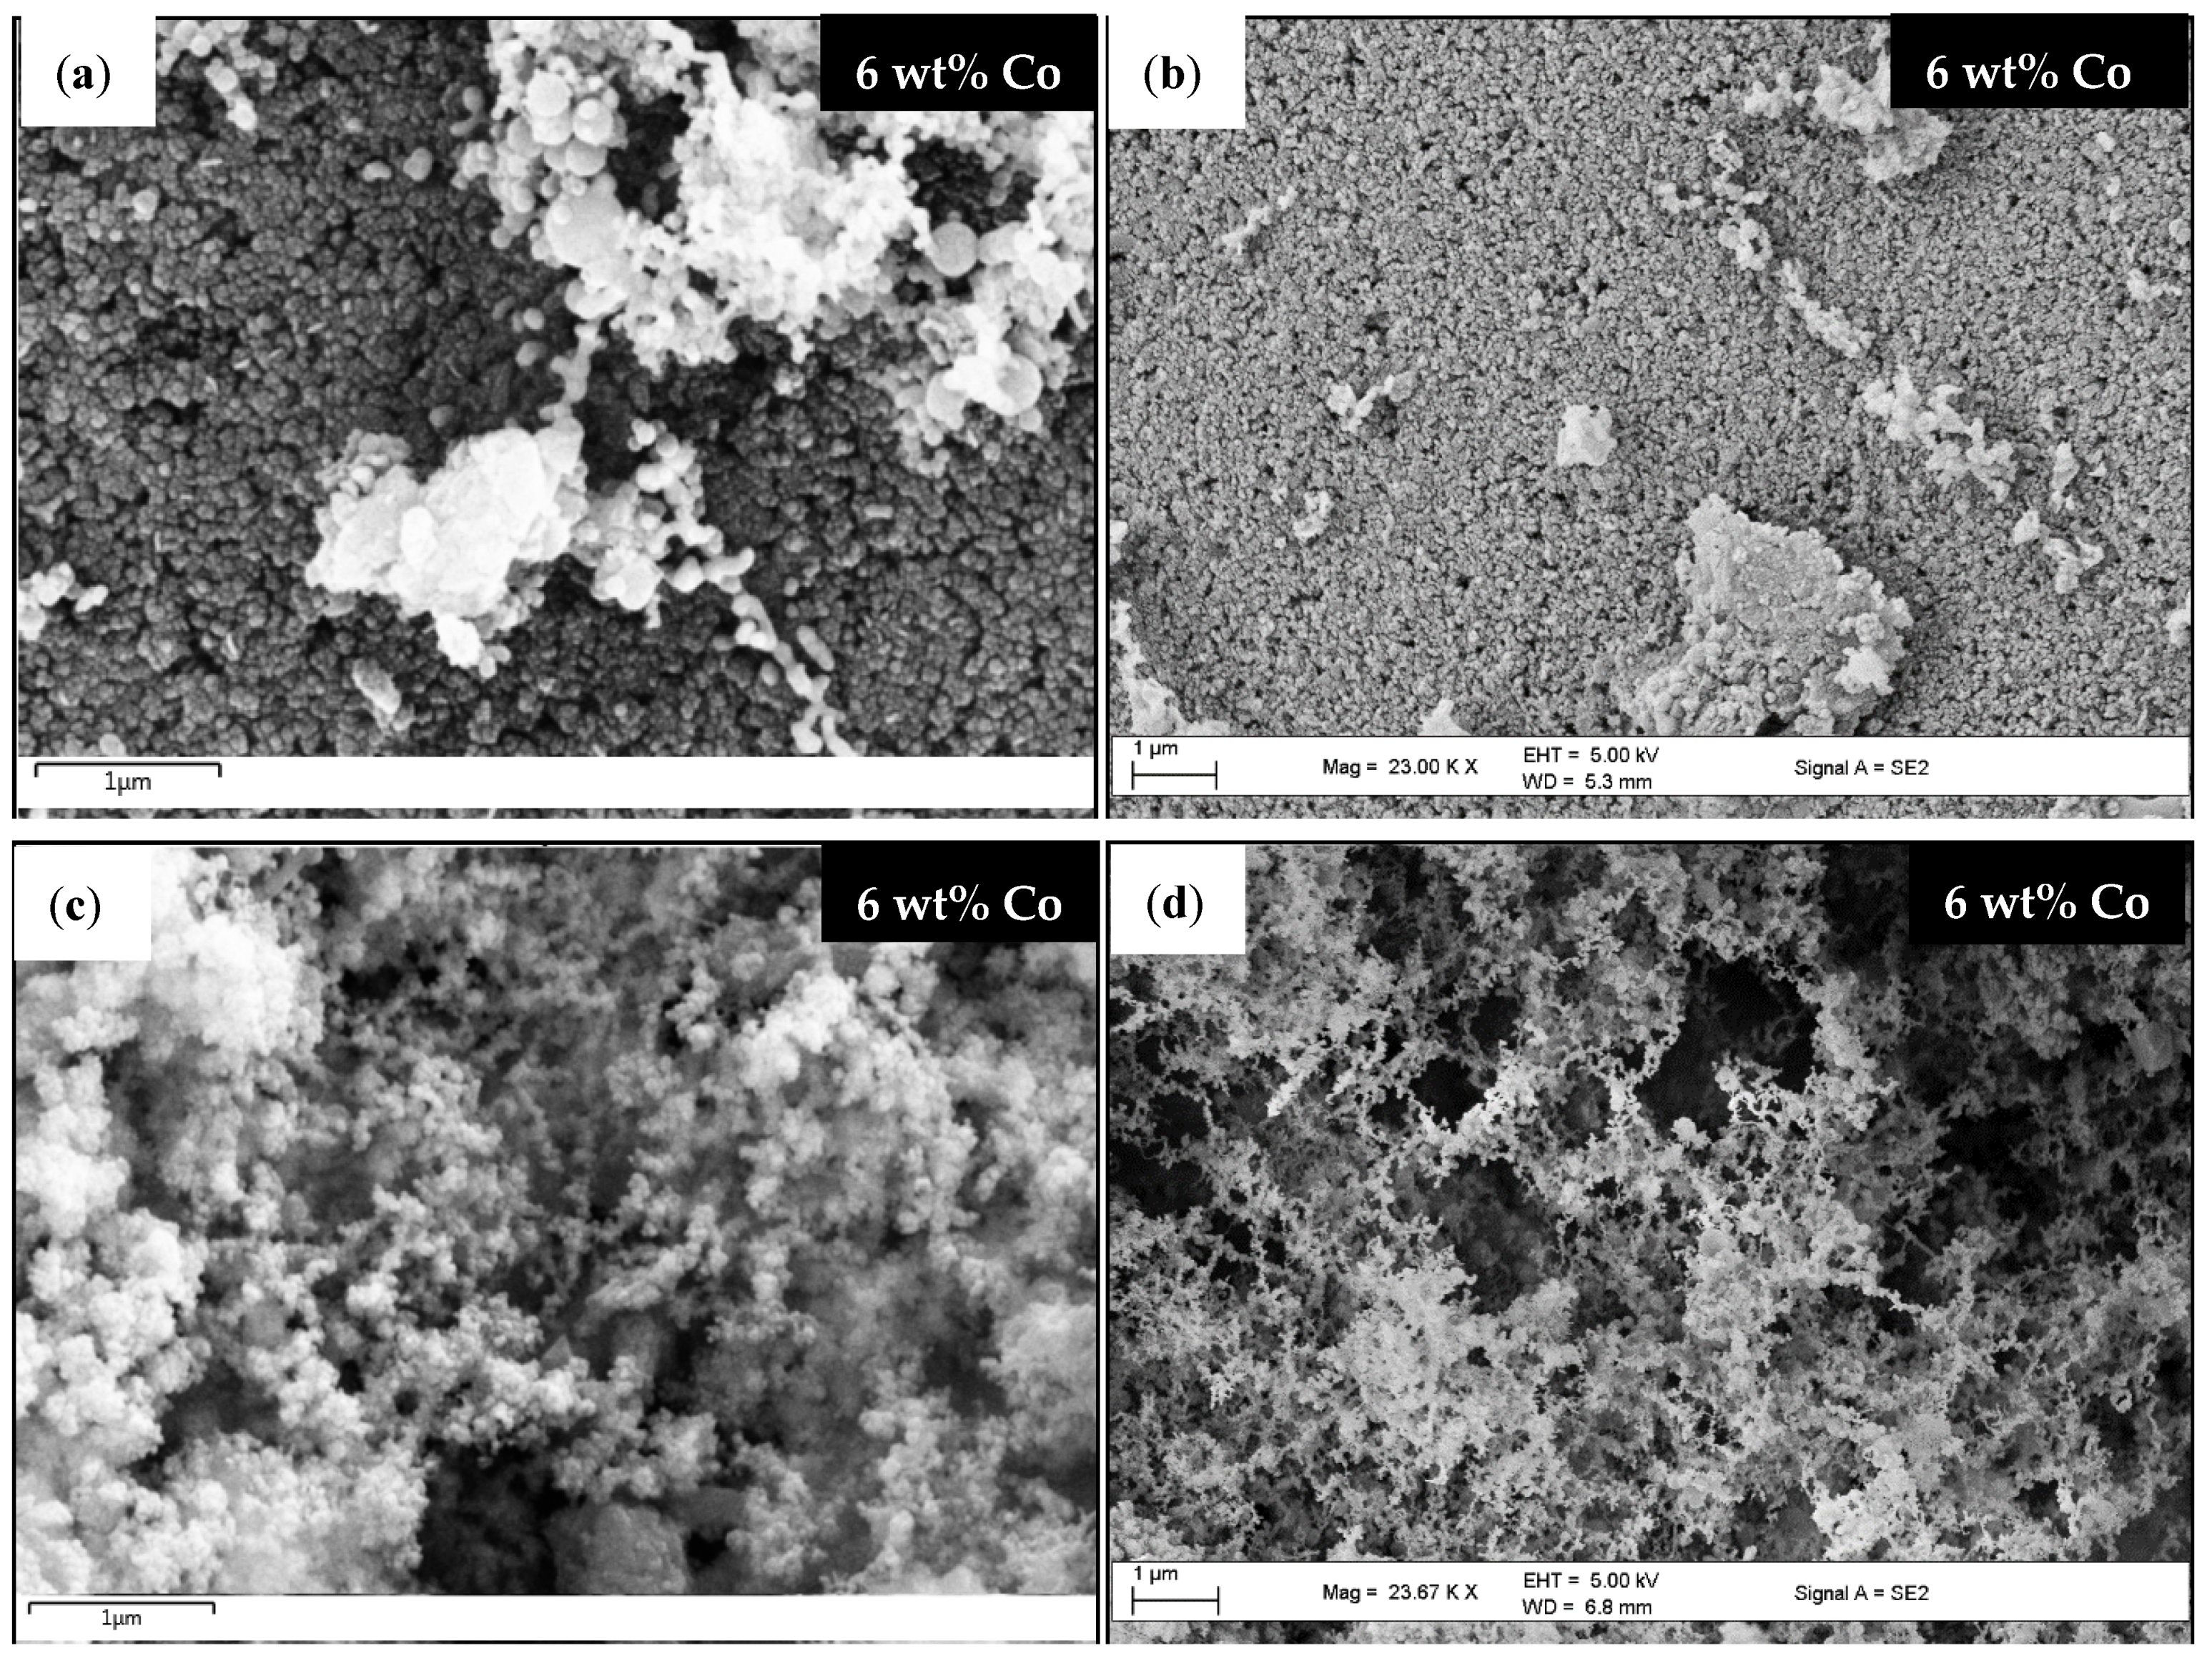
2.4.1. Scanning Electron Microscopy (SEM)
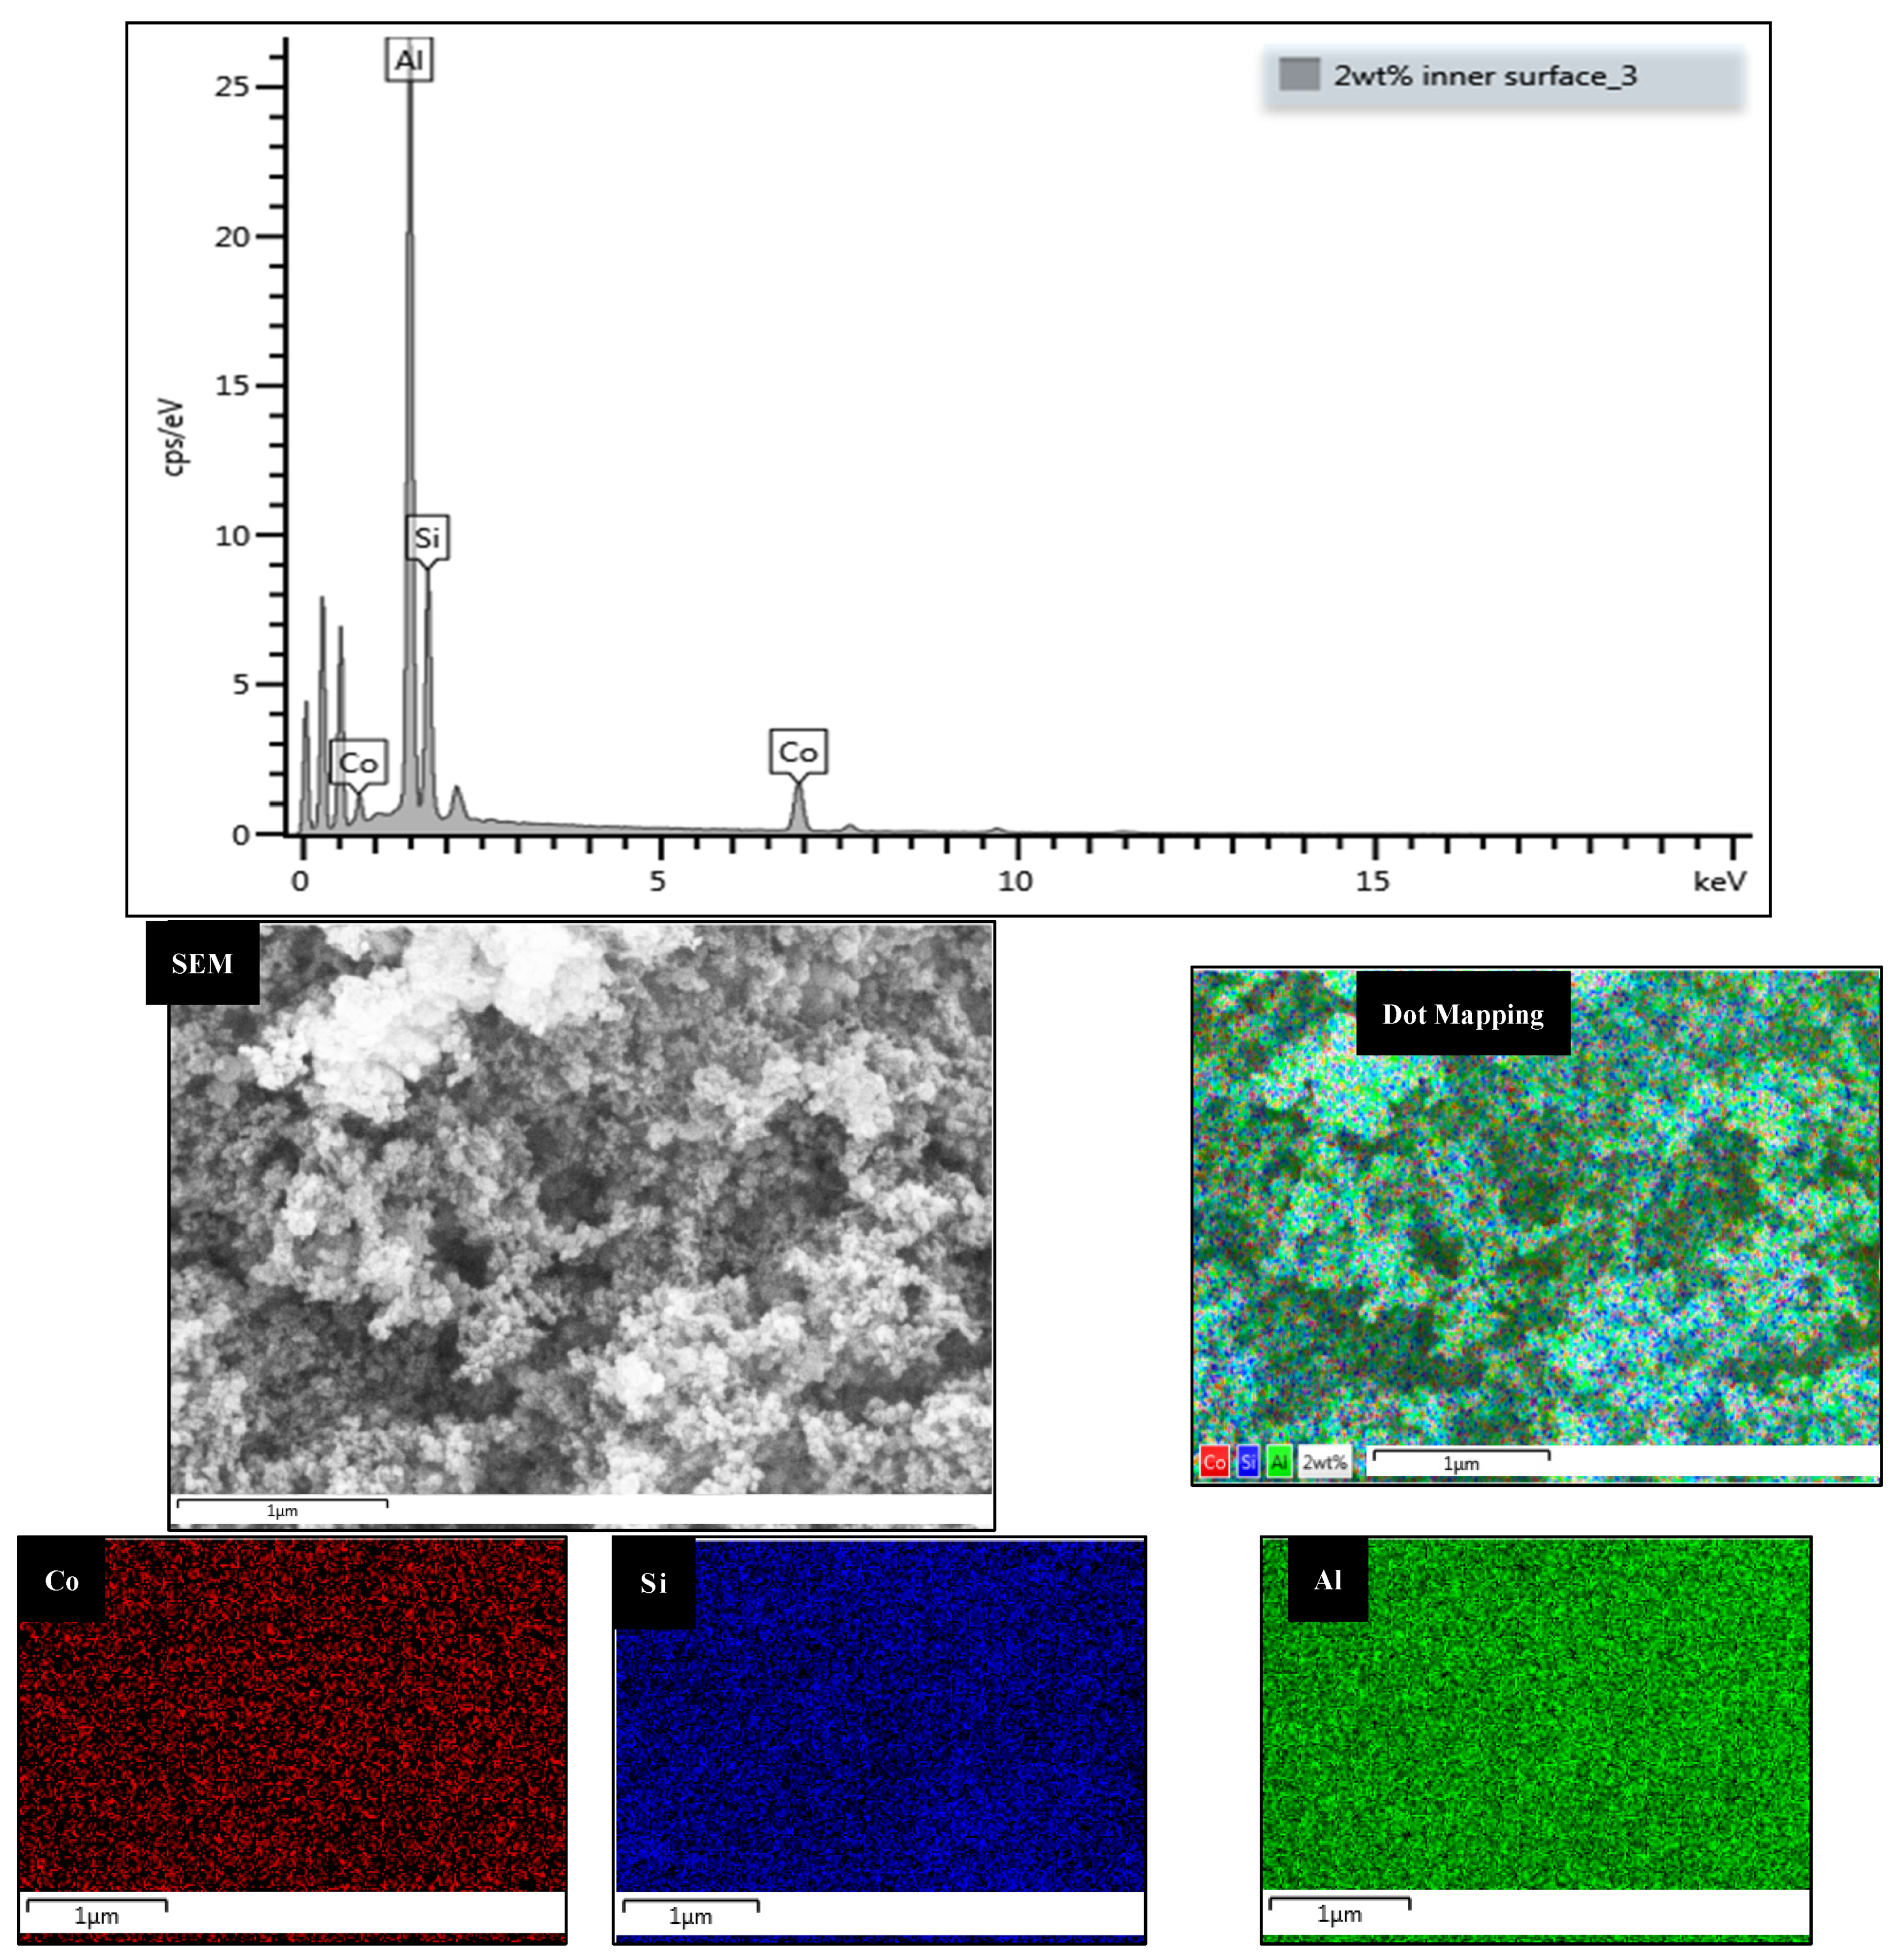
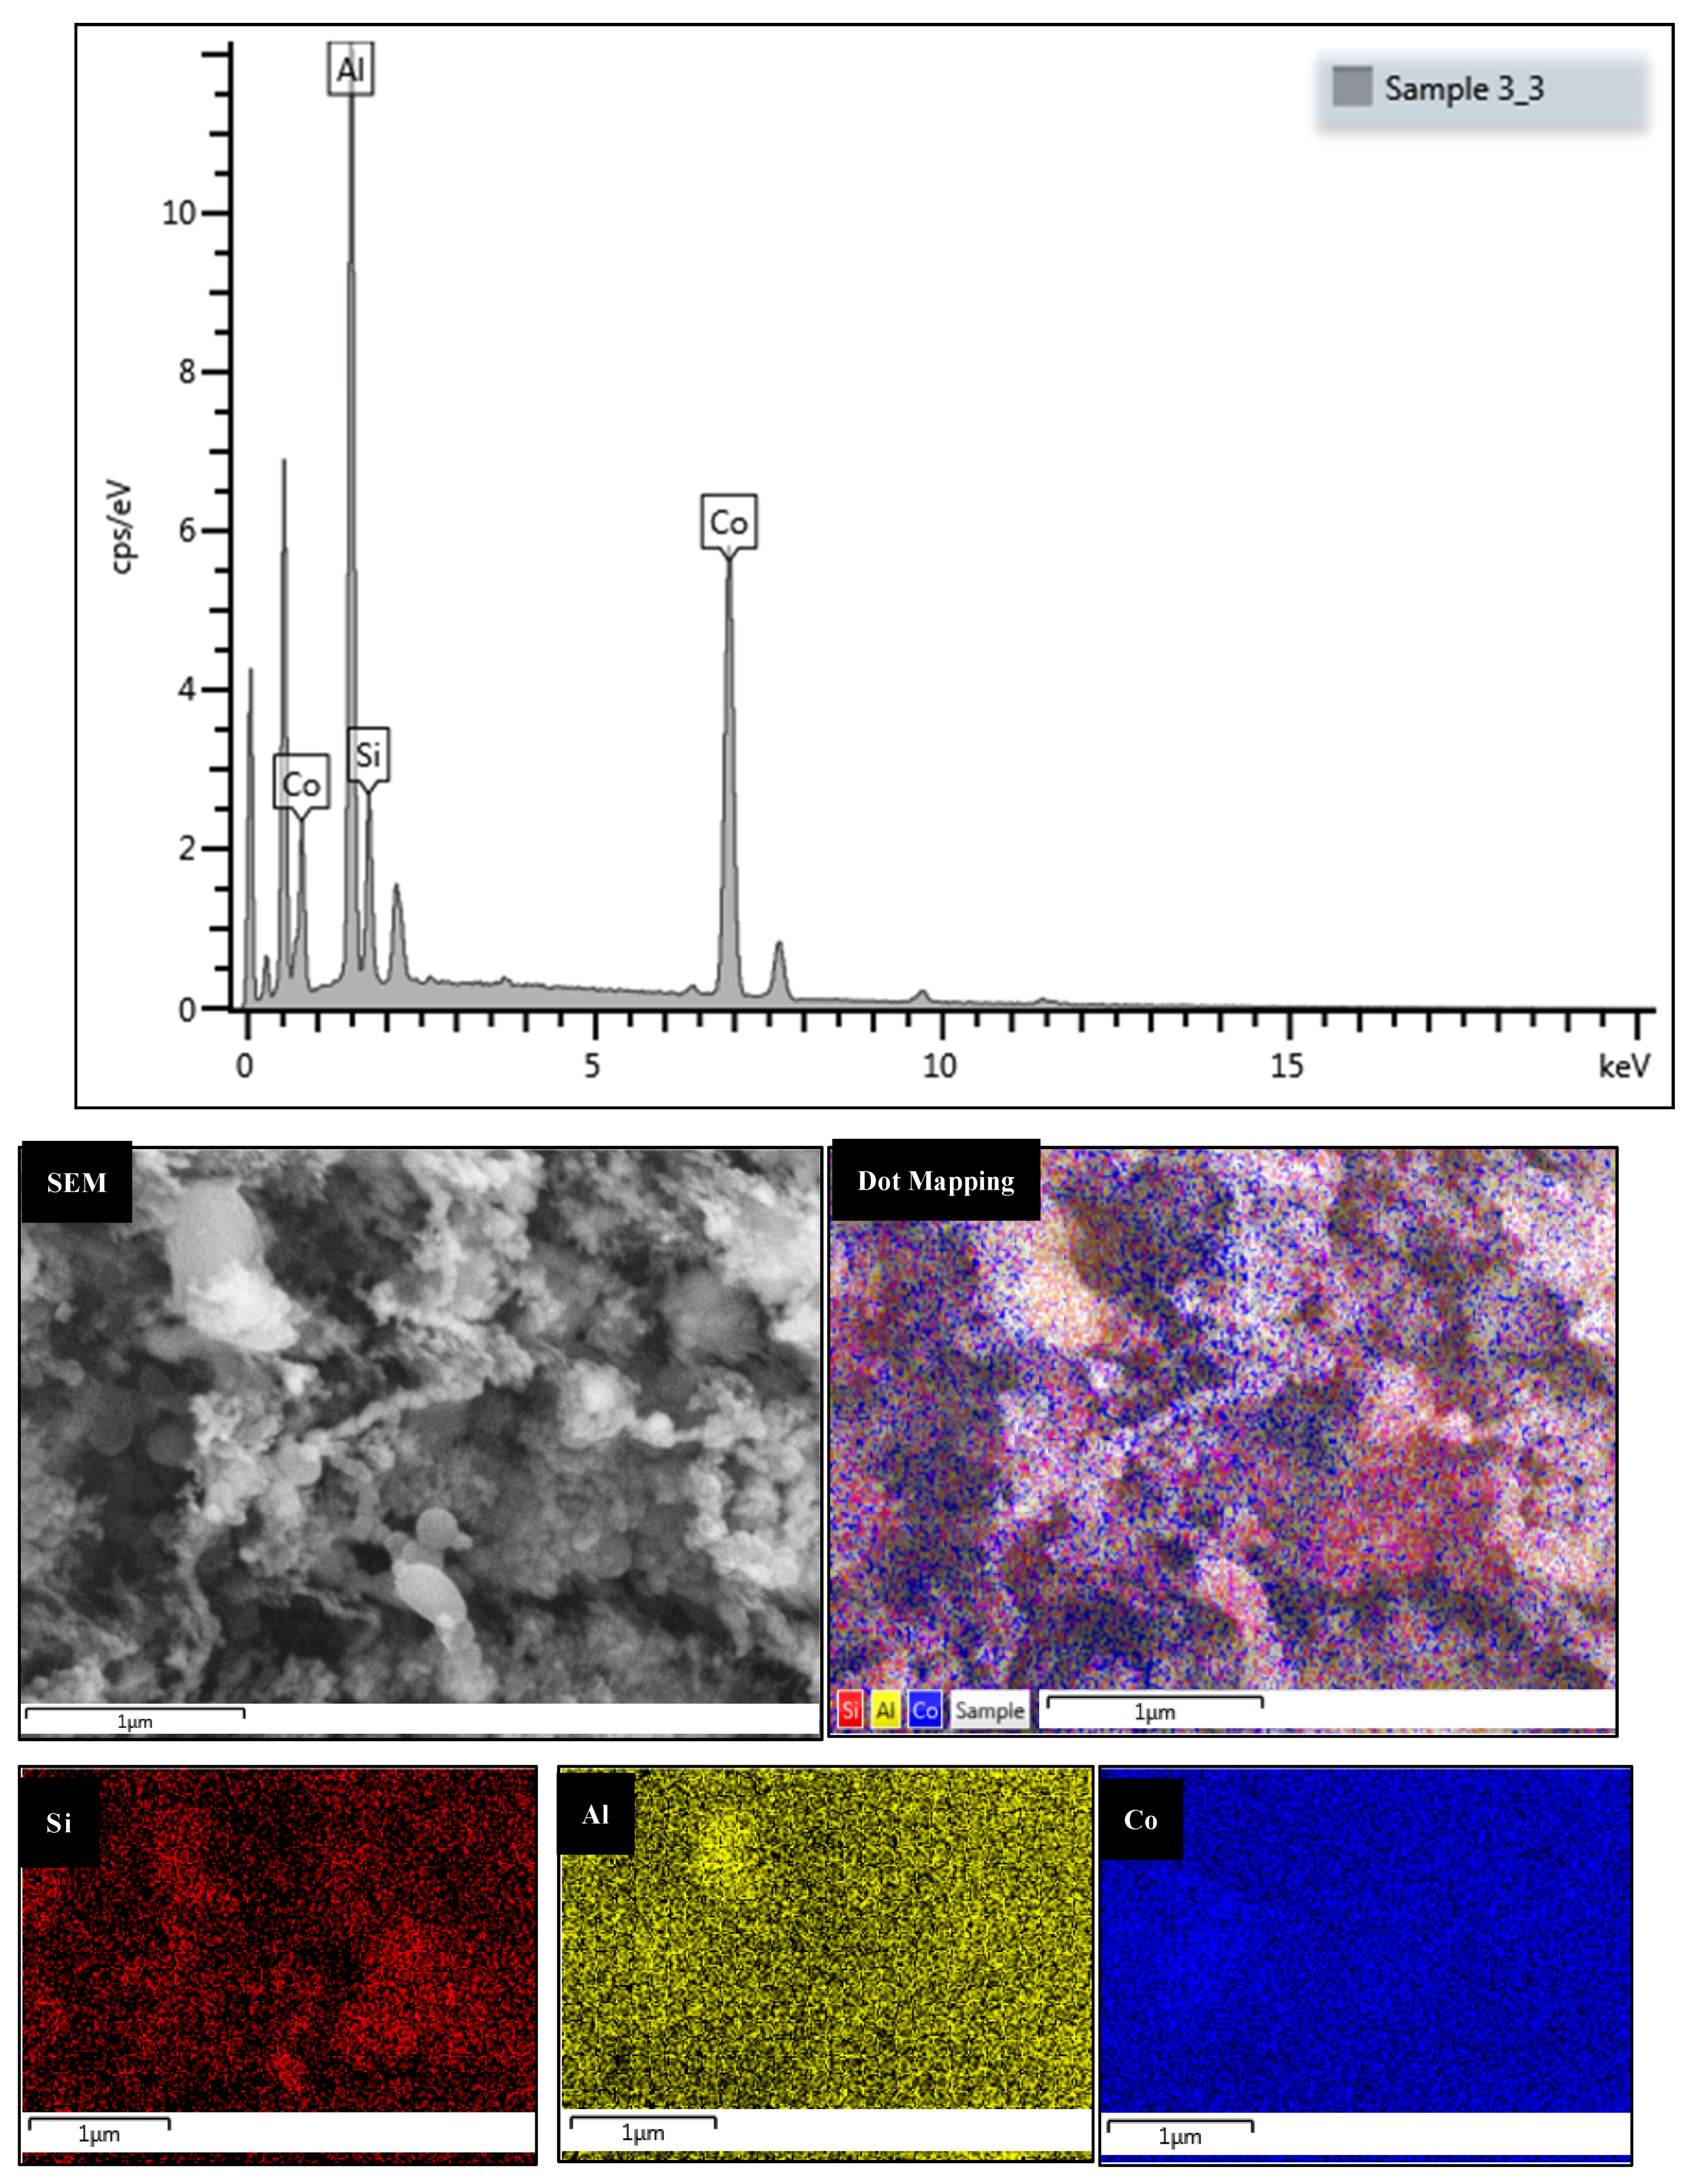
2.4.2. Energy Dispersive X-ray (EDX)
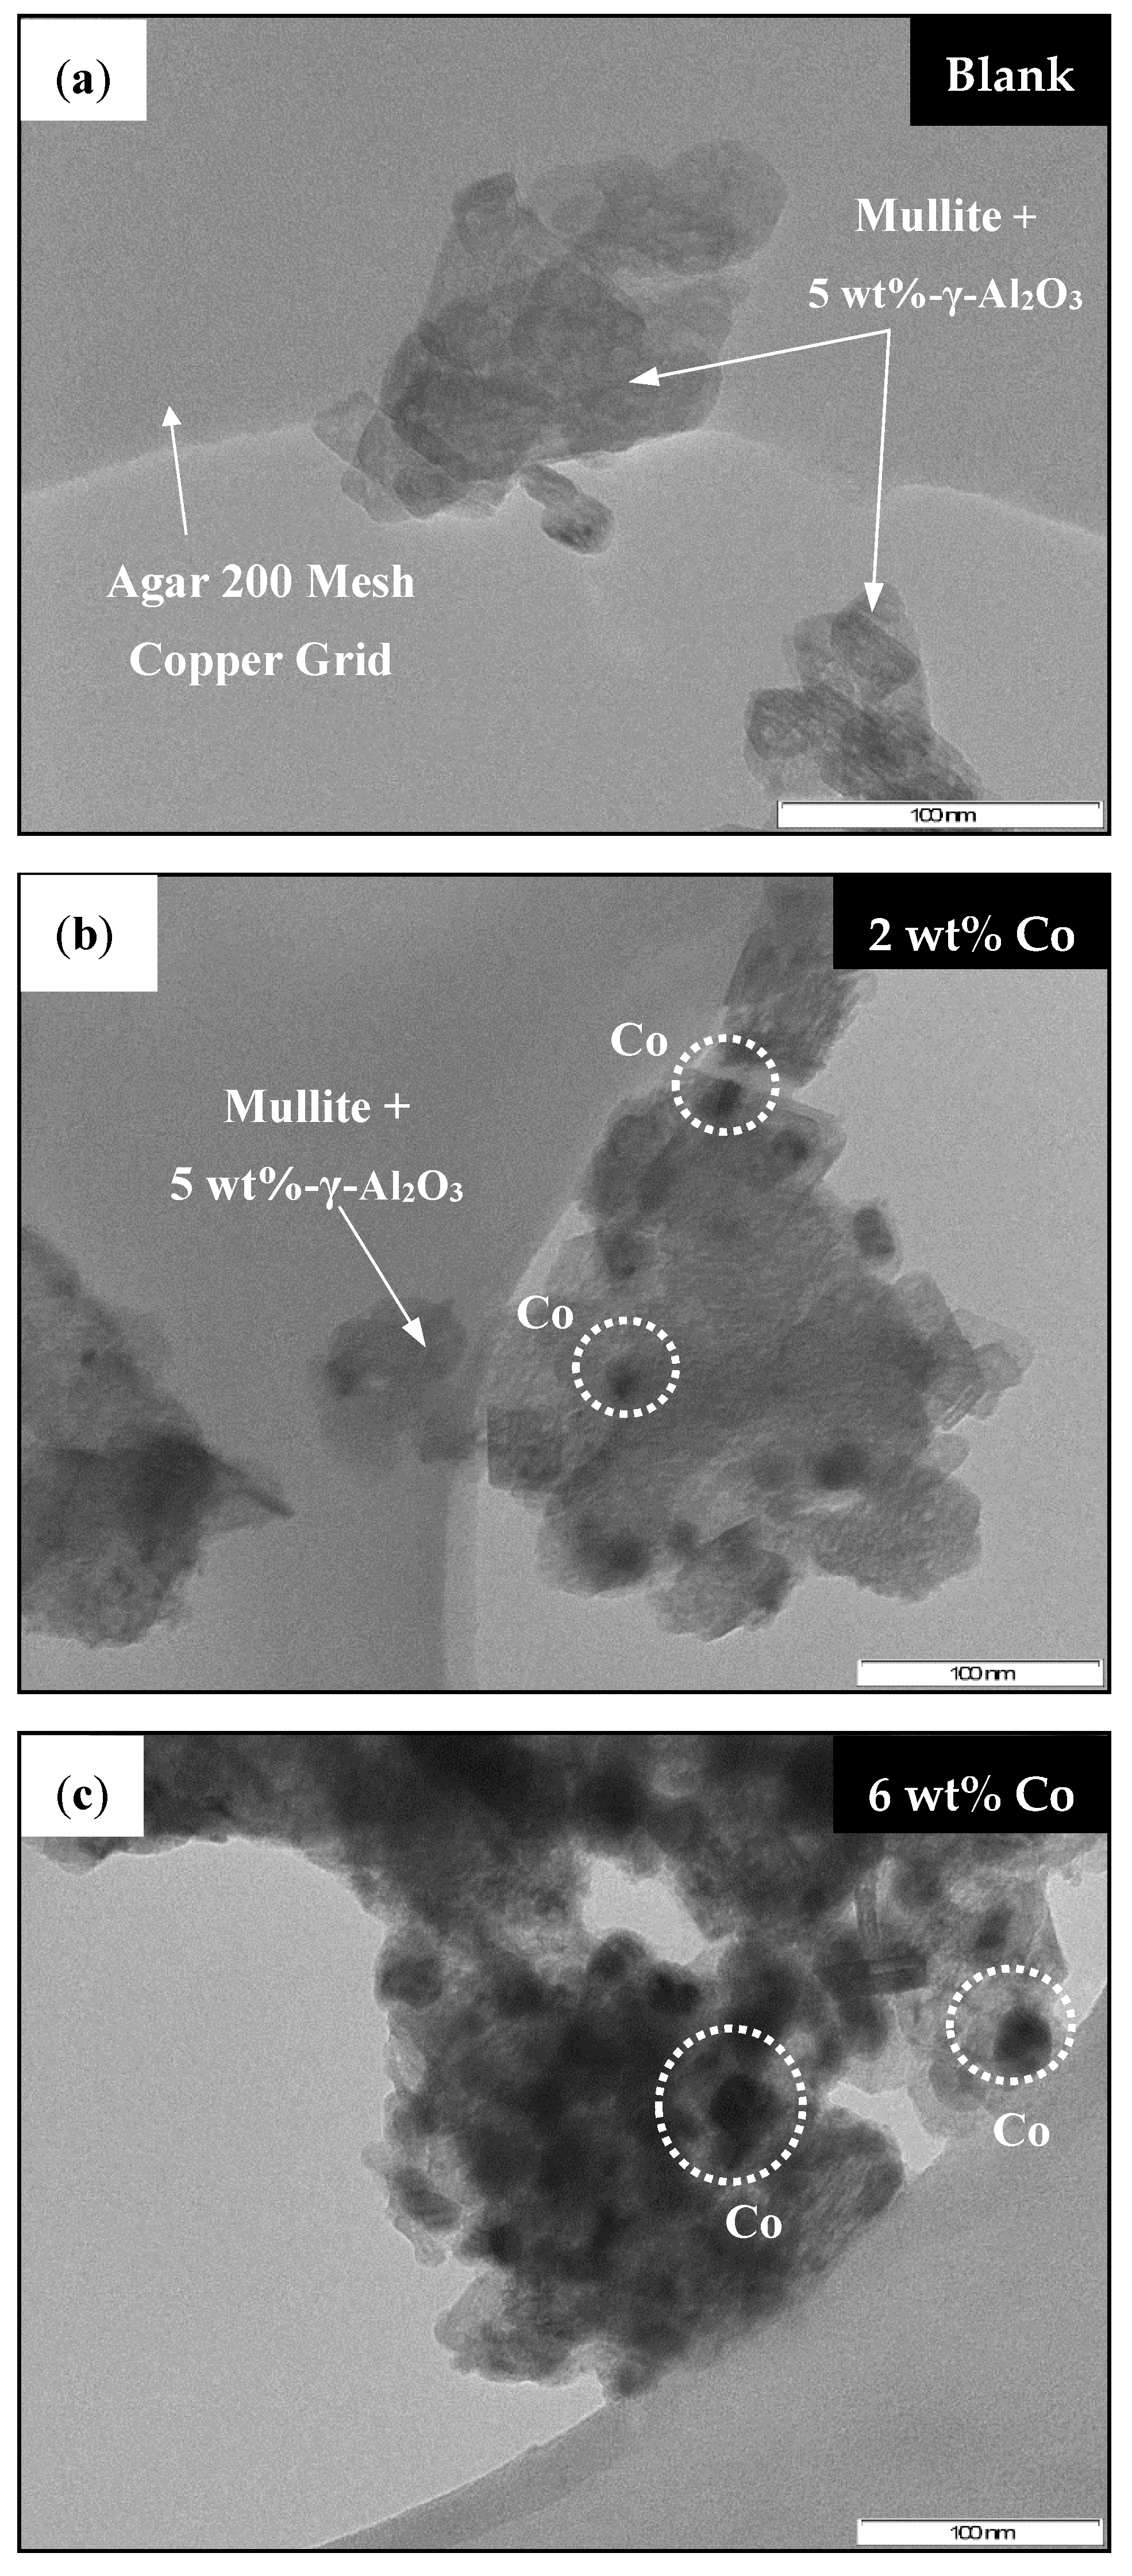
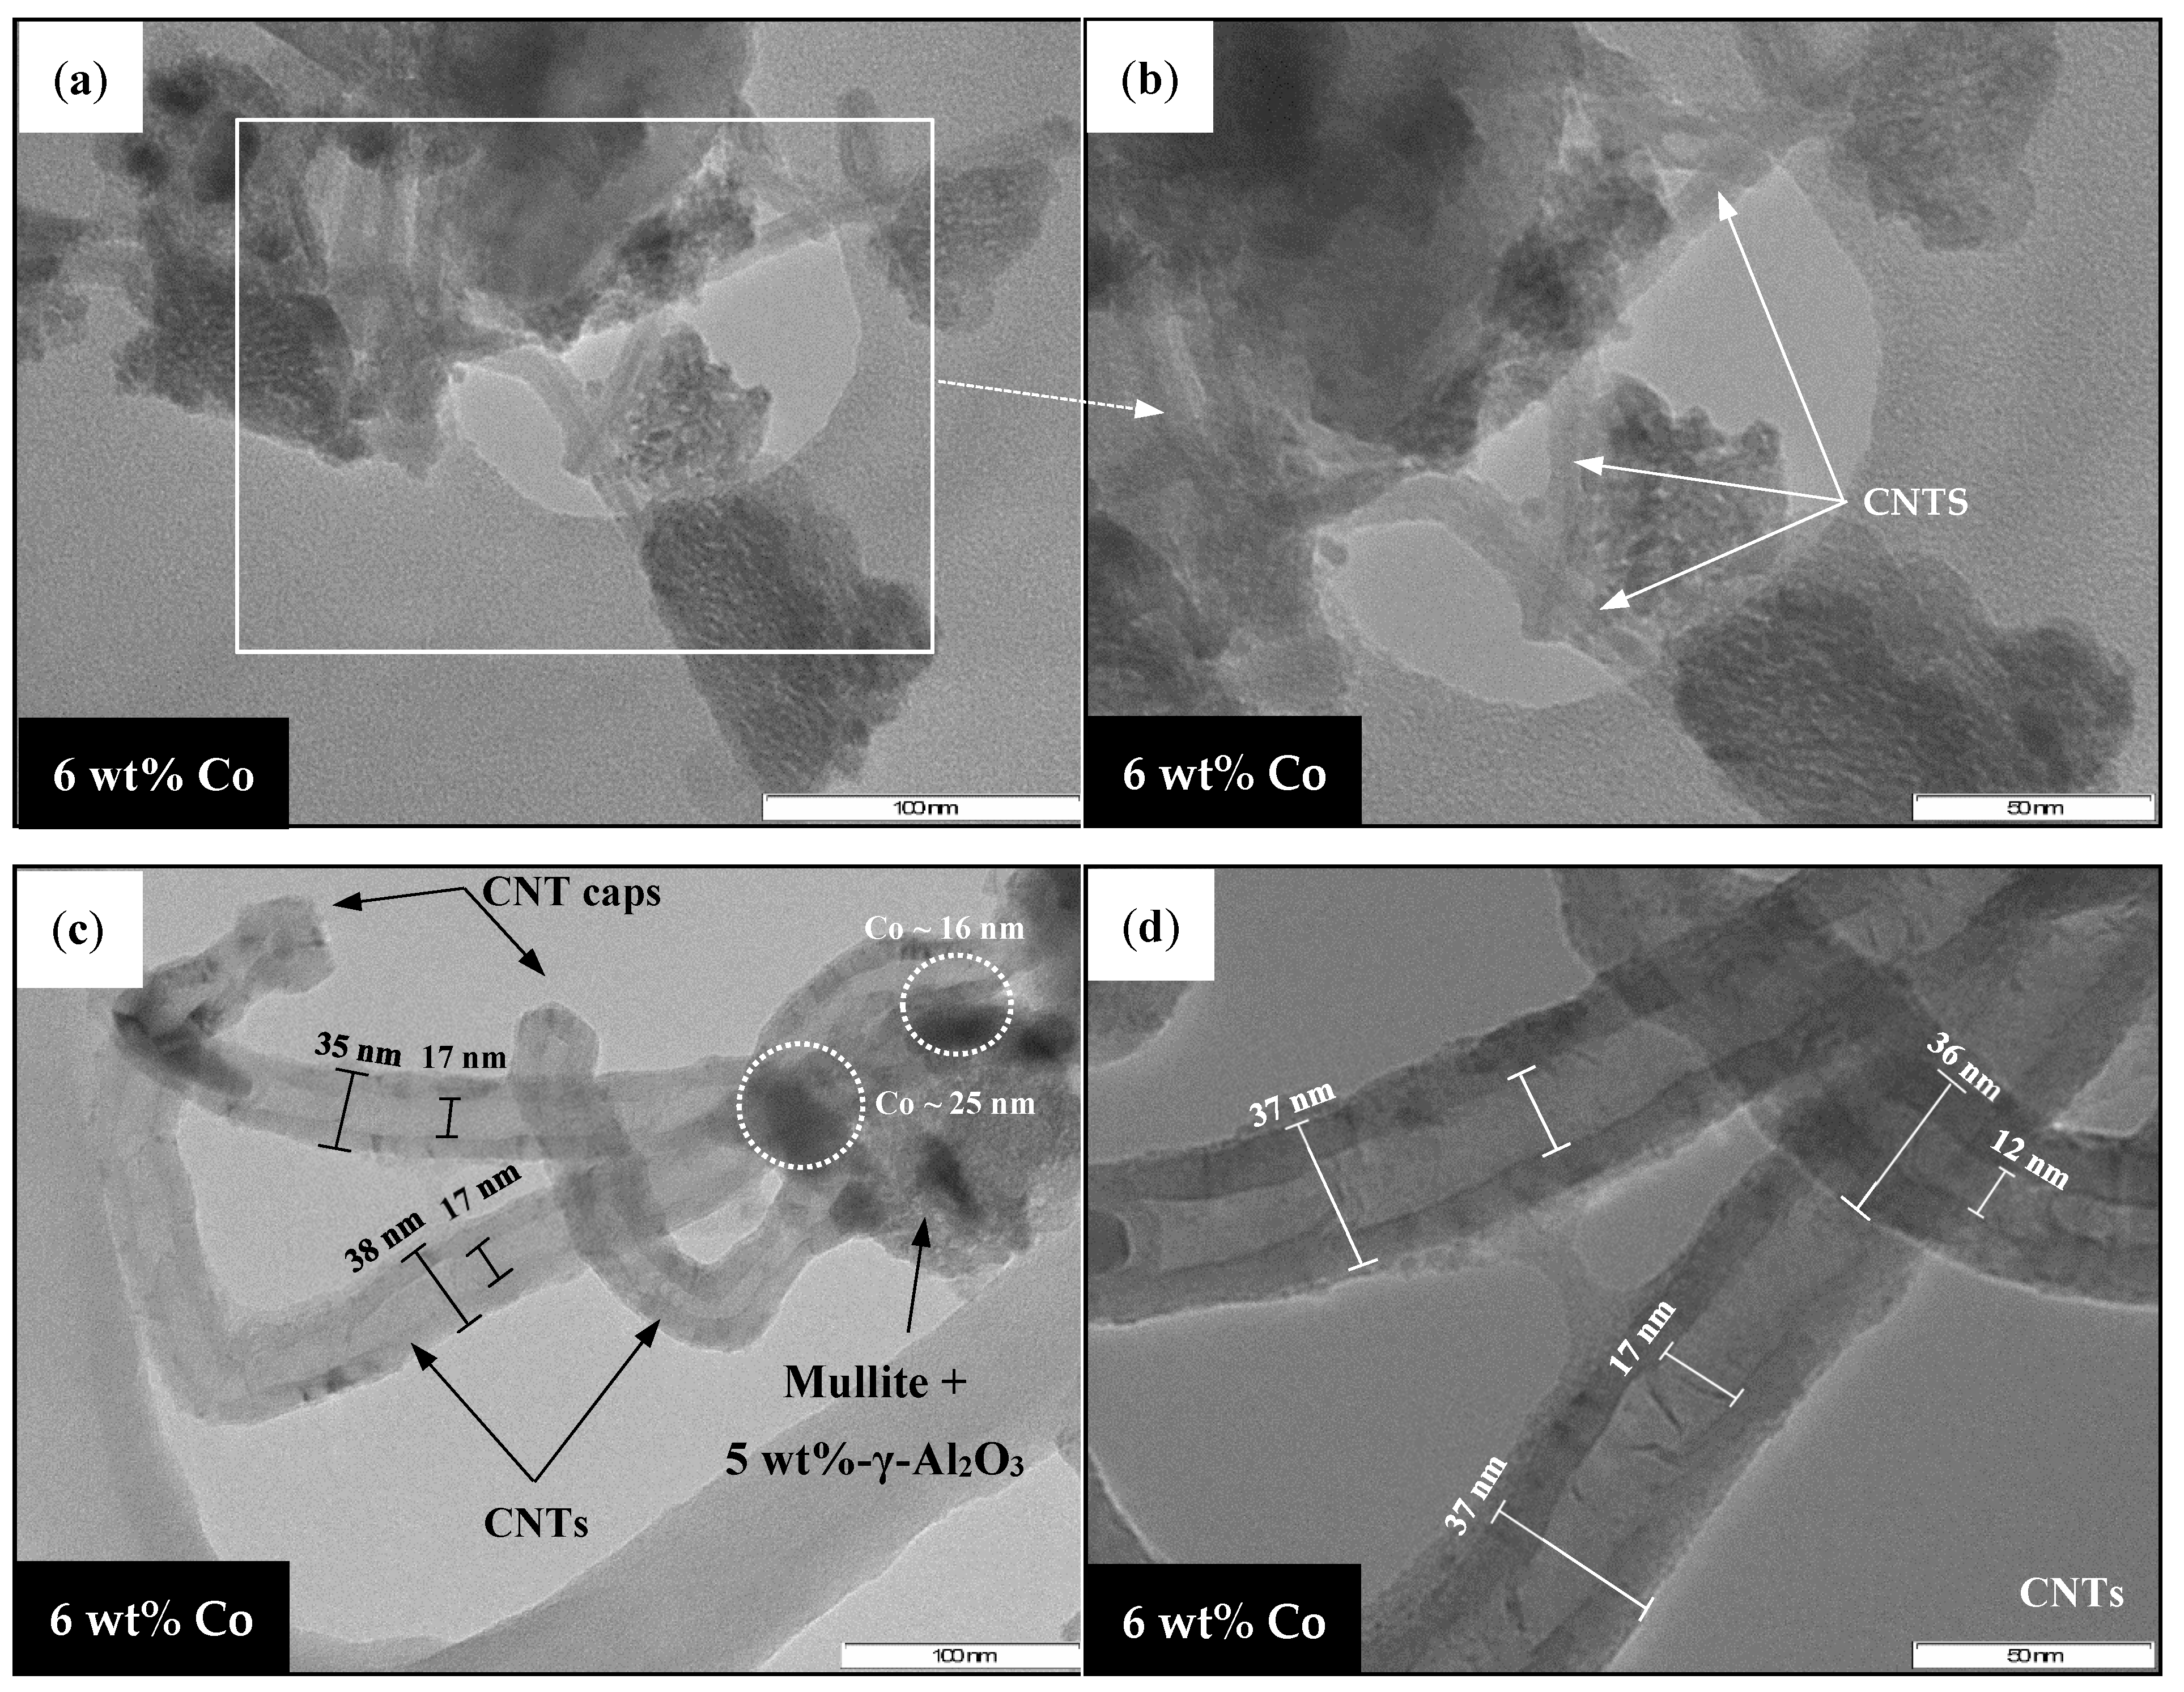
2.4.3. Transmission Electron Microscopy (TEM)
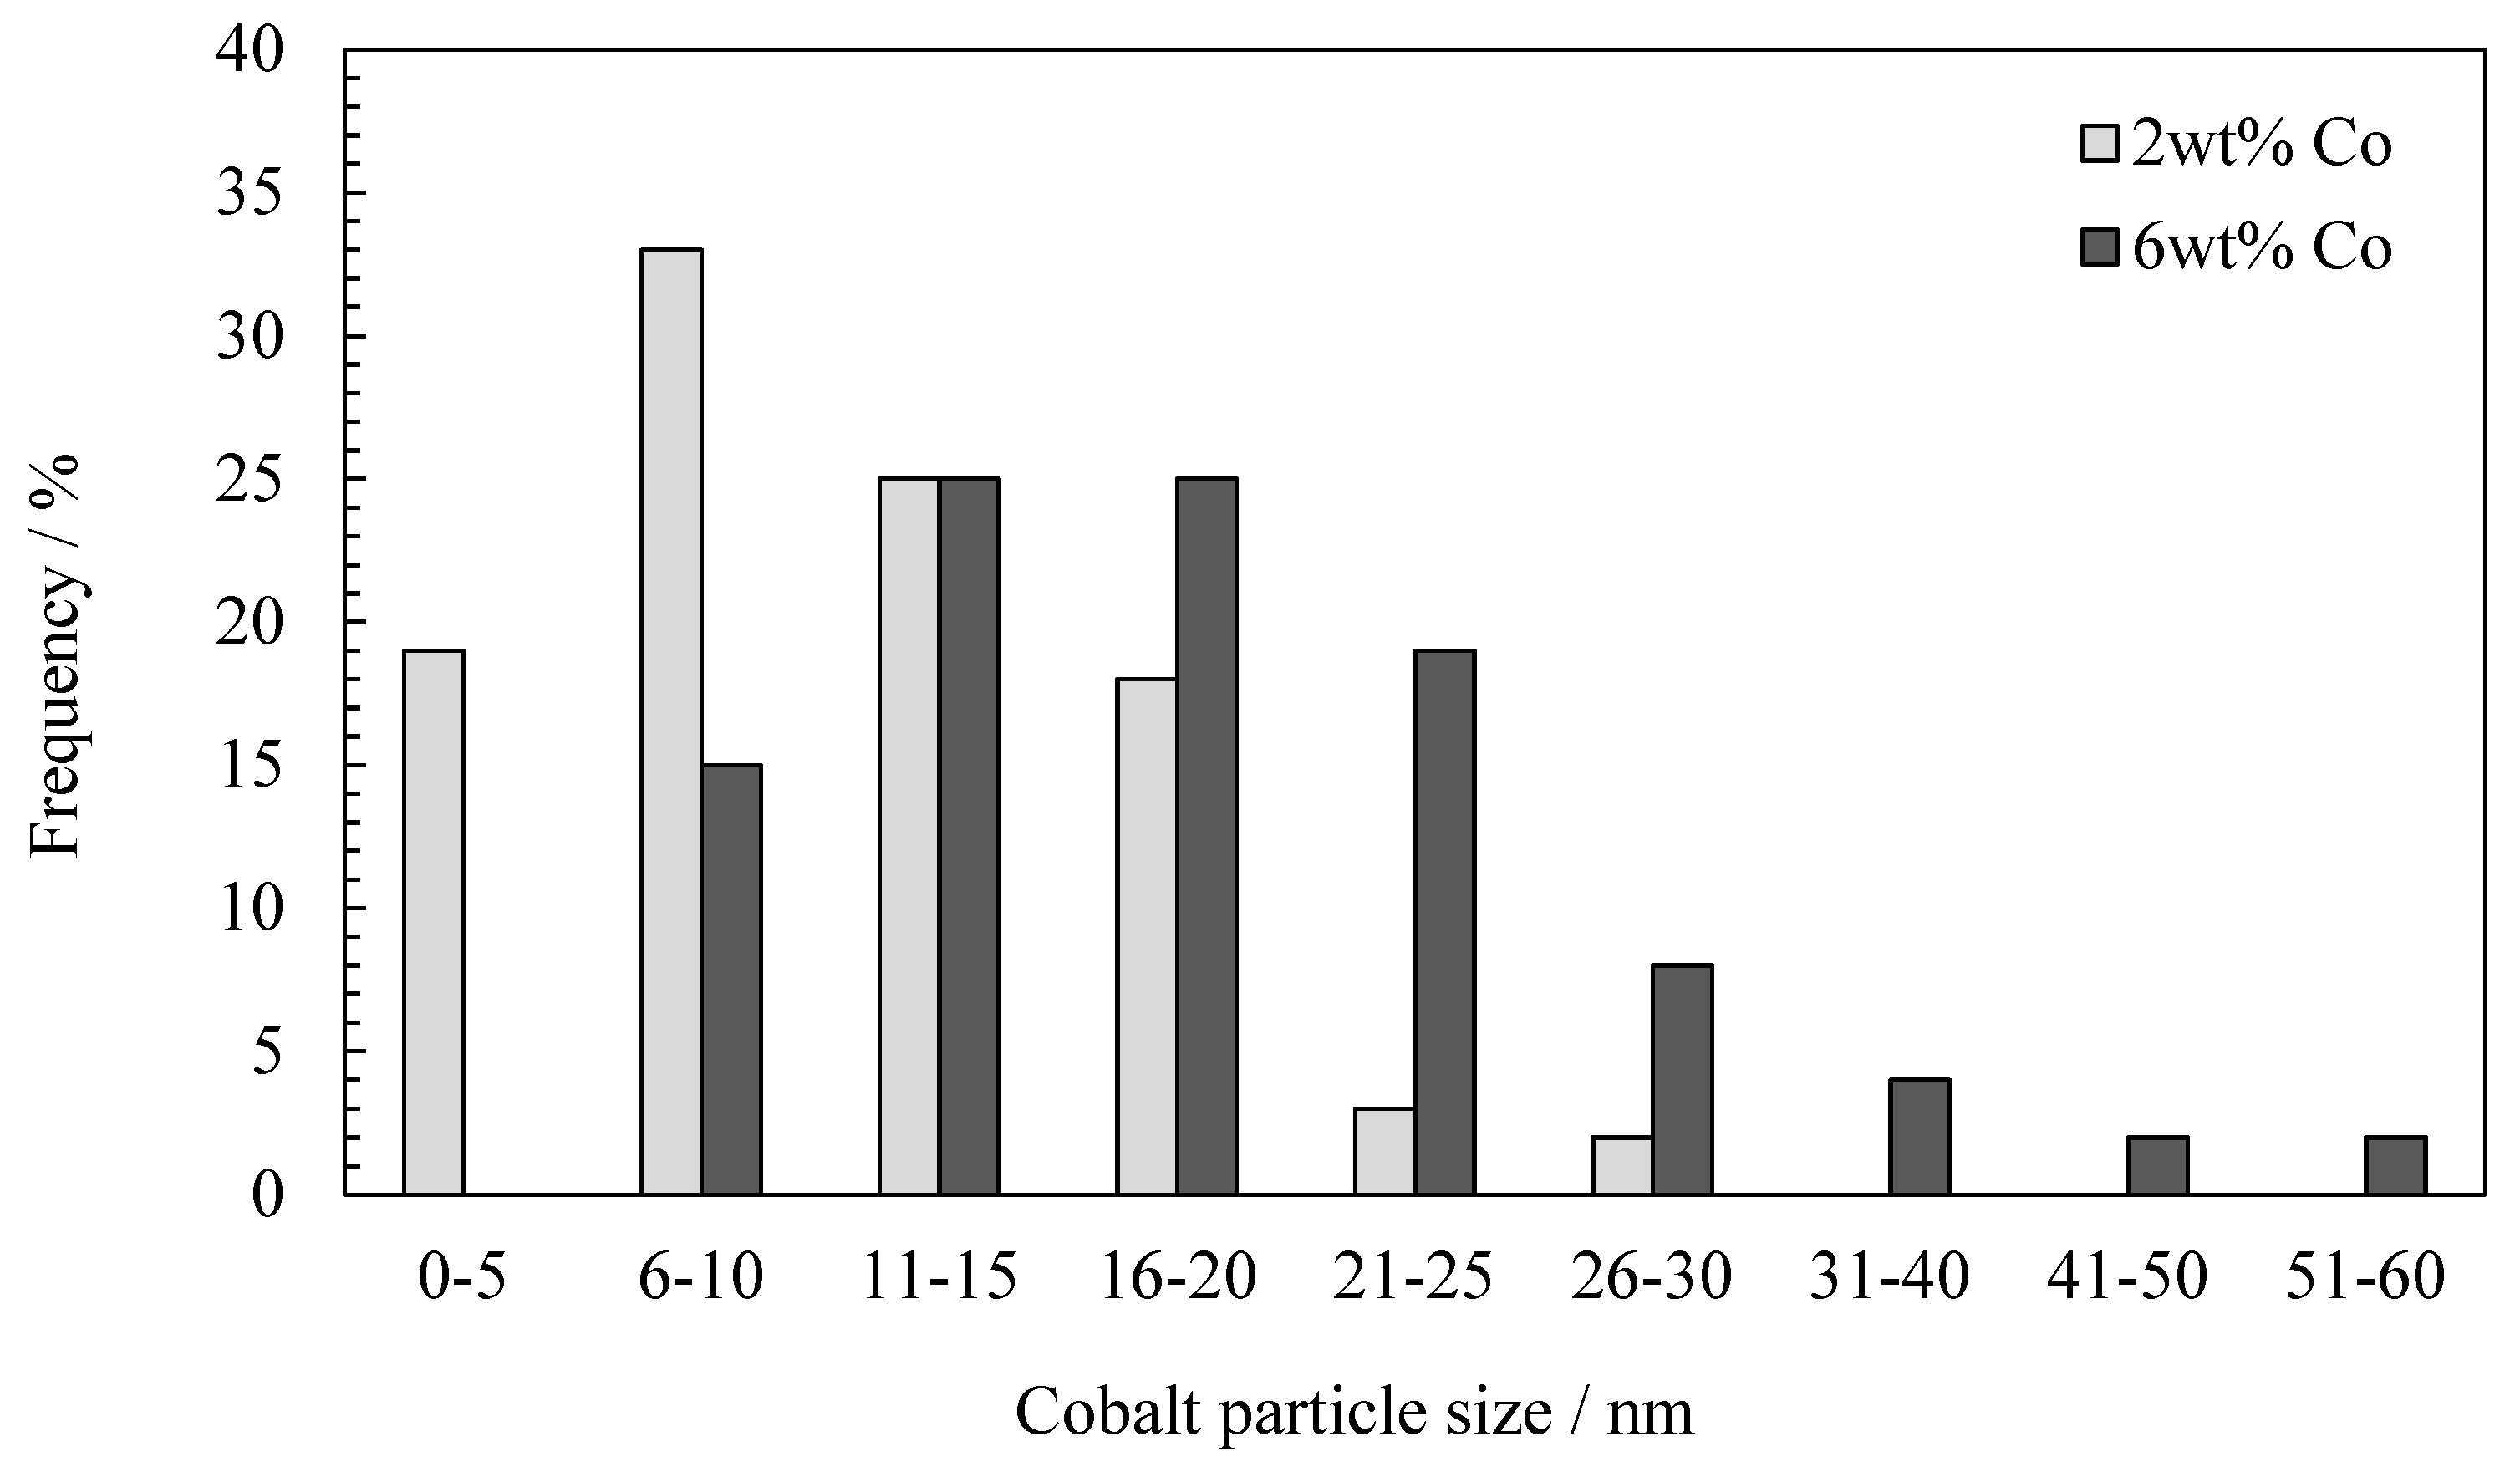
Particle Size Distribution
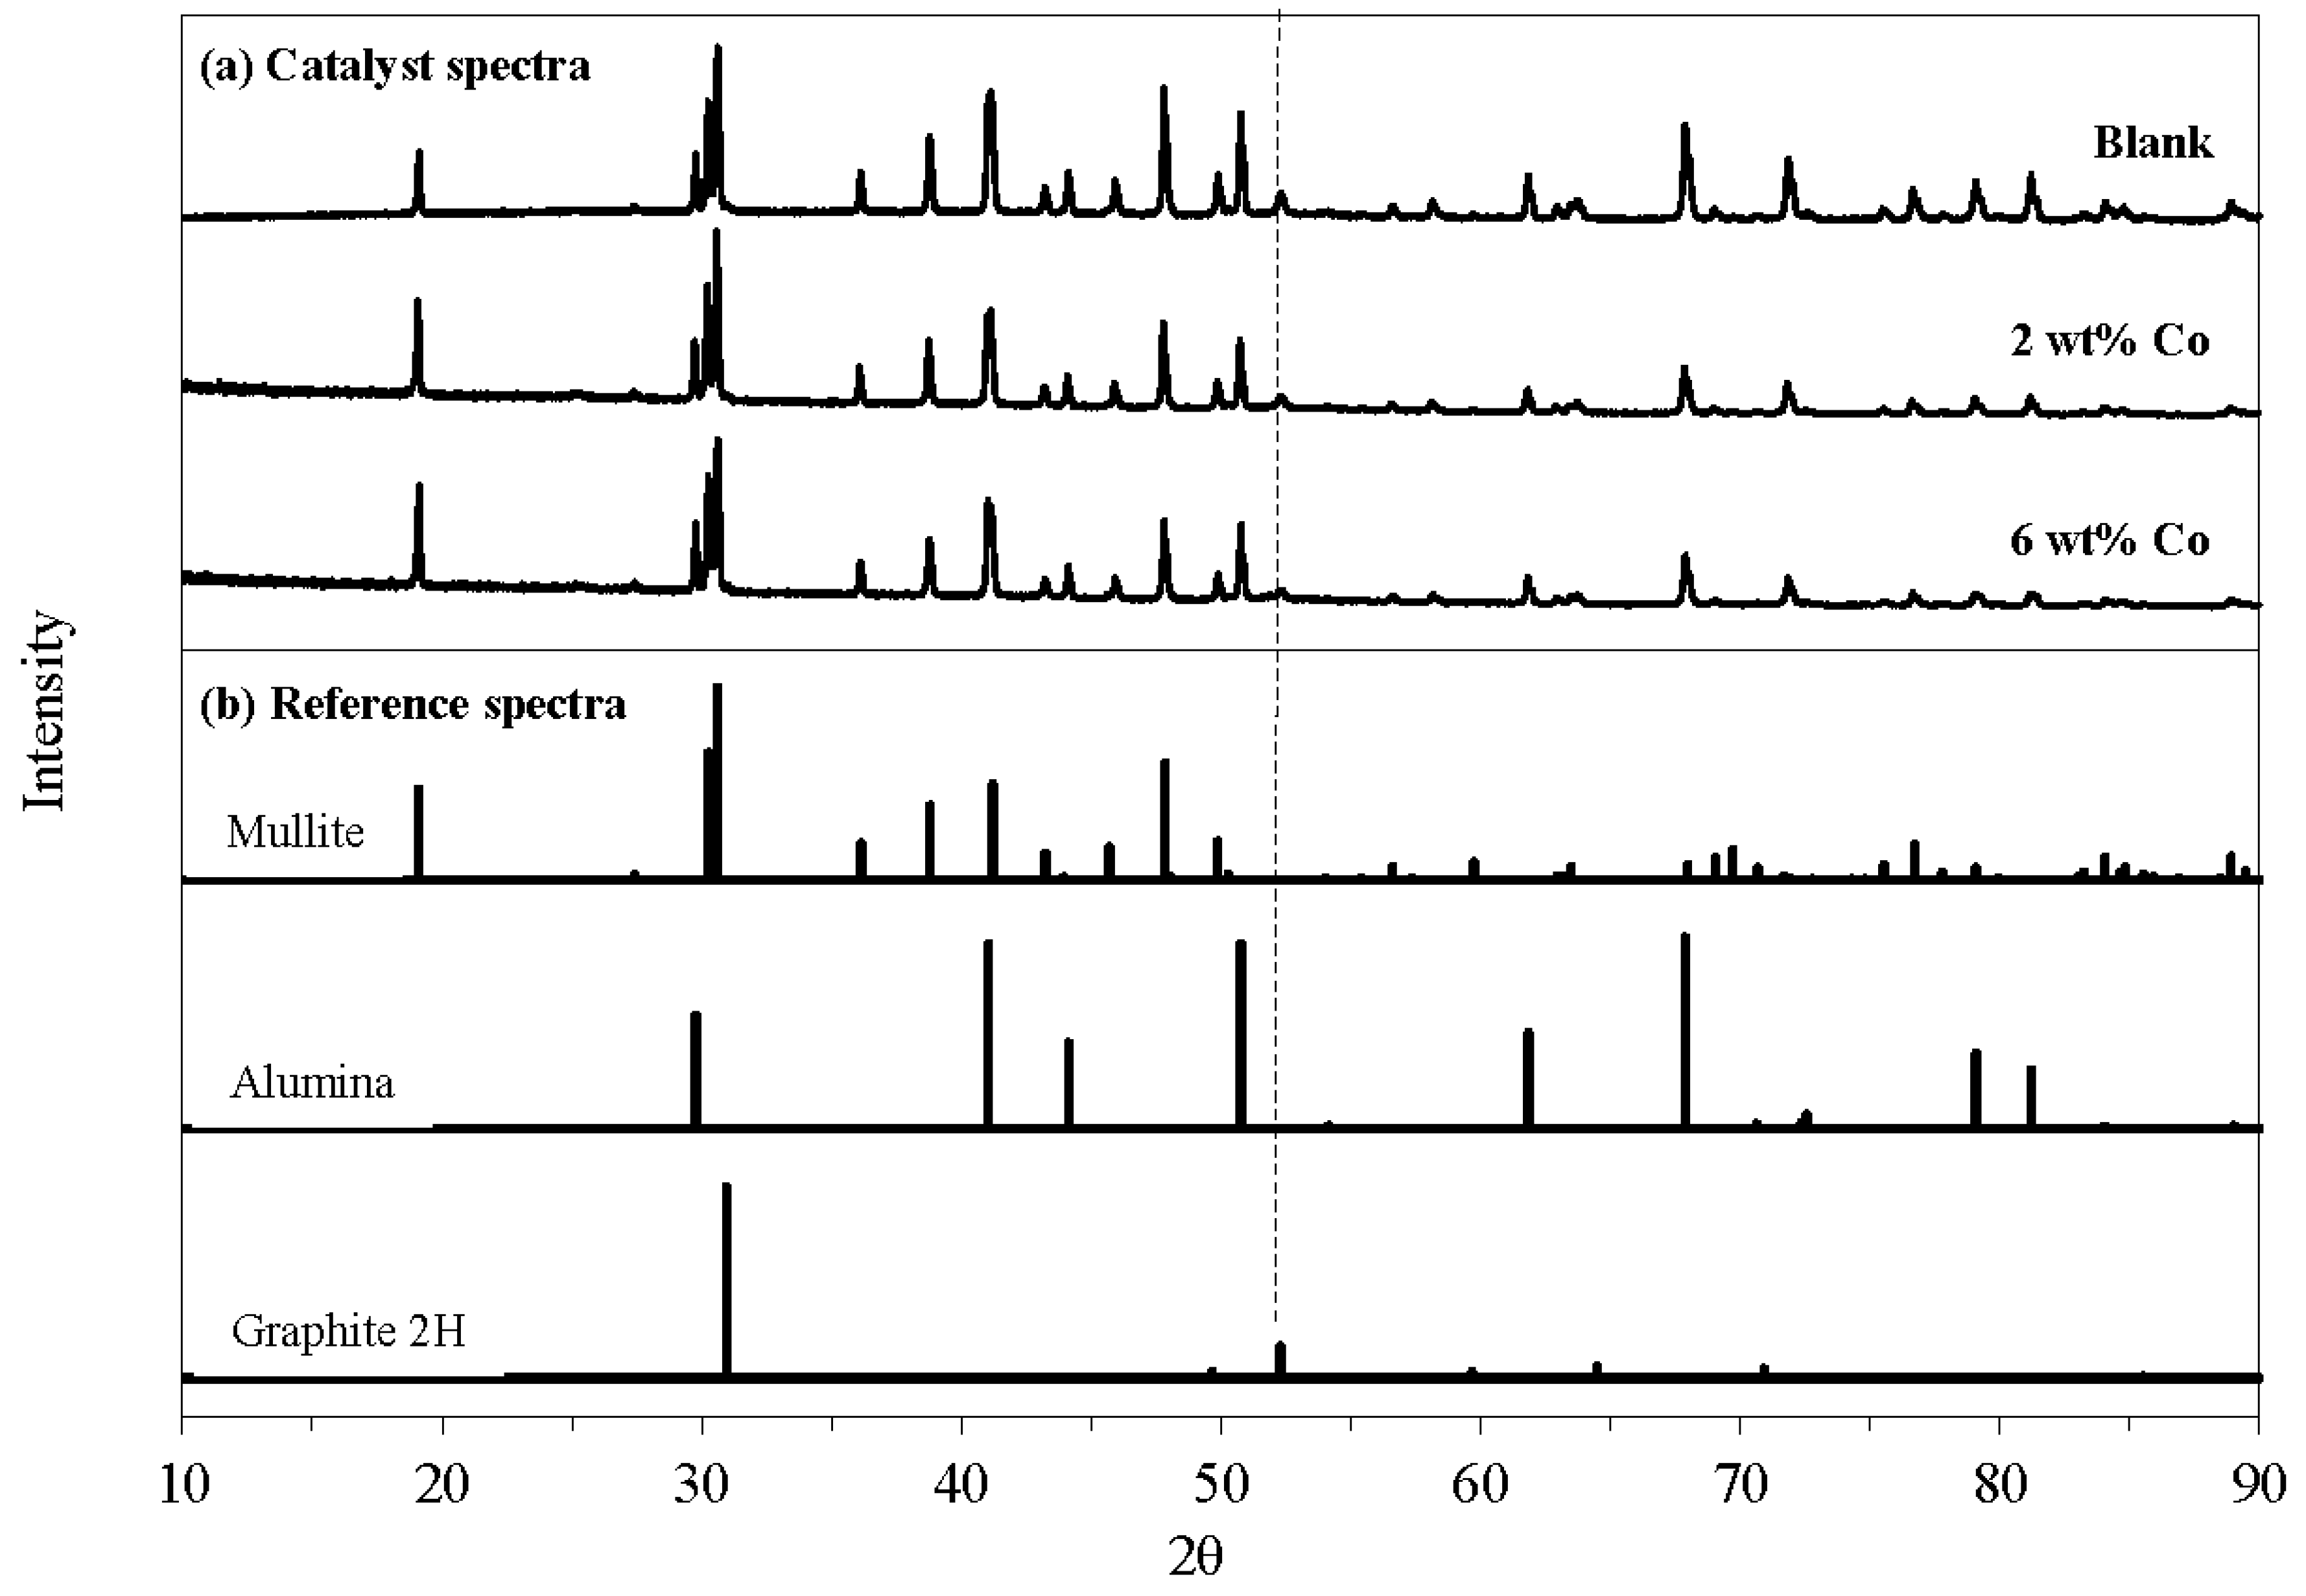
2.4.4. X-ray Diffraction (XRD)
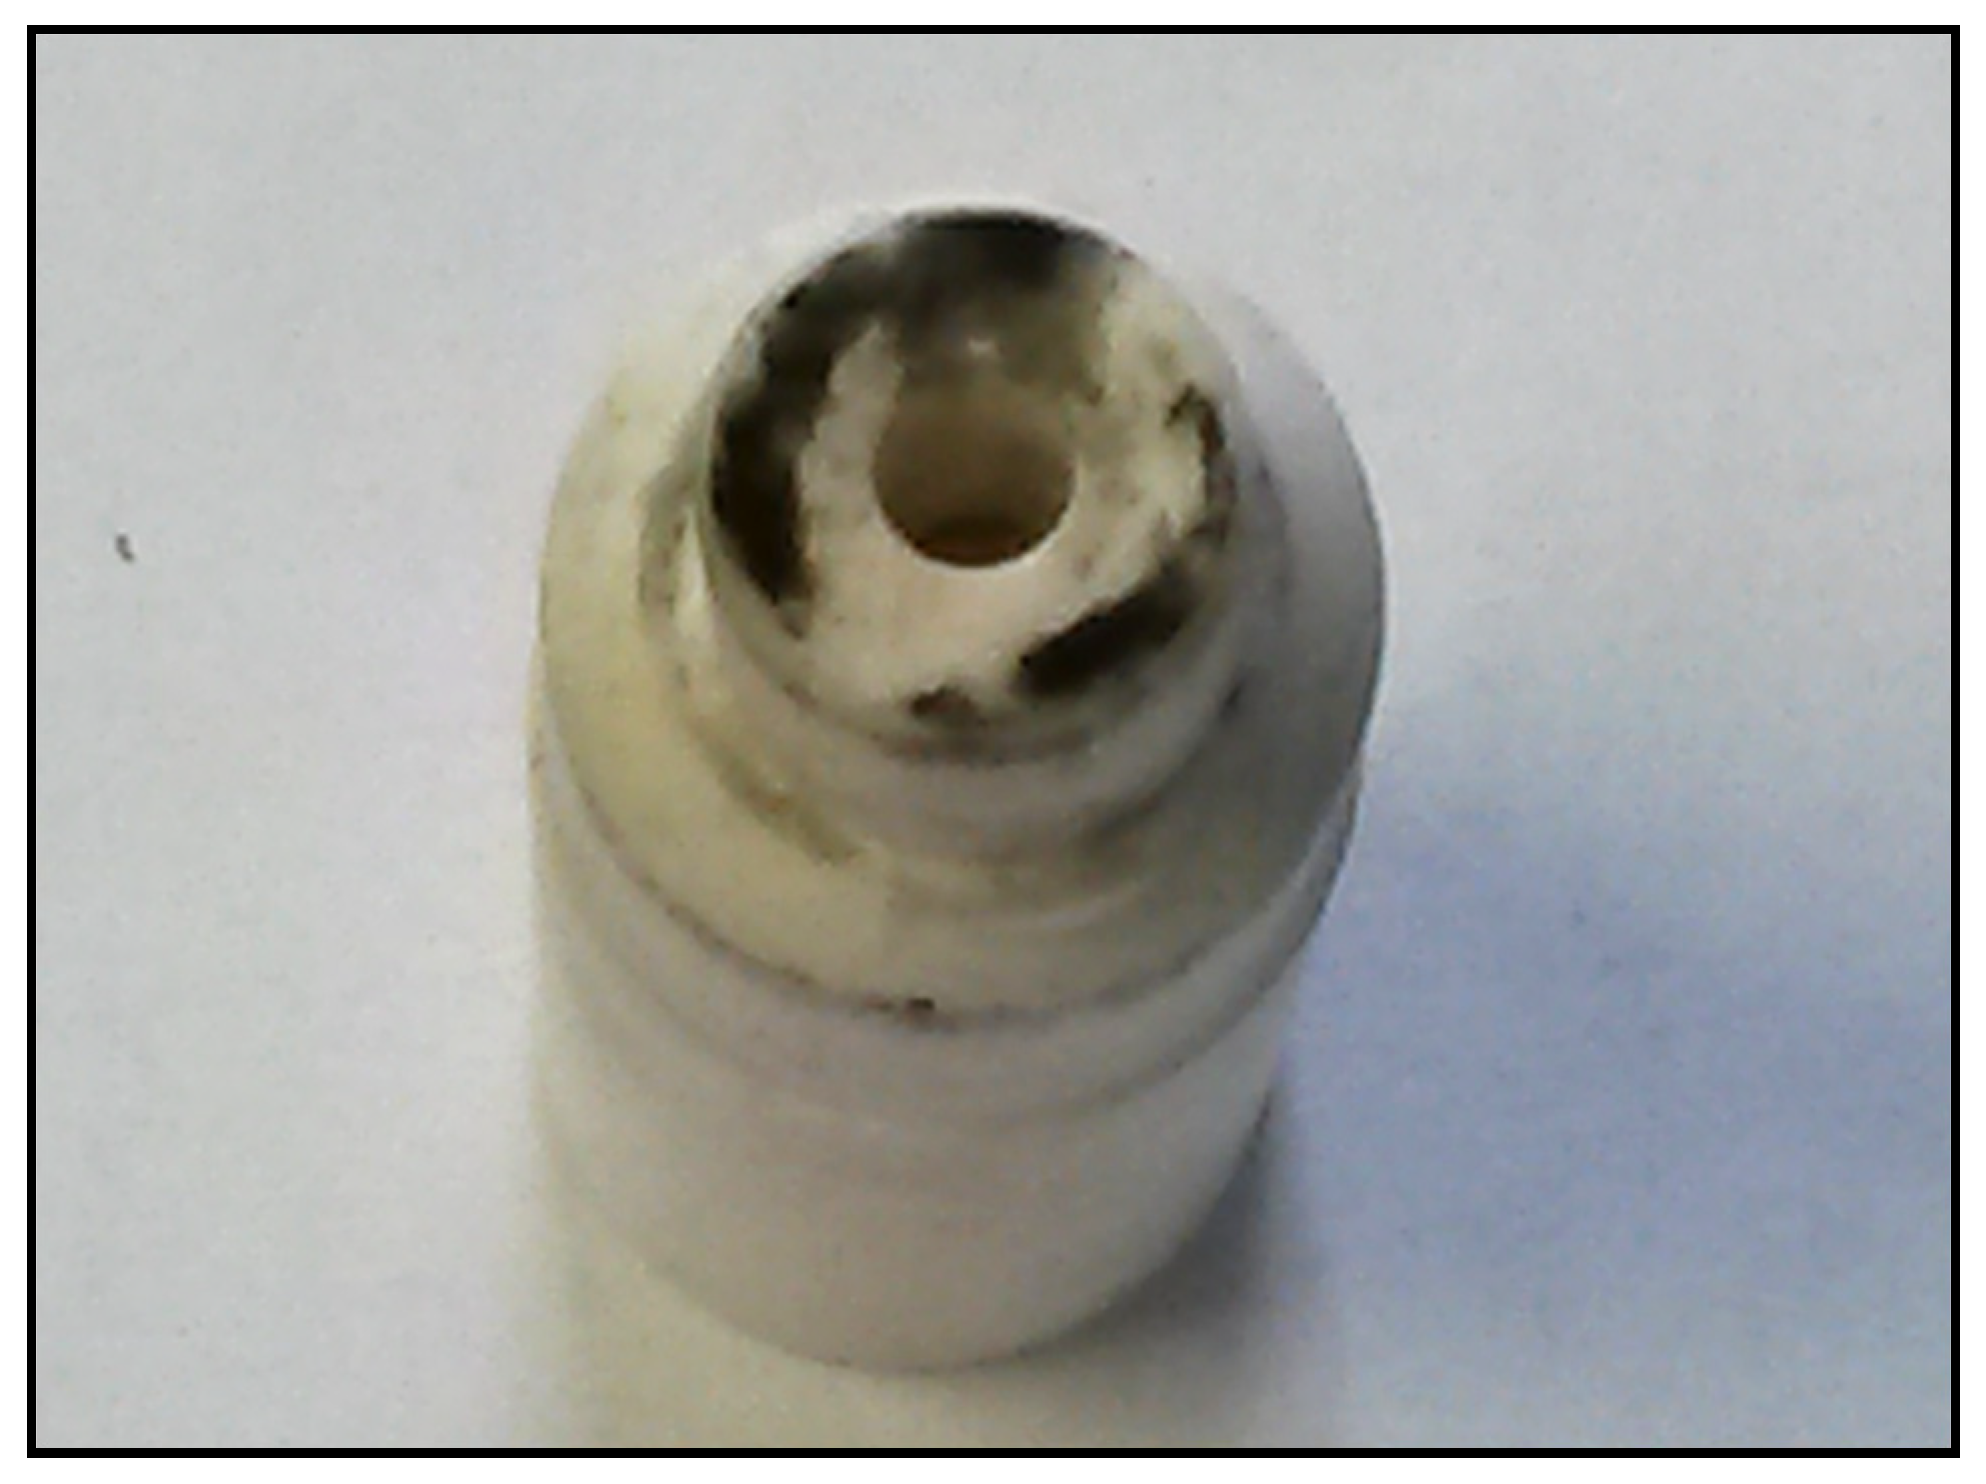
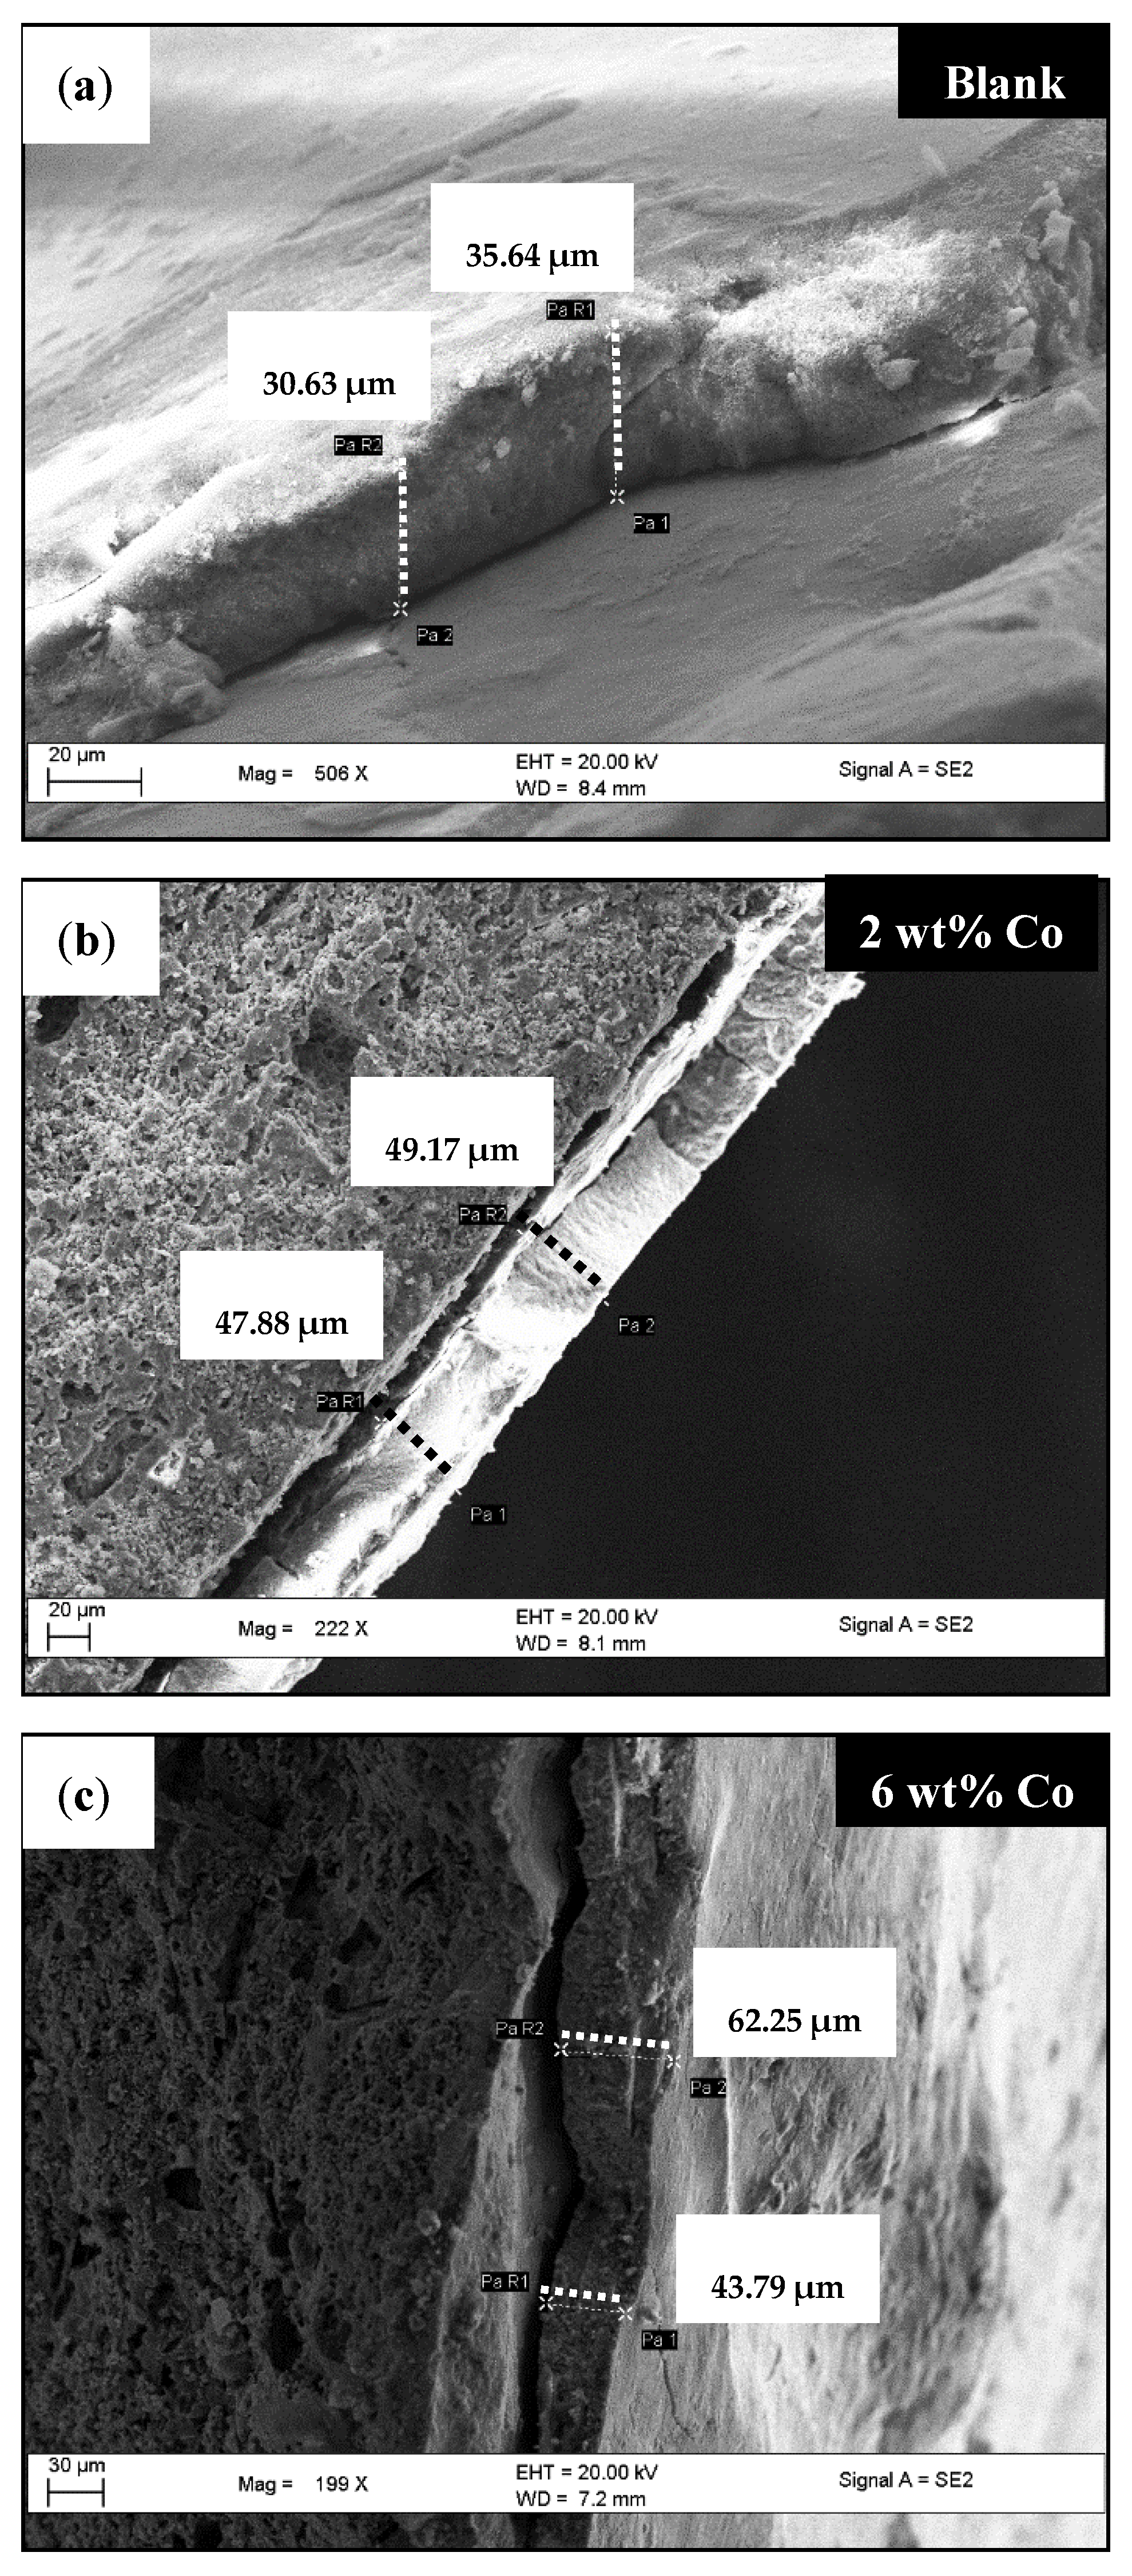
2.4.5. Carbon Deposition on Electrodes
3. Materials and Methods
3.1. Arc discharge Reactor
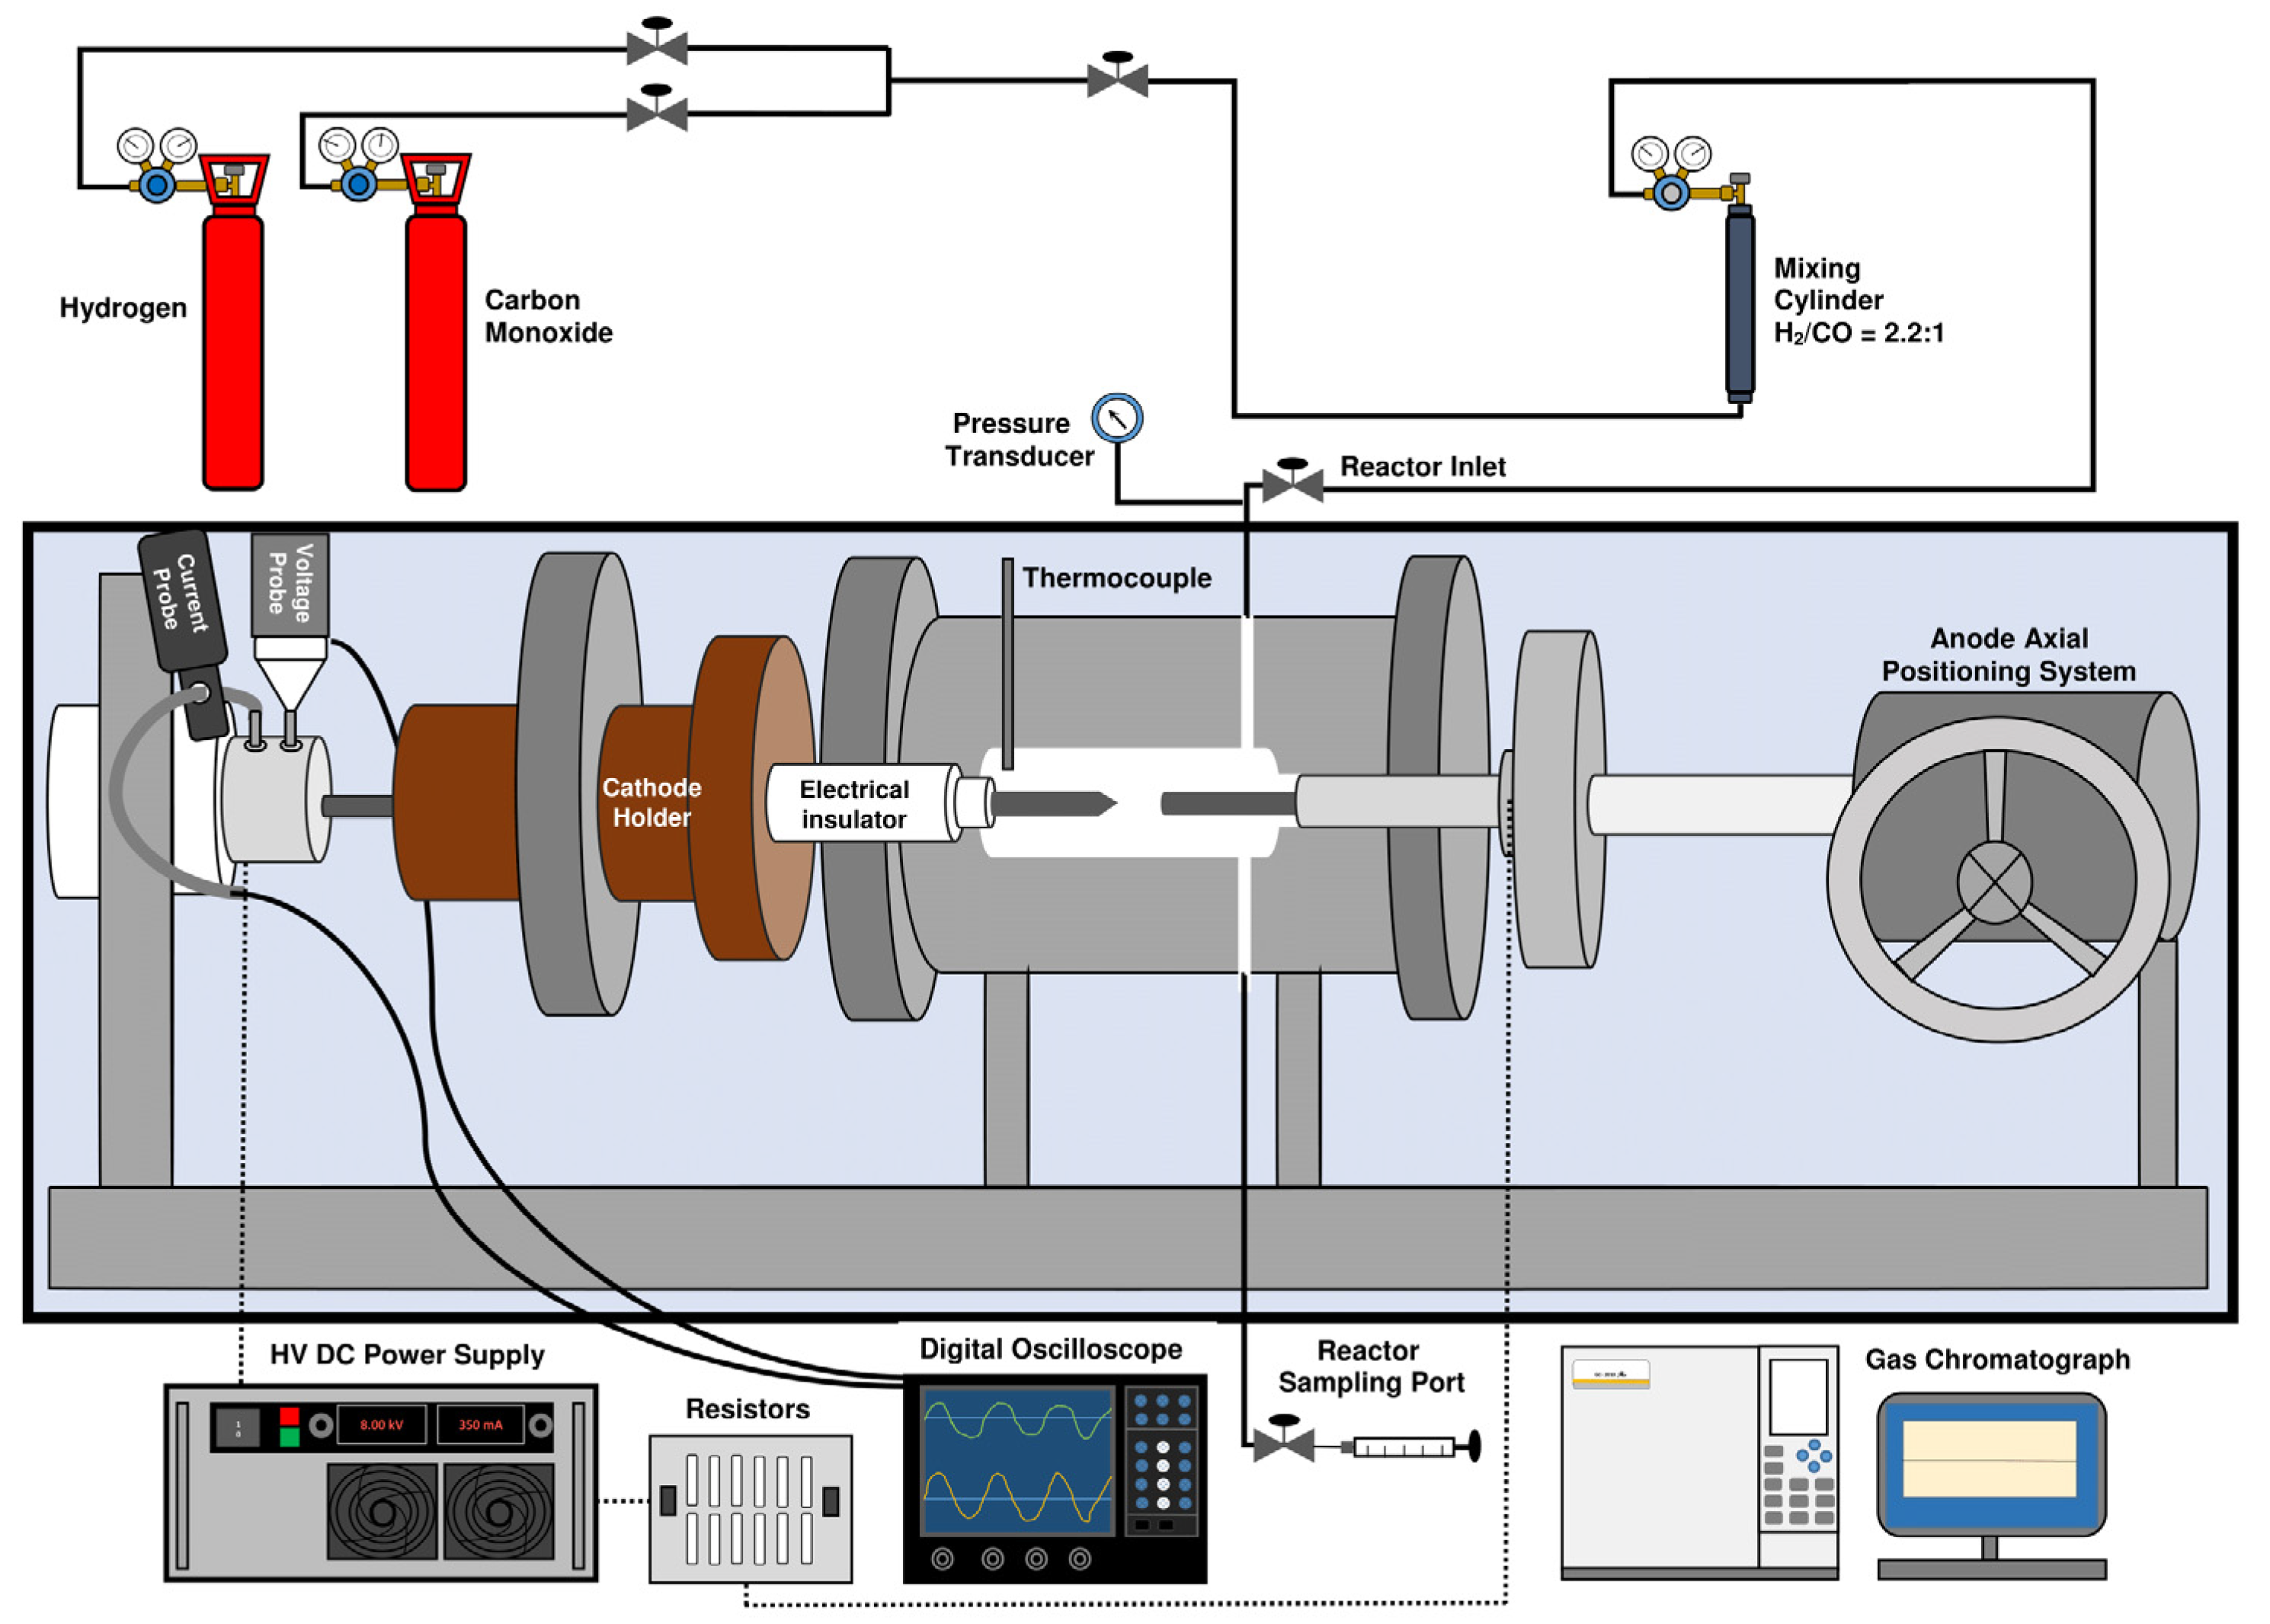
3.1.1. Reactor Set-Up
3.1.2. Reactor Experimental Procedure
3.1.3. Reactor Energy Analysis
3.2. Catalyst Preparation
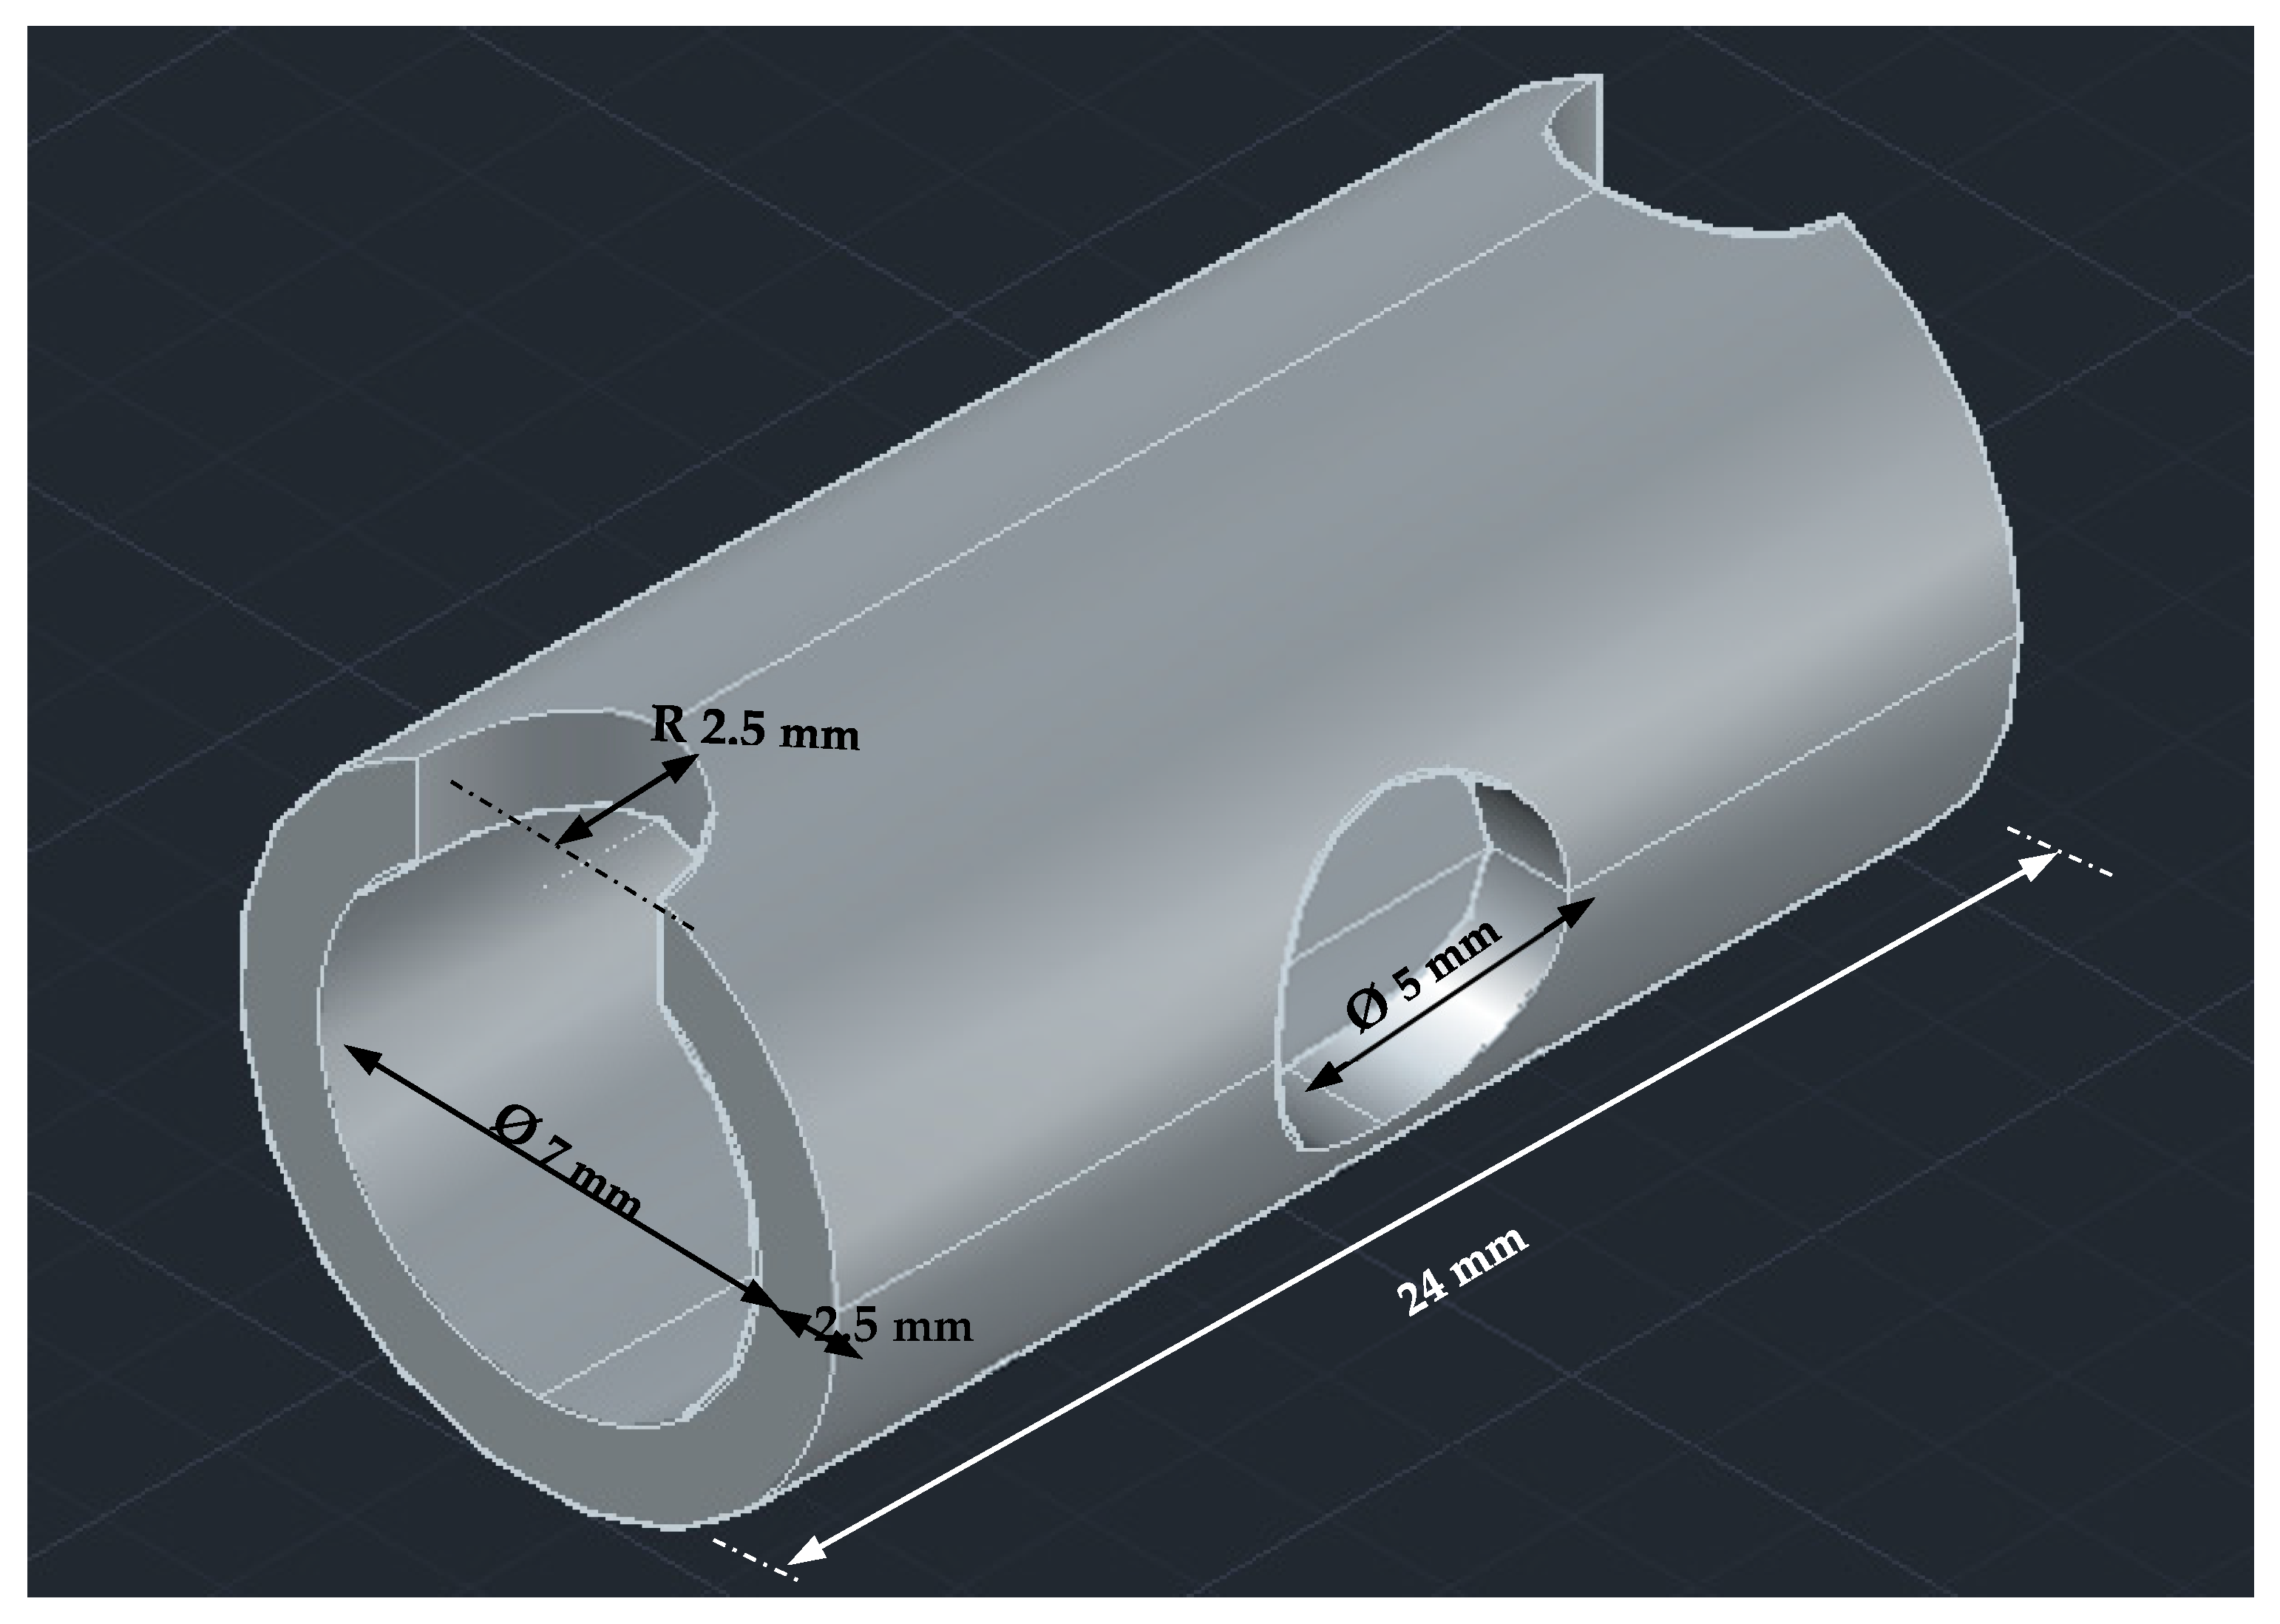
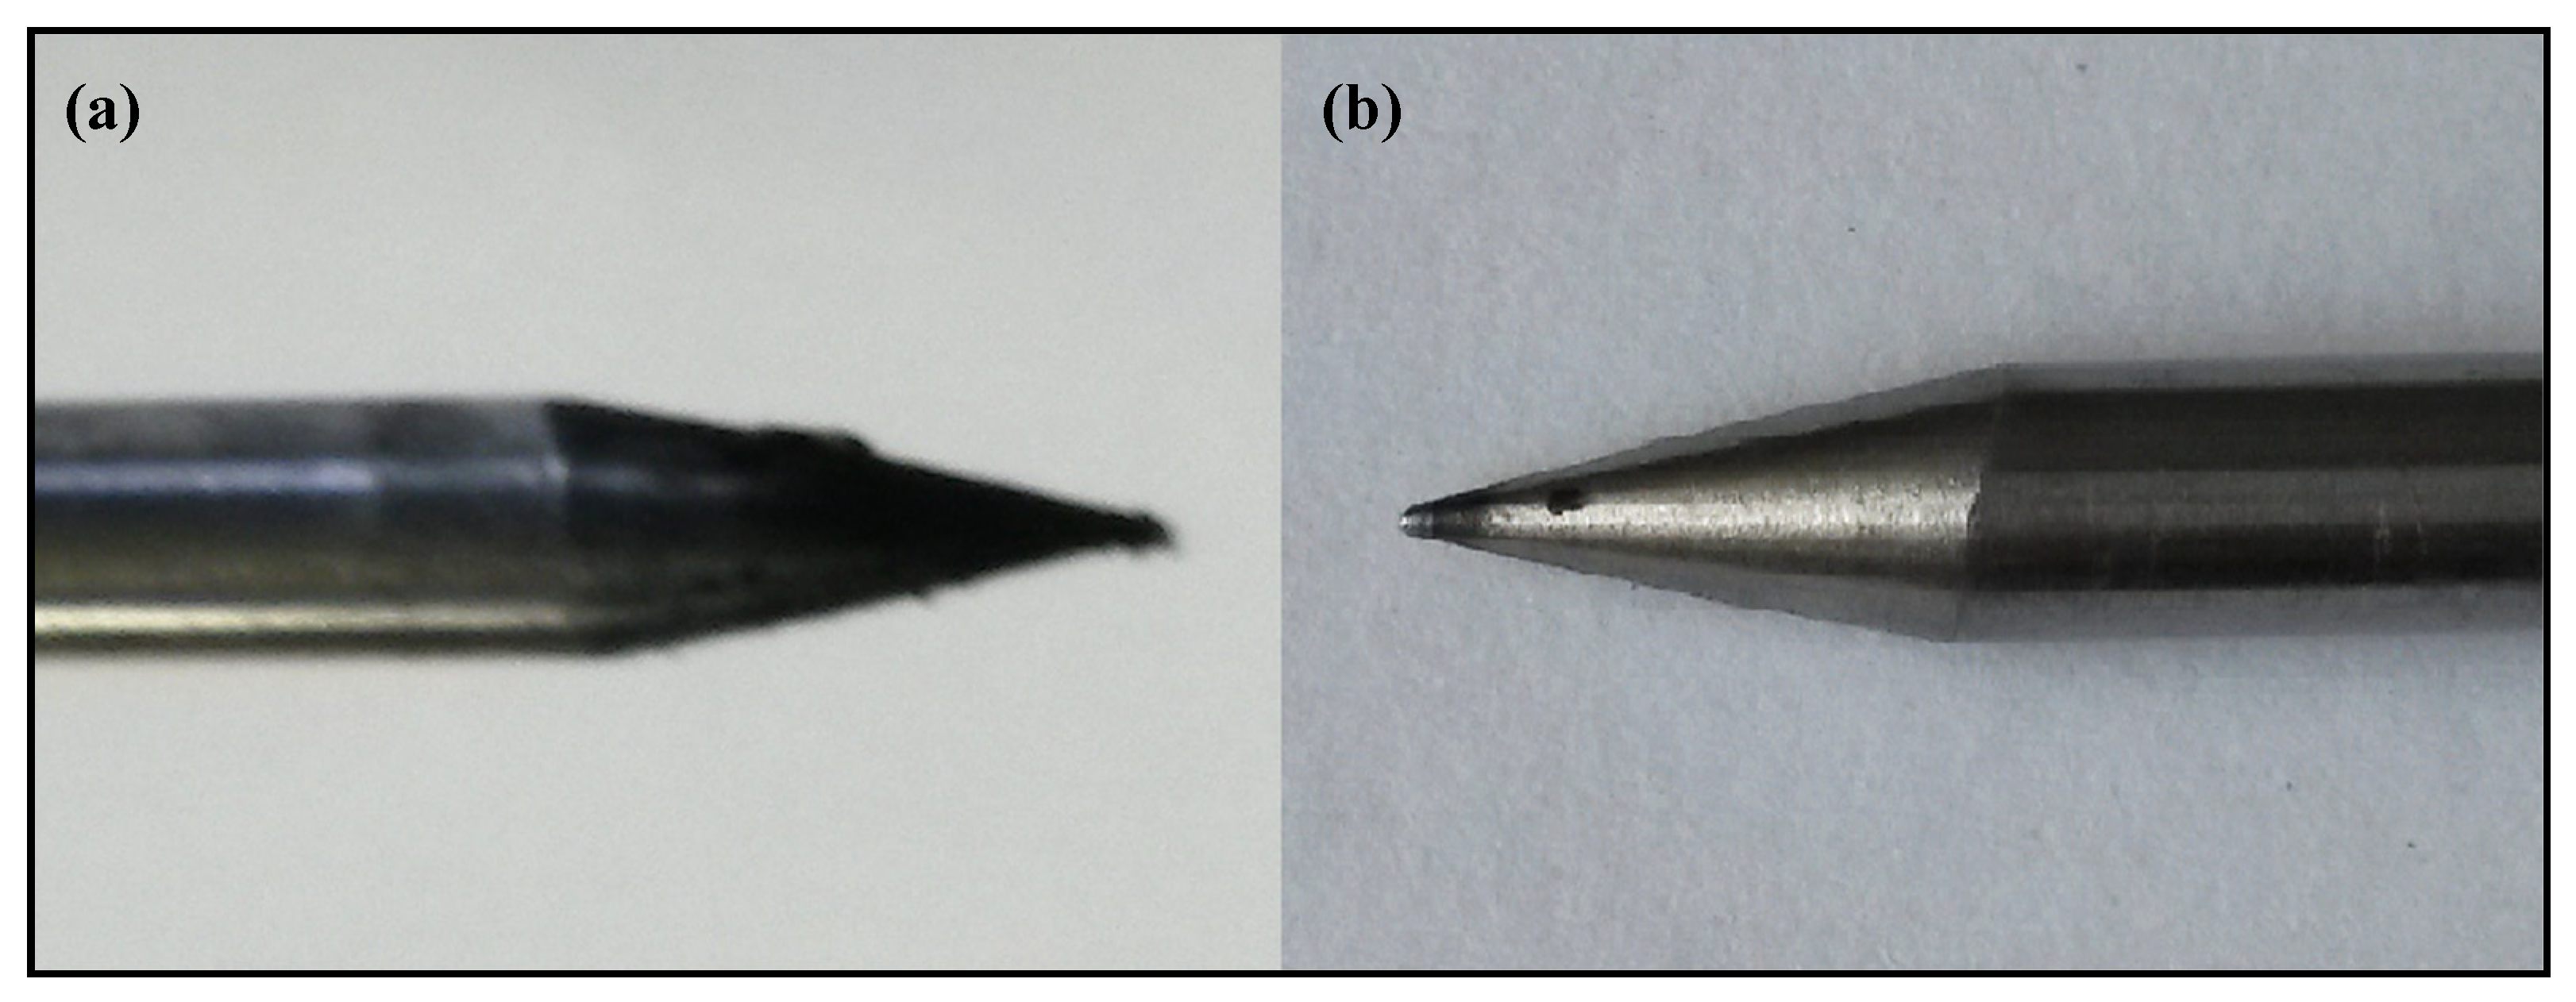
3.2.1. Catalyst Design and Configuration
3.2.2. Catalyst Preparation Procedure
3.3. Catalyst Characterisation
4. Conclusions
Author Contributions
Funding
Data Availability Statement
Acknowledgments
Conflicts of Interest
References
- Fulcheri, L.; Rohani, V.; Fabry, F.; Traisnel, N. Experimental electrical characterization of a low-current tip–tip arc discharge in helium atmosphere at very high pressure. Plasma Sources Sci. Technol. 2010, 19, 045010. [Google Scholar] [CrossRef]
- Rohani, V.; Iwarere, S.; Fabry, F.; Mourard, D.; Izquierdo, E.; Ramjugernath, D.; Fulcheri, L. Experimental study of hydrocarbons synthesis from syngas by a tip–tip electrical discharge at very high pressure. Plasma Chem. Plasma Process. 2011, 31, 663–679. [Google Scholar] [CrossRef]
- Iwarere, S.; Rohani, V.; Ramjugernath, D.; Fabry, F.; Fulcheri, L. Hydrocarbons synthesis from syngas by very high pressure plasma. Chem. Eng. J. 2014, 241, 1–8. [Google Scholar] [CrossRef]
- Iwarere, S.A.; Rohani, V.-J.; Ramjugernath, D.; Fulcheri, L. Dry reforming of methane in a tip–tip arc discharge reactor at very high pressure. Int. J. Hydrogen Energy 2015, 40, 3388–3401. [Google Scholar] [CrossRef]
- Iwarere, S.A.; Lebouvier, A.; Fulcheri, L.; Ramjugernath, D. Experimental study on the formation of higher fluorocarbons from CF4 by a tip–tip electrical arc discharge at very high pressure. J. Fluor. Chem. 2014, 166, 96–103. [Google Scholar] [CrossRef]
- Al-Harrasi, W.S.; Zhang, K.; Akay, G. Process intensification in gas-to-liquid reactions: Plasma promoted Fischer-Tropsch synthesis for hydrocarbons at low temperatures and ambient pressure. Green Process. Synth. 2013, 2, 479–490. [Google Scholar] [CrossRef]
- Li, D.; Rohani, V.; Fabry, F.; Ramaswamy, A.P.; Sennour, M.; Fulcheri, L. Experimental study on plasma-catalytic synthesis of hydrocarbons from syngas. Appl. Catal. A Gen. 2019, 588, 117269. [Google Scholar] [CrossRef]
- Akay, G.; Zhang, K.; Al-Harrasi, W.S.S.; Sankaran, R.M. Catalytic Plasma Fischer–Tropsch Synthesis Using Hierarchically Connected Porous Co/SiO2 Catalysts Prepared by Microwave-Induced Co-assembly. Ind. Eng. Chem. Res. 2020, 59, 12013–12027. [Google Scholar] [CrossRef]
- Govender, B.B.; Iwarere, S.A.; Ramjugernath, D. Plasma-Catalytic Fischer–Tropsch Synthesis at Very High Pressure. Catalysts 2021, 11, 297. [Google Scholar] [CrossRef]
- Chu, W.; Wang, L.-N.; Chernavskii, P.A.; Khodakov, A.Y. Glow-Discharge Plasma-Assisted Design of Cobalt Catalysts for Fischer-Tropsch Synthesis. Angew. Chem. Int. Ed. 2008, 47, 5052–5055. [Google Scholar] [CrossRef]
- Aluha, J.; Bere, K.; Abatzoglou, N.; Gitzhofer, F. Synthesis of nano-catalysts by induction suspension plasma technology (SPS) for Fischer–Tropsch reaction. Plasma Chem. Plasma Process. 2016, 36, 1325–1348. [Google Scholar] [CrossRef]
- Aluha, J.; Braidy, N.; Dalai, A.; Abatzoglou, N. Low-temperature Fischer–Tropsch synthesis using plasma-synthesised nanometric Co/C and Fe/C catalysts. Can. J. Chem. Eng. 2016, 94, 1504–1515. [Google Scholar] [CrossRef]
- Aluha, J.; Gutierrez, S.; Gitzhofer, F.; Abatzoglou, N. Use of Plasma-Synthesized Nano-Catalysts for CO Hydrogenation in Low-Temperature Fischer–Tropsch Synthesis: Effect of Catalyst Pre-Treatment. Nanomaterials 2018, 8, 822. [Google Scholar] [CrossRef] [PubMed] [Green Version]
- Hong, J.; Du, J.; Wang, B.; Zhang, Y.; Liu, C.; Xiong, H.; Sun, F.; Chen, S.; Li, J. Plasma-Assisted Preparation of Highly Dispersed Cobalt Catalysts for Enhanced Fischer–Tropsch Synthesis Performance. ACS Catal. 2018, 8, 6177–6185. [Google Scholar] [CrossRef]
- Aluha, J.; Gitzhofer, F.; Abatzoglou, N. Application of Plasma Technology in Fischer-Tropsch Catalysis for the Production of Synthetic Fuels. Recent Adv. Petrochem. Sci. 2018, 5, 555657. [Google Scholar]
- Rethwisch, D.G.; Dumesic, J. Effect of metal-oxygen bond strength on properties of oxides. 1. Infrared spectroscopy of adsorbed carbon monoxide and carbon dioxide. Langmuir 1986, 2, 73–79. [Google Scholar] [CrossRef]
- Tanabe, K. Solid acid and base catalysts. In Catalysis Science and Technology; Anderson, J.R., Boudart, M., Eds.; Springer: Berlin/Heidelberg, Germany, 1981; Chapter 5; Volume 2, pp. 231–273. [Google Scholar]
- Pines, H.; Haag, W.O. Alumina: Catalyst and Support. I. Alumina, its Intrinsic Acidity and Catalytic Activity. J. Am. Chem. Soc. 1960, 82, 2471–2483. [Google Scholar] [CrossRef]
- Cabrejas Manchado, M.; Guil, J.; Perez Masia, A.; Ruiz Paniego, A.; Trejo Menayo, J. Adsorption of H2, O2, CO, and CO2 on a gamma.-Alumina: Volumetric and Calorimetric Studies. Langmuir 1994, 10, 685–691. [Google Scholar] [CrossRef]
- Sun, H.; Page, M.I.; Atherton, J.H.; Hall, A. Kinetics of the conversion of methyl benzoate to benzamide by the alumina catalysed reaction with liquid ammonia at 120 °C. Catal. Sci. Techn. 2014, 4, 3870–3878. [Google Scholar] [CrossRef]
- Liu, C.-j.; Vissokov, G.P.; Jang, B.W.-L. Catalyst preparation using plasma technologies. Catal. Today 2002, 72, 173–184. [Google Scholar] [CrossRef]
- Roland, U.; Holzer, F.; Kopinke, F.-D. Combination of non-thermal plasma and heterogeneous catalysis for oxidation of volatile organic compounds: Part 2. Ozone decomposition and deactivation of γ-Al2O3. Appl. Catal. B Environ. 2005, 58, 217–226. [Google Scholar] [CrossRef]
- Holzer, F.; Roland, U.; Kopinke, F.-D. Combination of non-thermal plasma and heterogeneous catalysis for oxidation of volatile organic compounds: Part 1. Accessibility of the intra-particle volume. Appl. Catal. B Environ. 2002, 38, 163–181. [Google Scholar] [CrossRef]
- Roland, U.; Holzer, F.; Kopinke, F.-D. Improved oxidation of air pollutants in a non-thermal plasma. Catal. Today 2002, 73, 315–323. [Google Scholar] [CrossRef]
- Morent, R.; Dewulf, J.; Steenhaut, N.; Leys, C.; Van Langenhove, H. Hybrid plasma-catalyst system for the removal of trichloroethylene in air. J. Adv. Oxid. Technol. 2006, 9, 53–58. [Google Scholar] [CrossRef]
- Conner, W.C., Jr.; Falconer, J.L. Spillover in heterogeneous catalysis. Chem. Rev. 1995, 95, 759–788. [Google Scholar] [CrossRef]
- Valero, M.C.; Raybaud, P. Cobalt Catalyzed Fischer–Tropsch Synthesis: Perspectives Opened by First Principles Calculations. Catal. Lett. 2013, 143, 1–17. [Google Scholar] [CrossRef]
- Bhatelia, T.; Li, C.; Sun, Y.; Hazewinkel, P.; Burke, N.; Sage, V. Chain length dependent olefin re-adsorption model for Fischer–Tropsch synthesis over Co-Al2O3 catalyst. Fuel Process. Technol. 2014, 125, 277–289. [Google Scholar] [CrossRef]
- Ogata, A.; Yamanouchi, K.; Mizuno, K.; Kushiyama, S.; Yamamoto, T. Decomposition of benzene using alumina-hybrid and catalyst-hybrid plasma reactors, Industry Applications. IEEE Trans. 1999, 35, 1289–1295. [Google Scholar]
- Marques, R.; Da Costa, S.; Da Costa, P. Plasma-assisted catalytic oxidation of methane: On the influence of plasma energy deposition and feed composition. Appl. Catal. B Environ. 2008, 82, 50–57. [Google Scholar] [CrossRef]
- Ma, W.; Jacobs, G.; Ji, Y.; Bhatelia, T.; Bukur, D.B.; Khalid, S.; Davis, B.H. Fischer–Tropsch synthesis: Influence of CO conversion on selectivities, H2/CO usage ratios, and catalyst stability for a Ru promoted Co/Al2O3 catalyst using a slurry phase reactor. Top. Catal. 2011, 54, 757–767. [Google Scholar] [CrossRef]
- Borg, Ø.; Eri, S.; Blekkan, E.A.; Storsæter, S.; Wigum, H.; Rytter, E.; Holmen, A. Fischer–Tropsch synthesis over γ-alumina-supported cobalt catalysts: Effect of support variables. J. Catal. 2007, 248, 89–100. [Google Scholar] [CrossRef]
- Bukur, D.B.; Pan, Z.; Ma, W.; Jacobs, G.; Davis, B.H. Effect of CO conversion on the product distribution of a Co/Al2O3 Fischer–Tropsch synthesis catalyst using a fixed bed reactor. Catal. Lett. 2012, 142, 1382–1387. [Google Scholar] [CrossRef]
- Botes, F.G. Influences of water and syngas partial pressure on the kinetics of a commercial alumina-supported cobalt Fischer−Tropsch catalyst. Ind. Eng. Chem. Res. 2009, 48, 1859–1865. [Google Scholar] [CrossRef]
- Van Der Laan, G.P.; Beenackers, A. Kinetics and selectivity of the Fischer–Tropsch synthesis: A literature review. Catal. Rev. 1999, 41, 255–318. [Google Scholar] [CrossRef]
- Iglesia, E.; Reyes, S.C.; Madon, R.J.; Soled, S.L. Selectivity Control and Catalyst Design in the Fischer-Tropsch Synthesis: Sites, Pellets, and Reactors. In Advances in Catalysis; Eley, D., Pines, H., Weisz, P.B., Eds.; Academic Press: Cambridge, MA, USA, 1993. [Google Scholar]
- Madon, R.J.; Iglesia, E.; Reyes, S.C. Non-Flory product distributions in Fischer-Tropsch synthesis catalyzed by Ruthenium, Cobalt, and Iron. In Selectivity in Catalysis; ACS Symposium Series; American Chemical Society: Washington, DC, USA, 1993. [Google Scholar]
- Dinse, A.; Aigner, M.; Ulbrich, M.; Johnson, G.R.; Bell, A.T. Effects of Mn promotion on the activity and selectivity of Co/SiO2 for Fischer–Tropsch Synthesis. J. Catal. 2012, 288, 104–114. [Google Scholar] [CrossRef]
- Tavasoli, A.; Khodadadi, A.; Mortazavi, Y.; Sadaghiani, K.; Ahangari, M. Lowering methane and raising distillates yields in Fischer–Tropsch synthesis by using promoted and unpromoted cobalt catalysts in a dual bed reactor. Fuel Process. Technol. 2006, 87, 641–647. [Google Scholar] [CrossRef]
- Komaya, T.; Bell, A.T. Estimates of rate coefficients for elementary processes occurring during Fischer-Tropsch synthesis over RuTiO2. J. Catal. 1994, 146, 237–248. [Google Scholar] [CrossRef]
- Kuipers, E.; Scheper, C.; Wilson, J.; Vinkenburg, I.; Oosterbeek, H. Non-ASF product distributions due to secondary reactions during Fischer–Tropsch synthesis. J. Catal. 1996, 158, 288–300. [Google Scholar] [CrossRef]
- Eliasson, B.; Kogelschatz, U.; Xue, B.; Zhou, L.-M. Hydrogenation of Carbon Dioxide to Methanol with a Discharge-Activated Catalyst. Ind. Eng. Chem. Res. 1998, 37, 3350–3357. [Google Scholar] [CrossRef]
- Li, M.-W.; Tian, Y.-L.; Xu, G.-H. Characteristics of Carbon Dioxide Reforming of Methane via Alternating Current (AC) Corona Plasma Reactions. Energy Fuels 2007, 21, 2335–2339. [Google Scholar] [CrossRef]
- Nozaki, T.; Muto, N.; Kado, S.; Okazaki, K. Dissociation of vibrationally excited methane on Ni catalyst: Part 1. Application to methane steam reforming. Catal. Today 2004, 89, 57–65. [Google Scholar] [CrossRef]
- Nozaki, T.; Muto, N.; Kadio, S.; Okazaki, K. Dissociation of vibrationally excited methane on Ni catalyst: Part 2. Process diagnostics by emission spectroscopy. Catal. Today 2004, 89, 67–74. [Google Scholar] [CrossRef]
- Pietruszka, B.; Anklam, K.; Heintze, M. Plasma-assisted partial oxidation of methane to synthesis gas in a dielectric barrier discharge. Appl. Catal. A-Gen. 2004, 261, 19–24. [Google Scholar] [CrossRef]
- Amouroux, J.; Cavadias, S.; Doubla, A. Carbon Dioxide reduction by non-equilibrium electrocatalysis plasma reactor. IOP Conf. Ser. Mater. Sci. Eng. 2011, 19, 012005. [Google Scholar] [CrossRef] [Green Version]
- Nikoo, M.K.; Sharifi, M.A.; Amin, N.S. Carbon dioxide reforming of methane by catalytic-plasma reactor over Cu/Zn/γ-Al2O3. J. Teknol. Sci. Eng. 2011, 56, 75–86. [Google Scholar]
- Chen, H.L.; Lee, H.M.; Chen, S.H.; Chang, M.B. Review of plasma catalysis on hydrocarbon reforming for hydrogen production—Interaction, integration, and prospects. Appl. Catal. B Environ. 2008, 85, 1–9. [Google Scholar] [CrossRef]
- Wang, Q.; Yan, B.-H.; Jin, Y.; Cheng, Y. Dry reforming of methane in a dielectric barrier discharge reactor with Ni/Al2O3 catalyst: Interaction of catalyst and plasma. Energy Fuels 2009, 23, 4196–4201. [Google Scholar] [CrossRef]
- Kappes, T.; Schiene, W.; Hammer, T. Energy balance of a Dielectric Barrier Discharge reactor for hydrocarbon steam reforming. In Proceedings of the HAKONE 8: International Symposium on High Pressure Low Temperature Plasma Chemistry, Puhajarve, Estonia, 21–25 July 2002. [Google Scholar]
- Sobacchi, M.; Saveliev, A.; Fridman, A.; Kennedy, L.A.; Ahmed, S.; Krause, T. Experimental assessment of a combined plasma/catalytic system for hydrogen production via partial oxidation of hydrocarbon fuels. Int. J. Hydrogen Energy 2002, 27, 635–642. [Google Scholar] [CrossRef]
- Li, M.-W.; Liu, C.-P.; Tian, Y.-L.; Xu, G.-H.; Zhang, F.-C.; Wang, Y.-Q. Effects of catalysts in carbon dioxide reforming of methane via corona plasma reactions. Energy Fuels 2006, 20, 1033–1038. [Google Scholar] [CrossRef]
- Pham, M.; Goujard, V.; Tatibouet, J.; Batiot-Dupeyrat, C. Activation of methane and carbon dioxide in a dielectric-barrier discharge-plasma reactor to produce hydrocarbons—Influence of La2O3/γ-Al2O3 catalyst. Catal. Today 2011, 171, 67–71. [Google Scholar] [CrossRef]
- Wallis, A.E.; Whitehead, J.; Zhang, K. The removal of dichloromethane from atmospheric pressure air streams using plasma-assisted catalysis. Appl. Catal. B Environ. 2007, 72, 282–288. [Google Scholar] [CrossRef]
- Bodke, A.; Bharadwaj, S.; Schmidt, L. The effect of ceramic supports on partial oxidation of hydrocarbons over noble metal coated monoliths. J. Catal. 1998, 179, 138–149. [Google Scholar] [CrossRef]
- Iglesia, E.; Reyes, S.C.; Madon, R.J. Transport-enhanced α-olefin readsorption pathways in Ru-catalyzed hydrocarbon synthesis. J. Catal. 1991, 129, 238–256. [Google Scholar] [CrossRef]
- Tavasoli, A.; Sadaghiani, K.; Nakhaeipour, A.; Ghalbi Ahangari, M. Cobalt Loading Effects on the Structure and Activity for Fischer–Tropsch and Water–gas Shift Reactions of Co/Al2O3 Catalysts. Iran. J. Chem. Chem. Eng. 2007, 26, 9–16. [Google Scholar]
- Yang, J.; Ma, W.; Chen, D.; Holmen, A.; Davis, B.H. Fischer–Tropsch synthesis: A review of the effect of CO conversion on methane selectivity. Appl. Catal. A Gen. 2014, 470, 250–260. [Google Scholar] [CrossRef]
- Sinnott, S.; Andrews, R.; Qian, D.; Rao, A.; Mao, Z.; Dickey, E.; Derbyshire, F. Model of carbon nanotube growth through chemical vapor deposition. Chem. Phys. Lett. 1999, 315, 25–30. [Google Scholar] [CrossRef]
- Kunhardt, E.E. Generation of large-volume, atmospheric-pressure, nonequilibrium plasmas. IEEE Trans. Plasma Sci. 2000, 28, 189–200. [Google Scholar] [CrossRef]
- Staack, D.; Farouk, B.; Gutsol, A.; Fridman, A. Characterization of a dc atmospheric pressure normal glow discharge. Plasma Sources Sci. Technol. 2005, 14, 700. [Google Scholar] [CrossRef]
- Fan, H.Y. The transition from glow discharge to arc. Phys. Rev. 1939, 55, 769. [Google Scholar] [CrossRef]
- Van Durme, J.; Dewulf, J.; Sysmans, W.; Leys, C.; Van Langenhove, H. Efficient toluene abatement in indoor air by a plasma catalytic hybrid system. Appl. Catal. B Environ. 2007, 74, 161–169. [Google Scholar] [CrossRef]
- Chen, H.L.; Lee, H.M.; Chen, S.H.; Chang, M.B.; Yu, S.J.; Li, S.N. Removal of Volatile Organic Compounds by Single-Stage and Two-Stage Plasma Catalysis Systems: A Review of the Performance Enhancement Mechanisms, Current Status, and Suitable Applications. Environ. Sci. Technol. 2009, 43, 2216–2227. [Google Scholar] [CrossRef]
- Neyts, E.; Bogaerts, A. Understanding plasma catalysis through modelling and simulation—A review. J. Phys. D Appl. Phys. 2014, 47, 224010. [Google Scholar] [CrossRef]
- Benilov, M.; Marotta, A. A model of the cathode region of atmospheric pressure arcs. J. Phys. D Appl. Phys. 1995, 28, 1869–1882. [Google Scholar] [CrossRef]
- Benilov, M. Understanding and modelling plasma–electrode interaction in high-pressure arc discharges: A review. J. Phys. D Appl. Phys. 2008, 41, 144001. [Google Scholar] [CrossRef] [Green Version]
- Bakhtiari, M.; Khorasheh, F.; Zamanian, A.; Nakhaeipour, A.; Irani, M. Preparation, Evaluation and Characterization of Monolithic Catalysts for Fischer-Tropsch Synthesis. Pet. Coal 2008, 50, 56–61. [Google Scholar]
- De la Pena O’Shea, V.A.; Alvarez-Galvan, M.; Campos-Martin, J.; Fierro, J. Strong dependence on pressure of the performance of a Co/SiO2 catalyst in Fischer–Tropsch slurry reactor synthesis. Catal. Lett. 2005, 100, 105–116. [Google Scholar] [CrossRef]
- Akay, G. Co-Assembled Supported Catalysts: Synthesis of Nano-Structured Supported Catalysts with Hierarchic Pores through Combined Flow and Radiation Induced Co-Assembled Nano-Reactors. Catalysts 2016, 6, 80. [Google Scholar] [CrossRef] [Green Version]
- Cheng, D.-G. Plasma decomposition and reduction in supported metal catalyst preparation. Catal. Surv. Asia 2008, 12, 145–151. [Google Scholar] [CrossRef]
- Cheng, D.-G.; Zhu, X.; Ben, Y.; He, F.; Cui, L.; Liu, C.-J. Carbon dioxide reforming of methane over Ni/Al2O3 treated with glow discharge plasma. Catal. Today 2006, 115, 205–210. [Google Scholar] [CrossRef]
- Zhang, Y.-P.; Ma, P.-S.; Zhu, X.; Liu, C.-J.; Shen, Y. A novel plasma-treated Pt/NaZSM-5 catalyst for NO reduction by methane. Catal. Commun. 2004, 5, 35–39. [Google Scholar] [CrossRef]
- Jacobs, G.; Das, T.K.; Zhang, Y.; Li, J.; Racoillet, G.; Davis, B.H. Fischer–Tropsch synthesis: Support, loading, and promoter effects on the reducibility of cobalt catalysts. Appl. Catal. A Gen. 2002, 233, 263–281. [Google Scholar] [CrossRef]
- Jacobs, G.; Patterson, P.M.; Zhang, Y.; Das, T.; Li, J.; Davis, B.H. Fischer–Tropsch synthesis: Deactivation of noble metal-promoted Co/Al2O3 catalysts. Appl. Catal. A Gen. 2002, 233, 215–226. [Google Scholar] [CrossRef]
- Abbaslou, R.M.M.; Tavassoli, A.; Soltan, J.; Dalai, A.K. Iron catalysts supported on carbon nanotubes for Fischer–Tropsch synthesis: Effect of catalytic site position. Appl. Catal. A Gen. 2009, 367, 47–52. [Google Scholar] [CrossRef]
- Tavasoli, A.; Abbaslou, R.M.M.; Trepanier, M.; Dalai, A.K. Fischer–Tropsch synthesis over cobalt catalyst supported on carbon nanotubes in a slurry reactor. Appl. Catal. A Gen. 2008, 345, 134–142. [Google Scholar] [CrossRef]
- Xiong, H.; Motchelaho, M.A.; Moyo, M.; Jewell, L.L.; Coville, N.J. Correlating the preparation and performance of cobalt catalysts supported on carbon nanotubes and carbon spheres in the Fischer–Tropsch synthesis. J. Catal. 2011, 278, 26–40. [Google Scholar] [CrossRef]
- Trépanier, M.; Tavasoli, A.; Dalai, A.K.; Abatzoglou, N. Co, Ru and K loadings effects on the activity and selectivity of carbon nanotubes supported cobalt catalyst in Fischer–Tropsch synthesis. Appl. Catal. A Gen. 2009, 353, 193–202. [Google Scholar] [CrossRef]
- Trépanier, M.; Tavasoli, A.; Dalai, A.K.; Abatzoglou, N. Fischer–Tropsch synthesis over carbon nanotubes supported cobalt catalysts in a fixed bed reactor: Influence of acid treatment. Fuel Process. Technol. 2009, 90, 367–374. [Google Scholar] [CrossRef]
- Tavasoli, A.; Trépanier, M.; Abbaslou, R.M.M.; Dalai, A.K.; Abatzoglou, N. Fischer–Tropsch synthesis on mono-and bimetallic Co and Fe catalysts supported on carbon nanotubes. Fuel Process. Technol. 2009, 90, 1486–1494. [Google Scholar] [CrossRef]
- Guczi, L.; Stefler, G.; Geszti, O.; Koppány, Z.; Kónya, Z.; Molnár, É.; Urbán, M.; Kiricsi, I. CO hydrogenation over cobalt and iron catalysts supported over multiwall carbon nanotubes: Effect of preparation. J. Catal. 2006, 244, 24–32. [Google Scholar] [CrossRef]
- Bahome, M.C.; Jewell, L.L.; Padayachy, K.; Hildebrandt, D.; Glasser, D.; Datye, A.K.; Coville, N.J. Fe-Ru small particle bimetallic catalysts supported on carbon nanotubes for use in Fischer–Tröpsch synthesis. Appl. Catal. A Gen. 2007, 328, 243–251. [Google Scholar] [CrossRef]
- Bezemer, G.; Van Laak, A.; Van Dillen, A.; De Jong, K. Cobalt supported on carbon nanofibers-a promising novel Fischer-Tropsch catalyst. Stud. Surf. Sci. Catal. 2004, 147, 259–264. [Google Scholar]
- Eschemann, T.O.; Lamme, W.S.; Manchester, R.L.; Parmentier, T.E.; Cognigni, A.; Rønning, M.; de Jong, K.P. Effect of support surface treatment on the synthesis, structure, and performance of Co/CNT Fischer–Tropsch catalysts. J. Catal. 2015, 328, 130–138. [Google Scholar] [CrossRef]
- Kumar, M.; Ando, Y. Chemical vapor deposition of carbon nanotubes: A review on growth mechanism and mass production. J. Nanosci. Nanotechnol. 2010, 10, 3739–3758. [Google Scholar] [CrossRef] [Green Version]
- Meyyappan, M.; Delzeit, L.; Cassell, A.; Hash, D. Carbon nanotube growth by PECVD: A review. Plasma Sources Sci. Technol. 2003, 12, 205. [Google Scholar] [CrossRef]
- Meyyappan, M. A review of plasma enhanced chemical vapour deposition of carbon nanotubes. J. Phys. D Appl. Phys. 2009, 42, 213001. [Google Scholar] [CrossRef]
- Kuzmany, H.; Kukovecz, A.; Simon, F.; Holzweber, M.; Kramberger, C.; Pichler, T. Functionalization of carbon nanotubes. Synth. Met. 2004, 141, 113–122. [Google Scholar] [CrossRef]
- Bell, M.S.; Teo, K.B.; Lacerda, R.G.; Milne, W.; Hash, D.B.; Meyyappan, M. Carbon nanotubes by plasma-enhanced chemical vapor deposition. Pure Appl. Chem. 2006, 78, 1117–1125. [Google Scholar] [CrossRef]
- Hou, Y.; Tang, J.; Zhang, H.; Qian, C.; Feng, Y.; Liu, J. Functionalized few-walled carbon nanotubes for mechanical reinforcement of polymeric composites. ACS Nano 2009, 3, 1057–1062. [Google Scholar] [CrossRef] [PubMed] [Green Version]
- Jeon, I.-Y.; Chang, D.W.; Kumar, N.A.; Baek, J.-B. Functionalization of Carbon Nanotubes. In Carbon Nanotubes—Polymer Nanocomposites; Yellampalli, D.S., Ed.; InTech: Rijeka, Croatia, 2011. [Google Scholar]
- Prasek, J.; Drbohlavova, J.; Chomoucka, J.; Hubalek, J.; Jasek, O.; Adam, V.; Kizek, R. Methods for carbon nanotubes synthesis—Review. J. Mater. Chem. 2011, 21, 15872–15884. [Google Scholar] [CrossRef]
- Shi, H.; Barker, J.; Saidi, M.; Koksbang, R.; Morris, L. Graphite structure and lithium intercalation. J. Power Sources 1997, 68, 291–295. [Google Scholar] [CrossRef]
- Nakamura, J.; Tanaka, K.-i.; Toyoshima, I. Reactivity of deposited carbon on Co-Al2O3 catalyst. J. Catal. 1987, 108, 55–62. [Google Scholar] [CrossRef]
- Tan, K.F.; Xu, J.; Chang, J.; Borgna, A.; Saeys, M. Carbon deposition on Co catalysts during Fischer–Tropsch synthesis: A computational and experimental study. J. Catal. 2010, 274, 121–129. [Google Scholar] [CrossRef]
- Keyvanloo, K.; Fisher, M.J.; Hecker, W.C.; Lancee, R.J.; Jacobs, G.; Bartholomew, C.H. Kinetics of deactivation by carbon of a cobalt Fischer–Tropsch catalyst: Effects of CO and H2 partial pressures. J. Catal. 2015, 327, 33–47. [Google Scholar] [CrossRef]
- Potoczna-Petru, D. The interaction of model cobalt catalysts with carbon. Carbon 1991, 29, 73–79. [Google Scholar] [CrossRef]
- Lee, D.-K.; Lee, J.-H.; Ihm, S.-K. Effect of carbon deposits on carbon monoxide hydrogenation over alumina-supported cobalt catalyst. Appl. Catal. 1988, 36, 199–207. [Google Scholar] [CrossRef]
- Deprez, N.; McLachlan, D. The analysis of the electrical conductivity of graphite conductivity of graphite powders during compaction. J. Phys. D Appl. Phys. 1988, 21, 101. [Google Scholar] [CrossRef]
- Benilov, M.; Naidis, G. Modelling of low-current discharges in atmospheric-pressure air taking account of non-equilibrium effects. J. Phys. D Appl. Phys. 2003, 36, 1834. [Google Scholar] [CrossRef] [Green Version]
- Kogelschatz, U. Atmospheric-pressure plasma technology. Plasma Phys. Control. Fusion 2004, 46, B63. [Google Scholar] [CrossRef]
- Arkhipenko, V.; Kirillov, A.; Safronau, Y.A.; Simonchik, L.; Zgirouski, S. Self-sustained dc atmospheric pressure normal glow discharge in helium: From microamps to amps. Plasma Sources Sci. Technol. 2009, 18, 045013. [Google Scholar] [CrossRef]
- Lebouvier, A.; Iwarere, S.A.; Ramjugernath, D.; Fulcheri, L. 3D magnetohydrodynamic modelling of a dc low-current plasma arc batch reactor at very high pressure in helium. J. Phys. D Appl. Phys. 2013, 46, 145203. [Google Scholar] [CrossRef]
- Huang, H.; Ye, D.; Leung, D.Y.; Feng, F.; Guan, X. Byproducts and pathways of toluene destruction via plasma-catalysis. J. Mol. Catal. A Chem. 2011, 336, 87–93. [Google Scholar] [CrossRef]
- Mizuno, A. Generation of non-thermal plasma combined with catalysts and their application in environmental technology. Catal. Today 2013, 211, 2–8. [Google Scholar] [CrossRef]
- Whitehead, J.C. Plasma catalysis: A solution for environmental problems. Pure Appl. Chem. 2010, 82, 1329–1336. [Google Scholar] [CrossRef]
- Kim, H.H. Nonthermal plasma processing for air-pollution control: A historical review, current issues, and future prospects. Plasma Process. Polym. 2004, 1, 91–110. [Google Scholar] [CrossRef]
- Chang, M.B.; Lee, H.M. Abatement of perfluorocarbons with combined plasma catalysis in atmospheric-pressure environment. Catal. Today 2004, 89, 109–115. [Google Scholar] [CrossRef]
- Yu, S.J.; Chang, M.B. Oxidative conversion of PFC via plasma processing with dielectric barrier discharges. Plasma Chem. Plasma Process. 2001, 21, 311–327. [Google Scholar] [CrossRef]
- Chen, X.; Rozak, J.; Lin, J.-C.; Suib, S.L.; Hayashi, Y.; Matsumoto, H. Oxidative decomposition of chlorinated hydrocarbons by glow discharge in PACT (plasma and catalyst integrated technologies) reactors. Appl. Catal. A-Gen. 2001, 219, 25–31. [Google Scholar] [CrossRef]
- Rueangjitt, N.; Sreethawong, T.; Chavadej, S.; Sekiguchi, H. Non-oxidative reforming of methane in a mini-gliding arc discharge reactor: Effects of feed methane concentration, feed flow rate, electrode gap distance, residence time, and catalyst distance. Plasma Chem. Plasma Process. 2011, 31, 517–534. [Google Scholar] [CrossRef]
- Rueangjitt, N.; Sreethawong, T.; Chavadej, S.; Sekiguchi, H. Plasma-catalytic reforming of methane in AC microsized gliding arc discharge: Effects of input power, reactor thickness, and catalyst existence. Chem. Eng. J. 2009, 155, 874–880. [Google Scholar] [CrossRef]
- Hilmen, A.-M.; Bergene, E.; Lindvåg, O.; Schanke, D.; Eri, S.; Holmen, A. Fischer–Tropsch synthesis on monolithic catalysts of different materials. Catal. Today 2001, 69, 227–232. [Google Scholar] [CrossRef]
- Hilmen, A.-M.; Bergene, E.; Lindvåg, O.; Schanke, D.; Eri, S.; Holmen, A. Fischer-Tropsch synthesis using monolithic catalysts. Stud. Surf. Sci. Catal. 2000, 130, 1163–1168. [Google Scholar]
- De Deugd, R.M.; Chougule, R.B.; Kreutzer, M.T.; Meeuse, F.M.; Grievink, J.; Kapteijn, F.; Moulijn, J.A. Is a monolithic loop reactor a viable option for Fischer–Tropsch synthesis? Chem. Eng. Sci. 2003, 58, 583–591. [Google Scholar] [CrossRef]
- De Deugd, R.M.; Kapteijn, F.; Moulijn, J.A. Using monolithic catalysts for highly selective Fischer–Tropsch synthesis. Catal. Today 2003, 79, 495–501. [Google Scholar] [CrossRef]
- Kapteijn, F.; de Deugd, R.M.; Moulijn, J. A Fischer–Tropsch synthesis using monolithic catalysts. Catal. Today 2005, 105, 350–356. [Google Scholar] [CrossRef]
- Guettel, R.; Knochen, J.; Kunz, U.; Kassing, M.; Turek, T. Preparation and Catalytic Evaluation of Cobalt-Based Monolithic and Powder Catalysts for Fischer−Tropsch Synthesis. Ind. Eng. Chem. Res. 2008, 47, 6589–6597. [Google Scholar] [CrossRef]
- Liu, W.; Hu, J.; Wang, Y. Fischer–Tropsch synthesis on ceramic monolith-structured catalysts. Catal. Today 2009, 140, 142–148. [Google Scholar] [CrossRef]
- Avila, P.; Montes, M.; Miro, E.E. Monolithic reactors for environmental applications: A review on preparation technologies. Chem. Eng. J. 2005, 109, 11–36. [Google Scholar] [CrossRef]
- Panneerselvam, M.; Rao, K. Novel microwave method for the synthesis and sintering of mullite from kaolinite. Chem. Mater. 2003, 15, 2247–2252. [Google Scholar] [CrossRef]
- Chaudhuri, S.; Patra, S.; Chakraborty, A. Electrical resistivity of transition metal ion doped mullite. J. Eur. Ceram. Soc. 1999, 19, 2941–2950. [Google Scholar] [CrossRef]
- Schneider, H.; Schreuer, J.; Hildmann, B. Structure and properties of mullite—A review. J. Eur. Ceram. Soc. 2008, 28, 329–344. [Google Scholar] [CrossRef]
- Liguras, D.K.; Goundani, K.; Verykios, X.E. Production of hydrogen for fuel cells by catalytic partial oxidation of ethanol over structured Ni catalysts. J. Power Sources 2004, 130, 30–37. [Google Scholar] [CrossRef]
- Zhao, X.; Cong, Y.; Lv, F.; Li, L.; Wang, X.; Zhang, T. Mullite-supported Rh catalyst: A promising catalyst for the decomposition of N2O propellant. Chem. Commun. 2010, 46, 3028–3030. [Google Scholar] [CrossRef]
- Schimmoeller, B.; Schulz, H.; Pratsinis, S.E.; Bareiss, A.; Reitzmann, A.; Kraushaar-Czarnetzki, B. Ceramic foams directly-coated with flame-made V2O5/TiO2 for synthesis of phthalic anhydride. J. Catal. 2006, 243, 82–92. [Google Scholar] [CrossRef] [Green Version]
- Villegas, L.; Masset, F.; Guilhaume, N. Wet impregnation of alumina-washcoated monoliths: Effect of the drying procedure on Ni distribution and on autothermal reforming activity. Appl. Catal. A-Gen. 2007, 320, 43–55. [Google Scholar] [CrossRef]
- Holmen, A.; Venvik, H.J.; Myrstad, R.; Zhu, J.; Chen, D. Monolithic, microchannel and carbon nanofibers/carbon felt reactors for syngas conversion by Fischer-Tropsch synthesis. Catal. Today 2013, 216, 150–157. [Google Scholar] [CrossRef]


| Operating Parameters | Pressure Variation Study | Current Variation Study | Electrode Gap Variation Study | |
|---|---|---|---|---|
| Discharge time (s) | 10 | 60 | 60 | 60 |
| Ignition current (mA) | 350 | 350 | 250, 300, 350, 400, 450 | 350 |
| Ignition voltage (kV) | 8 | 8 | 8 | 8 |
| Electrode gap (mm) | 1 | 1 | 1 | 0.5, 1.0, 1.5, 2.0 |
| Pressure (MPa) | 0.5, 1, 2, 3, 4, 5, 6, 7, 8, 9, 10 | 0.5,1, 2, 3, 4, 5, 6, 7, 8, 9, 10 | 2 | 2 |
| H2/CO ratio | 2.2:1 | 2.2:1 | 2.2:1 | 2.2:1 |
| Product | Conc. (ppm) at 10 s | Conc. (ppm) at 60 s | ||||||||||
|---|---|---|---|---|---|---|---|---|---|---|---|---|
| Blank | 2 wt% Co | 6 wt% Co | Blank | 2 wt% Co | 6 wt% Co | |||||||
| 1 MPa | 10 MPa | 1 MPa | 10 MPa | 1 MPa | 10 MPa | 2 MPa | 10 MPa | 2 MPa | 10 MPa | 2 MPa | 6 MPa | |
| Methane | 14 | 60 | 68 | 2428 | 1526 | 5200 | 31 | 269 | 2266 | 7836 | 2194 | 3749 |
| C2 hydrocarbons | ||||||||||||
| Ethane | 0.4 | 0.2 | 2,8 | 19 | 57 | 57 | 0.8 | 0.8 | 95 | 64 | 135 | 42 |
| Ethylene | 0.05 | 0.1 | 0.7 | 1.6 | 39 | 5 | 0.1 | 0.1 | 52 | 9.6 | 54 | 9.0 |
| C3 hydrocarbons | ||||||||||||
| Propane | 0.0 | 0.0 | 0.1 | 4.5 | 1.3 | 11.7 | 0.0 | 0.1 | 1.2 | 6.6 | 2.5 | 3.3 |
| Propylene | 0.0 | 0.0 | 0.0 | 0.0 | 0.0 | 4.8 | 0.0 | 0.0 | 0.0 | 0.0 | 4.3 | 2.4 |
| Product ratio | ||||||||||||
| Methane/ethane | 32 | 308 | 24 | 125 | 27 | 92 | 39 | 317 | 24 | 123 | 16 | 89 |
| Ethane/ethylene | 8.7 | 2.4 | 4.0 | 12.2 | 1.5 | 11.5 | 11.1 | 10.9 | 1.8 | 6.6 | 2.5 | 4.7 |
| Specific required energy (MJ/molCH4,produced) | ||||||||||||
| 99,179 | 3375 | 23,666 | 84 | 950 | 38 | 167,334 | 4432 | 2148 | 152 | 1991 | 448 | |
| Mechanical | Thermal | ||
|---|---|---|---|
| Alumina content | 72 wt% | Max. temperature | 1400 °C |
| Other constituents | Silica (bound) | Thermal conductivity | 5 Wm−1 K−1 |
| Bulk density | 2.7–2.8 g/cm3 | Thermal expansion: | |
| Porosity | 15% | at 400 °C | 4.68 × 10⁻⁶ °C−1 |
| Water absorption | 6–8% | at 800 °C | 5.54 × 10⁻⁶ °C−1 |
| Modulus of rupture | 100 MPa | at 1000 °C | 5.88 × 10⁻⁶ °C−1 |
| Modulus of elasticity | 140 GPa | - | - |
Publisher’s Note: MDPI stays neutral with regard to jurisdictional claims in published maps and institutional affiliations. |
© 2021 by the authors. Licensee MDPI, Basel, Switzerland. This article is an open access article distributed under the terms and conditions of the Creative Commons Attribution (CC BY) license (https://creativecommons.org/licenses/by/4.0/).
Share and Cite
Govender, B.B.; Iwarere, S.A.; Ramjugernath, D. The Effect of Cobalt Catalyst Loading at Very High Pressure Plasma-Catalysis in Fischer-Tropsch Synthesis. Catalysts 2021, 11, 1324. https://doi.org/10.3390/catal11111324
Govender BB, Iwarere SA, Ramjugernath D. The Effect of Cobalt Catalyst Loading at Very High Pressure Plasma-Catalysis in Fischer-Tropsch Synthesis. Catalysts. 2021; 11(11):1324. https://doi.org/10.3390/catal11111324
Chicago/Turabian StyleGovender, Byron Bradley, Samuel Ayodele Iwarere, and Deresh Ramjugernath. 2021. "The Effect of Cobalt Catalyst Loading at Very High Pressure Plasma-Catalysis in Fischer-Tropsch Synthesis" Catalysts 11, no. 11: 1324. https://doi.org/10.3390/catal11111324
APA StyleGovender, B. B., Iwarere, S. A., & Ramjugernath, D. (2021). The Effect of Cobalt Catalyst Loading at Very High Pressure Plasma-Catalysis in Fischer-Tropsch Synthesis. Catalysts, 11(11), 1324. https://doi.org/10.3390/catal11111324