Article

The Electrochemical Behaviour of Quaternary Amine-Based Room-Temperature Ionic Liquid N4111(TFSI)

1
Institute of Chemistry, University of Tartu, Ravila 14a, 50411 Tartu, Estonia
2
Institute of Physics, University of Tartu, W. Ostwaldi 1, 50411 Tartu, Estonia
*
Author to whom correspondence should be addressed.
Catalysts 2021, 11(11), 1315; https://doi.org/10.3390/catal11111315
Submission received: 18 October 2021 / Revised: 28 October 2021 / Accepted: 29 October 2021 / Published: 30 October 2021

Abstract

:
In this study, we used the in situ X-ray photoelectron spectroscopy (XPS), in situ mass spectroscopy, cyclic voltammetry and electrochemical impedance spectroscopy methods, for the first time, in a detailed exploration of the electrochemical behaviour of a quaternary amine cation-based room-temperature ionic liquid, butyl-trimethyl-ammonium bis(trifluoromethylsulfonyl)imide (N4111(TFSI)), at the negatively and positively polarised molybdenum carbide-derived micro-mesoporous carbon (mmp-C(Mo2C)) electrodes that can be used as high surface area supporting material for electrocatalysts. The shapes of the C 1s, N 1s, O 1s, F 1s and S 2p XPS spectra were stable for N4111(TFSI) within a very wide potential range. The XPS data indicated the non-specific adsorption character of the cations and anions in the potential range from −2.00 V to 0.00 V. Thus, this region can be used for the detailed analysis of catalytic reaction mechanisms. We observed strong adsorption from 0.00 V to 1.80 V, and at E > 1.80 V, very strong adsorption of the N4111(TFSI) at the mmp-C(Mo2C) took place. At more negative potentials than −2.00 V, the formation of a surface layer containing both N4111+ cations and TFSI anions was established with the formation of various gaseous compounds. Collected data indicated the electrochemical instability of the N4111+ cation at E < −2.00 V.

1. Introduction

The electrochemical properties of a quaternary ammonium cation-based room-temperature ionic liquid (RTIL), butyl-trimethyl-ammonium bis(trifluoromethylsulfonyl)imide, or N4111(TFSI) (CAS number 945715-39-9), have been investigated in some studies. The N4111+ cation and/or TFSI anion have been found to have very high electrochemical stability and these ions have been recommended for use as electrolyte counterparts in the electrodeposition of metals [1,2,3,4,5,6], and N4111(TFSI) as an aprotic electrolyte in studies of electrochemical processes [7,8,9,10], in electrical power sources or even in high-capacity electrical energy storage systems [11,12]. RTILs have also received attention as electrolytes in the electrocatalytical reduction of CO2 [13,14,15] or electrocatalytical oxidation of water [16]. However, it is important to critically analyse the electrochemical activity and stability of the electrocatalytic platinum nanoparticles in ionic liquids [17]. Additionally, it has been observed that N4111+ cations and TFSI anions tend to electro-reduce at very negative potentials [9,18,19,20,21,22,23,24]. Despite many non-operando electrochemical studies [9,18,19,20,21,22,23,24], detailed information about the starting potentials of the electrochemical processes and the information about the character of the adsorption of the N4111(TFSI) ions at various electrode materials is lacking. Moreover, the sensitivity of N4111+ cation and TFSI anion characteristics in the presence of the residual water in the RTIL is still not clear.
Therefore, N4111(TFSI) containing 80 ppm residual water and the same RTIL carefully dried by heating in the vacuum were selected for detailed investigations of the electrochemical behaviour within a wide potential region. The dried and undried N4111(TFSI) RTILs were both characterised electrochemically at negatively and positively polarised micro-mesoporous molybdenum carbide-derived carbon (mm-C(Mo2C)) electrodes applying in situ X-ray photoelectron spectroscopy (XPS), in situ mass spectroscopy (MS), cyclic voltammetry (CV) and potentiostatic electrochemical impedance spectroscopy (EIS) methods.
Collected data indicate that a surface layer seems to form at the mmp-C(Mo2C) electrode at E ≤ −2.0 V (vs. Ag quasi reference electrode, Ag-QRE). During polarisation of the N4111(TFSI)|mmp-C(Mo2C) interface, the formation of a new F 1s PE peak at E = −3.75 V (vs. Ag-QRE) was observed, likely corresponding to the formation of N4111F. At more negative potentials (E < −4.0 V), small tails in the N 1s, O 1s and S 2p3/2 PE peaks formed.
The in situ XPS measurements performed at positively charged mmp-C(Mo2C) electrodes surprisingly indicated that N4111(TFSI) started to adsorb specifically already at E > 0.00 V (vs. Ag-QRE). The very strong specific adsorption started at E ≥ 2.00 V (vs. Ag-QRE), when the oxidation current values started to increase.
Thus, our data indicate the complicated electrochemical behaviour of the N4111(TFSI) RTIL at the mmp-C(Mo2C) electrode.

2. Results and Discussion

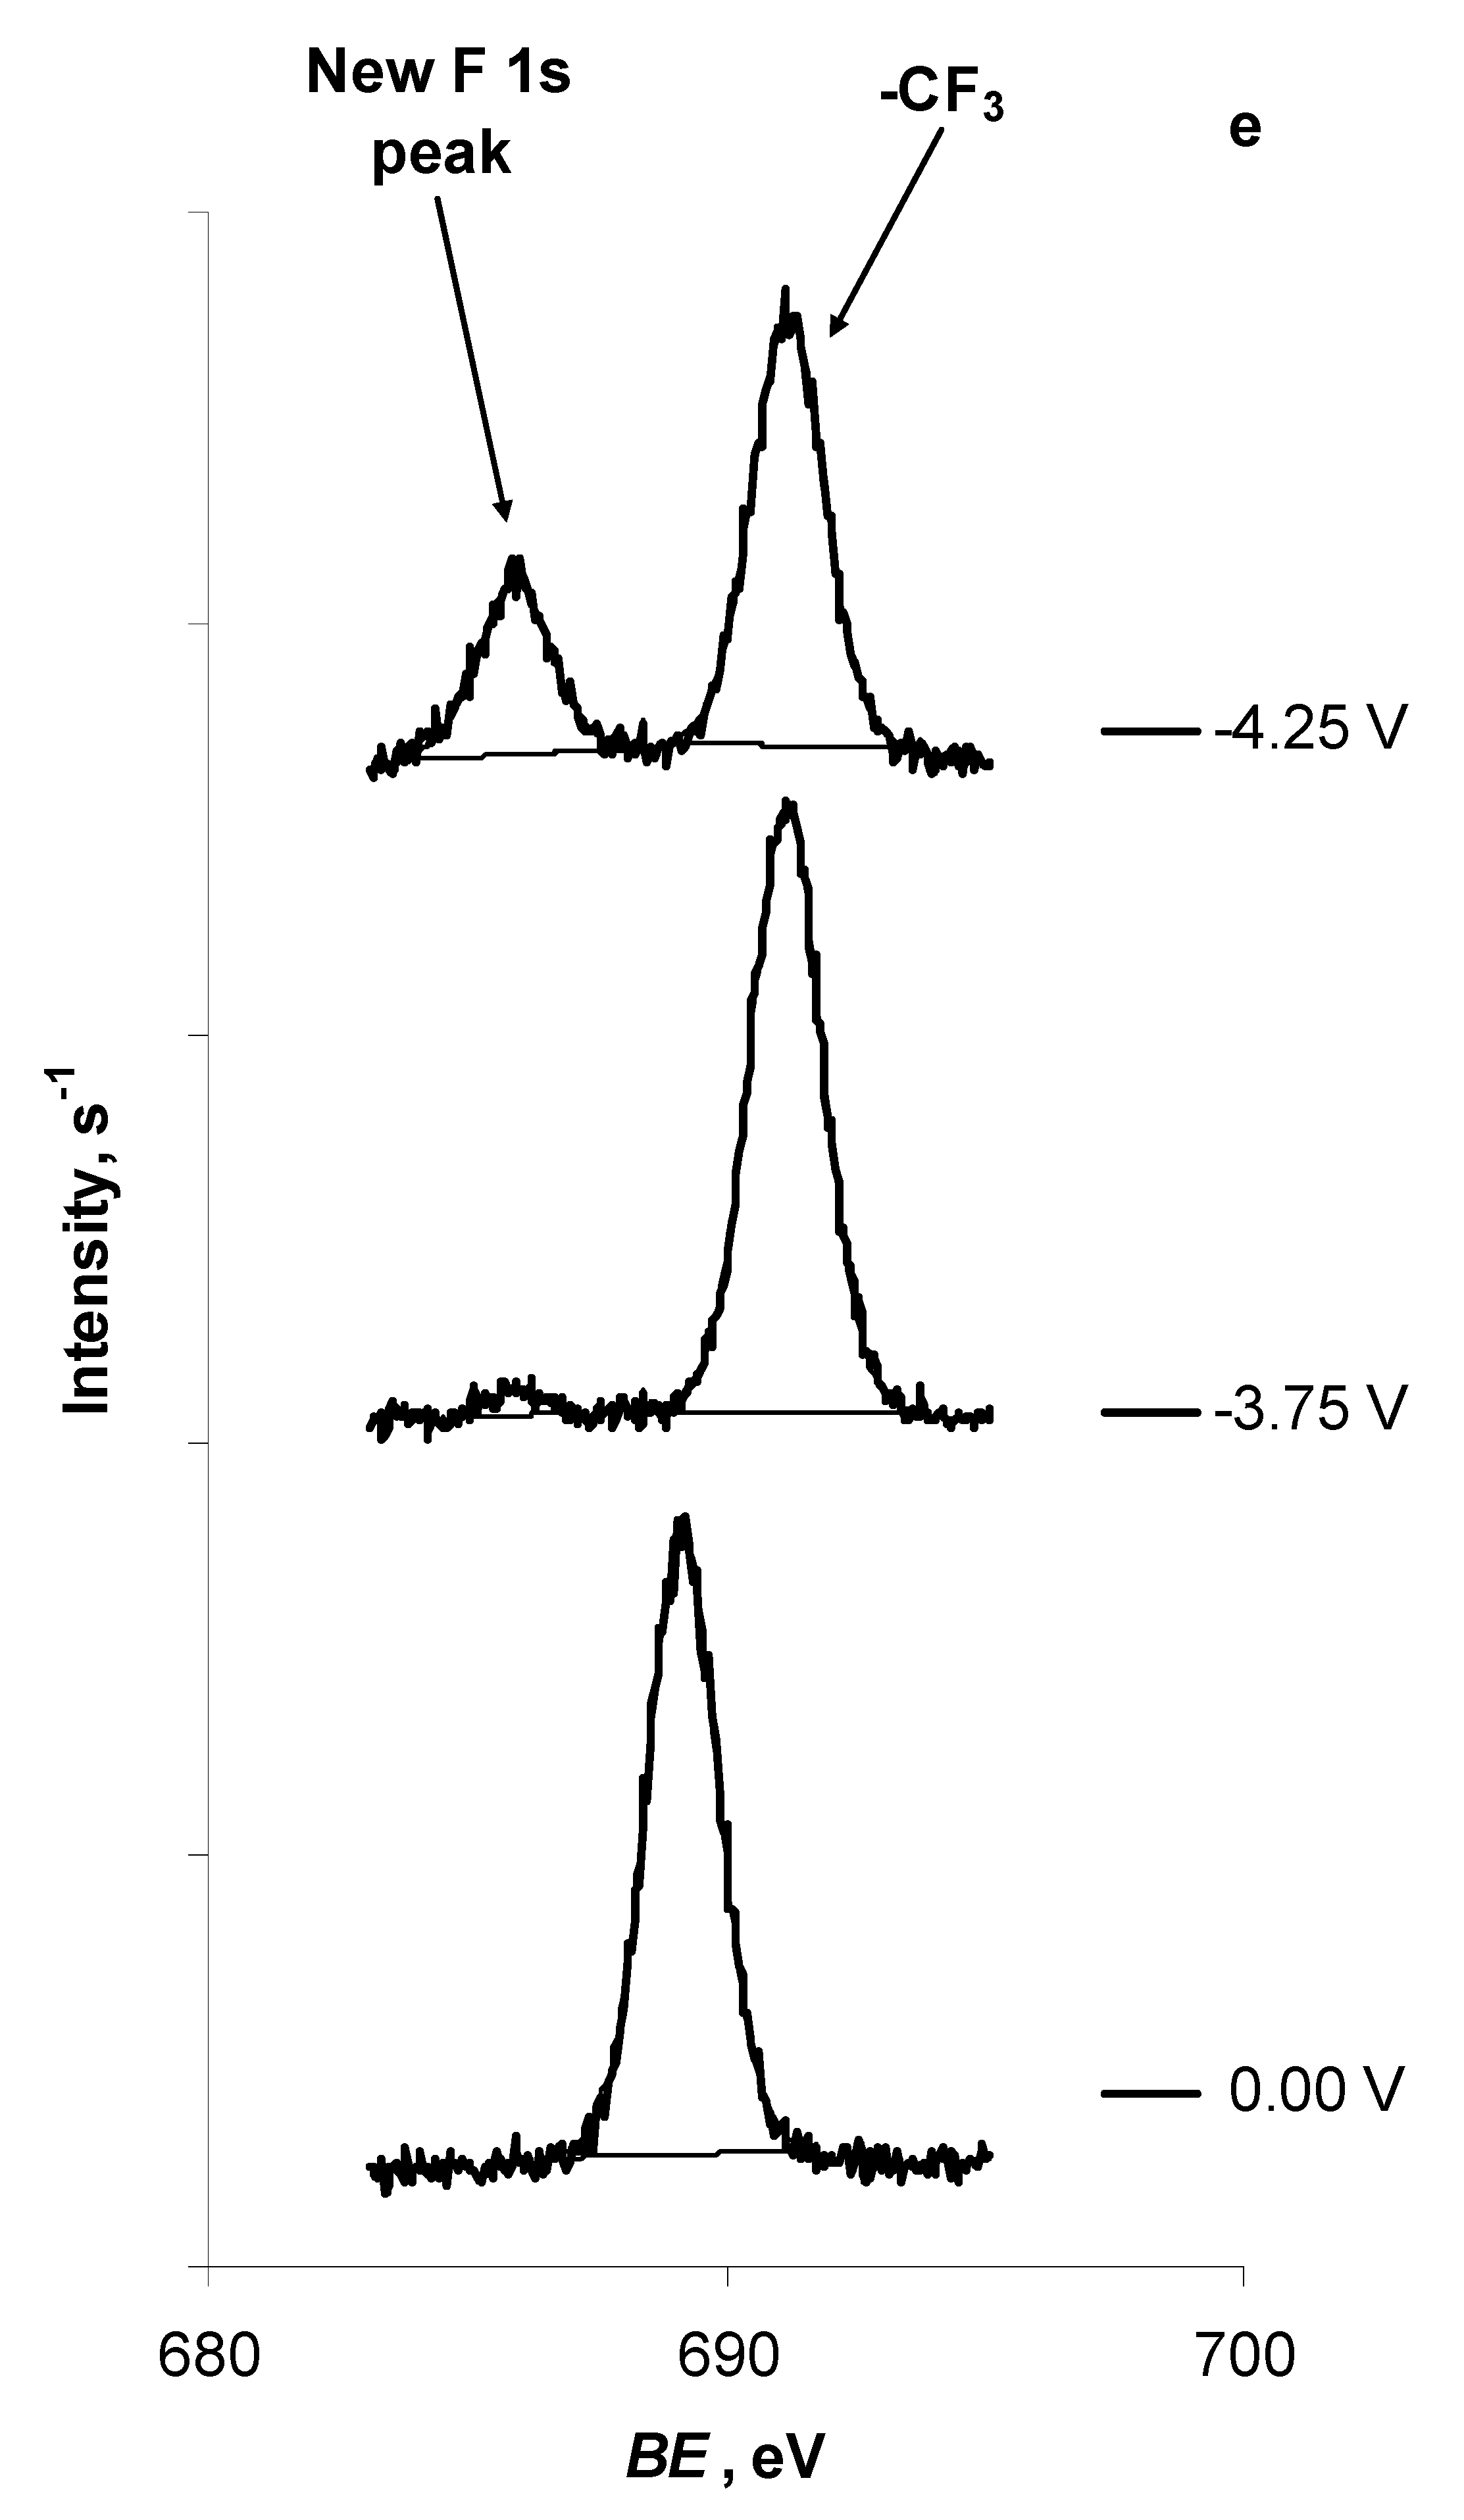
2.1. In Situ XPS Measurements of N4111(TFSI) at the Negatively Polarised mmp-C(Mo2C) Electrode

The BE spectra were recorded within the potential range from 0.00 V to −4.00 V for C 1s and S 2p, and from 0.00 V to −4.25 V for N 1s, O 1s and F 1s signals (Figure 1a–e). At E = −4.25 V, the gas evolution became too intensive for the continuing of the in situ XPS measurements. Collected information shows that the C 1s signal was stable throughout the potential range applied (Figure 1a). However, small tails formed at the lower BE side in the XPS peaks at E ≤ −4.25 V for the TFSI anion nitrogen N 1s (Figure 1b), at E ≤ −4.25 V for TFSI anion O 1s (Figure 1c) and at E ≤ −4.00 V for TFSI anion S 2p3/2 (Figure 1d) PE peak (Table 1). Fitting of the XPS data indicated the formation of a new peak for N 1s at BE = 399.75 eV (E = −3.25 V), likely corresponding to nitride (N3−), observed also by high-resolution XPS at the deposited Li surface [9,25,26]. Formation of a tail in the O 1s PE peak at E ≤ −4.25V, at BE = 532.15 eV, could have resulted from the hydroxide anion formation (formed in the electroreduction process of the trace water in N4111(TFSI)) and the following attack to TFSI anion [27,28,29] (Figure 1c and Table 1). New S 2p spin-orbit split peaks, notable at E = −4.00 V and located at BE = 167.85 eV and BE = 169.25 eV, can indicate the formation of sulphone and/or sulphite species [9,25] (Figure 1d, Table 1).
At E = −3.75 V (E = ca. 0 V vs. Li/Li+), a new F 1s PE peak (BE = 685.90 eV) formed (Figure 1e and Table 1), likely corresponding to N4111F. The intensity of this new F 1s PE peak increased notably as the mmp-C(Mo2C) electrode potential became more negative. Thus, the observation of the formation of new N 1s, F 1s and S 2p PE peaks is in agreement with earlier literature sources [9,25,26,30] and overlaps largely with the electroreduction scheme proposed by Aurbach et al. [31,32]. The in situ XPS data indicate that the N4111(TFSI) electroreduction process is complicated [18,21].
C 1s, N 1s, O 1s, F 1s and S 2p dBE dE−1 data show that N4111(TFSI) adsorbed at mmp-C(Mo2C) non-specifically in the potential range from 0.00 V to −2.00 V, as a slope of dBE dE−1 plot was within the range −0.9…−1.0 eV V−1 (Table 2). However, at E < −2.00 V, the dBE dE−1 was ca. −0.1 eV V−1 for all investigated elements. This indicates that N4111(TFSI) formed a surface layer at N4111(TFSI)|mmp-C(Mo2C) interface, as was observed for pyrazine adsorption at Au(111) [33] and for 4,4′-dithiodipyridine adsorption at Au(111) [34]. It is interesting to note that dBE dE−1 ≈ 0.0 eV V−1 was also observed for the 1-ethtyl-3-methylimidazolium tetrafluoroborate|mmp-C(Mo2C) system at E < −1.8 V (vs. Ag/AgCl), when the 1-ethtyl-3-methylimidazolium dimer formed at the mmp-C(Mo2C) surface [27,28]. Thus, the electroreduction of various quaternary ammonium salts at E = −1.9…−2.5 V (vs. Ag/Ag+) [23] takes place and the formation of some sort of solid–electrolyte interface (film) seems to be their general property.
More detailed investigation of the BE vs. E data for C 1s within the potential range −4.00 V < E < −2.00 V shows that for TFSI anion, the C 1s PE signal (i.e., from -CF3 group) dBE dE−1 = −0.13 eV V−1 (R2 = 0.93); for C 1s, the PE signal originating from the aliphatic carbon atoms located in the ammonium cation (i.e., from carbon atoms of butyl group not connected with nitrogen atom) dBE dE−1 = −0.12 eV V−1 (R2 = 0.91); and for C 1s, the PE signal originating from the carbon atoms located in the ammonium cation and connected directly with the nitrogen atom dBE dE−1 = −0.08 eV V−1 (R2 = 0.77). It seems that the carbon atoms connected with the ammonium cation nitrogen atom have the closest contact with the mm-C(Mo2C) surface, and the aliphatic carbon and carbon in the –CF3 group are oriented away from the mmp-C(Mo2C) surface. The N 1s XPS data confirm this observation while dBE dE−1 = −0.13 eV V−1 (R2 = 0.92) for N 1s located in TFSI anion, and dBE dE−1 = −0.09 eV V−1 (R2 = 0.77) for N 1s located in the ammonium cation. BE of a new F 1s PE peak (BE = 682.9 eV) formed at E = −3.75 V (that is ca. 0.0 V vs. Li+/Li) was constant at more negative potentials (i.e., dBE dE−1 = 0 eV V−1), indicating that this new compound was chemically bound or adsorbed very strongly at the mmp-C(Mo2C) surface, as was also observed for 4,4′-dithiodipyridine adsorption at Au(111) [34].

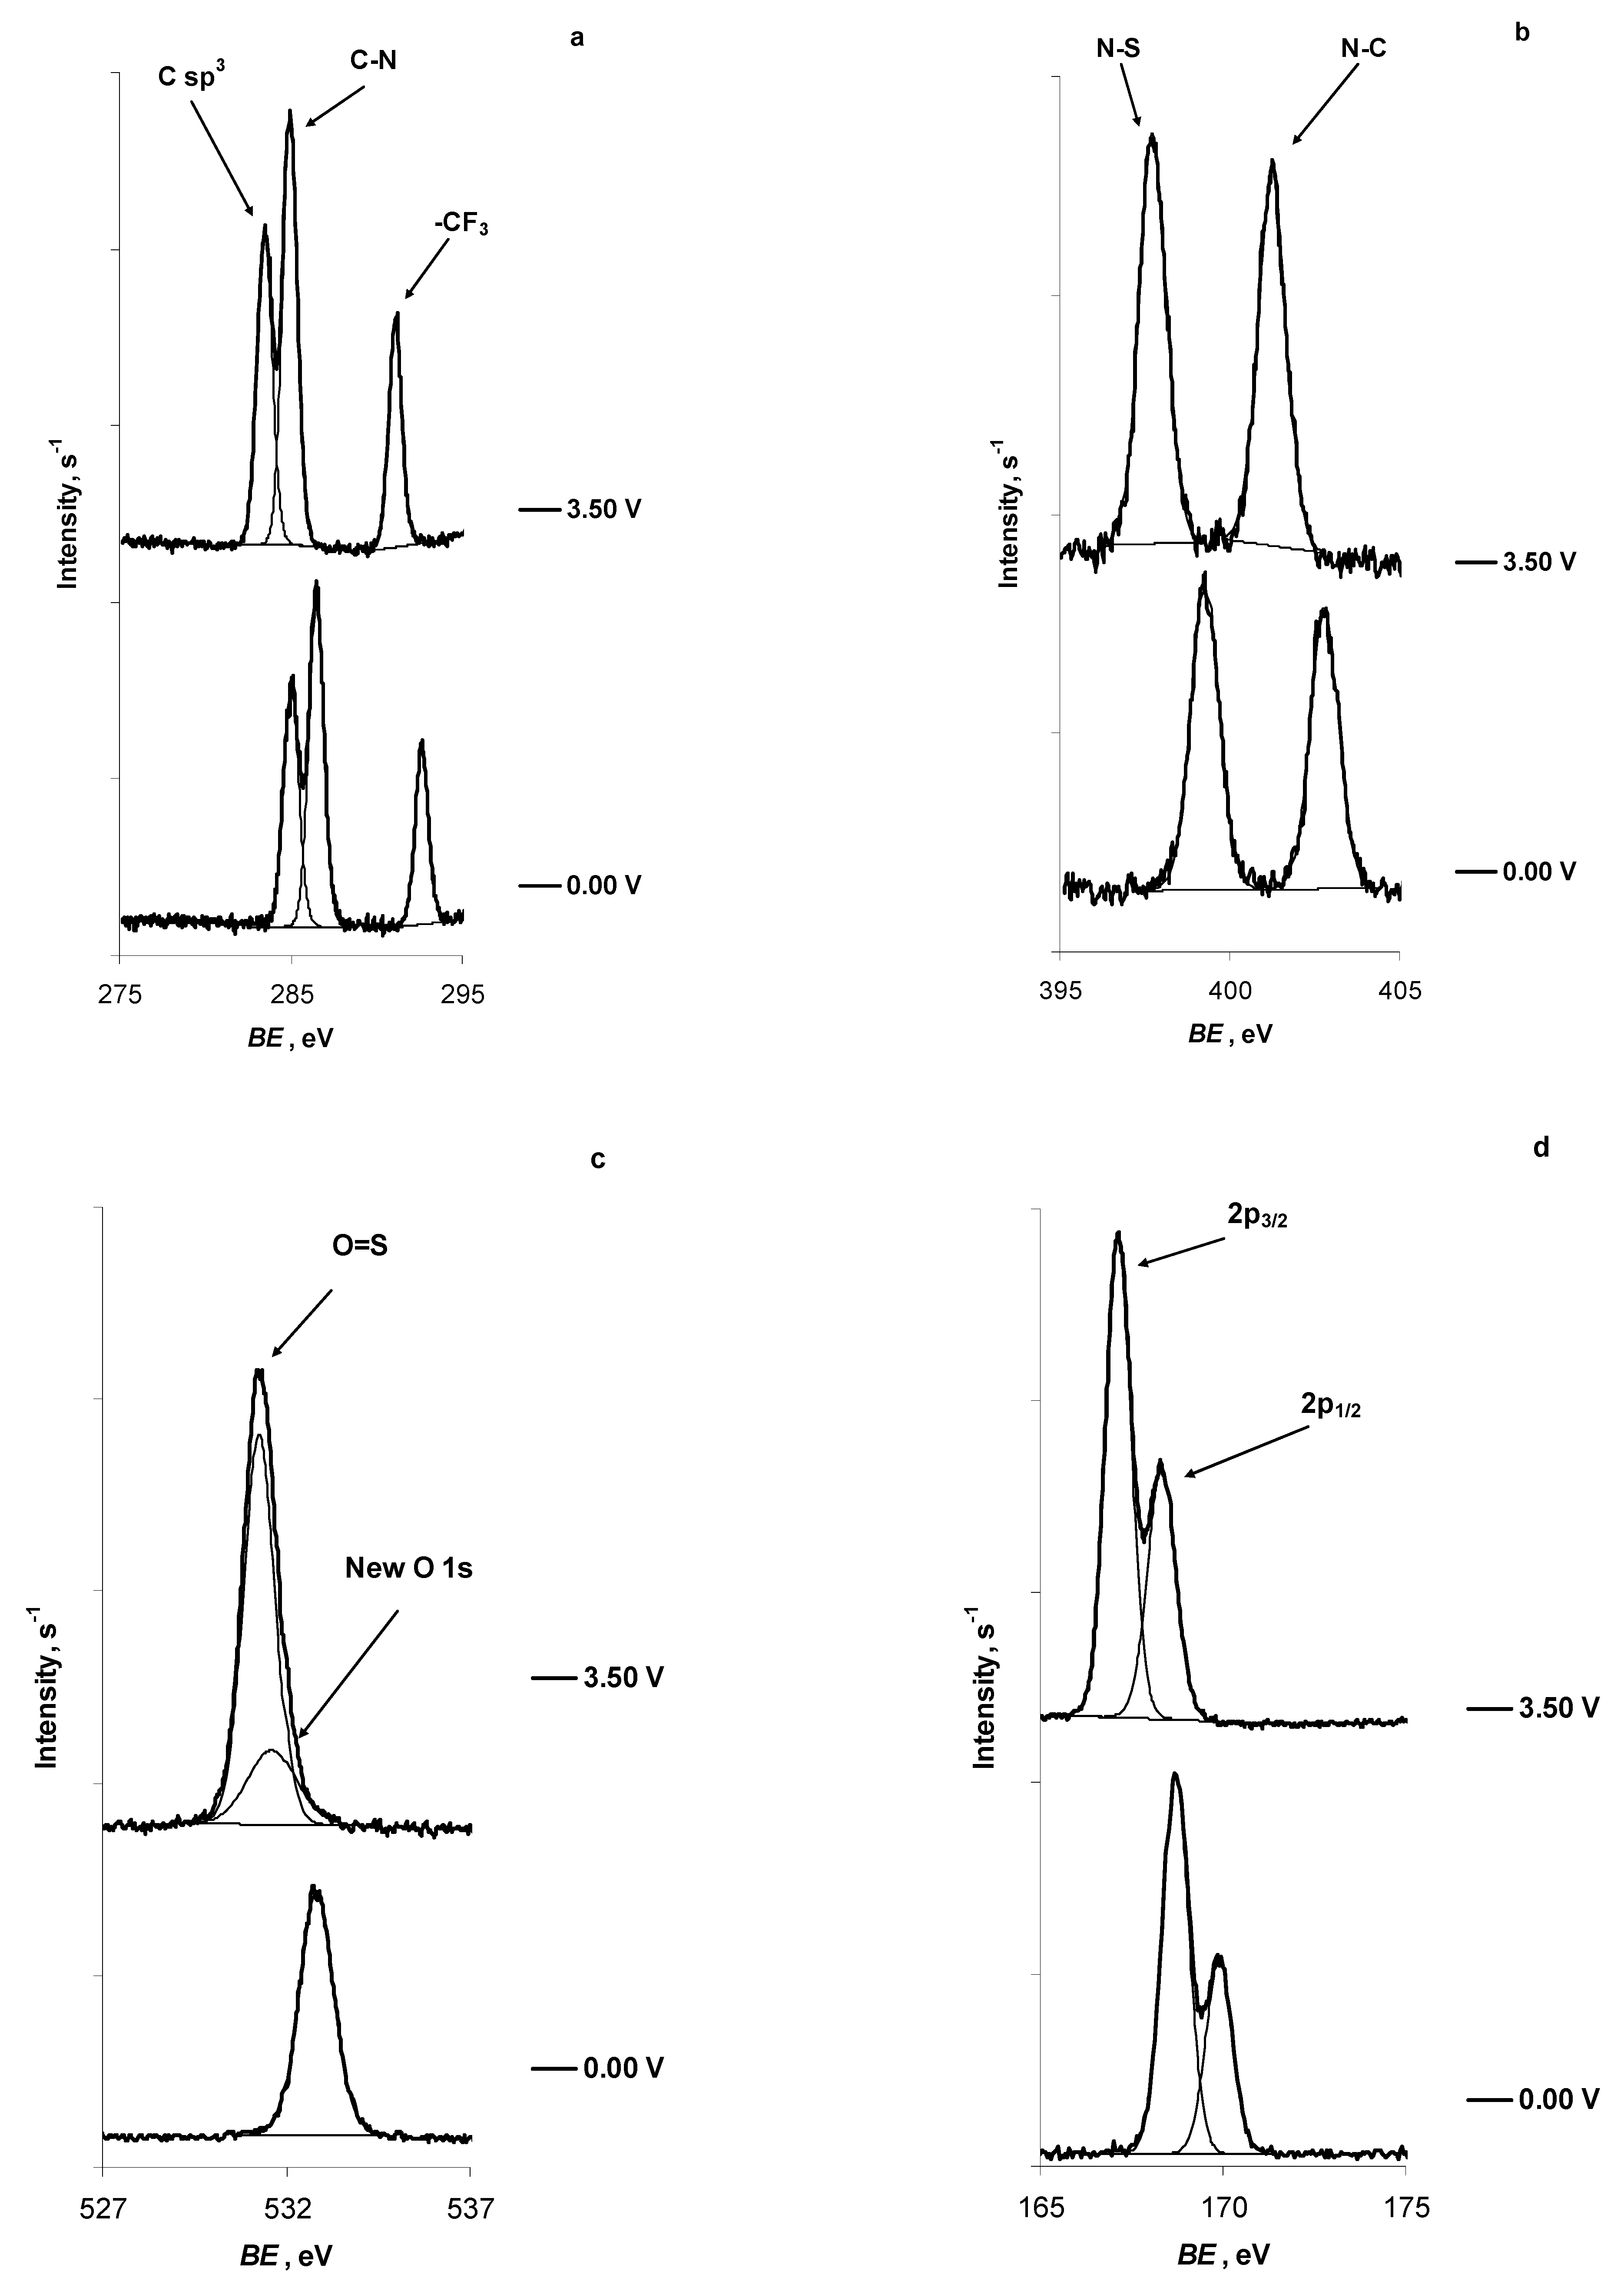
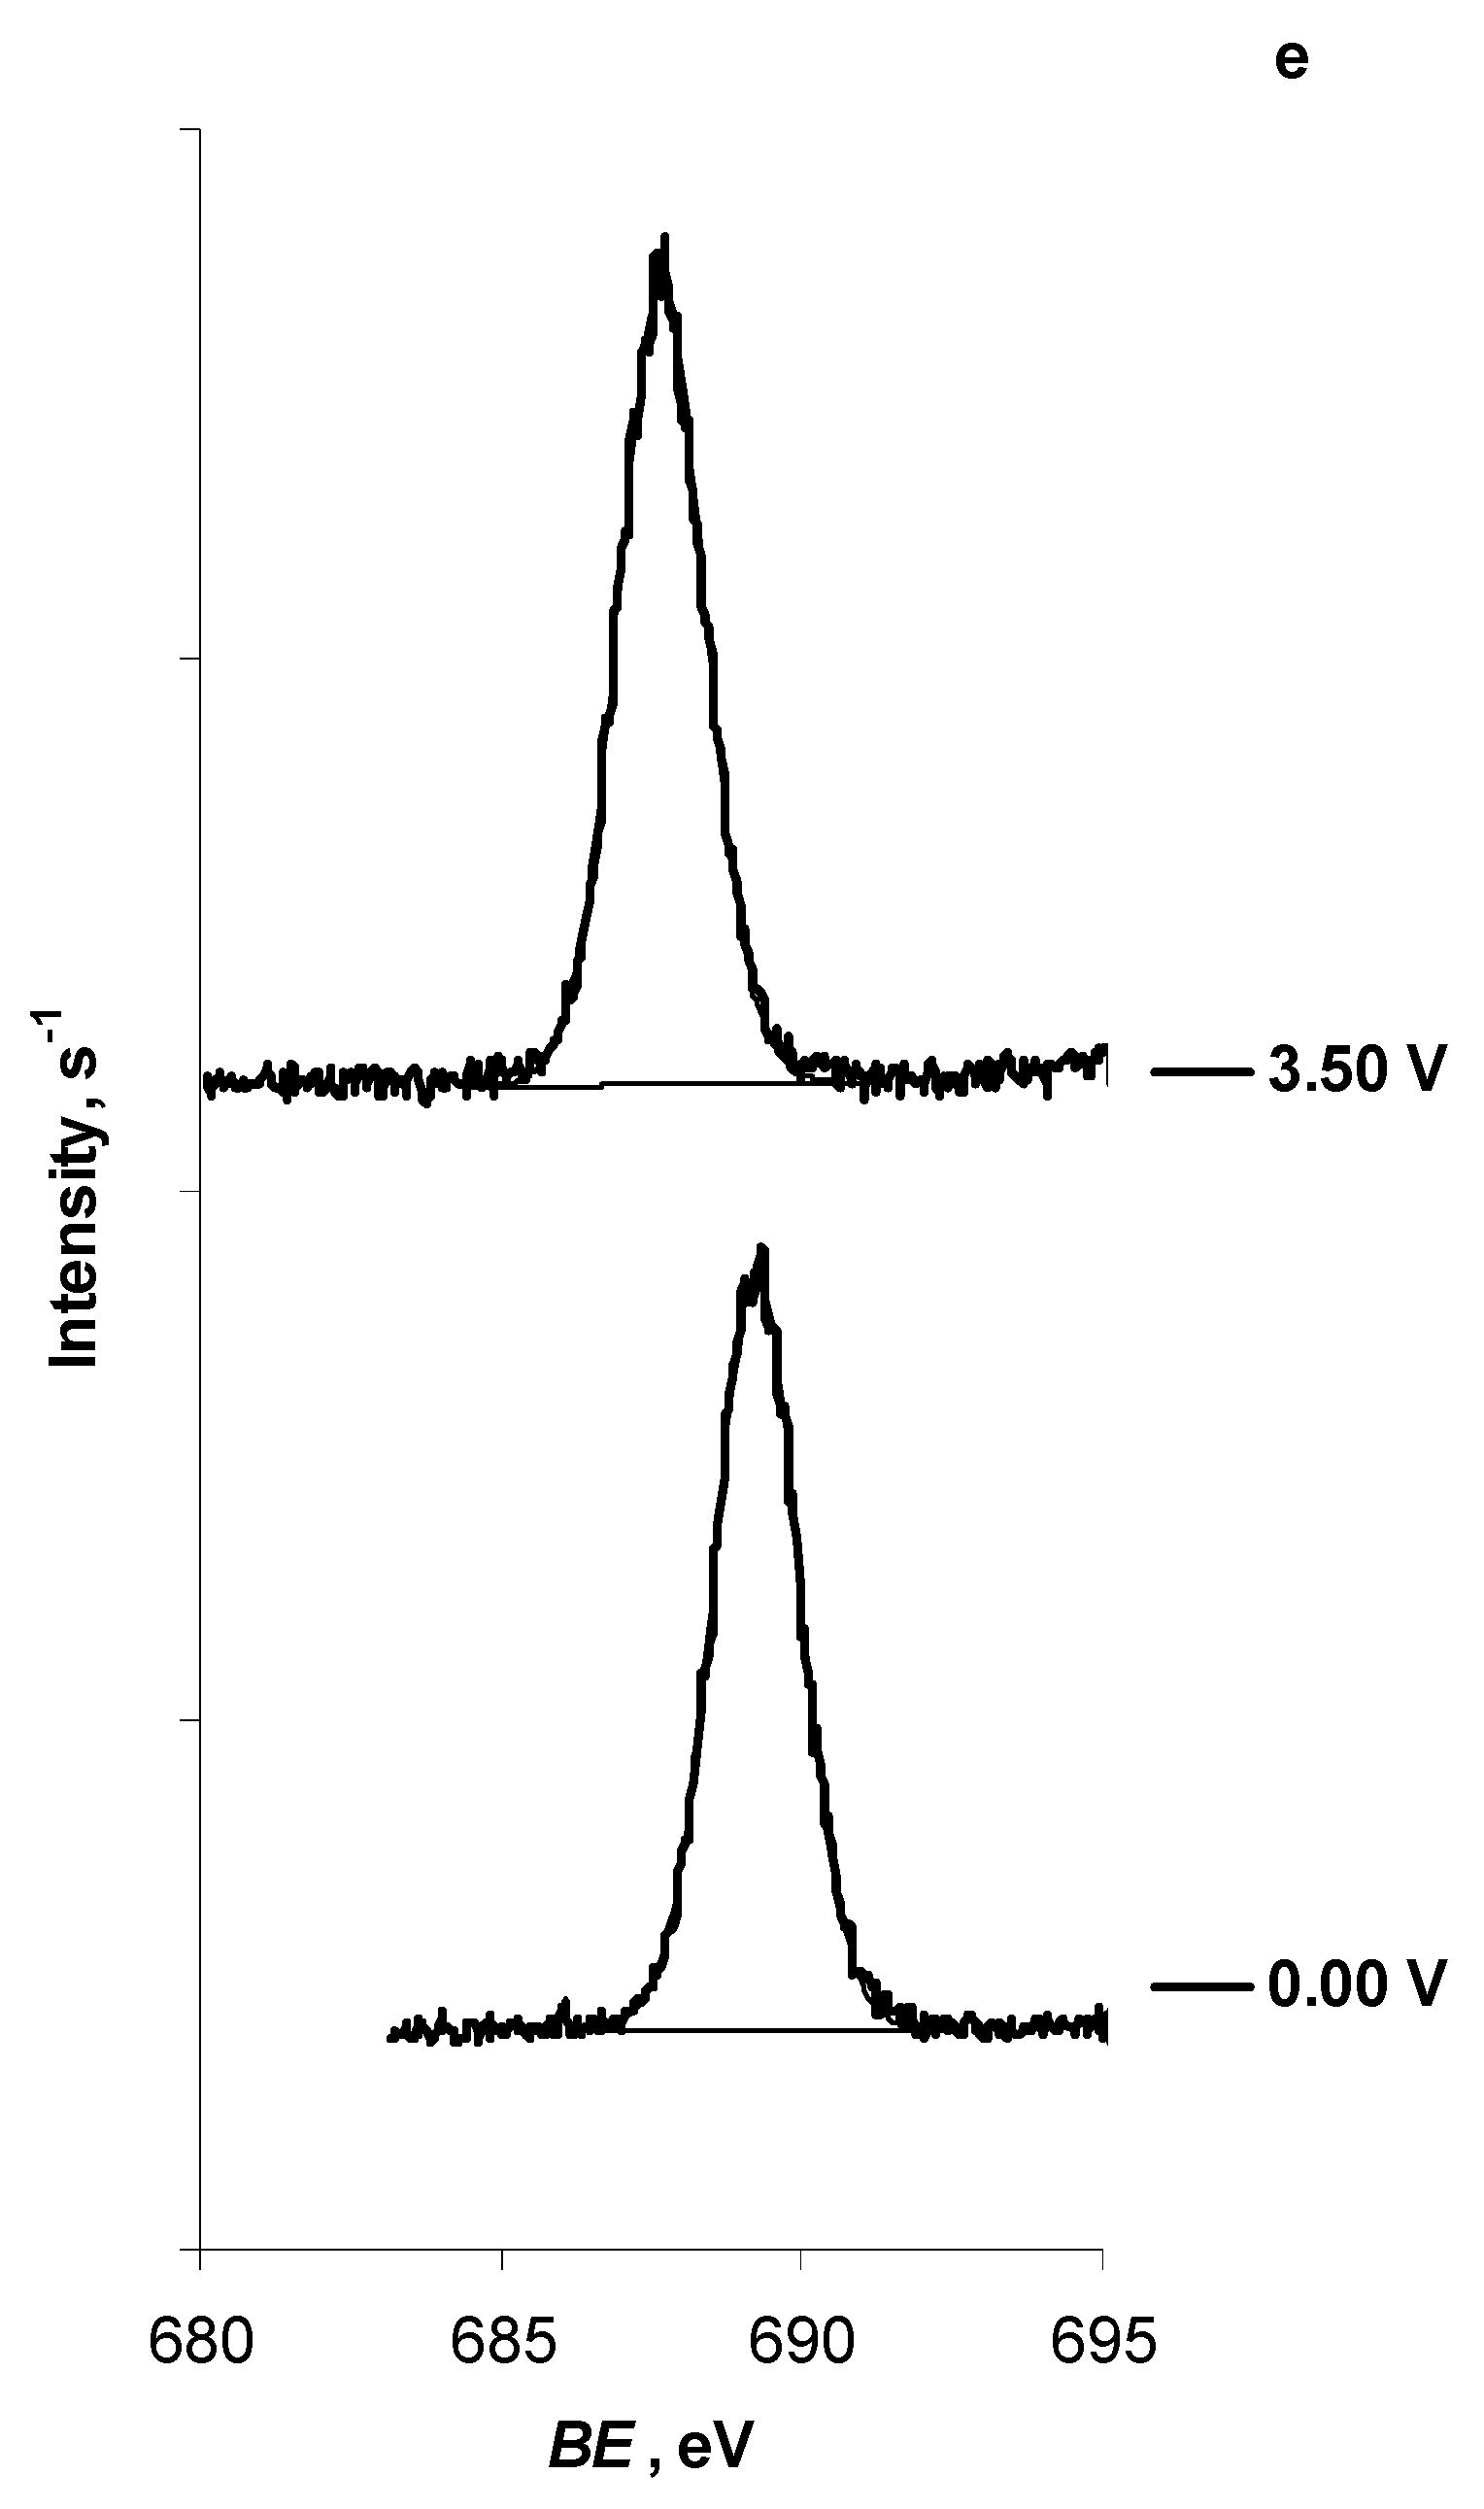
2.2. In Situ XPS Measurements of N4111(TFSI) at the Positively Polarised mmp-C(Mo2C) Electrode

C 1s, N 1s, O 1s, F 1s and S 2p in situ XPS spectra for N4111(TFSI) at mmp-C(Mo2C) electrode were collected within the positive potential range from 0.00 V to 3.50 V (Figure 2a–e). Positive polarisation was limited by the start of the formation of gaseous products. The shape of C 1s, N 1s, F 1s and S 2p BE spectra did not change within the potential range from 0.00 to 3.50 V. However, a small tail formed to the O 1s BE peak at the higher energy side at E = 3.50 V (BE = 532.55 eV), expanding at more positive potentials (Figure 2c). While no distortions appeared in the shape of the BE peaks for the other elements studied, the formation of the tail to the O 1s PE peak could be related to the oxidation of the mmp-C(Mo2C) electrode surface. BE values for C 1s, N 1s, O 1s, F 1s and S 2p PEs measured at the initial and final positive potentials applied to mmp-C(Mo2C) electrode are presented in Table 3.
Analysis of C 1s, N 1s, O 1s, F 1s and S 2p in situ XPS data shows that dBE dE−1 = −0.63…−0.67 eV V−1 for inner core electrons within the potential range from 0.00 V up to 1.80 V (Table 4). At E > 1.80 V, the BE vs. E slope reduced, obtaining a value of dBE dE−1 = −0.24…−0.25 eV V−1 for inner core electrons of all elements studied (Table 4). It should be noted that there were no remarkable differences between the C 1s and N 1s dBE dE−1 slope values. Obtained information indicates that N4111(TFSI) seems to adsorb at mmp-C(Mo2C) electrode surface specifically within the potential range 0.00 V < E < 1.80 V and more strongly at E > 1.80 V.

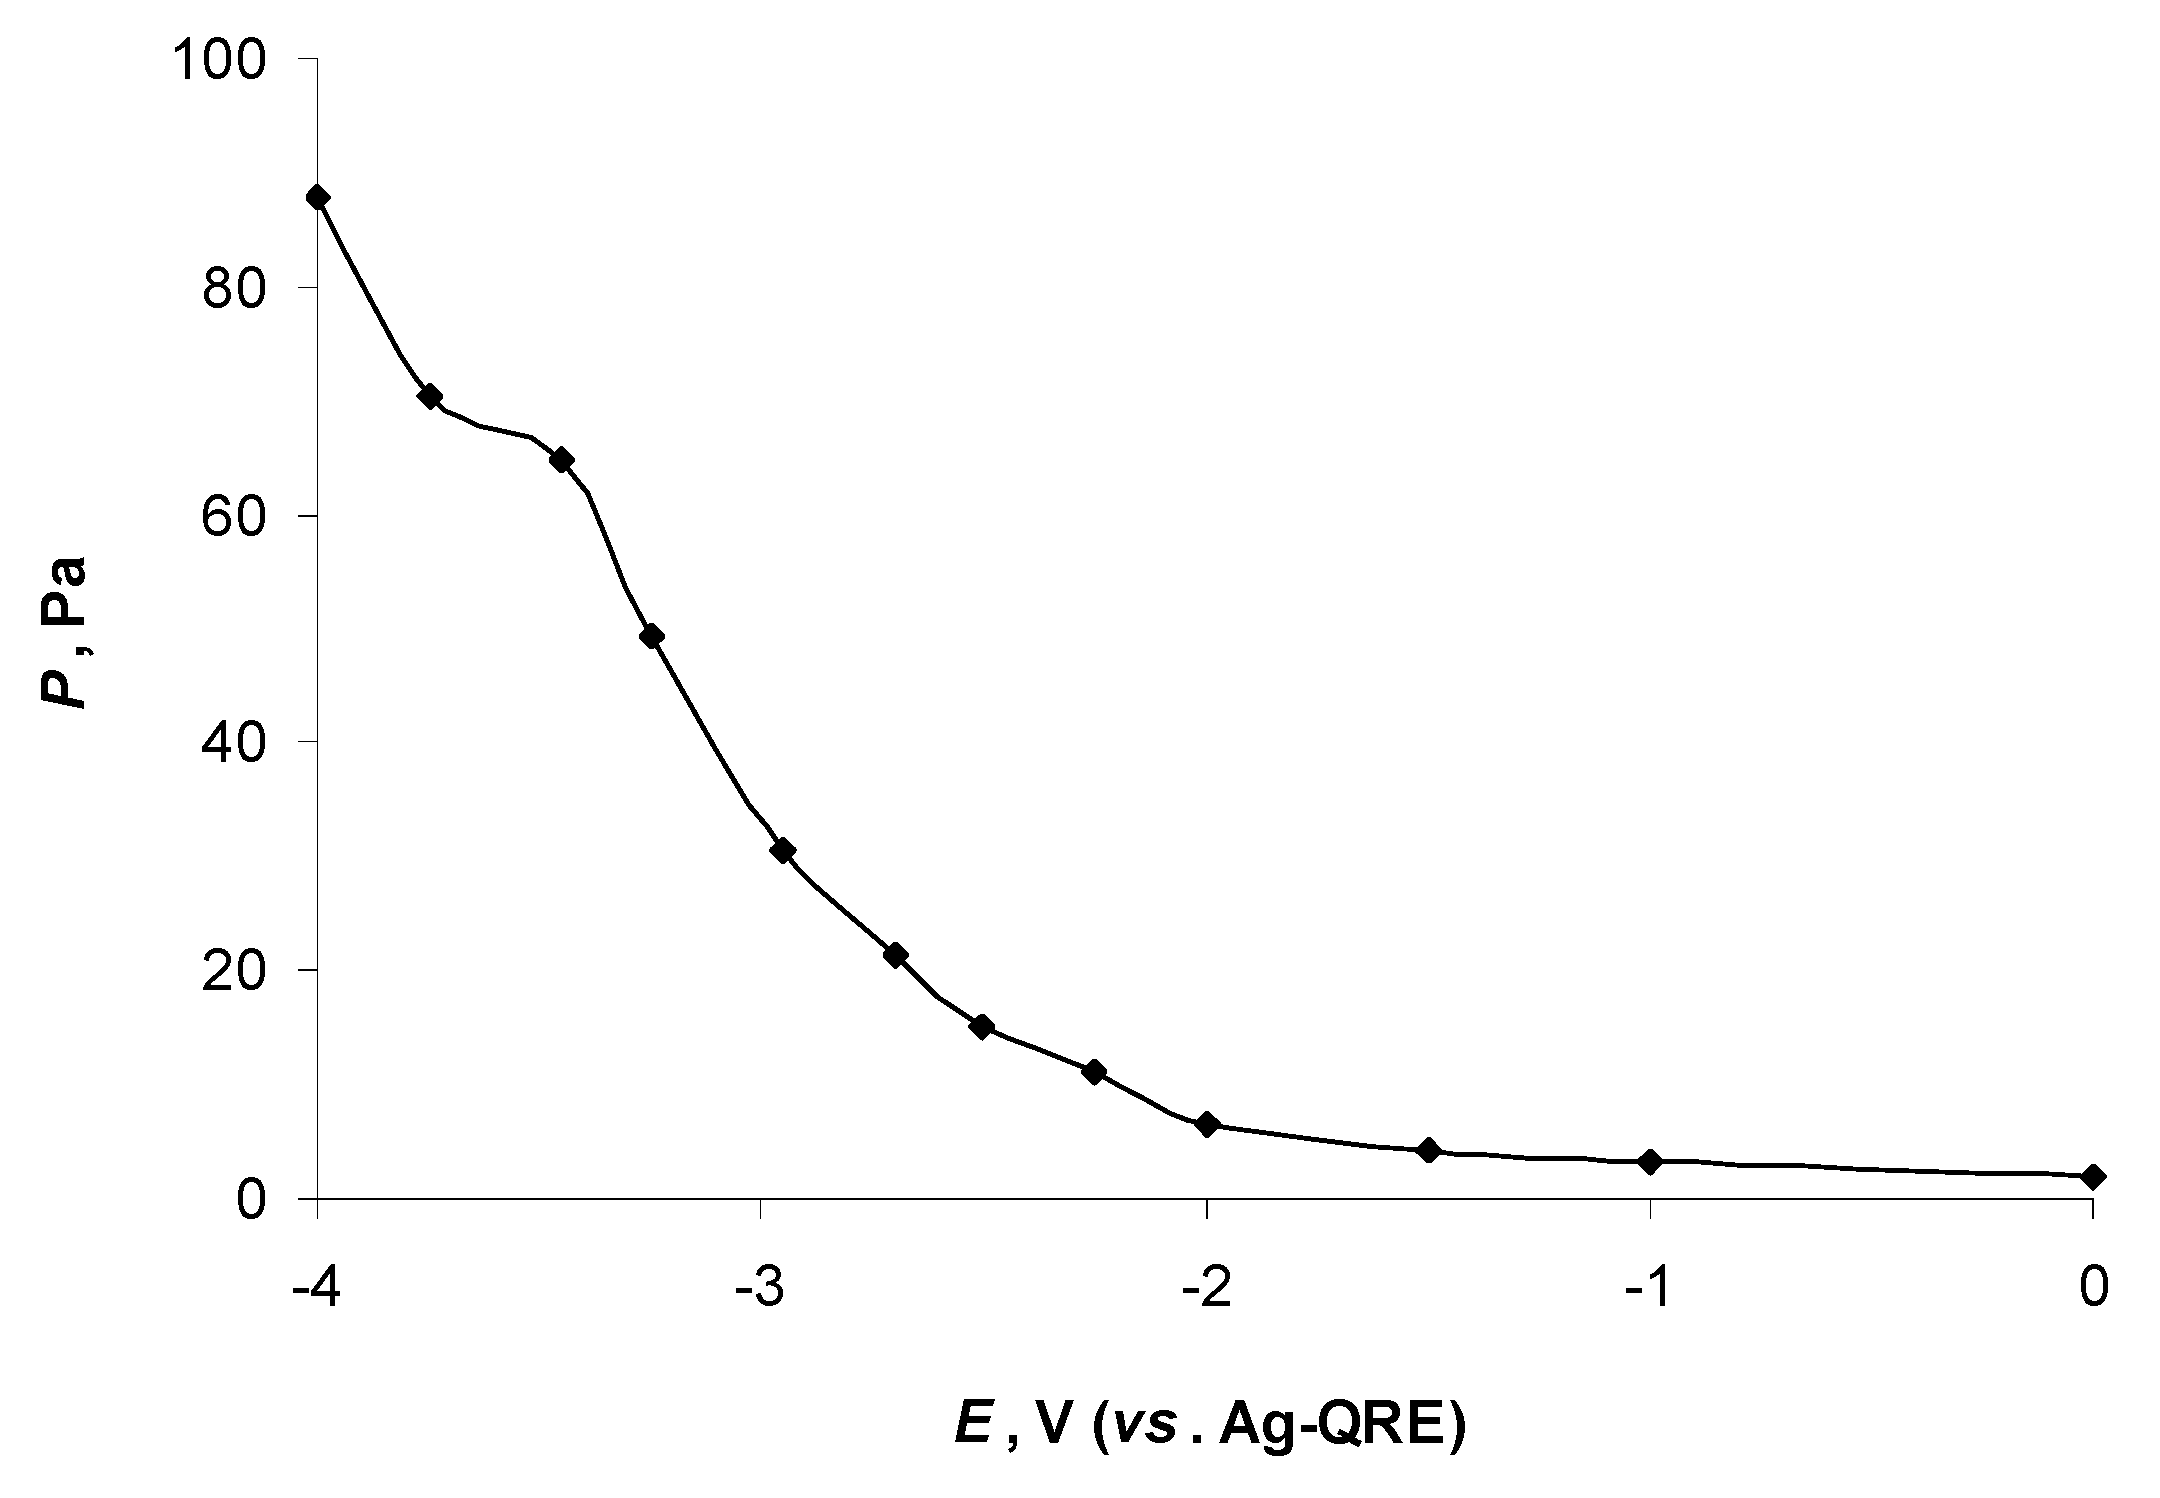
2.3. Mass Spectroscopic Measurements of N4111(TFSI) at the Negatively Polarised mmp-C(Mo2C) Electrode

The mass spectroscopic measurements were performed analysing a high-vacuum chamber gas-phase chemical composition. The mmp-C(Mo2C) electrode was polarised negatively; however, while the WE and CE were not separated spatially, gaseous products formed at both electrodes were detected simultaneously.
The pressure inside the vacuum chamber started to increase notably at E < −2.00 V (Figure 3) (i.e., at the same potential when dBE dE−1 = −0.1), indicating the N4111(TFSI) surface layer formation at the mmp-C(Mo2C) electrode. The following mass fragments were detected at E = −2.00 V: m/z = 30 g mol−1 (C2H6, CH3-NH*), m/z = 31 g mol−1 (CF*, CH3-NH2), m/z = 44 g mol−1 (CH2=N(H+)-CH3, cyclo-(CH2)2-NH-H+), m/z = 46 g mol−1 (CH2=S, NH2-CH2-NH2), m/z = 58 g mol−1 (butane, isobutane) and m/z = 59 g mol−1 ((CH3)3-N), being products of the N4111+ cation electrochemical decomposition. m/z = 64 g mol−1 (SO2), m/z = 69 g mol−1 (CF3*) and m/z = 132 g mol−1 (CHF2-SO2-NH2-H+, CF2=SO(OH)-NH2-H+, C(OH)F2-SO2H, CF3-S(+)O=NH), detected also at E = −2.00 V, are the products of the TFSI anion electrochemical decomposition. (More detailed information is given in Supplementary information Tables S1 and S2.) The formation of these m/z fragments is the result of the start of very intensive electrochemical decomposition of N4111(TFSI). The partial pressures of detected m/z at the most characteristic potentials and the most probable chemical composition of these detected masses (it was presumed that only single charged cations formed during the ionisation process in the MS detector ioniser) are given as Supplementary information Tables S1 and S2.
However, it should be noted that m/z = 30 g mol−1 (CH3-NH*, C2H6 (formed due to the combination of two methyl radicals)), m/z = 31 g mol−1 (CH3-NH2, CF*), m/z = 44 g mol−1 (CH2=N(H+)-CH3, M/z = 46 g mol−1 (CH3-NH(H+)-CH3, NH2-CH2-NH2), m/z = 58 g mol−1 (CH3-CH2-CH2-CH3), m/z = 59 g mol−1 ((CH3)3N), m/z = 64 g mol−1 (SO2) and m/z = 69 g mol−1 (CF3*) existed in the mass spectra already since E = −1.50 V. Formation of these fragments is probably activated due to the electroreduction of the residual water. Thus, it seems that the H* radical, formed in the electroreduction of the water, attacks the N4111+ cation, and that the OH anion, formed in the same electrochemical process, attacks the -CF3 group in the TFSI anion simultaneously. The consumption of the H* radicals by N4111+ cation might explain the absence of H2 (m/z = 2 g mol−1) in the recorded mass spectra and on the other hand might indicate that the concentration of the residual water was low in the N4111(TFSI) used.
It is interesting to note that the m/z = 132 g mol−1, corresponding to TFSI electroreduction products CF2-SO2-NH2-H+, CF2=SO(OH)-NH2-H+, C(OH)F2-SO2H or CF3-S(+)O=NH, appeared in the mass spectra already at E = −2.50 V (Supplementary information Table S1). However, the m/z = 132 g mol−1 concentration (partial pressure) increased with the increase in mmp-C(Mo2C) electrode negative potential only slightly.
In conclusion, a large overlap between the above-discussed m/z fragment data (Supplementary information Tables S1 and S2) and the information presented by Klug et al. [22] is notable.

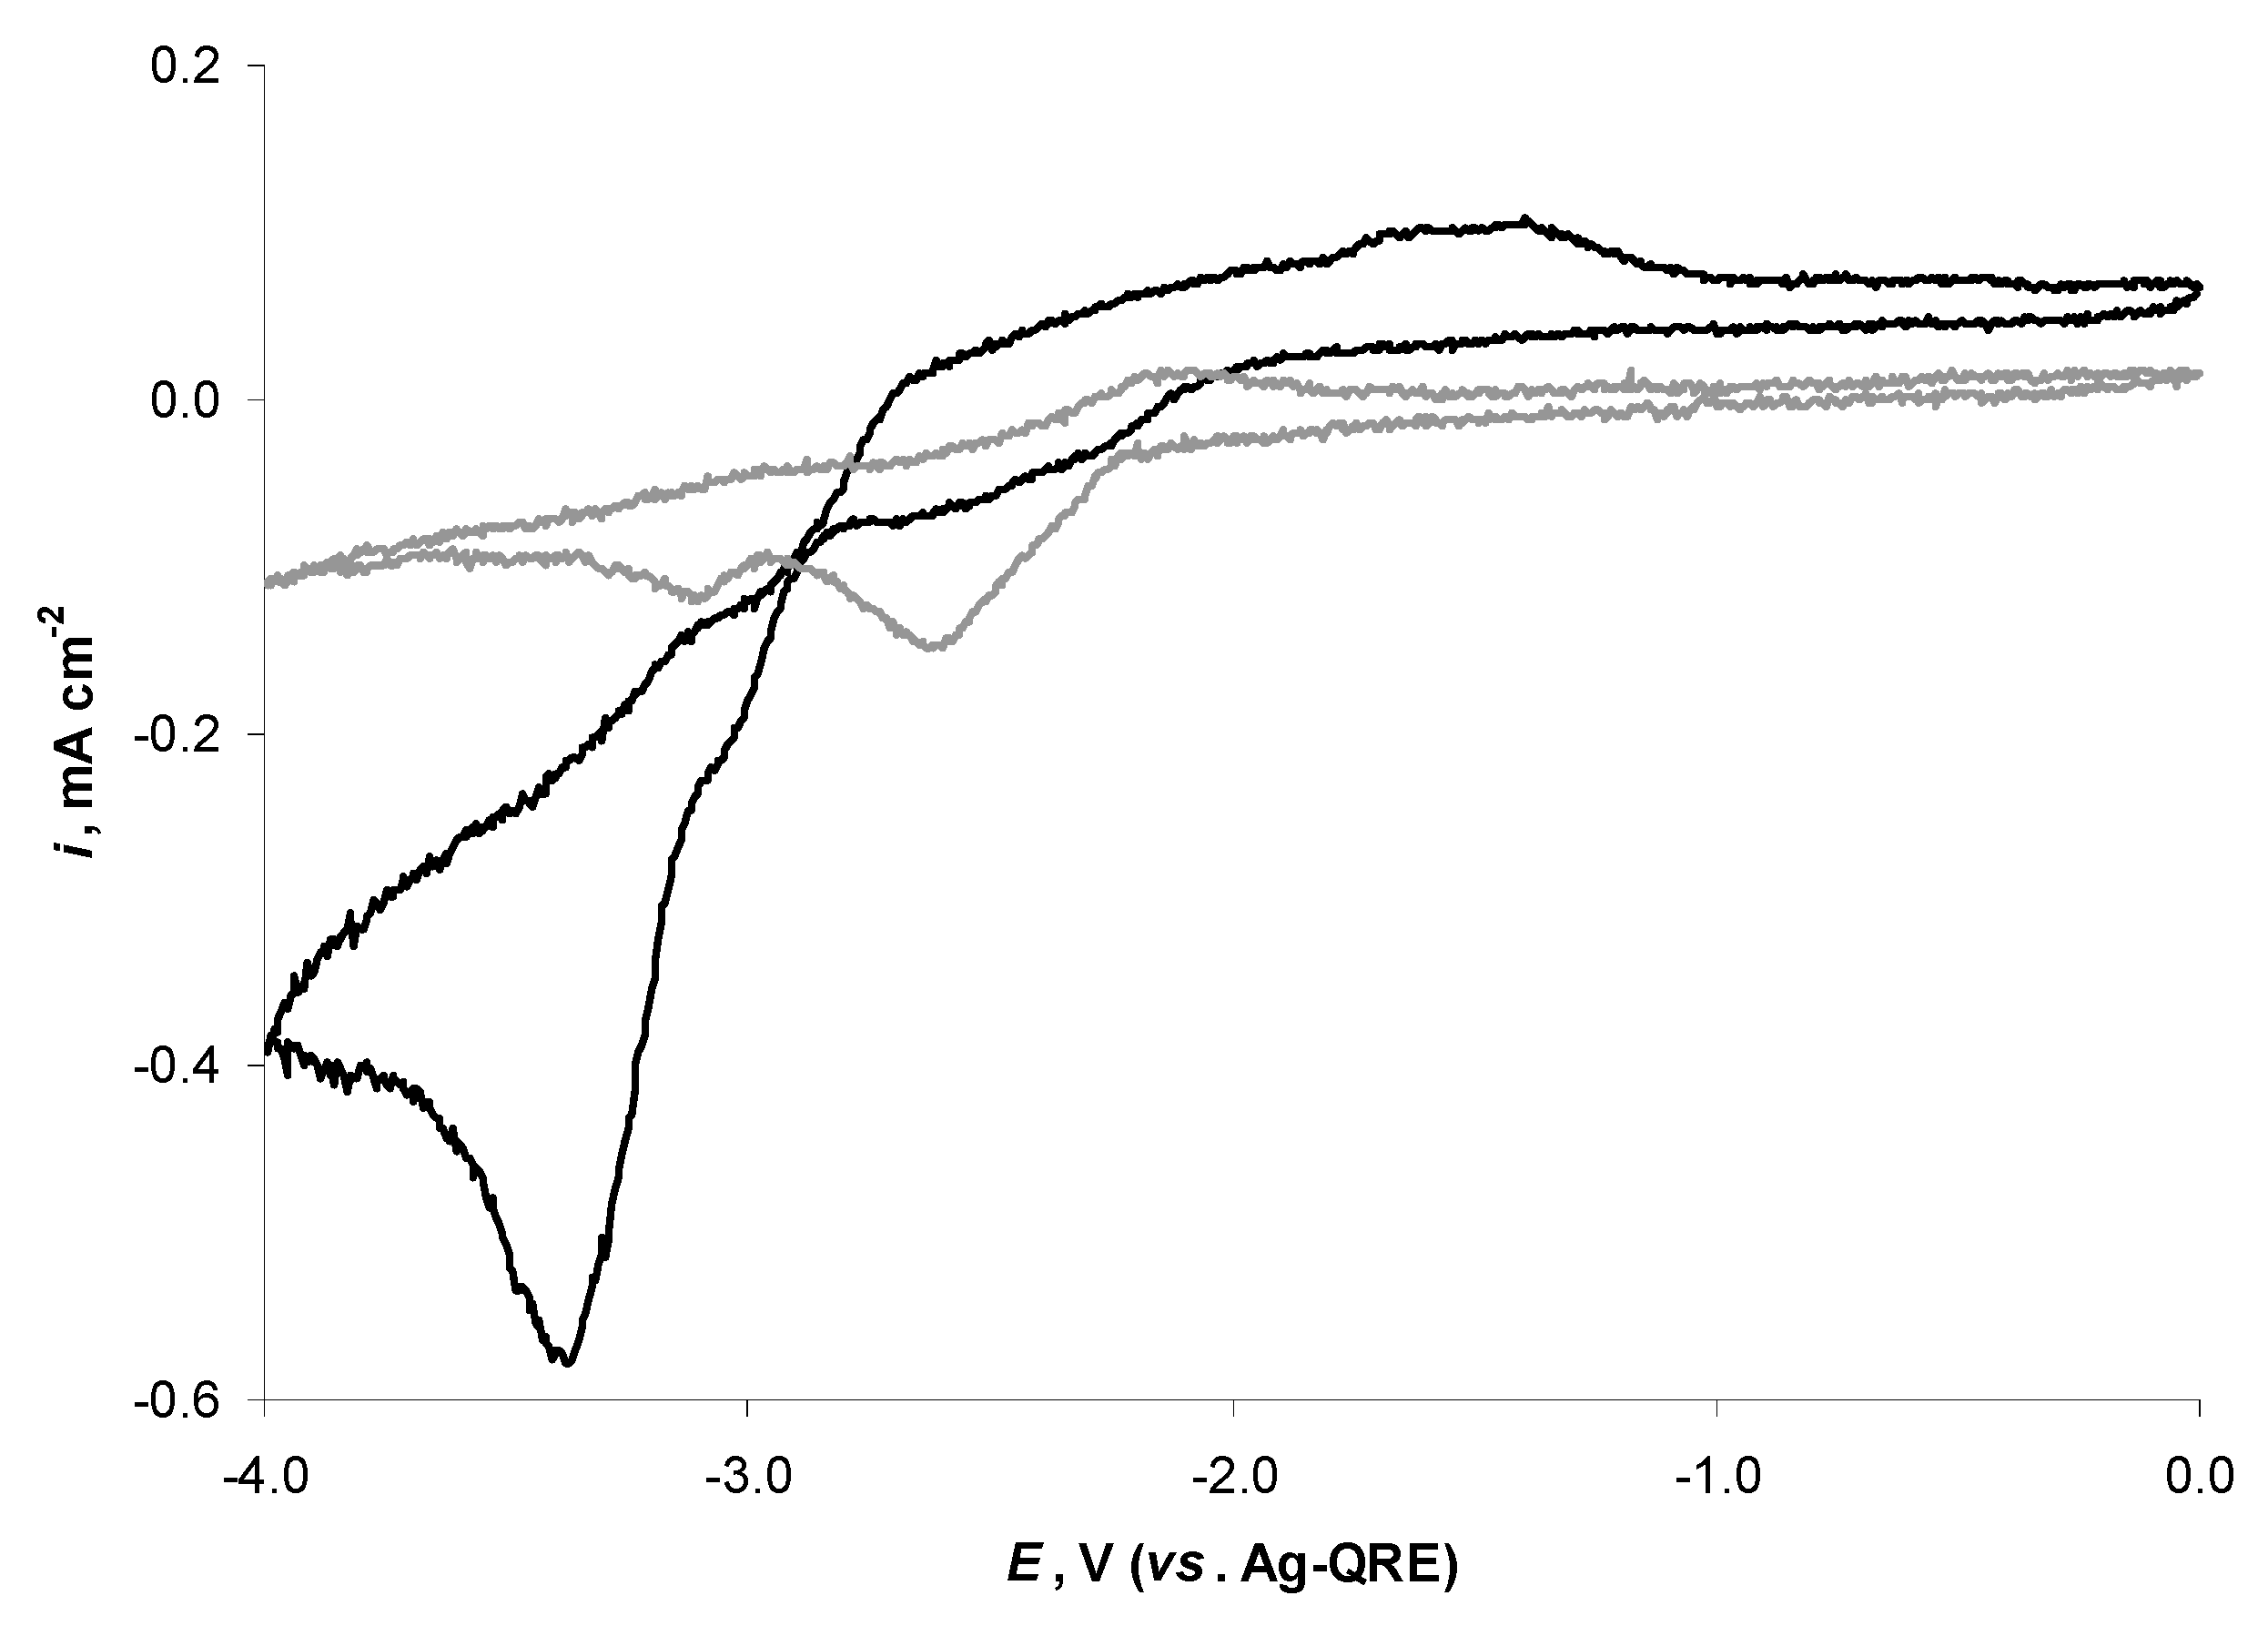
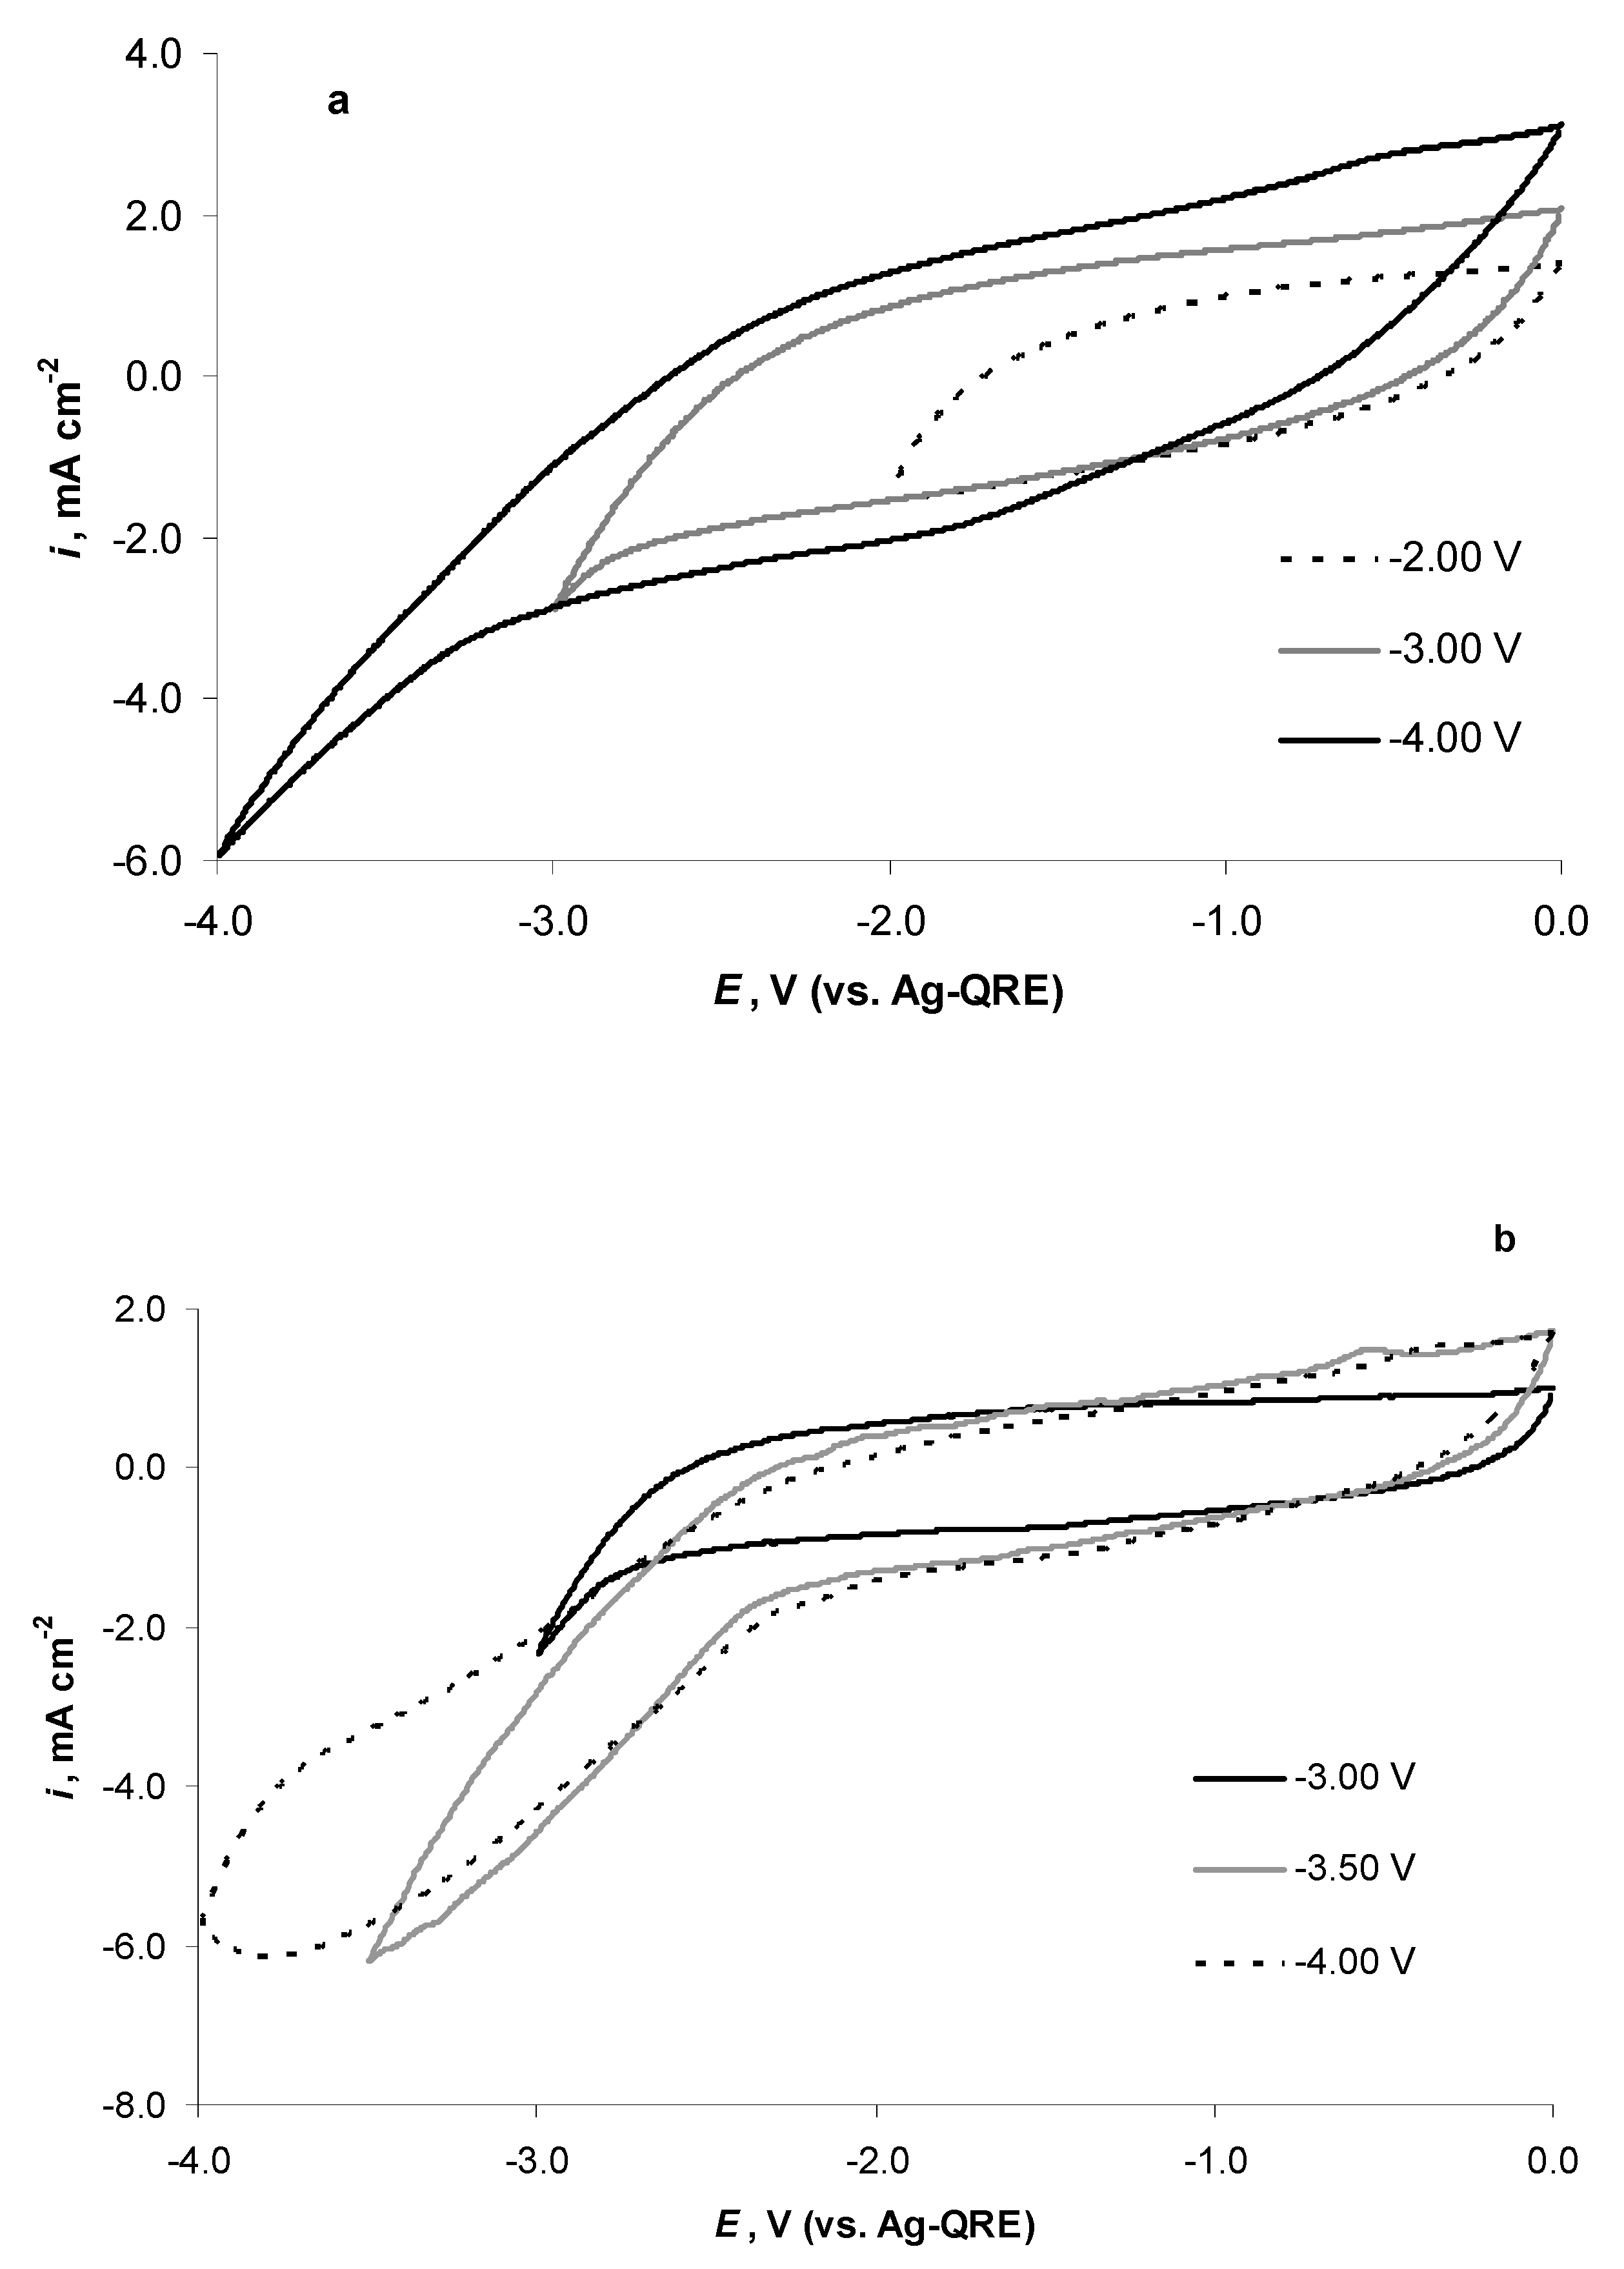
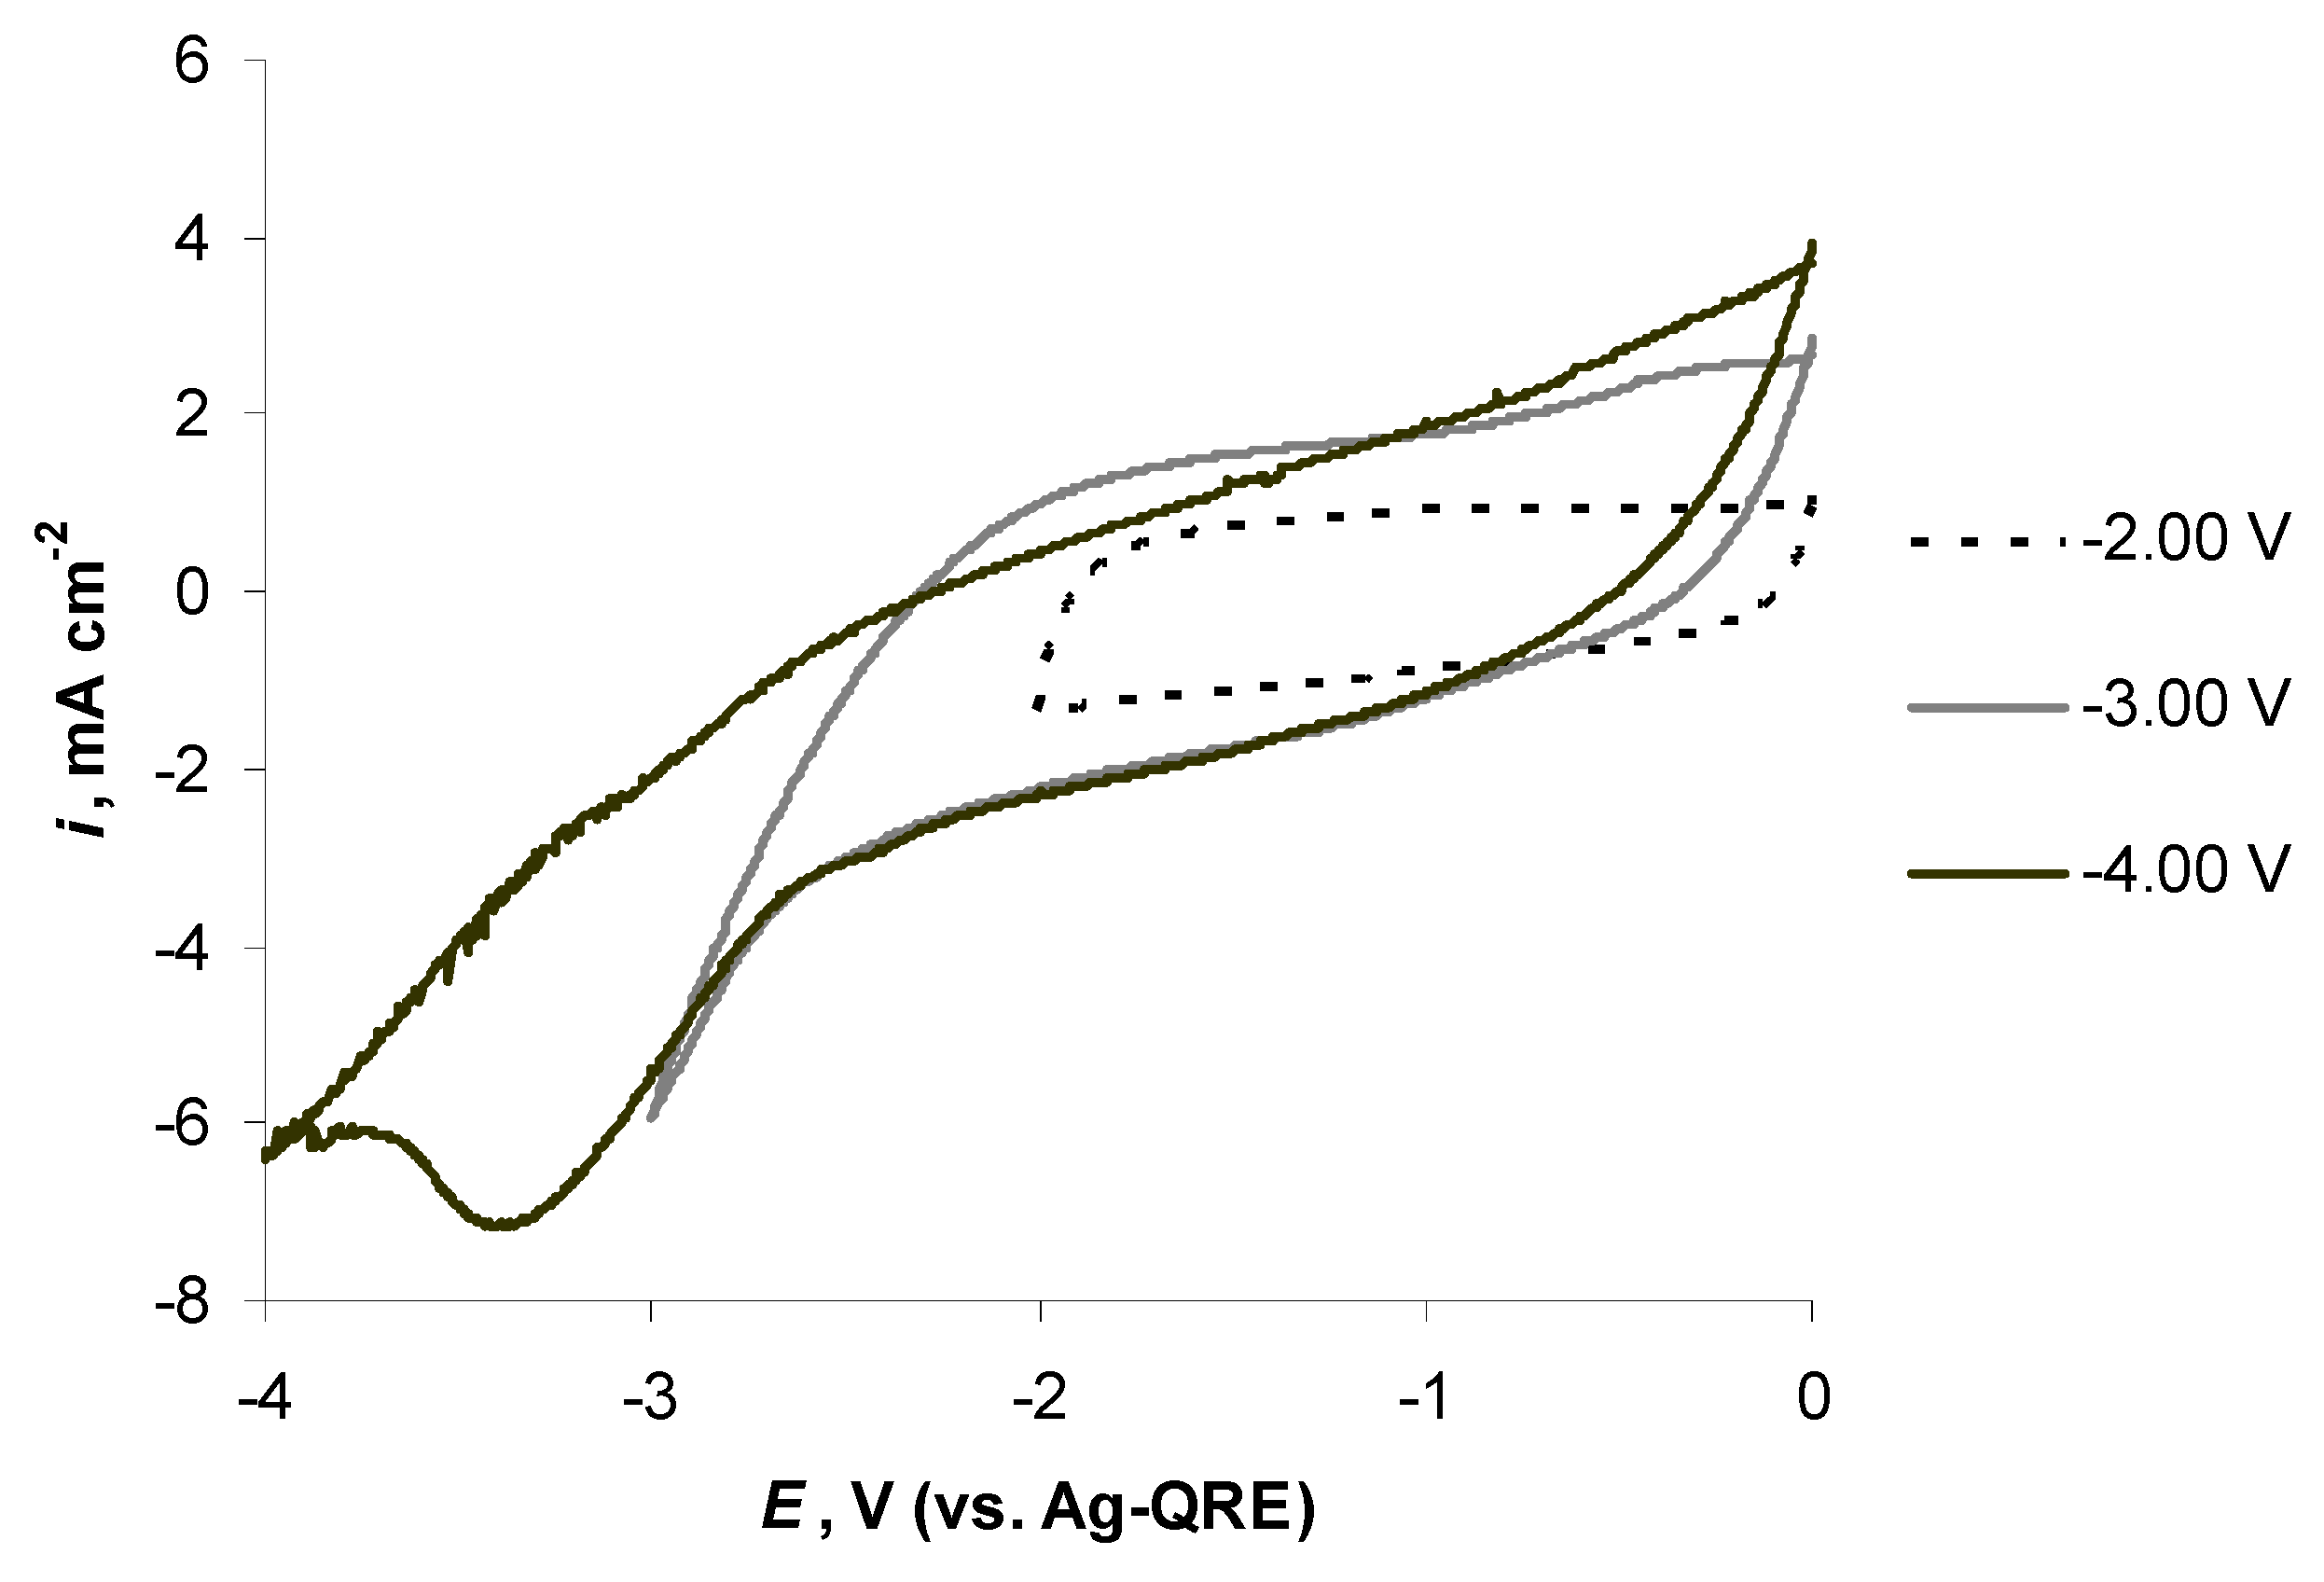
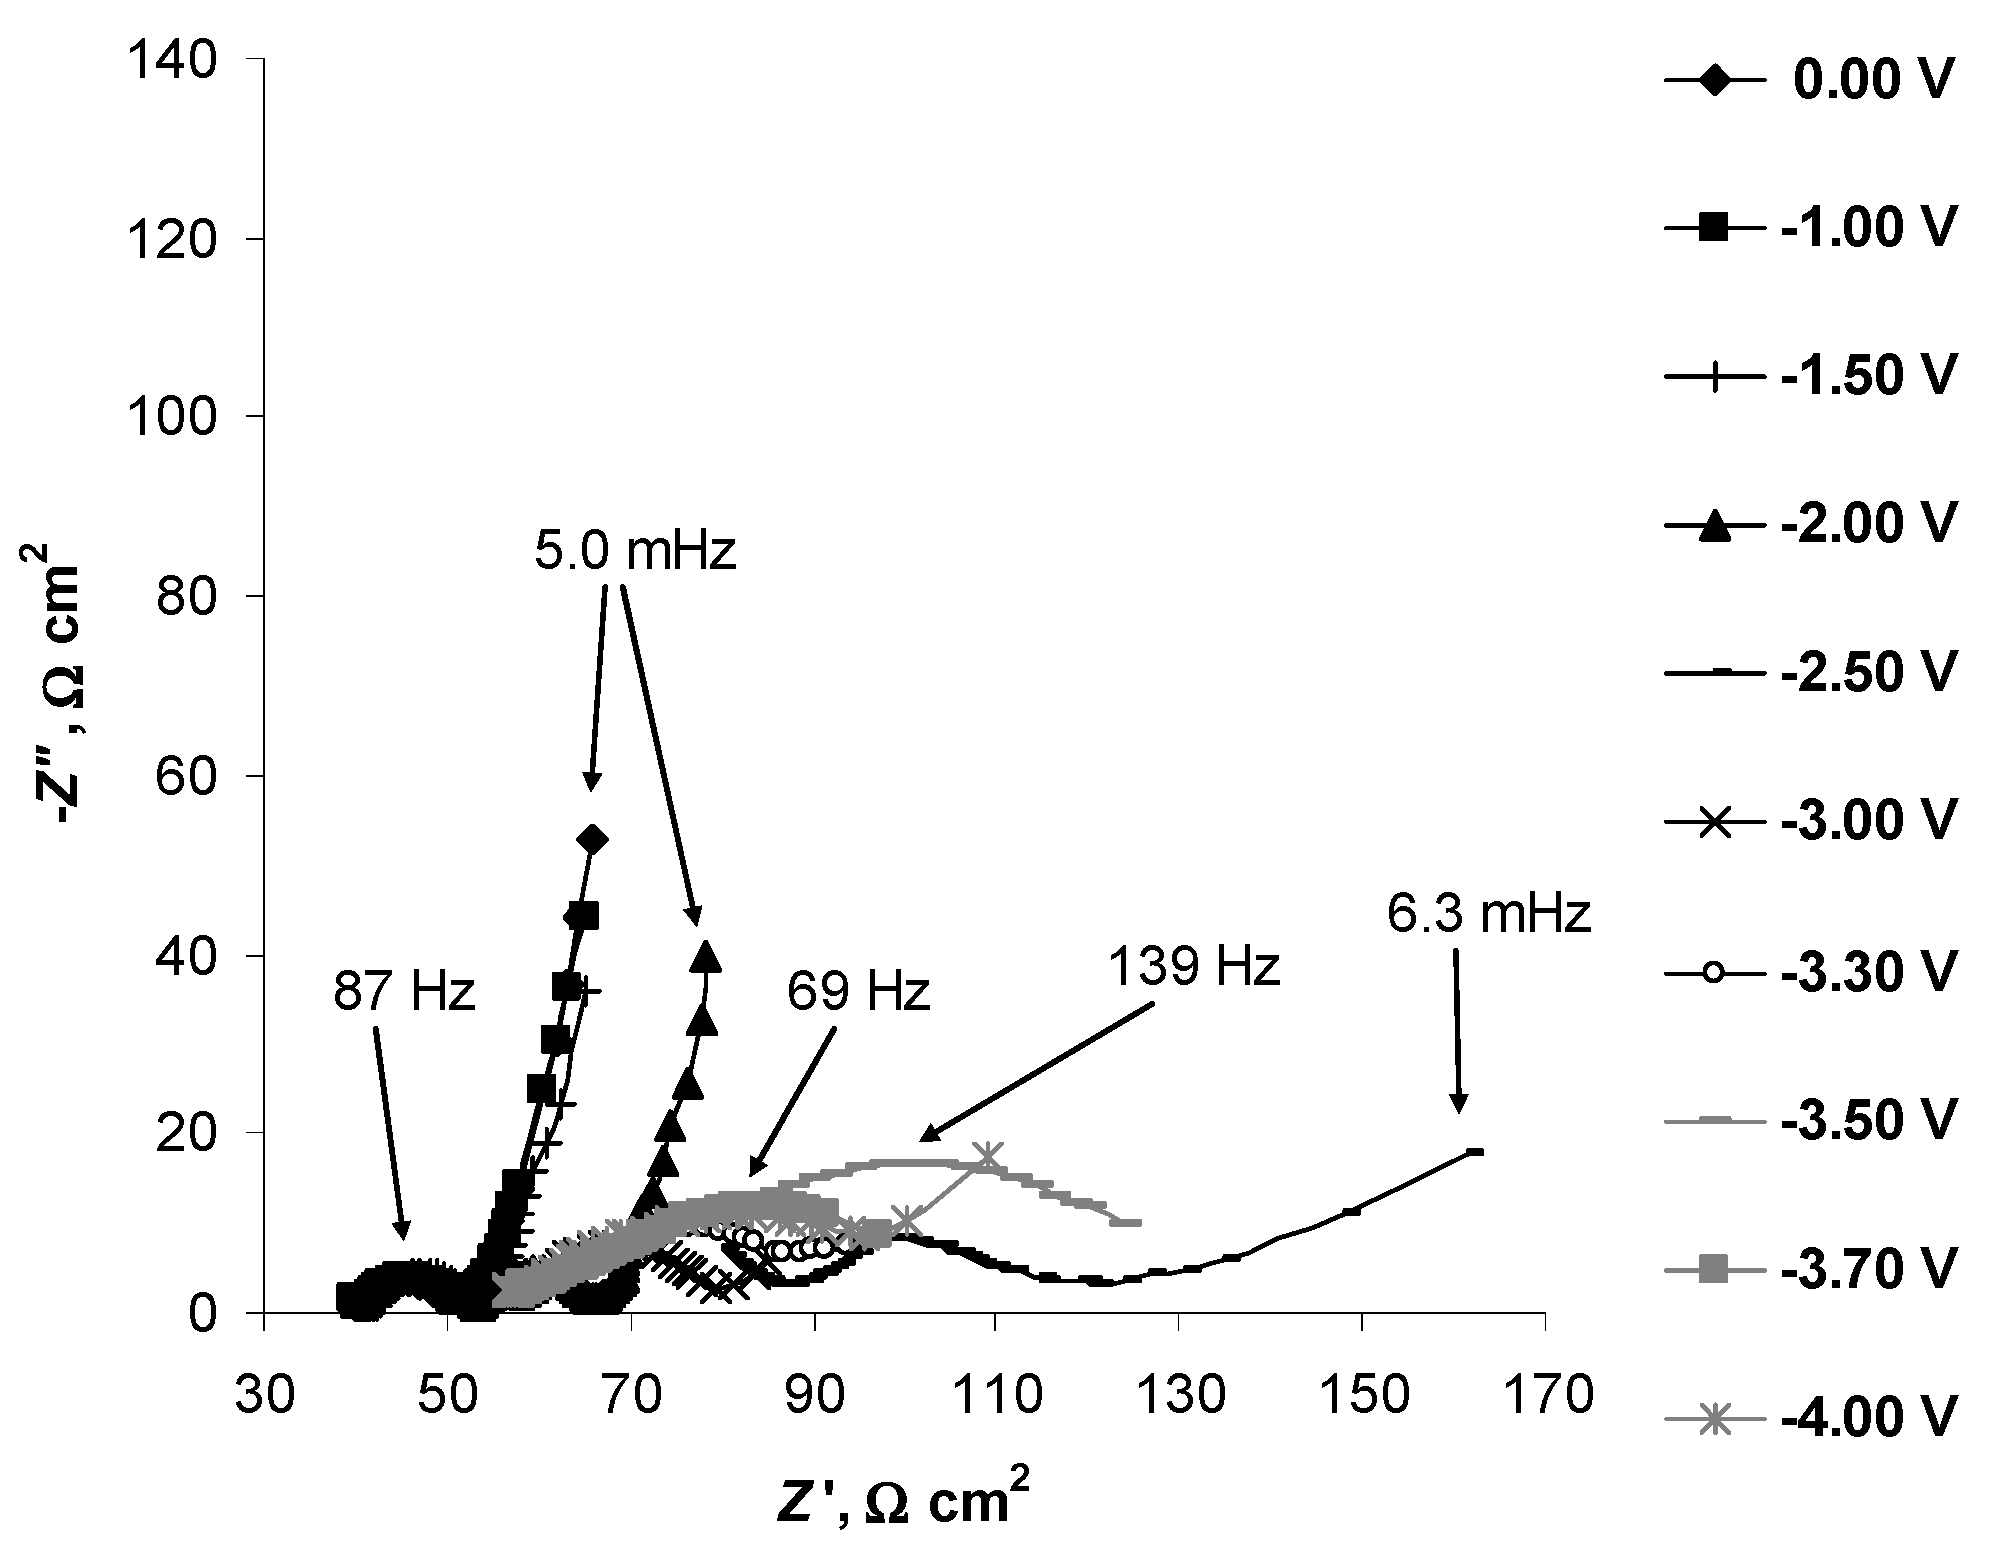
2.4. Electrochemical Behaviour of N4111(TFSI) at the Negatively Polarised mmp-C(Mo2C) Electrode

Previous in situ XPS and MS studies demonstrated the important role of the residual water in the electrochemical properties (stability) of N4111(TFSI). To see the effect of drying, the CV measurements were conducted in an Ar glovebox using carbon microelectrode (C-μE) to compare the electrochemical behaviour of additionally dried N4111(TFSI) and the original one containing 80 ppm residual water (Figure 4). The CVs, measured within the potential range from 0.00 V to −4.00 V and reverse at the potential sweep rate (v) 1.0 mV s−1, indicate a significant influence of the residual water concentration on the electrochemical behaviour of the N4111(TFSI)|mmp-C(Mo2C) system. Much lower current densities for additionally dried N4111(TFSI) (grey line) than for non-dried (black line) were measured (Figure 4). The 80 ppm water containing N4111(TFSI) (Figure 4) also showed only a slight increase in the negative current density within the potential sweep range from 0.00 to −1.90 V. Thus, the concentration (80 ppm) of water was so small that it could be easy to overlook and has been ignored in most studies.
However, the behaviour of less dry N4111(TFSI) is different from that of the additionally dried one. Instead of a current density peak, an S-shape wave was formed at E = −2.20 V, marking the start of the first electrochemical reduction process. At E = −3.10 V, a second electroreduction process begins, forming an intensive current density peak at E = −3.40 V. At E = −4.00 V, the cathodic current density has a value o −0.38 mA cm−2, being ca. three times higher than for dried N4111(TFSI) (i = −0.11 mA cm−2) at the same potential. The electrochemical reoxidation processes in 80 ppm water containing N4111(TFSI) have low intensity and are irreversible. Some current density “humps” could be noticed towards the positive-going potential sweep at E = −3.10 V for the second process and at E = −1.50 V, where there was a wide wave marking the position of the first electroreduction process.
For additionally dried N4111(TFSI), the intensive electroreduction process started at E = −2.25 V, i.e., at ca. 350 mV more negative potentials than for 80 ppm residual water containing one. However, in dryer N4111(TFSI), the first electroreduction process seems to be even more intensive and quasi reversible as a clear oxidation current peak formed at E = −2.10 V (Figure 4). The first electroreduction process (i.e., the current density) obtained the maximum speed at E = −2.65 V (i = −0.15 mA cm−2), the following second electroreduction process had a smaller current density peak at E = −3.13 V (i = −0.12 mA cm−2). At E < −3.70 V, a slight and slow increase in the reduction current density took place. In the reverse scan, a current density peak for the first electroreduction process formed at E = −2.10 V.
Due to the large difference in the electrochemical behaviour of the 80 ppm water containing N4111(TFSI) and the additionally vacuum-dried one, the following electrochemical measurements were performed using vacuum-dried liquid.
The cyclic voltammograms measured with the potential sweep rate 1.0 mV s−1 at mmp-C(Mo2C) electrode in Ar glovebox using vacuum-dried N4111(TFSI) (Figure 5a) show broad charging–discharging curves measured in three potential ranges: first from 0.00 V to −2.00 V and reverse (black dashed line), second from 0.00 v to −3.00 V and reverse (grey line) and third from 0.00 V to −4.00 V and reverse (black line). There were no electrochemical processes notable within the potential range from −2.00 V to 0.00 V. The cathodic current density increased steeper at E ≤ −2.75 V in the measurement when the potential was swept within the potential range from 0.00 V to −3.00 V (Figure 5a, grey line). For the CV measurement performed within the potential range from 0.00 to −4.00 V and reverse (black line), a steep increase in the cathodic current was notable at E < −3.0 V. A small reoxidation process wave also formed at E = −0.45 V in the reverse sweep. It is obvious that the CV curves measured at v = 1.0 mV s−1 and at mmp-C(Mo2C) do not present detailed information about the faradic processes taking place at N4111(TFSI)|mmp-C(Mo2C) interface as they were hidden by intensive charging–discharging currents.
The CVs measured for dried N4111(TFSI) at mmp-C(Mo2C) and v = 0.25 mV s−1 within the potential range from 0.00 V to −3.00 V and reverse indicate the start of an intensive electroreduction process at E ≤ −2.70 V (Figure 5b). After the second scan up to E = −3.00 V, the electroreduction current densities started to increase already at E ≤ −2.00 V. A cathodic current wave formed with a minimum i = −3.13 mA cm−2 at E = −3.80 V (Figure 5b, dashed line). Thus, it seems that the N4111(TFSI)|mmp-C(Mo2C) interface became electrochemically more active.
The difference in the shapes of the CV curves measured within the potential range from 0.00 V to −4.00 V (and reverse) for the N4111(TFSI)|mmp-C(Mo2C) interface at the potential sweep rates v = 1.0 mV s−1 (Figure 5a) and v = 0.25 mV s−1 (Figure 5b) can be explained by a slow mass transport in the mmp-C(Mo2C) electrode pores. Thus, the C-μEs are more suitable for the collection of the CV data when higher potential sweep rates are desired to apply in moderately conducting electrolyte solution.
EIS data measured at N4111(TFSI)|mmp-C(Mo2C) interface in the Ar glovebox were unstable at all applied potentials (i.e., at −4.00 V < E < 0.00 V) and could not be used for the following data analysis. The instability of the system was probably caused by the instant corrosion of the Al surface (causing unstable blocking by a corrosion product) when they became in contact with N4111(TFSI) [35].
Surprisingly, it was found that the electrical contact was much stabler if the EIS measurements were performed at reduced pressure, at P = 600 Pa. This can indicate that the blocking effect of the Al corrosion products could be reduced in mild vacuum conditions stabilising the contact between mmp-C(Mo2C) electrode and Al holder contacts. The CVs for N4111(TFSI) at mmp-C(Mo2C) measured in vacuum are shown in Figure 6. Intensive electrochemical reduction of the N4111(TFSI) started at ca. E = −2.6 V and a cathodic current density peak formed at E = −3.43 V. This cathodic peak overlapped with the occurrence of the intensive electroreduction processes noted for 80 ppm water containing N4111(TFSI) at C-μE (v = 1.0 mV s−1, Figure 4) and roughly with the voltammetric wave noted for extra dried N4111(TFSI) at mmp-C(Mo2C) (v = 0.25 mV s−1, Figure 5b). However, no more detailed electrochemical information can be read from the CVs, measured at mmp-C(Mo2C).
The EIS Nyquist plots, measured, are presented in Figure 7. They indicate the increase in the series resistance (Rs) at E ≤ −2.0 V and the disappearance of the steep increase in the impedance imaginary part values (−Z″) at low frequencies and at E < −2.0 V. Parallel to that, the width of the high-frequency semicircle (i.e., the values of the parallel resistance (Rp), marking the mass transport resistance inside the mmp-C(Mo2C) pores [36,37,38,39]), increases. The detailed behaviour of the Rs and Rp values is shown in Figure 8. The Rs values are stable within the potential range from 0.00 V to −2.20 V. At E < −2.20 V, when the electroreduction of the residual water started and the chemical decomposition of N4111(TFSI) was noted in the in situ MS data (Supplementary information Table S1), a slight increase in the cathodic current values was observed in the CV curves measured at C-μE (Figure 4), and the Rs values started slowly to increase. At E < −2.00 V, a steep increase in Rs took place (Figure 8). The Rs values had a maximum at E = −2.40 V (just before the reduction current peak maximum at E = −2.65 V, noted for vacuum-dried N4111(TFSI) at C-μE, Figure 4). After that, a slow decrease took place until the final potential, E = −4.00 V, was applied (Figure 8). It should be noted that the changes in the Rs values are quite unstable, and this reflects the instability of the N4111(TFSI)|mmp-C(Mo2C) interface.
The Rp values (indicating the electron transfer speed) started to increase at E < −2.00 V, i.e., when the vacuum chamber pressure increase was noted during in situ MS measurements (Figure 3). The adsorption of N4111(TFSI) at mmp-C(Mo2C) surface was noted at E = −2.25 V based on the in situ XPS data (Table 2), just before the notable start of the first electroreduction process of N4111(TFSI) (measured for vacuum-dried N4111(TFSI), Figure 4). The Rp values became unstable at E < −2.30 V, indicating the formation of gas bubbles at mmp-C(Mo2C). A slight increase in the Rp values took place until the most negative potential E = −4.00 V was applied (Figure 8). The formation of the gas bubbles at E < −2.30 V could also explain the maximum of Rs values at E = −2.40 V and following reduction in Rs at more negative E values, i.e., at the conditions of intensive gas evolution and the mixing of N4111(TFSI) RTIL near the mmp-C(Mo2C) surface.
The series capacitance (Cs) values, calculated from EIS data measured at the modulation frequency ν = 0.1 Hz [38,40], indicate a slow increase from 0.00 V to −1.50 V (Figure 9a). At E < −1.90 V, a steeper increase took place, giving a high Cs = 0.60 F cm−2 peak value at E = −2.30 V. After that, a sharp fall in Cs took place until the most negative potential, E = −3.40 V, where the EIS data could be analysed (Figure 9a). The parallel capacitance (Cp) values, calculated from the EIS data measured at the modulation frequency ν = 0.1 Hz [40], decreased slowly from the initial value Cp = 2.7 mF cm−2, measured at E = 0.00 V, until at E = −1.50 V, where a steep reduction in Cp started, reaching a minimum at E = −2.40 V (Figure 9b). After that, Cp increased until the most negative potential was applied, E = −3.40 V, where the EIS data could be analysed at ν = 0.1 Hz (Figure 9b).
The imaginary capacitance (C″) values, calculated from the EIS data measured at the modulation frequency ν = 0.1 Hz [38,40], were stable within the potential range from E = 0.00 V to E = −1.70 V (Figure 9c). Only this potential region can be applied for EDLC capacitive storage devices construction and later application using N4111(TFSI) RTIL. Then, the reduction in the C” values took place, indicating the chemisorption of N4111(TFSI) at mmp-C(Mo2C), obtaining a new stable level at E ≤ −2.60 V (Figure 9b) after the passing of the first electroreduction process maximum at E = −2.65 V measured for vacuum-dried N4111(TFSI) at C-μE (Figure 4).

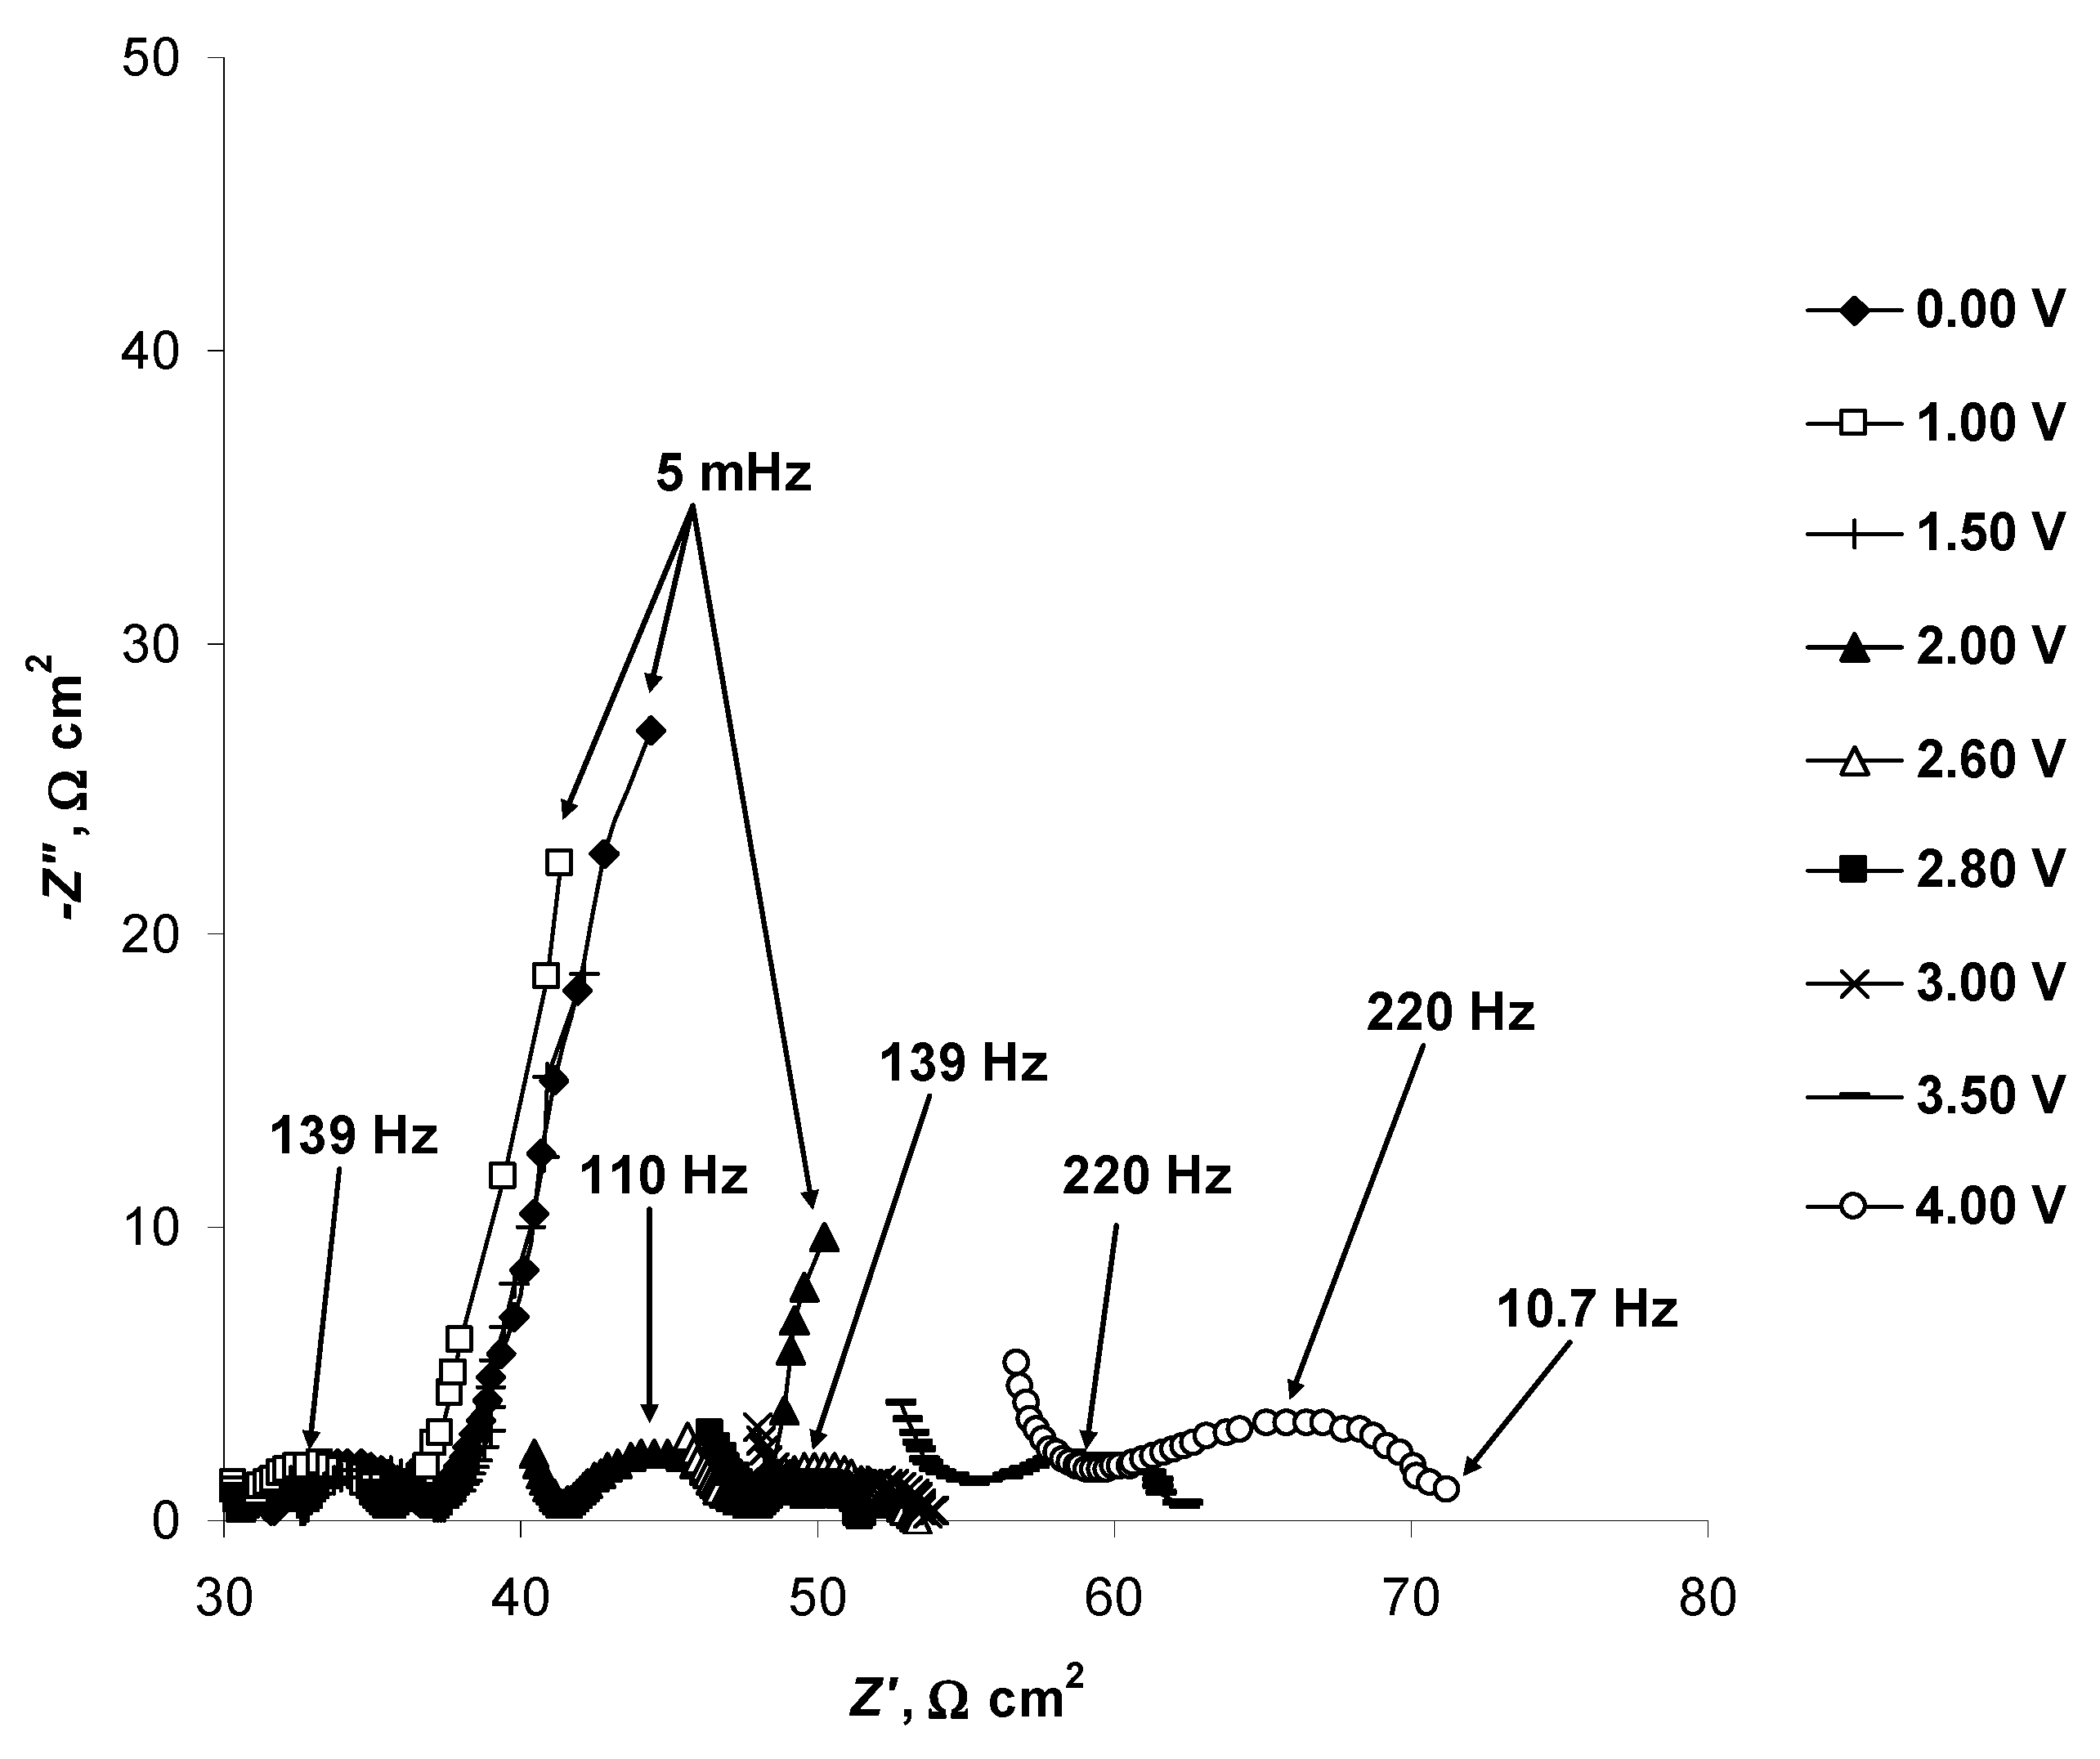
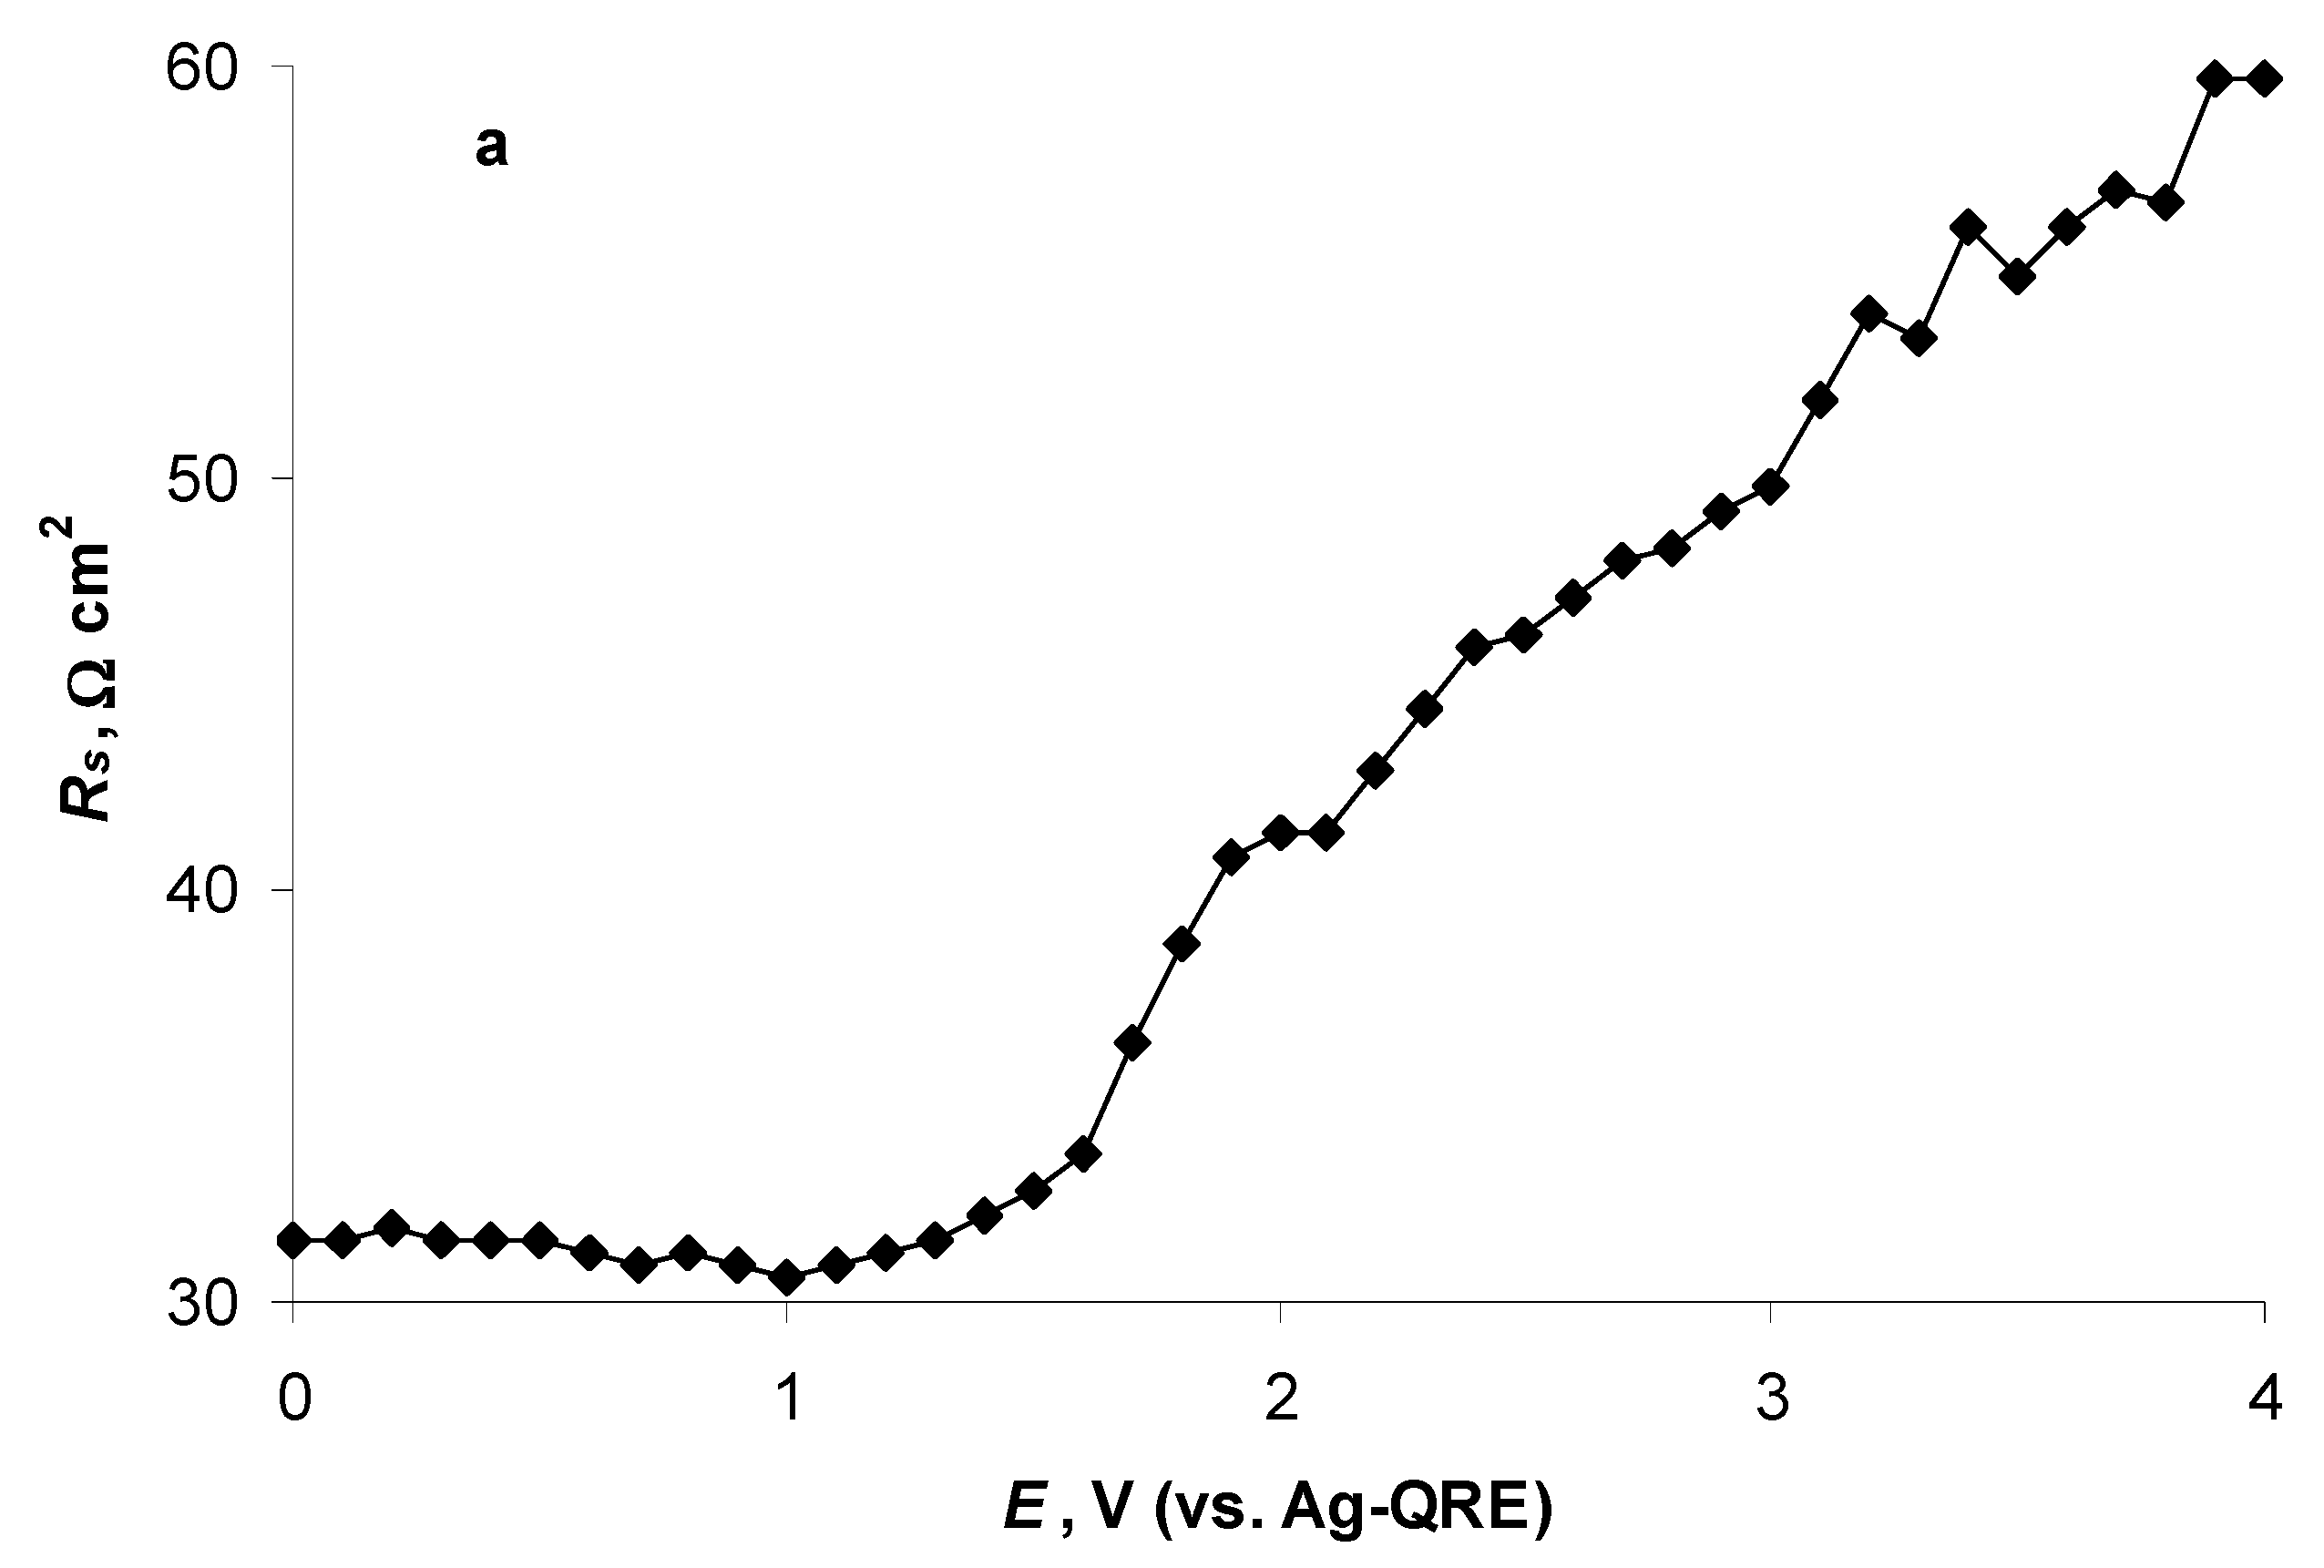
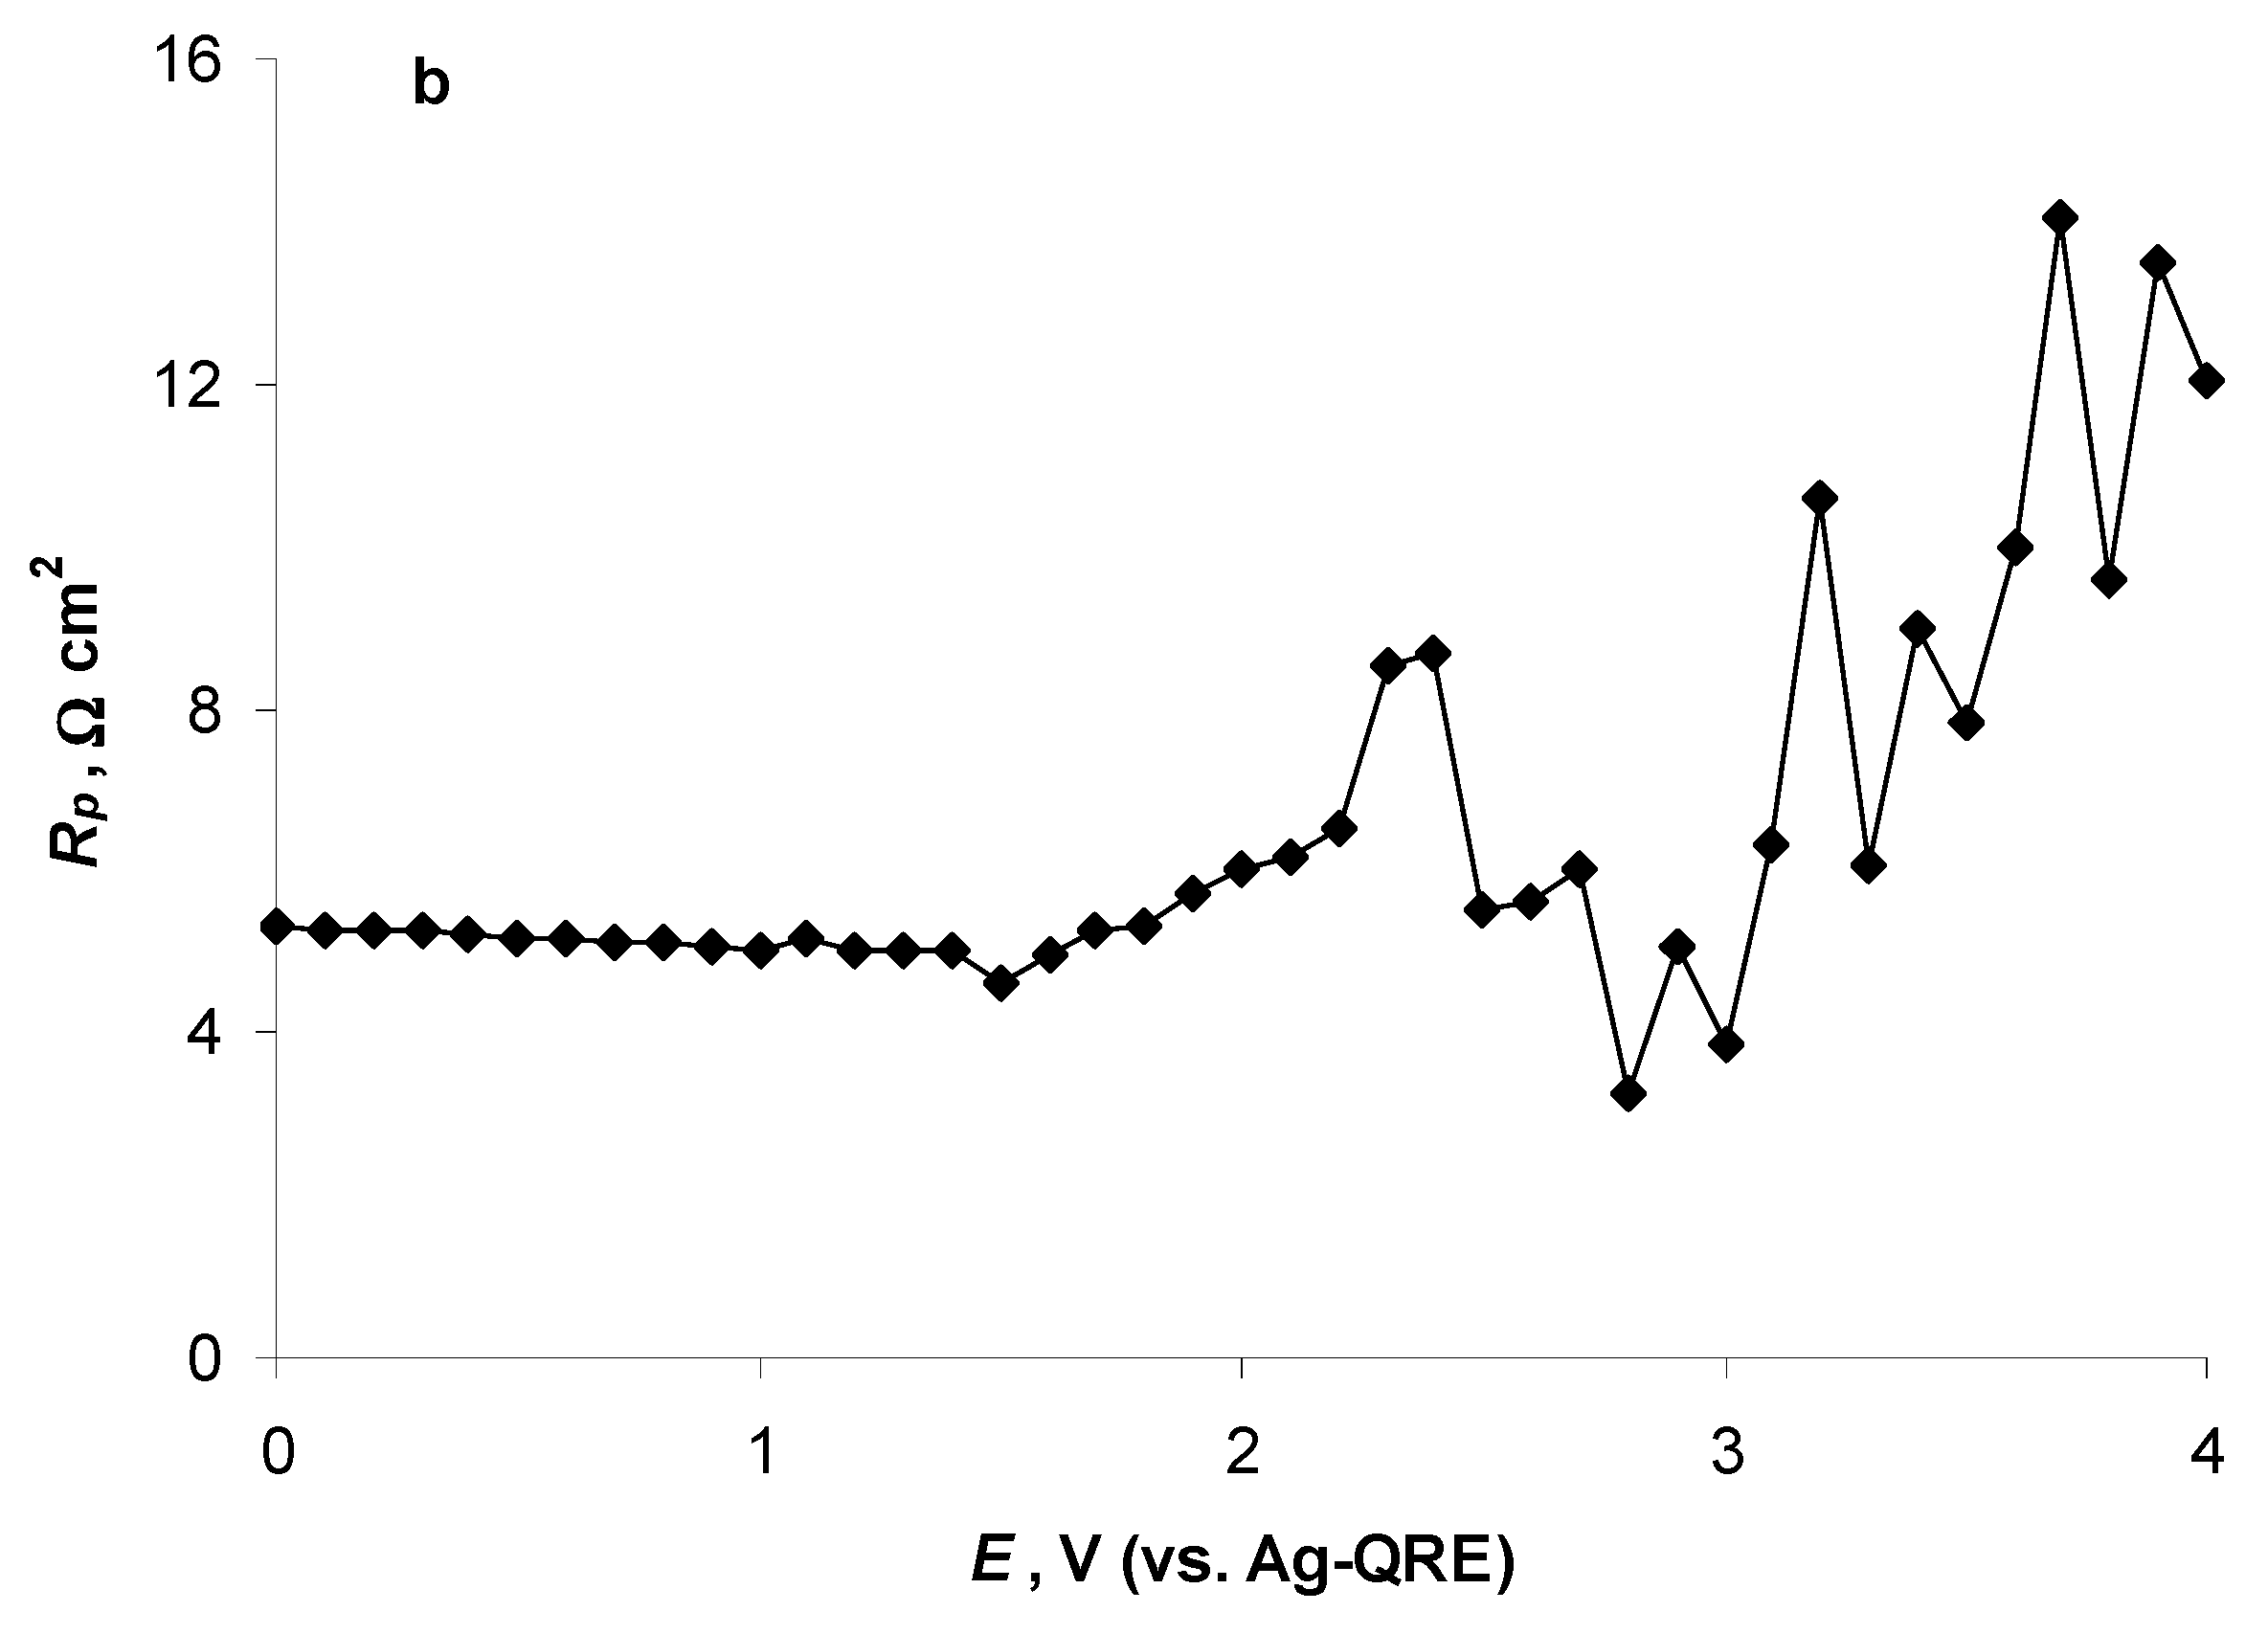
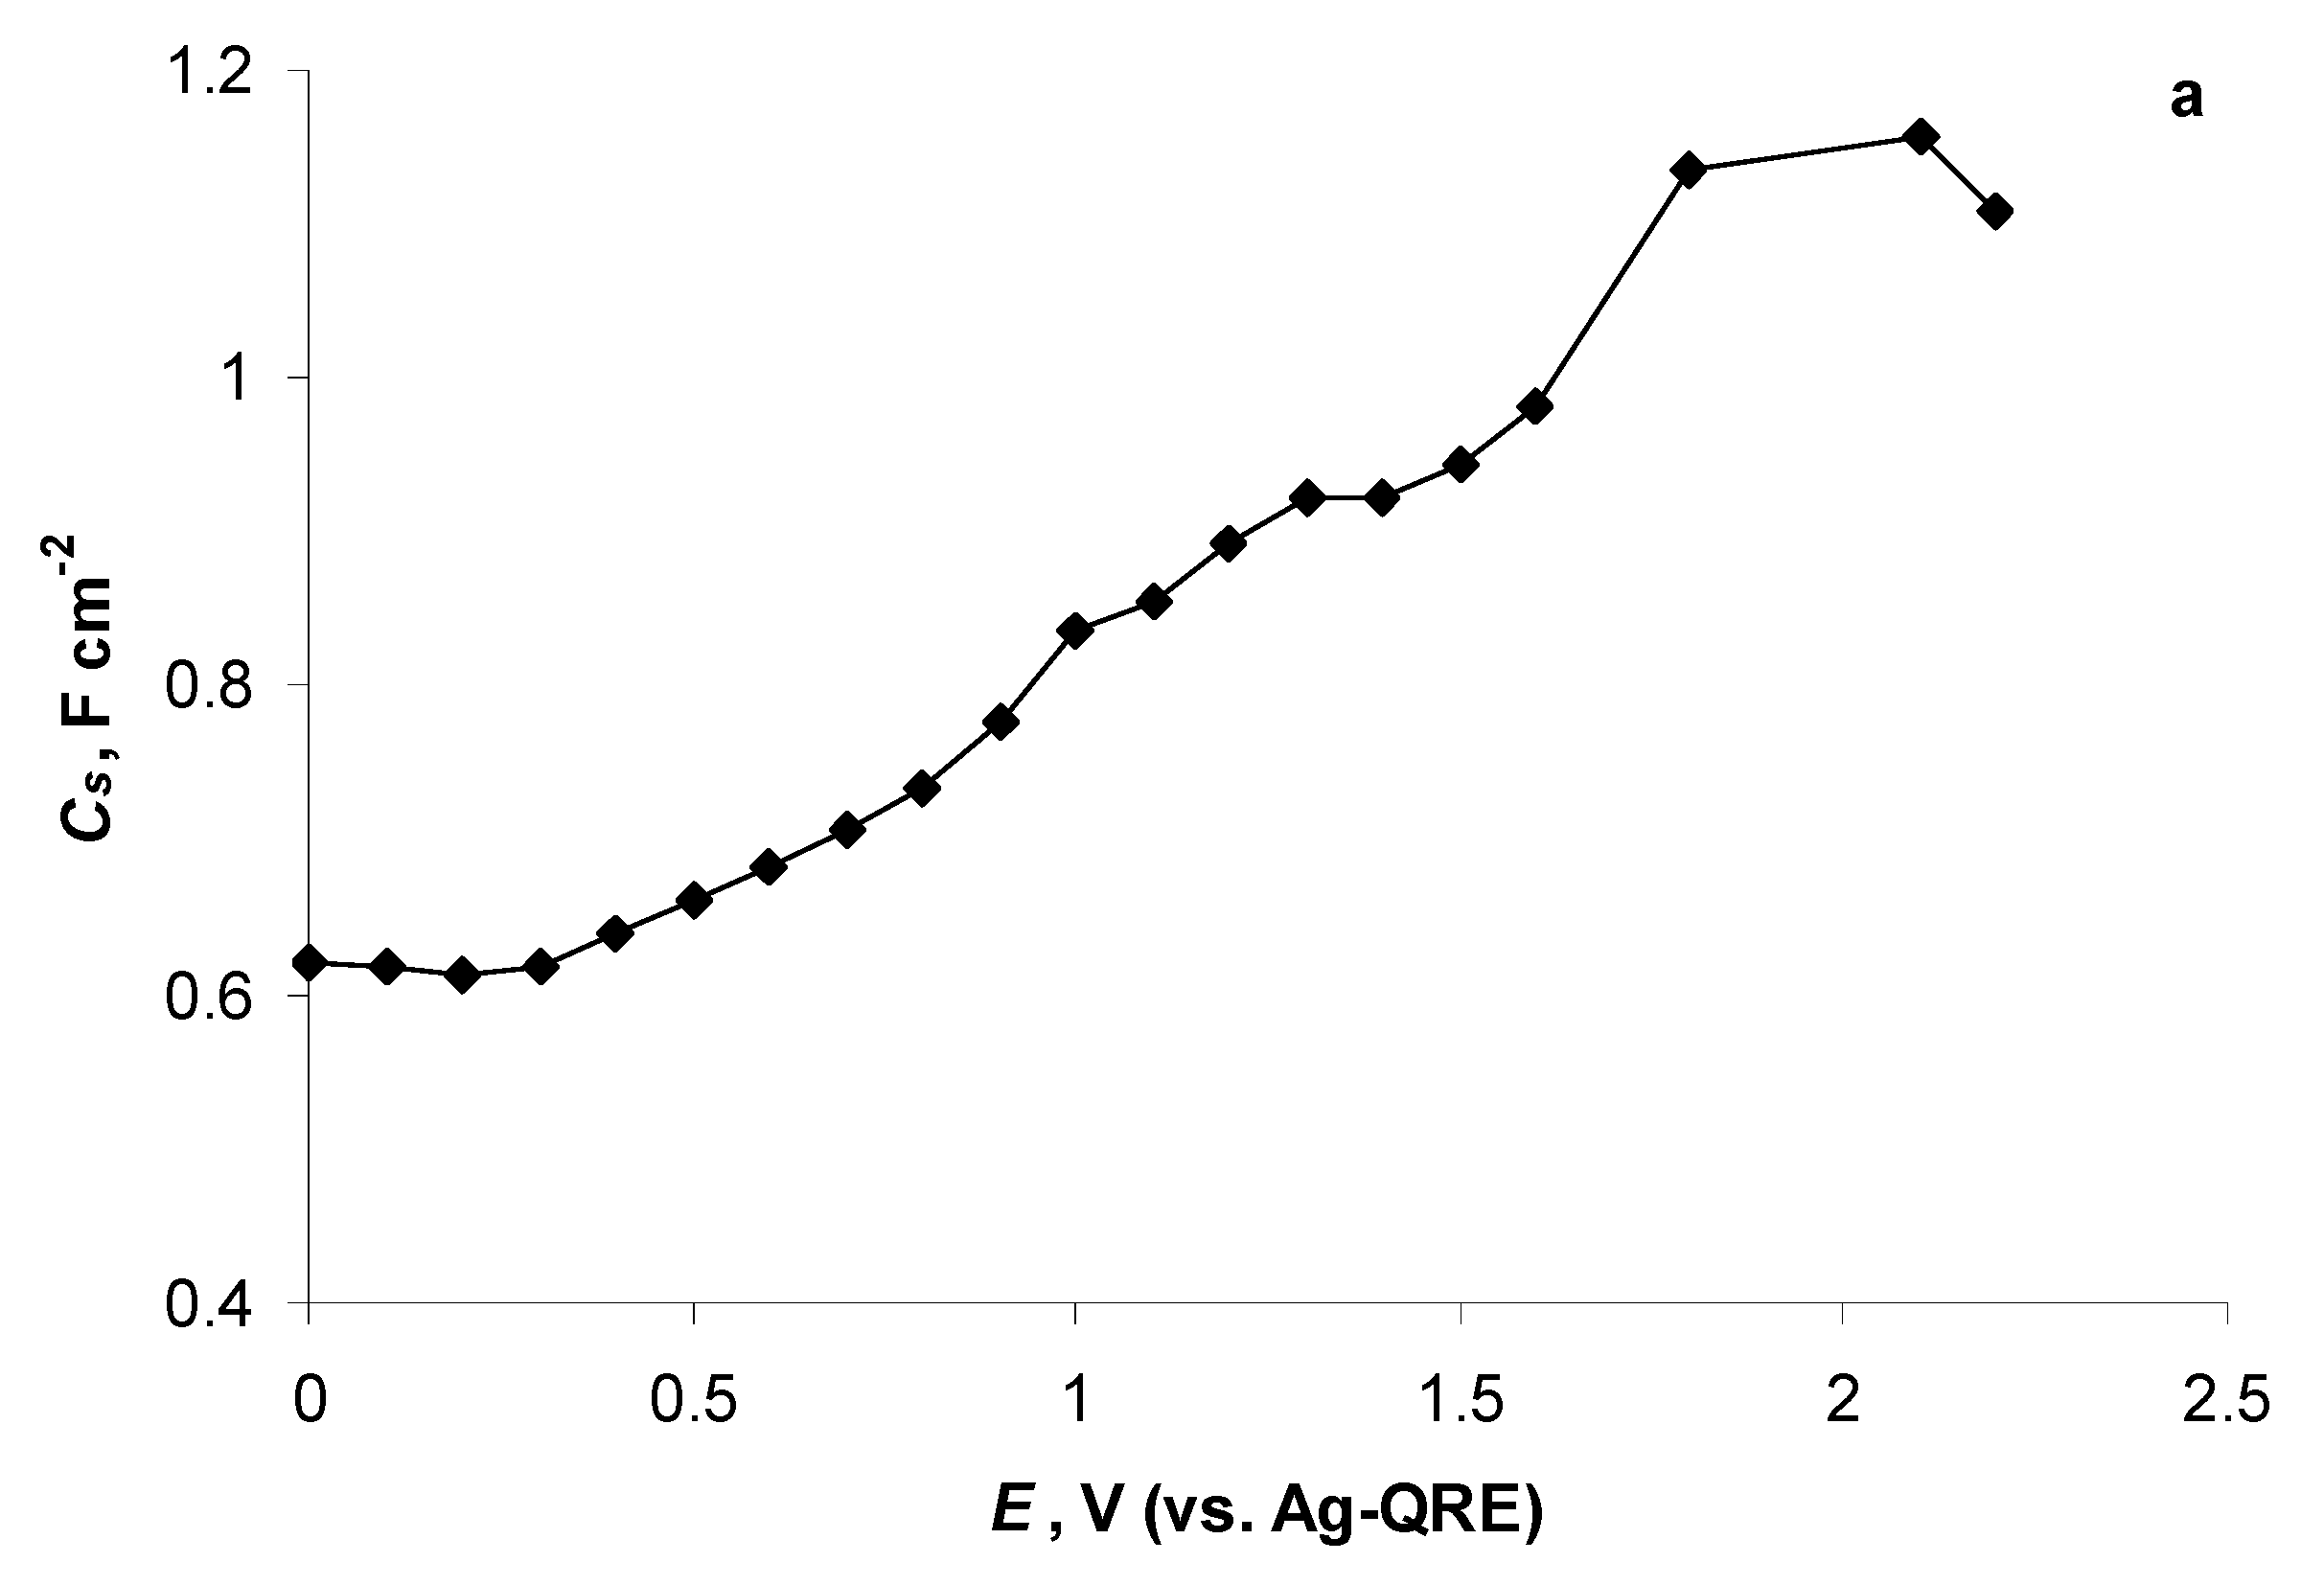
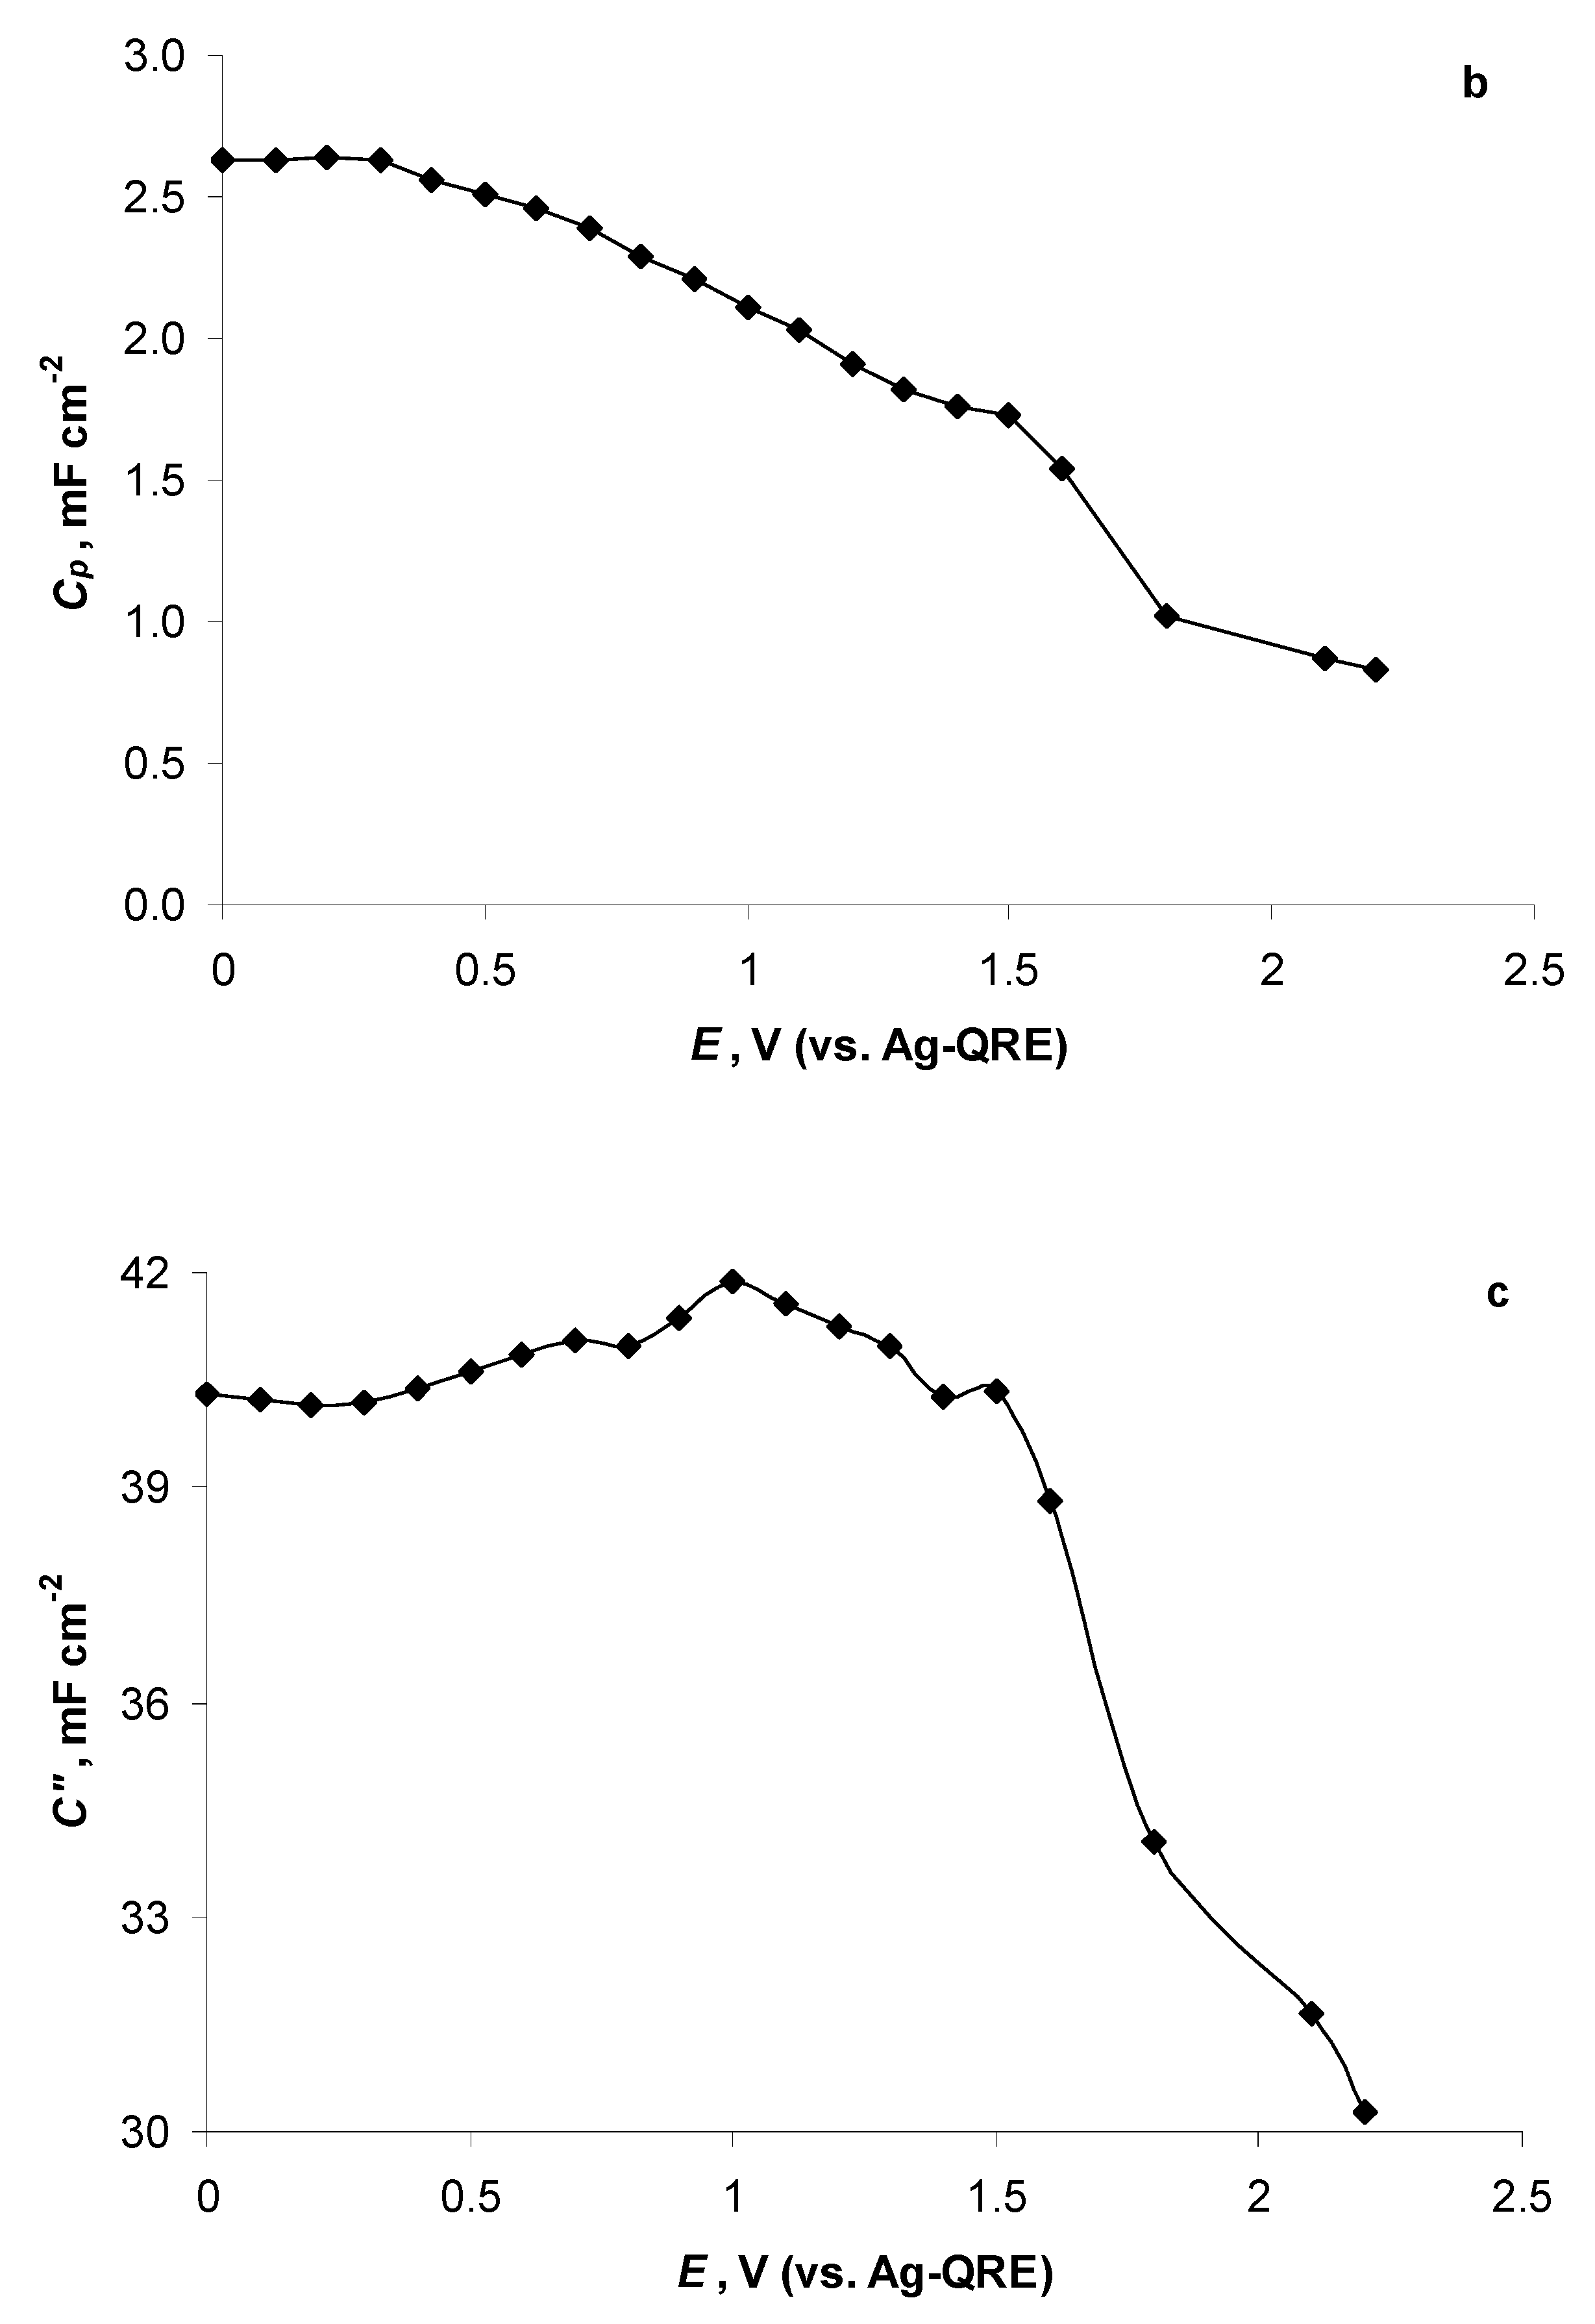
2.5. Electrochemical Behaviour of N4111(TFSI) at Positively Polarised mmp-C(Mo2C) Electrode

To explore the electrochemical properties of N4111(TFSI) at positive potentials, additionally in the vacuum chamber, dried N4111(TFSI) at the C-μE electrode was investigated, performing CV measurements at various potential sweep rates in the Ar glovebox at the normal pressure. The cyclic voltammograms, measured at v = 1.0 mV s−1, indicate a slight increase in the electrooxidation current densities at E > 1.10 V (Figure 10). A steep increase in the electrooxidation current densities took place at E > 1.70 V.
The CV curves (i.e., charging–discharging curves), measured at mmp-(C(Mo2C) inside the Ar-filled glovebox, become distorted at v ≥ 1.0 mV s−1 (Supplementary information Figures S1 and S2). Therefore, the CVs, measured at v = 0.25 mV s−1, are discussed next. The CVs for mmp-(C(Mo2C) indicate that the electro-oxidation current started to slowly increase at E ≥ 1.50 V and this process continued up to the highest potential, E = 4.00 V (Figure 11). A notable increase in the current density was observable at E > 2.50 V, indicating the start of an intensive electrooxidation process. The CV, measured within the wider potential sweep range (0.00 < E < 4.00 V), indicates a distorted rectangular shape of the mmp-C(Mo2C) electrode charging–discharging curve at E = 0.00 V and the reduction in the anodic current slope at E > 2.50 V. This indicates slow mass transport even at a low potential sweep rate, v = 0.25 mV s−1, which can be caused by partial blocking of the mmp-C(Mo2C) pores taking place at E > 2.50 V (Figure 11). The CVs measured at N4111(TFSI)|mmp-C(Mo2C) interface did not contain remarkable voltammetric peaks and waves in the reversed potential sweeps. Therefore, it must be concluded that the anodic processes are irreversible.
Performing the EIS measurements at the positively polarised mmp-(C(Mo2C) electrodes, it appeared that the EIS data were very unstable (within the potential range 0.00 V < E < 3.00 V) and could not be used for the following analysis. Therefore, the possibility of the measurements of N4111(TFSI)|mmp-C(Mo2C) interface in the reduced pressure conditions were tested again. The cyclic voltammograms were measured at 600 Pa in the vacuum chamber at variable potential ranges and v = 1.0 mV s−1 (Figure 12). No faradic processes were observed within the potential sweep range from 0.00 V to 2.00 V and reverse (Figure 12, dashed black line). However, in the CV, where the potential sweep range was extended to 3.00 V, a very slow rise in the anodic current density started at E > 2.0 V (v = 1.0 mV s−1) after the first potential cycle up to 3.00 V, marking the start of an electrooxidation process (Figure 12, grey line).
Extending the CV maximum potential to E = 4.00 V an oxidation process wave formed at E = 2.05 V (v = 1.0 mV s−1), followed by the intensive anodic current density rise at E > 2.85 V (Figure 12, black line). This very low intensity and wide wave at ca. E = 2.0 V corresponds to the electrooxidation of the mmp-C(Mo2C) itself, noted previously when the 1-ethyl-3-methylimidazolim tetrafluoroborate (i.e., EMImBF4)|mmp-C(Mo2C) interface was studied [28], and appeared due to the electrochemical activation of the mmp-C(Mo2C) surface at E > 3.0 V. Surprisingly, this wave at ca. E = 2.0 V was the most intensive in the CVs measured with potential sweep speed 1.0 mV s−1 and disappeared at lower or higher v (Supplementary information Figure S3). Collected data show that the CV curve was less distorted at the lowest potential sweep speed applied, indicating very slow mass transport in the mmp-C(Mo2C) electrode.
The electrooxidation process taking place at E > 2.85 V corresponds to the electrooxidation of the N4111+ cation, as at E = 2.5 V, it has been noted and confirmed by MS analysis of electrochemical oxidation of the tetrabutylammonium (TBA) cations [41]. Surprisingly, the reaction scheme proposed by Nouri-Nigjeh et al. [41] does not indicate the oxidation of the positively charged nitrogen atoms. Instead, the carbon atom at position three in the butyl side chain seems to become oxidised, being vulnerable to a nucleophilic attack. This phenomenon would explain the stability of the N 1s spectra in the studied positive potential range. In the reverse scan, starting at 4.00 V and ending at 0.00 V, a low-intensity, very wide voltammetric wave (characteristic of a very slow electroreduction process) was located at ca. E = 0.7 V (Figure 12, black line).
The EIS Nyquist plots measured at low pressure (P = 600 Pa) indicate the increase in the Rs at E > 1.50 V and Rp at E > 3.00 V (Figure 13). At E > 2.00 V, the measurements became unstable at low frequencies. However, the high-frequency arc, marking the mass transport resistance through the mmp-C(Mo2C) porous matrix, was preserved, indicating that the pores do not become blocked by gas bubbles or some sort of polymer films formed at those potentials. The behaviour of Rs vs. E and Rp vs. E are described in detail in Figure 14a,b. It is characteristic that at E > 1.00 V, a slow increase in Rs values started, followed by a much steeper rise at E > 1.60 V. At E = 1.90 V, the increase in Rs slightly decreased (Figure 14a). Rp, i.e., the mass transport resistivity of the micro-mesopores, very slowly increased up to E = 2.20 V (Figure 14b). At more positive potentials, Rp values were unstable, indicating the formation of some gaseous products at the porous electrode. However, the trend of the Rp increase was still obvious until the most positive potential, E = 4.00 V, was applied. It is important to note that Rp started to increase at the same potential, where the value of the dBE vs. dE slope reduced (Table 4), marking the start of strong adsorption of N4111(TFSI) at mmp-C(Mo2C). Thus, strong adsorption of N4111(TFSI) at mmp-C(Mo2C) appears to be related to the start of the oxidation of the mmp-C(Mo2C) surface.
The Cs values, calculated from the EIS data, measured at ν = 0.1 Hz, started to increase at E ≥ 0.40 V and continued this trend up to E = 2.20 V, where the last confident EIS values at ν = 0.10 Hz were obtained (Figure 15a). It should be noted that the EIS data fluctuated since E > 2.20 V, influenced probably by the formation of some gaseous substances. The Cp values, calculated from the EIS data, started to decline at E ≥ 0.40 V and held this trend until the last potential, E = 2.20 V, where EIS data at ν = 0.10 Hz could be analysed (Figure 15b). The C″ values started to increase slightly at E ≥ 0.40 V, obtained the maximum at E = 1.00 V and thereafter decreased (Figure 15c). Some changes in the in situ XPS spectra were noted previously also for the EMImBF4|mmp-C(Mo2C) interface around E = 1.0 V (vs. Ag/AgCl in EMImBF4) [28]. At E ≥ 1.60 V, a steep reduction in C” values took place, indicating the strong adsorption of N4111(TFSI), confirmed by XPS data at E > 1.80 V (Table 4). At the same potentials, some increase in the Rs and Rp values was observed (Figure 14a,b).

3. Experimental

We investigated the characteristics of the Mo2C-derived micro-mesoporous carbon (mmp-C(Mo2C)) electrode (as a working electrode, WE), soaked with its tip into and covered with the RTIL in a quartz cell. The backside of the mmp-C(Mo2C) WE was coated with a thin layer of Al serving as a current collector. The physical- and gas-phase adsorption properties of mmp-C(Mo2C) have been described earlier [42,43,44]. The mmp-C(Mo2C) WE was polarised during the in situ XPS, in situ MS and electrochemical experiments using the three-electrode electrochemical system described in our previous work [27]. The mmp-C(Mo2C) electrode was fixed during the in situ XPS and MS measurements between the two gold holders and during the electrochemical measurements between the two aluminium holders. Platinum gauze (with an apparent area ca. 2 cm2 and grid size 100 mesh) was used as a counter electrode (CE) and silver wire as a quasi-reference electrode (Ag-QRE). Thus, all potentials indicated in the text are given in reference to the Ag-QRE located in the RTIL investigated. To minimise the resistance between the WE and Ag-QRE, the Ag wire was placed very close to the large surface area mmp-C(Mo2C) WE. The CE was located at a distance of 15 mm from the WE to reduce the polarisation voltage applied [27]. Additionally, a carbon fibre microelectrode (BASi, d = 11 μm) was used to collect reference data about N4111(TFSI) electrochemical properties. The CV and EIS data for N4111(TFSI)|mmp-C(Mo2C) interfaces were performed in a mBraun Ar-filled glovebox, containing less than 0.1 ppm water and oxygen, or in a vacuum chamber (P = 600 Pa). The potential step size was 5 mV to measure CVs. The alternating potential modulation amplitude was 5 mV. Reference 3000 (Gamry Instruments) or Autolab PGSTAT 302N (Metrohm) potentiostats were used to record electrochemical data and to polarise the mmp-C(Mo2C) electrode during the in situ XPS and MS measurements. The values of the series and parallel resistance were calculated by fitting the calculated impedance spectra to experimental ones using an equivalent circuit model containing the resistor in series, and the resistor and constant phase element connected in parallel. Autolab NOVA 1.11 software was used for EIS data fitting.
The in situ XPS measurements were conducted in the high vacuum (p = 5…10 × 10−5 Pa) conditions at the synchrotron initiated adjustable energy X-ray beamline FinEstBeAMS using gas-phase experiments end-station (Max IV Laboratory, Lund University, Sweden). The design of the synchrotron radiation beamline has been described in detail previously [45]. The following excitation photon energies were used: 400.0 eV for C 1s and S 2p, 500.0 eV for N 1s, 650.0 eV for O 1s and 800.0 eV for F 1s. XPS data analysis and binding energy (BE) spectra fitting were performed using CasaXPS (ver. 2.315) software. The C 1s XPS spectra were fitted using a combined Gaussian–Lorentz function with the ratio 70:30. For the calibration of the BE scale, the BE of the 1s electrons originating from the aliphatic carbon atoms in the alkyl chains (i.e., not connected with the ammonium nitrogen atom and having sp3 electronic configuration) was fixed at 285.0 eV, based on the non-polarised C(Mo2C) WE C 1s data [46]. This method enabled us to calibrate the measured XPS spectra internally. For the precise fitting and the extraction of the C 1s BE peaks, a two-peak model was selected for the analysis of the N4111+ cation core electron energies [47].
The N 1s, O 1s, F 1s and S 2p X-ray photoelectron (PE) spectra were fitted using the same combination ratio of the Gaussian–Lorentz function as described for C 1s XPS, leaving the PE peak full width at half maximum and peak positions-free. Later, the obtained individual peak BEs were corrected according to the BE of the aliphatic carbon, measured for every applied potential.
N4111(TFSI) (>99.5%, Iolitec), containing less than 50 ppm halides and 80 ppm water (according to producer’s certificate), was additionally dried at 100 °C and 10 kPa for 20 h and stored a short time thereafter in closed vials in the same Ar glovebox where the electrochemical studies were later performed. The assembled electrochemical cell, containing mmp-C(Mo2C) and other electrodes, was dried as well at 100 °C, 10 kPa for 20 h before the studies. Prior to in situ XPS measurements inside the appropriate measurement chambers, N4111(TFSI) was additionally dried and degassed for 12 h at 5 × 10⁻⁵ Pa and for 7 days at 3 × 10⁻⁶ Pa. For the in situ XPS, in situ MS and electrochemical investigations, 1 mL of the RTIL was inserted into the electrochemical cell. Before the electrochemical investigations in the Ar glovebox, the vessel filled with the RTIL was treated for 3 × 60 s in the glovebox lyses chamber with the vacuum in order to remove the gas from the mmp-C(Mo2C) pores and to fill them with the RTIL studied.
The gas-phase mass spectra were recorded by a quadrupole rest gas analyser Satellite LM61 (MKS Instruments, Spectra Products), analysing positively charged ions formed during the electron impact ionisation process. The ionising electrons had a kinetic energy of 70 eV and all discussion in the text about the measured mass spectra are based on the background corrected data. Only these generated mass signals exceeding twice the background signal (“noise”) were used in the following data analysis.
All experiments were performed at the room temperature, i.e., at T = 20 ± 1 °C.

4. Conclusions

The in situ X-ray photoelectron spectroscopy (XPS), in situ mass spectroscopy (MS), cyclic voltammetry (CV) and electrochemical impedance spectroscopy (EIS) methods were used to explore in more detail the electrochemical behaviour of butyl-trimethyl-ammonium bis(trifluoromethylsulfonyl)imide (N4111(TFSI)) at the negatively and positively polarised molybdenum carbide-derived micro-mesoporous carbon (mmp-C(Mo2C)) electrodes.
The shape of the C 1s, N 1s, O 1s, F 1s and S 2p binding energy (BE) spectra, measured by in situ XPS method, were stable for the N4111(TFSI)|mmp-C(Mo2C) interface within the electrode potential (E) range from 0.00 to 3.50 V (vs. Ag-QRE). However, these in situ XPS data also indicated that N4111(TFSI) adsorbed at the mmp-C(Mo2C) specifically at 0.00 < E < 2.00 V (dBE dE−1 ≈ −0.65 eV V−1). At E > 2.00 V, very strong adsorption of the N4111(TFSI) at the mmp-C(Mo2C) took take place (dBE dE−1 ≈ −0.25 eV V−1).
N4111(TFSI) was chemically stable within the potential range from 0.00 to −2.00 V (vs. Ag-QRE). The slope of the dBE dE−1 relationship for all elements investigated by in situ XPS was close to −1 eV V−1, indicating the non-specific adsorption character of the N4111+ cations and TFSI anions at the moderately negatively charged mmp-C(Mo2C) surface. At more negative potentials than −2.00 V (vs. Ag-QRE), very low dBE dE−1 values (−0.1 eV V−1) have been calculated, indicating the formation of a surface layer containing strongly adsorbed N4111+ cations and TFSI anions. At E < −3.25 V (vs. Ag-QRE), a small tail formed at the low BE side of the N 1s PE peak (corresponding to the N atom located in the ammonium cation), and at E < −2.50 V, a small tail formed at the S 2p3/2 PE peak of the low BE side. At E < −3.75 V (vs. Ag-QRE), a new separate PE peak formed in the F 1s spectrum, and its size expanded with the reduction in the C(Mo2C) potential, indicating the beginning of anion reduction. The C 1s spectra were stable at the negative potentials applied for the N4111(TFSI)|mmp-C(Mo2C) interface; thus, the N4111+ cations are stable at the negatively charged electrode surface.
Systematic analysis of collected data demonstrated that the investigated mmp-C(Mo2C) material soaked in N4111(TFSI) can be applied within a very wide potential region as the electrocatalyst support for hybrid supercapacitors (involving a catalytic reaction at one electrode), for polymer electrolyte membrane fuel cells or electrolysers and for the electroreduction of CO2. Very high stability and a wide ideal polarisation region are inevitable for correct analysis of the electrocatalytic reaction mechanisms under wide electrochemical cell potential region and high process rate. Another important issue influencing the electrochemical activity and stability of the electrocatalytically active metal particles is the adsorption behaviour of the used electrolyte. Thus, further studies of the adsorption behaviour of various room-temperature molten salts (i.e., electrolytes) are important.
The collected electrochemical data indicated that in the absence of a glovebox (filled with very clean Ar), the N4111(TFSI)-containing systems could be electrochemically investigated in a common inexpensive exicator at low pressure (P = 600 Pa), providing a sufficient oxygen- and moisture-free environment.

Supplementary Materials

The following are available online at https://www.mdpi.com/article/10.3390/catal11111315/s1, Table S1: Partial pressures for detected m/z fragments at the most characteristic potentials applied to N4111(TFSI)|mmp-C(Mo2C) interface, Table S2: List of possible compounds and fragments having by in situ mass-spectrometrically detected m/z, Figure S1: Cyclic voltammograms for N4111(TFSI) at mmp-C(Mo2C) measured in Ar glovebox at the ambient pressure, Figure S2: Cyclic voltammograms for N4111(TFSI) at mmp-C(Mo2C) measured in Ar glovebox at the ambient pressure, Figure S3: Cyclic voltammograms for N4111(TFSI) at mmp-C(Mo2C) measured at 600 Pa.

Author Contributions

Conceptualisation, J.K. and E.L.; methodology, J.K., R.P., E.L. and A.T.; formal analysis, J.K.; investigation, J.K., A.T., R.P. and M.K.; preparation of the studied object, T.T. and T.R.; writing—original draft preparation, J.K.; writing—review and editing, E.L.; supervision, V.K.; project administration, E.L., V.K. and J.K.; funding acquisition, E.L. and V.K. All authors have read and agreed to the published version of the manuscript.

Funding

This work was supported by the EU through the European Regional Development Fund under projects TK117 (3.2.0101e0030), TK 141 (2014-2020.4.01.15-0011), NAMUR+ (2014-2020.4.01.16-0123) and NAMUR (3.2.0304.12-0397); Estonian Research Council institutional research grants IUT20-13 and IUT20-57; Estonian Research Council grant MOBTP145; European Spallation Source: Estonian Participation in ESS Instrument design, development and building and application for scientific research (SLOKT12026T and SLTKT16432T); project “Production of Polymer Electrolyte Membrane Fuel Cell” (LLTKT20148) and project “Developing new research services and research infrastructures at MAX IV synchrotron radiation source” (2014-2020.4.01.20-0278).

Acknowledgments

We acknowledge MAX IV Laboratory (University of Lund, Sweden) for time on Beamline FinEstBeAMS under Proposal 20191001, research conducted at MAX IV (a Swedish national user facility supported by the Swedish Research council under contract 2018-07152), the Swedish Governmental Agency for Innovation Systems (under contract 2018-04969), and Formas (under contract 2019-02496). We also acknowledge FinEstBeAMS beamline managers Antti Kivimäki and Kirill Chernenko for their very kind support. Arvo Tõnisoo and Mati Kook are thankful for CALIPSOplus for the travel support. We thank Marco Kirm for the lending of the “Spectra” restgas analyser.

Conflicts of Interest

The authors declare no conflict of interest.

References

  1. Rao, C.J.; Venkatesan, K.A.; Nagarajan, K.; Srinivasan, T.G.; Rao, P.V. Electrodeposition of metallic uranium at near ambient conditions from room temperature ionic liquid. J. Nucl. Mater. 2011, 408, 25–29. [Google Scholar] [CrossRef]
  2. Wibowo, R.; Aldous, L.; Jacobs, R.M.; Manan, N.S.; Compton, R.G. Monitoring potassium metal electrodeposition from an ionic liquid using in situ electrochemical-X-ray photoelectron spectroscopy. Chem. Phys. Lett. 2011, 509, 72–76. [Google Scholar] [CrossRef]
  3. Wibowo, R.; Aldous, L.; Jacobs, R.M.; Manan, N.S.; Compton, R.G. In situ electrochemical-X-ray Photoelectron Spectroscopy: Rubidium metal deposition from an ionic liquid in competition with solvent breakdown. Chem. Phys. Lett. 2011, 517, 103–107. [Google Scholar] [CrossRef]
  4. Krishna, G.M.; Suneesh, A.S.; Venkatesan, K.A.; Antony, M.P. Electrochemical behavior of zirconium (IV) in 1-butyl-3-methylimidazolium bis (trifluoromethylsulfonyl) imide ionic liquid. J. Electroanal. Chem. 2016, 776, 120–126. [Google Scholar] [CrossRef]
  5. Wang, Y.S.; Chen, P.Y. Electrochemical Study and Electrodeposition of Zn-Ni Alloys in an Imide-Type Hydrophobic Room-Temperature Ionic Liquid: Feasibility of Using Metal Chlorides as the Metal Sources. J. Electrochem. Soc. 2018, 165, D76–D82. [Google Scholar] [CrossRef]
  6. Bourbos, E.; Giannopoulou, I.; Karantonis, A.; Paspaliaris, I.; Panias, D. Reduction of light rare earths and a proposed process for Nd electrorecovery based on ionic liquids. J. Sustain. Metall. 2018, 4, 395–406. [Google Scholar] [CrossRef]
  7. Broder, T.L.; Silvester, D.S.; Aldous, L.; Hardacre, C.; Crossley, A.; Compton, R.G. The electrochemical oxidation and reduction of nitrate ions in the room temperature ionic liquid [C2mim][NTf2]; the latter behaves as a ‘melt’rather than an ‘organic solvent’. New J. Chem. 2007, 31, 966–972. [Google Scholar] [CrossRef]
  8. Zhu, Y.L.; Kozuma, Y.; Katayama, Y.; Miura, T. Electrochemical behavior of Ni (II)/Ni in a hydrophobic amide-type room-temperature ionic liquid. Electrochim. Acta 2009, 54, 7502–7506. [Google Scholar] [CrossRef]
  9. MacFarlane, D.R.; Pringle, J.M.; Howlett, P.C.; Forsyth, M. Ionic liquids and reactions at the electrochemical interface. Phys. Chem. Chem. Phys. 2010, 12, 1659–1669. [Google Scholar] [CrossRef] [PubMed] [Green Version]
  10. Zhu, Y.L.; Katayama, Y.; Miura, T. Effects of Cations on Electrochemical Behavior of Ni (II)/Ni in a Hydrophobic Ionic Liquid. ECS Trans. 2015, 69, 1. [Google Scholar] [CrossRef]
  11. Gebresilassie Eshetu, G.; Armand, M.; Scrosati, B.; Passerini, S. Energy storage materials synthesized from ionic liquids. Angew. Chem. Int. Ed. 2014, 53, 13342–13359. [Google Scholar] [CrossRef]
  12. Watanabe, M.; Thomas, M.L.; Zhang, S.; Ueno, K.; Yasuda, T.; Dokko, K. Application of Ionic Liquids to Energy Storage and Conversion Materials and Devices. Chem. Rev. 2017, 117, 7190–7239. [Google Scholar] [CrossRef] [PubMed] [Green Version]
  13. Lim, H.K.; Kim, H. The mechanism of room-temperature ionic-liquid-based electrochemical CO2 reduction: A review. Molecules 2017, 22, 536. [Google Scholar] [CrossRef] [PubMed]
  14. Rosen, B.A.; Hod, I. Tunable Molecular-Scale Materials for Catalyzing the Low-Overpotential Electrochemical Conversion of CO2. Adv. Mater. 2018, 30, 1706238. [Google Scholar] [CrossRef] [PubMed]
  15. Mota-Lima, A.; Alcântara, M.L.; Pérez-Sanz, F.J.; Bazito, R.C.; Vidinha, P.; de Brito Alves, R.M.; do Nascimento, C.A.O. High-Pressure Carbon Dioxide Separation Using Ionic Liquids: A CO2-Electrocatalysis Perspective. J. Electrochem. Soc. 2021, 168, 086502. [Google Scholar] [CrossRef]
  16. Bengio, D.; Mendes, E.; Pellet-Rostaing, S.; Moisy, P. Electrochemical behavior of platinum and gold electrodes in the aprotic ionic liquid N, N-Trimethylbutylammonium Bis (trifluoromethanesulfonyl) imide. J. Electroanal. Chem. 2018, 823, 445–454. [Google Scholar] [CrossRef]
  17. Montiel, M.A.; Solla-Gullón, J.; Sanchez-Sanchez, C.M. Electrochemical reactivity and stability of platinum nanoparticles in imidazolium-based ionic liquids. J. Solid State Electrochem. 2016, 20, 1043–1052. [Google Scholar] [CrossRef] [Green Version]
  18. Howlett, P.C.; Izgorodina, E.I.; Forsyth, M.; MacFarlane, D.R. Electrochemistry at negative potentials in bis (trifluoromethanesulfonyl) amide ionic liquids. Z. Für Phys. Chem. 2006, 220, 1483–1498. [Google Scholar] [CrossRef]
  19. Markevich, E.; Sharabi, R.; Borgel, V.; Gottlieb, H.; Salitra, G.; Aurbach, D.; Semrau, G.; Schmidt, M.A. In situ FTIR study of the decomposition of N-butyl-N-methylpyrrolidinium bis (trifluoromethanesulfonyl) amide ionic liquid during cathodic polarization of lithium and graphite electrodes. Electrochim. Acta 2010, 55, 2687–2696. [Google Scholar] [CrossRef]
  20. Ismail, A.S.; El Abedin, S.Z.; Höfft, O.; Endres, F. Unexpected decomposition of the bis (trifluoromethylsulfonyl) amide anion during electrochemical copper oxidation in an ionic liquid. Electrochem. Commun. 2010, 12, 909–911. [Google Scholar] [CrossRef]
  21. Lane, G.H. Electrochemical reduction mechanisms and stabilities of some cation types used in ionic liquids and other organic salts. Electrochim. Acta 2012, 83, 513–528. [Google Scholar] [CrossRef]
  22. Klug, C.L.; Bridges, N.J.; Visser, A.E.; Crump, S.L.; Villa-Aleman, E. Electrochemical degradation of butyltrimethylammonium bis (trifluoromethylsulfonyl) imide for lithium battery applications. New J. Chem. 2014, 38, 3879–3884. [Google Scholar] [CrossRef]
  23. Mousavi, M.P.; Kashefolgheta, S.; Stein, A.; Bühlmann, P. Electrochemical stability of quaternary ammonium cations: An experimental and computational study. J. Electrochem. Soc. 2016, 163, H74–H80. [Google Scholar] [CrossRef] [Green Version]
  24. Morozova, P.A.; Luchinin, N.D.; Rupasov, D.P.; Katorova, N.S.; Fedotov, S.S.; Nikitina, V.A.; Stevenson, K.J.; Abakumov, A.M. Electrochemical instability of bis (trifluoromethylsulfonyl) imide based ionic liquids as solvents in high voltage electrolytes for potassium ion batteries. Mendeleev Commun. 2020, 30, 679–682. [Google Scholar] [CrossRef]
  25. Howlett, P.C.; Brack, N.; Hollenkamp, A.F.; Forsyth, M.; MacFarlane, D.R. Characterization of the Lithium Surface in N-Methyl-N-Alkylpyrrolidinium Bis (trifluoromethanesulfonyl) amide Room-Temperature Ionic Liquid Electrolytes. J. Electrochem. Soc. 2006, 153, A595–A606. [Google Scholar] [CrossRef] [Green Version]
  26. Tułodziecki, M.; Tarascon, J.M.; Taberna, P.L.; Guéry, C. Catalytic reduction of TFSI-containing ionic liquid in the presence of lithium cations. Electrochem. Commun. 2017, 77, 128–132. [Google Scholar] [CrossRef] [Green Version]
  27. Kruusma, J.; Tõnisoo, A.; Pärna, R.; Nõmmiste, E.; Tallo, I.; Romann, T.; Lust, E. Influence of the negative potential of molybdenum carbide derived carbon electrode on the in situ synchrotron radiation activated X-ray photoelectron spectra of 1-ethyl-3-methylimidazolium tetrafluoroborate. Electrochim. Acta 2016, 206, 419–426. [Google Scholar] [CrossRef]
  28. Kruusma, J.; Tonisoo, A.; Pärna, R.; Nõmmiste, E.; Vahtrus, M.; Siinor, L.; Tallo, I.; Romann, T.; Lust, E. Influence of iodide ions concentration on the stability of 1-Ethyl-3-methylimidazolium Tetrafluoroborate| molybdenum carbide derived carbon electrode interface. J. Electrochem. Soc. 2017, 164, A1110A–A1119. [Google Scholar] [CrossRef] [Green Version]
  29. Kruusma, J.; Tõnisoo, A.; Pärna, R.; Nõmmiste, E.; Lust, E. In Situ X-ray Photoelectron Spectroscopic and Electrochemical Studies of the Bromide Anions Dissolved in 1-Ethyl-3-Methyl Imidazolium Tetrafluoroborate. Nanomaterials 2019, 9, 304. [Google Scholar] [CrossRef] [Green Version]
  30. Quan, T.; Härk, E.; Xu, Y.; Ahmet, I.; Höhn, C.; Mei, S.; Lu, Y. Unveiling the Formation of Solid Electrolyte Interphase and its Temperature Dependence in “Water-in-Salt” Supercapacitors. ACS Appl. Mater. Interfaces 2021, 13, 3979–3990. [Google Scholar] [CrossRef]
  31. Aurbach, D.; Zaban, A.; Ein-Eli, Y.; Weissman, I.; Chusid, O.; Markovsky, B.; Levi, M.; Levi, E.; Schechter, A.; Granot, E. Recent studies on the correlation between surface chemistry, morphology, three-dimensional structures and performance of Li and Li-C intercalation anodes in several important electrolyte systems. J. Power Sources 1997, 68, 91–98. [Google Scholar] [CrossRef]
  32. Aurbach, D.; Weissman, I.; Zaban, A.; Chusid, O. Correlation between surface chemistry, morphology, cycling efficiency and interfacial properties of Li electrodes in solutions containing different Li salts. Electrochim. Acta 1994, 39, 51–71. [Google Scholar] [CrossRef]
  33. Hamm, U.W.; Lazarescu, V.; Kolb, D.M. Adsorption of pyrazine on Au (111) and Ag (111) electrodes an ex situ XPS study. J. Chem. Soc. Faraday Trans. 1996, 92, 3785–3790. [Google Scholar] [CrossRef]
  34. Zhou, W.; Kolb, D.M. Influence of an electrostatic potential at the metal/electrolyte interface on the electron binding energy of adsorbates as probed by X-ray photoelectron spectroscopy. Surf. Sci. 2004, 573, 176–182. [Google Scholar] [CrossRef]
  35. Goldman, J.L.; McEwen, A.B. EMIIm and EMIBeti on aluminum anodic stability dependence on lithium salt and propylene carbonate. Electrochem. Solid State Lett. 1999, 2, 501–503. [Google Scholar] [CrossRef]
  36. Lust, E.; Nurk, G.; Jänes, A.; Arulepp, M.; Permann, L.; Nigu, P.; Möller, P. Electrochemical properties of nanoporous carbon electrodes. Condens. Matter Phys. 2002, 5, 307–327. [Google Scholar] [CrossRef] [Green Version]
  37. Yoon, S.; Jang, J.H.; Bok, H.K.; Oh, S.M. Complex capacitance analysis on rate capability of electric-double layer capacitor (EDLC) electrodes of different thickness. Electrochim. Acta 2005, 50, 2255–2262. [Google Scholar] [CrossRef]
  38. Jänes, A.; Thomberg, T.; Tõnurist, K.; Kurig, H.; Laheäär, A.; Lust, E. Micro-and mesoporous carbide-derived carbon materials and polymer membranes for supercapacitors. ECS Trans. 2008, 16, 57–67. [Google Scholar] [CrossRef]
  39. Yoon, S.; Lee, C.W.; Oh, S.M. Characterization of equivalent series resistance of electric double-layer capacitor electrodes using transient analysis. J. Power Sources 2010, 195, 4391–4399. [Google Scholar] [CrossRef]
  40. Härmas, R.; Palm, R.; Härmas, M.; Pohl, M.; Kurig, H.; Tallo, I.; Tee, E.; Vaas, I.; Väli, R.; Romann, T.; et al. Influence of porosity parameters and electrolyte chemical composition on the power densities of non-aqueous and ionic liquid based supercapacitors. Electrochim. Acta 2018, 283, 931–948. [Google Scholar] [CrossRef]
  41. Nouri-Nigjeh, E.; de Vries, M.P.; Bruins, A.P.; Bischoff, R.; Permentier, H.P. Electrochemical oxidation of quaternary ammonium electrolytes: Unexpected side reactions in organic electrochemistry. Electrochem. Commun. 2012, 21, 54–57. [Google Scholar] [CrossRef]
  42. Jänes, A.; Thomberg, T.; Kurig, H.; Lust, E. Nanoscale fine-tuning of porosity of carbide-derived carbon prepared from molybdenum carbide. Carbon 2009, 47, 23–29. [Google Scholar] [CrossRef]
  43. Kurig, H.; Jänes, A.; Lust, E. Electrochemical characteristics of carbide-derived carbon| 1-ethyl-3-methylimidazolium tetrafluoroborate supercapacitor cells. J. Electrochem. Soc. 2010, 157, A272–A279. [Google Scholar] [CrossRef]
  44. Thomberg, T.; Jänes, A.; Lust, E. Energy and power performance of electrochemical double-layer capacitors based on molybdenum carbide derived carbon. Electrochim. Acta 2010, 55, 3138–3143. [Google Scholar] [CrossRef]
  45. Kooser, K.; Kivimäki, A.; Turunen, P.; Pärna, R.; Reisberg, L.; Kirm, M.; Valden, M.; Huttula, M.; Kukk, E. Gas-phase endstation of electron, ion and coincidence spectroscopies for diluted samples at the FinEstBeAMS beamline of the MAX IV 1.5 GeV storage ring. J. Synchrotron Radiat. 2020, 27, 1080–1091. [Google Scholar] [CrossRef] [PubMed]
  46. Blundell, R.K.; Licence, P. Quaternary ammonium and phosphonium based ionic liquids: A comparison of common anions. Phys. Chem. Chem. Phys. 2014, 16, 15278–15288. [Google Scholar] [CrossRef] [PubMed] [Green Version]
  47. Johnson, L.; Ejigu, A.; Licence, P.; Walsh, D.A. Hydrogen oxidation and oxygen reduction at platinum in protic ionic liquids. J. Phys. Chem. C 2012, 116, 18048–18056. [Google Scholar] [CrossRef]
Figure 1. In situ XPS data measured at variable mmp-C(Mo2C) electrode potentials, marked in figures, for: C 1s, tick mark labels 100 counts s−1 (a); for N 1s, tick mark labels 140 counts s−1 (b); for O 1s, tick mark labels 20 counts s−1 (c); for S 2p, tick mark labels 100 counts s−1 (d); and for F 1s, tick mark labels 5 counts s−1 (e).
Catalysts 11 01315 g001aCatalysts 11 01315 g001b
Figure 2. In situ XPS data measured at variable mmp-C(Mo2C) electrode potentials, marked in figures, for: (a) C 1s, tick mark label 70 counts s−1; (b) N 1s, tick mark label 20 counts s−1; (c) O 1s, tick mark label 50 counts s−1; (d) S 2p, tick mark label 90 counts s−1; and (e) F 1s, tick mark label 11 counts s−1.
Catalysts 11 01315 g002aCatalysts 11 01315 g002b
Figure 3. The vacuum chamber pressure dependence upon the potential applied to the mmp-C(Mo2C) electrode soaked in N4111(TFSI).
Catalysts 11 01315 g003
Figure 4. Cyclic voltammograms for N4111(TFSI) at C-micro electrode measured in Ar glovebox at the ambient pressure: 80 ppm water containing N4111(TFSI), black line; additionally dried N4111(TFSI), grey line. Potential sweep rate was 1.0 mV s−1 and the second cycles are presented. All cycles started and ended at 0.00 V; the potential sweep turnover potential was −4.00 V.
Catalysts 11 01315 g004
Figure 5. Cyclic voltammograms for N4111(TFSI) at mmp-C(Mo2C) measured in Ar glovebox at the ambient pressure. The second cycles are presented. The forward sweep minimum potentials are indicated in the figure. All cycles started and ended at 0.00 V. Potential sweep rates were: (a) 1.0 mV s−1 and (b) 0.25 mV s−1.
Catalysts 11 01315 g005
Figure 6. Cyclic voltammograms for N4111(TFSI) at mmp-C(Mo2C) measured at P = 600 Pa. Potential sweep rate was 1.0 mV s−1 and the second cycles are presented. The forward sweep minimum potentials are indicated in the figure. All cycles started and ended at 0.00 V.
Catalysts 11 01315 g006
Figure 7. Nyquist plots for selected negative potentials measured for the N4111(TFSI)|mmp-C(Mo2C) interface at P = 600 Pa.
Catalysts 11 01315 g007
Figure 8. Series resistance (Rs) and parallel resistance (Rp) relationships upon the negative potential applied to the N4111(TFSI)|mmp-C(Mo2C) interface located at P = 600 Pa.
Catalysts 11 01315 g008
Figure 9. (a) Series capacitance (Cs), (b) parallel capacitance (Cp) and (c) imaginary capacitance (C″) relationships upon the negative potential applied to N4111(TFSI)|mmp-C(Mo2C) interface located at P = 600 Pa.
Catalysts 11 01315 g009
Figure 10. Cyclic voltammograms for dried N4111(TFSI) measured at C-micro electrode in Ar glovebox at the ambient pressure. Potential sweep rate was 1.0 mV s−1 and the second cycles are presented. All cycles started and ended at 0.00 V; the potential sweep turnover potentials are indicated in the figure.
Catalysts 11 01315 g010
Figure 11. Cyclic voltammograms for N4111(TFSI) at mmp-C(Mo2C) measured in Ar glovebox at the ambient pressure. Potential sweep rate was 0.25 mV s−1 and the second cycles are presented. The forward sweep maximum potentials are indicated in the figure. All cycles started and ended at 0.00 V.
Catalysts 11 01315 g011
Figure 12. Cyclic voltammograms for N4111(TFSI) at mmp-C(Mo2C) measured at P = 600 Pa. Potential sweep rate was 1.0 mV s−1 and the second cycles are presented. The forward sweep maximum potentials are indicated in the figure. All cycles started and ended at 0.00 V.
Catalysts 11 01315 g012
Figure 13. Nyquist plots for selected positive potentials measured for the N4111(TFSI)|mmp-C(Mo2C) interface at P = 600 Pa.
Catalysts 11 01315 g013
Figure 14. (a) Series resistance (Rs) and (b) parallel resistance (Rp) relationships upon the positive potential applied to the N4111(TFSI)|mmp-C(Mo2C) interface located at P = 600 Pa.
Catalysts 11 01315 g014aCatalysts 11 01315 g014b
Figure 15. (a) Series capacitance (Cs), (b) parallel capacitance (Cp) and (c) imaginary capacitance (C″) relationships upon the positive potential applied to the N4111(TFSI)|mmp-C(Mo2C) interface located at P = 600 Pa.
Catalysts 11 01315 g015aCatalysts 11 01315 g015b
Table 1. Binding energies for C 1s, N 1s, O 1s, F 1s and S 2p electrons measured in situ at variable N4111(TFSI)|mmp-C(Mo2C) interface potentials indicated in table.
C 1s-CF3C sp3C-NNew Peak
E = 0.00 V292.55284.95286.40
E = −3.00 V294.50286.90288.30
E = −4.00 V294.60286.95288.35
N 1sN-CN-S New peak
E = 0.00 V402.70399.20
E = −4.25 V404.65401.25 400.15
O 1sO=S New peak
E = 0.00 V532.75
E = −4.25 V534.80 533.40
S 2p2p3/22p1/2New peak 1New peak 2
E = 0.00 V168.60169.80
E = −4.00 V170.65171.85167.95169.35
F 1s-CF3 New peak
E = 0.00 V689.15
E = −3.75 V691.15 685.90
E = −4.25 V691.20 685.90
Table 2. C 1s, N 1s, O 1s, F 1s and S 2p electron binding energy vs. potential applied to mmp-C(Mo2C) electrode, coated with a very thin layer of N4111(TFSI), relationships for variable mmp-C(Mo2C) electrode potential ranges.
C 1s-CF3C sp3C-N
−2.00 V < E < 0.00 V−0.90−0.91−0.90
−4.00 V < E < −2.00 V−0.13−0.12−0.08
N 1sN-CN-S
−2.00 V < E < 0.00 V−0.89−0.90
−4.00 V < E < −2.00 V−0.09−0.13
O 1sO=S
−2.00 V < E < 0.00 V−0.89
−4.00 V < E < −2.00 V−0.13
S 2p2p3/22p1/2
−2.00 V < E < 0.00 V−0.92−0.92
−4.00 V < E < −2.00 V−0.12−0.12
F 1s-CF3
−2.00 V < E < 0.00 V−0.92
−4.00 V < E < −2.00 V−0.11
Table 3. Binding energies for C 1s, N 1s, O 1s, F 1s and S 2p electrons measured in situ at variable N4111(TFSI)|mmp-C(Mo2C) interface potentials indicated in table.
C 1s-CF3C sp3C-NNew Peak
E = 0.00 V292.65285.05286.50
E = 3.50 V291.10283.50284.95
N 1sN-CN-S New peak
E = 0.00 V402.80399.30
E = 3.50 V401.25397.50
O 1sO=S New peak
E = 0.00 V532.85
E = 3.50 V531.30 531.60
S 2p2p3/22p1/2 New peak
E = 0.00 V168.7169.90
E = 3.50 V167.15168.30
F 1s-CF3 New peak
E = 0.00 V689.25
E = 3.50 V687.65
Table 4. C 1s, N 1s, O 1s, F 1s and S 2p electron binding energy vs. potential applied to mmp-C(Mo2C) electrode, coated with a very thin layer of N4111(TFSI), relationships for variable mmp-C(Mo2C) electrode potential ranges.
C 1s-CF3C sp3C-N
0.00 V < E < 1.80 V−0.67−0.66−0.66
1.80 V < E < 3.50 V−0.23−0.24−0.24
N 1sN-CN-S
0.00 V < E < 1.80 V−0.65−0.65
1.80 V < E < 3.50 V −0.24−0.24
O 1sO=S
0.00 V < E < 1.80 V−0.64
1.80 V < E < 3.50 V−0.27
S 2p2p3/22p1/2
0.00 V < E < 1.80 V−0.67−0.67
1.80 V < E < 3.50 V−0.24−0.24
F 1s0
0.00 V < E < 1.80 V−0.63
1.80 V < E < 3.50 V−0.27
Publisher’s Note: MDPI stays neutral with regard to jurisdictional claims in published maps and institutional affiliations.

