Review

Photocatalytic Methane Reforming: Recent Advances

Department of Materials Science and Engineering, School of Materials and Chemical Technology, Tokyo Institute of Technology, 2-12-1, Ookayama, Meguro-ku, Tokyo 152-8552, Japan
*
Author to whom correspondence should be addressed.
Catalysts 2021, 11(1), 18; https://doi.org/10.3390/catal11010018
Submission received: 11 December 2020 / Revised: 21 December 2020 / Accepted: 21 December 2020 / Published: 25 December 2020
(This article belongs to the Special Issue Commemorative Issue in Honor of Professor Akira Fujishima)

Abstract

:
Methane reforming is an important potential technology for solving both environmental and energy problems. This technology is important because methane is counted as a greenhouse gas, but on the other hand, it can be reformed into industrially valuable compounds. More research has focused on photocatalytic methane reforming, which has a higher activity than thermal catalysts under dark conditions. The reaction selectivity toward specific products in photocatalytic methane reforming is sometimes different from thermal catalyst systems. Herein, we discuss recent advances in photocatalytic methane reforming to provide various strategies for reforming.

Graphical Abstract

1. Introduction

Methane is an important energy source that is abundant and easily obtained in natural feedstocks, such as shale gas. On the other hand, methane is a greenhouse gas, and its conversion to other species has been a significant issue over the last century. As a methane molecule contains carbon and hydrogen, by adding oxidant molecules, it can be reformed to high-value compounds, such as hydrogen (H2), carbon monoxide (CO), or other hydrocarbons. The mixture of H2 and CO is called syngas and can be further converted to higher carbon-containing molecules, which are more valuable. Three major oxidants are commonly used to reform methane, i.e., water, oxygen, and carbon dioxide. The steam reforming of methane (SRM, Equations (1) and (2)) has the largest H2 output compared to others because the water oxidant contains hydrogen ions. Thus, it is now commercialized as a way to produce H2 [1,2]. However, the side reaction of CO2 emission in SRM is a major problem. The same problem occurs in the partial oxidation of methane (POM, Equation (3)) when oxygen is used as an oxidant. Here, we define POM as oxidative methane reforming without using H2O or CO2 to distinguish it from others in the present paper. As oxygen is input directly, the reaction conditions must be carefully adjusted; otherwise, methane can be completely oxidized to carbon dioxide and water. On the other hand, the dry reforming of methane (DRM, Equation (4)) can convert CO2 as an oxidant.
Steam reforming       CH4 + H2O ⇋ 3H2 + CO   ΔH°298K = 206 kJ/mol
Steam reforming       CH4 + 2H2O ⇋ 4H2 + CO2  ΔH°298K = 165 kJ/mol
Partial oxidation (POM) with oxygen as the oxidant   CH4 + 0.5O2 ⇋ 2H2 + CO ΔH°298K = −38 kJ/mol
Dry reforming  CH4 + CO2 ⇋ 2H2 + 2CO        ΔH°298K = 247 kJ/mol
As presented in the equations, however, the highly positive value of enthalpy indicates the necessity of a high temperature [3,4]. This high temperature is due to the stability of methane. The bonding energy of C–H in methane is 434–440 kJ/mol, which is usually regarded as a rate-determining step of the methane-reforming reaction [5,6]. Among these four reactions, DRM is the most difficult because of its high endothermic reaction and the high stability of the CO2 oxidant compared with the other reactions.
The theoretical maximum conversion efficiencies of chemical reactions under specific temperature and pressure conditions can be predicted by considering thermodynamic equilibrium. Figure 1 shows the calculated conversions of methane-reforming reactions using NASA-CEA software [7]. It can be understood that a significant amount of heat energy is necessary for methane conversion reactions. Even in POM with O2 as the oxidant, which is the easiest way to achieve methane conversion, a temperature higher than 550 °C is needed for a conversion rate of over 90%. As fossil fuels are usually used to heat a reactor, the reaction system is not environmentally friendly.
Another major problem encountered in methane conversion is carbon deposition [1,2,8]. When methane molecules are cracked at high temperatures, carbon species are generated. If these carbon species cannot react with the oxygen species supplied by oxidants, solid-state carbon species are precipitated on the surface of the catalyst. This phenomenon is known as coking, which deteriorates the catalytic activity. The catalyst is expanded by coking to cause a plug and may destroy a reactor. The time scale of coking phenomena usually corresponds to one day, which makes it difficult to commercialize.
In addition to these methane conversions using oxidants, the non-oxidative reaction of methane is also attractive. Some reports indicate that only methane is introduced into the reactor, where methane coupling occurs, and organics such as ethane, ethylene, propane, or aromatics are produced (Equations (5) and (6)) [9,10,11]. Catalysts for promoting the direct reforming of these molecules are also required. However, low activity and high operating temperatures are crucial issues that prevent these methane coupling reactions from being practical.
2CH4 ⇋ C2H6 + H2  ΔH°298K = 32.55 kJ/mol
2CH4 ⇋ C2H4 + 2H2 ΔH°298K = 101.1 kJ/mol
On the other hand, photons are a more attractive energy source than heat because of their high-quality quantum energy. In 1972, Fujishima et al. found that irradiating light with a certain wavelength makes it possible to drive uphill reactions, such as water splitting [12]. In this work, ultraviolet light was irradiated onto TiO2 in water, and hydrogen was released from water, even with a bias of −0.6 V. Since then, numerous studies have been performed to drive the uphill reaction by photocatalysis, such as water splitting or CO2 reduction without applying an electric bias [13,14]. Much research has proved that light energy can be converted into chemical energy, even if the chemical reaction is uphill.
H2O → H2 + 0.5O2 ΔH°298K = 237.13 kJ/mol
Recently, through utilizing the various routes of conversion from light energy to chemical energy, the field of methane reforming by photocatalysis has been studied. Figure 2 shows the number of publications found using the search terms “methane reforming” and “methane reforming photo” in Web of Science [15]. As can be seen, the study of methane reforming increased since around 1990, and the publications related to “photo” started very recently.
As photocatalytic methane conversion studies have attracted many researchers, a comprehensive review of these studies helps many readers understand the current achievements and photocatalytic methane-conversion mechanisms. This review article aims to introduce photocatalysts for various methane-conversion reactions and their working mechanisms. Furthermore, we discuss the prospects of photocatalytic methane conversions.
In Section 2, we explain the general concept of photocatalytic methane reforming. In addition, a strategy for material design is introduced. Section 3 introduces various reactors used in photocatalytic methane reforming, which helps readers to start learning the photocatalytic methane-reforming topic and optimize reactor design. In Section 4, Section 5, Section 6 and Section 7, various methane-reforming reactions are introduced: steam reforming (Section 4), dry reforming (Section 5), partial oxidation (Section 6), and non-oxidative coupling (Section 7). In each section, an overview of the reaction, materials, and mechanism are described. In Section 8, other important factors that should be considered in photocatalytic methane reforming are explained. This section focuses on hot carriers, another important electron transfer pathway, and the phenomenon of the bandgap shift caused by thermal energy. In Section 9, we conclude the recent advances in methane reforming and propose prospects.

2. The Concept of Photocatalytic Methane Reforming

Following the bandgap excitation mechanism found by Fujishima et al. [12], many reports adapt this concept to methane reforming. Generally, in the field of photocatalysis, materials are composed of semiconductors with metal co-catalysts, as shown in Figure 3 [14,16]. Metal particles are deposited on the surface of a semiconductor to avoid recombination and produce active sites. When we focus on methane reforming, methane is oxidized by a hole generated at the semiconductor, while oxidants receive electrons from the metal catalyst.
As for the semiconductor choice, it must meet the criteria of (1) stability against light, temperature, and the atmosphere of methane and other oxidants, and (2) the capability to reduce oxidants and oxidize methane reductants. To drive a photocatalytic reaction, the conduction band position must be higher than the redox potential of the oxidant and the valence band position must be lower than the redox potential of the reductant. As is already known, in aqueous solutions, carbon dioxide reduction requires a high conduction band position rather than proton reduction [17,18]. The same requirement should also be adapted for photocatalytic methane reforming. Further requirements should be considered, namely, (3) basicity and (4) reducibility, which are important factors that determine catalytic activity in thermal catalysts for methane reforming [19,20,21]. Furthermore, to make it practical, (5) visible light sensitivity, (6) an abundance of the photocatalyst materials, and (7) a facile catalyst fabrication process are required. Furthermore, the basicity of the semiconductor is an important factor that determines the catalytic activity under dark and light irradiation conditions. For example, MgO is one of the most widely used supports in methane reforming. Following this strategy, alkaline elements can be introduced into light absorbers, such as the reported examples of SrTiO3, NaTiO3, or K2Ti6O13.
As sunlight includes only a little ultraviolet light, it is necessary to make the semiconductor visible-light sensitive. However, when researchers try to make photocatalysts visible-light sensitive, they always confront a tradeoff of the decreasing relationship between visible-light absorbability and the high potential of electrons and holes to drive efficient chemical reactions.
Our group screened various visible-light-sensitive semiconductors to drive photocatalytic DRM [22]. We used a flow reactor and evaluated pristine photocatalysts and Rh- or Ru-loaded photocatalysts; however, almost all the catalysts showed no notable activity, as shown in Table 1. There are some reasons that can account for these results. One is the instability of the catalysts. The surface temperature of a photocatalyst increases when it is irradiated by light without water-cooling. Thus, sulfides or unstable oxides tend to change their structure, resulting in no significant conversion. Second, as Ruckenstein et al. pointed out in their paper, catalytic activity is deeply related to catalytic support. They compared the catalytic activity in dark conditions using rhodium loaded on various supports. They found that the order of the catalytic activity was SiO2 ≈ MgO ≈ γ-Al2O3 > Y2O3 > Ta2O5 ≈ La2O3 > TiO2 > ZrO2 > Nb2O5 > CeO2. We further expanded our knowledge of photocatalysts.
As for co-catalysts, the most commonly used metals are rhodium, ruthenium, platinum, iridium, gold, silver, nickel, and cobalt [23,24]. These materials are also reported as being used in thermal catalysts [25,26,27]. The fabrication methods can affect the activity significantly. Our group used an impregnation method and a hydrothermal method to make Rh/TaON [22]. Here, the particle size of the Rh was around 2–3 nm in the case of the hydrothermal method, while it was much larger and ununiformly loaded from 2 to 15 nm on TaON using the impregnation method. As a result, the samples prepared using the hydrothermal method exhibited higher activity.
The interaction between the semiconductor and co-catalyst is complicated, and the order of the co-catalyst performance cannot be uniquely determined. Figure 4 shows the H2 production rate, where steam reforming of methane was performed using lanthanum-doped NaTaO3 under light irradiation [23]. The order of the production rate of hydrogen is shown in this figure. On the other hand, the hydrogen production rate of the same reaction with another semiconductor (K2Ti6O13) is presented in Figure 5. This clearly shows that the activity tendencies over various metal catalysts are different from those seen in Figure 4, implying that the photocatalytic activity is not simply dependent on the co-catalyst metal element. In other words, the activity strongly depends on the interaction between the semiconductor photocatalyst support and the loaded metal co-catalyst. Indeed, the activity order of non-oxidative methane coupling on the metal loaded on TiO2 (Figure 6) was drastically different from those shown in Figure 4 and Figure 5.
The interaction between the support and the co-catalyst also affects the catalyst stability. Balázs László et al. performed photocatalytic dry reforming of methane using titanate nanotubes that were modified with Au and Rh (Figure 7) [28]. They compared the photocatalytic activities under chopped light irradiation. As a result, the photocatalytic activity decreased in Rh-loaded titanate nanotubes, while it remained almost the same in the case of Au-loaded titanate nanotubes. Our group performed photocatalytic dry reforming of methane using Rh/TaON, but the catalytic activity remained stable during a similar time to the previous report (Figure 8) [22]. These results strongly suggest that the interaction between the semiconductor and the loaded catalyst is an important factor for stability. This work also implies the difficulty and importance of choosing an appropriate combination of the support and the loaded catalyst.
This section introduced the photocatalyst design for methane reforming, including semiconductors, loaded co-catalysts, and the interaction between the two. In the next section, we introduce the actual experimental reactors, the reported catalysts, and the analyzed mechanism.

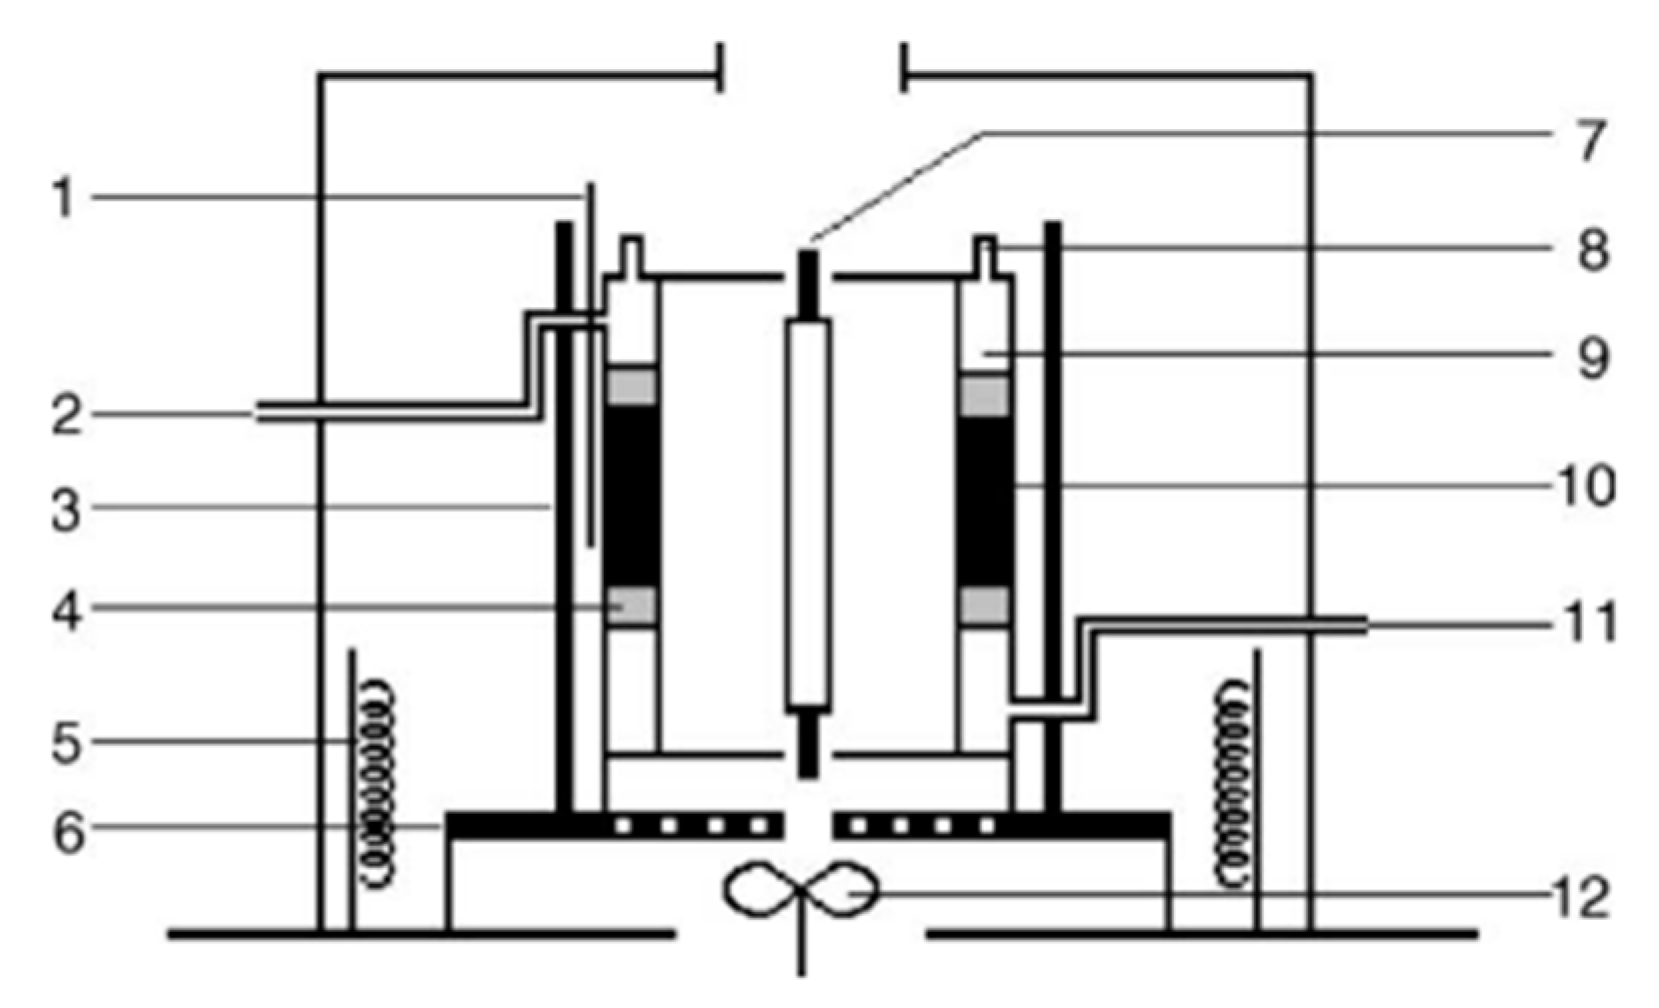
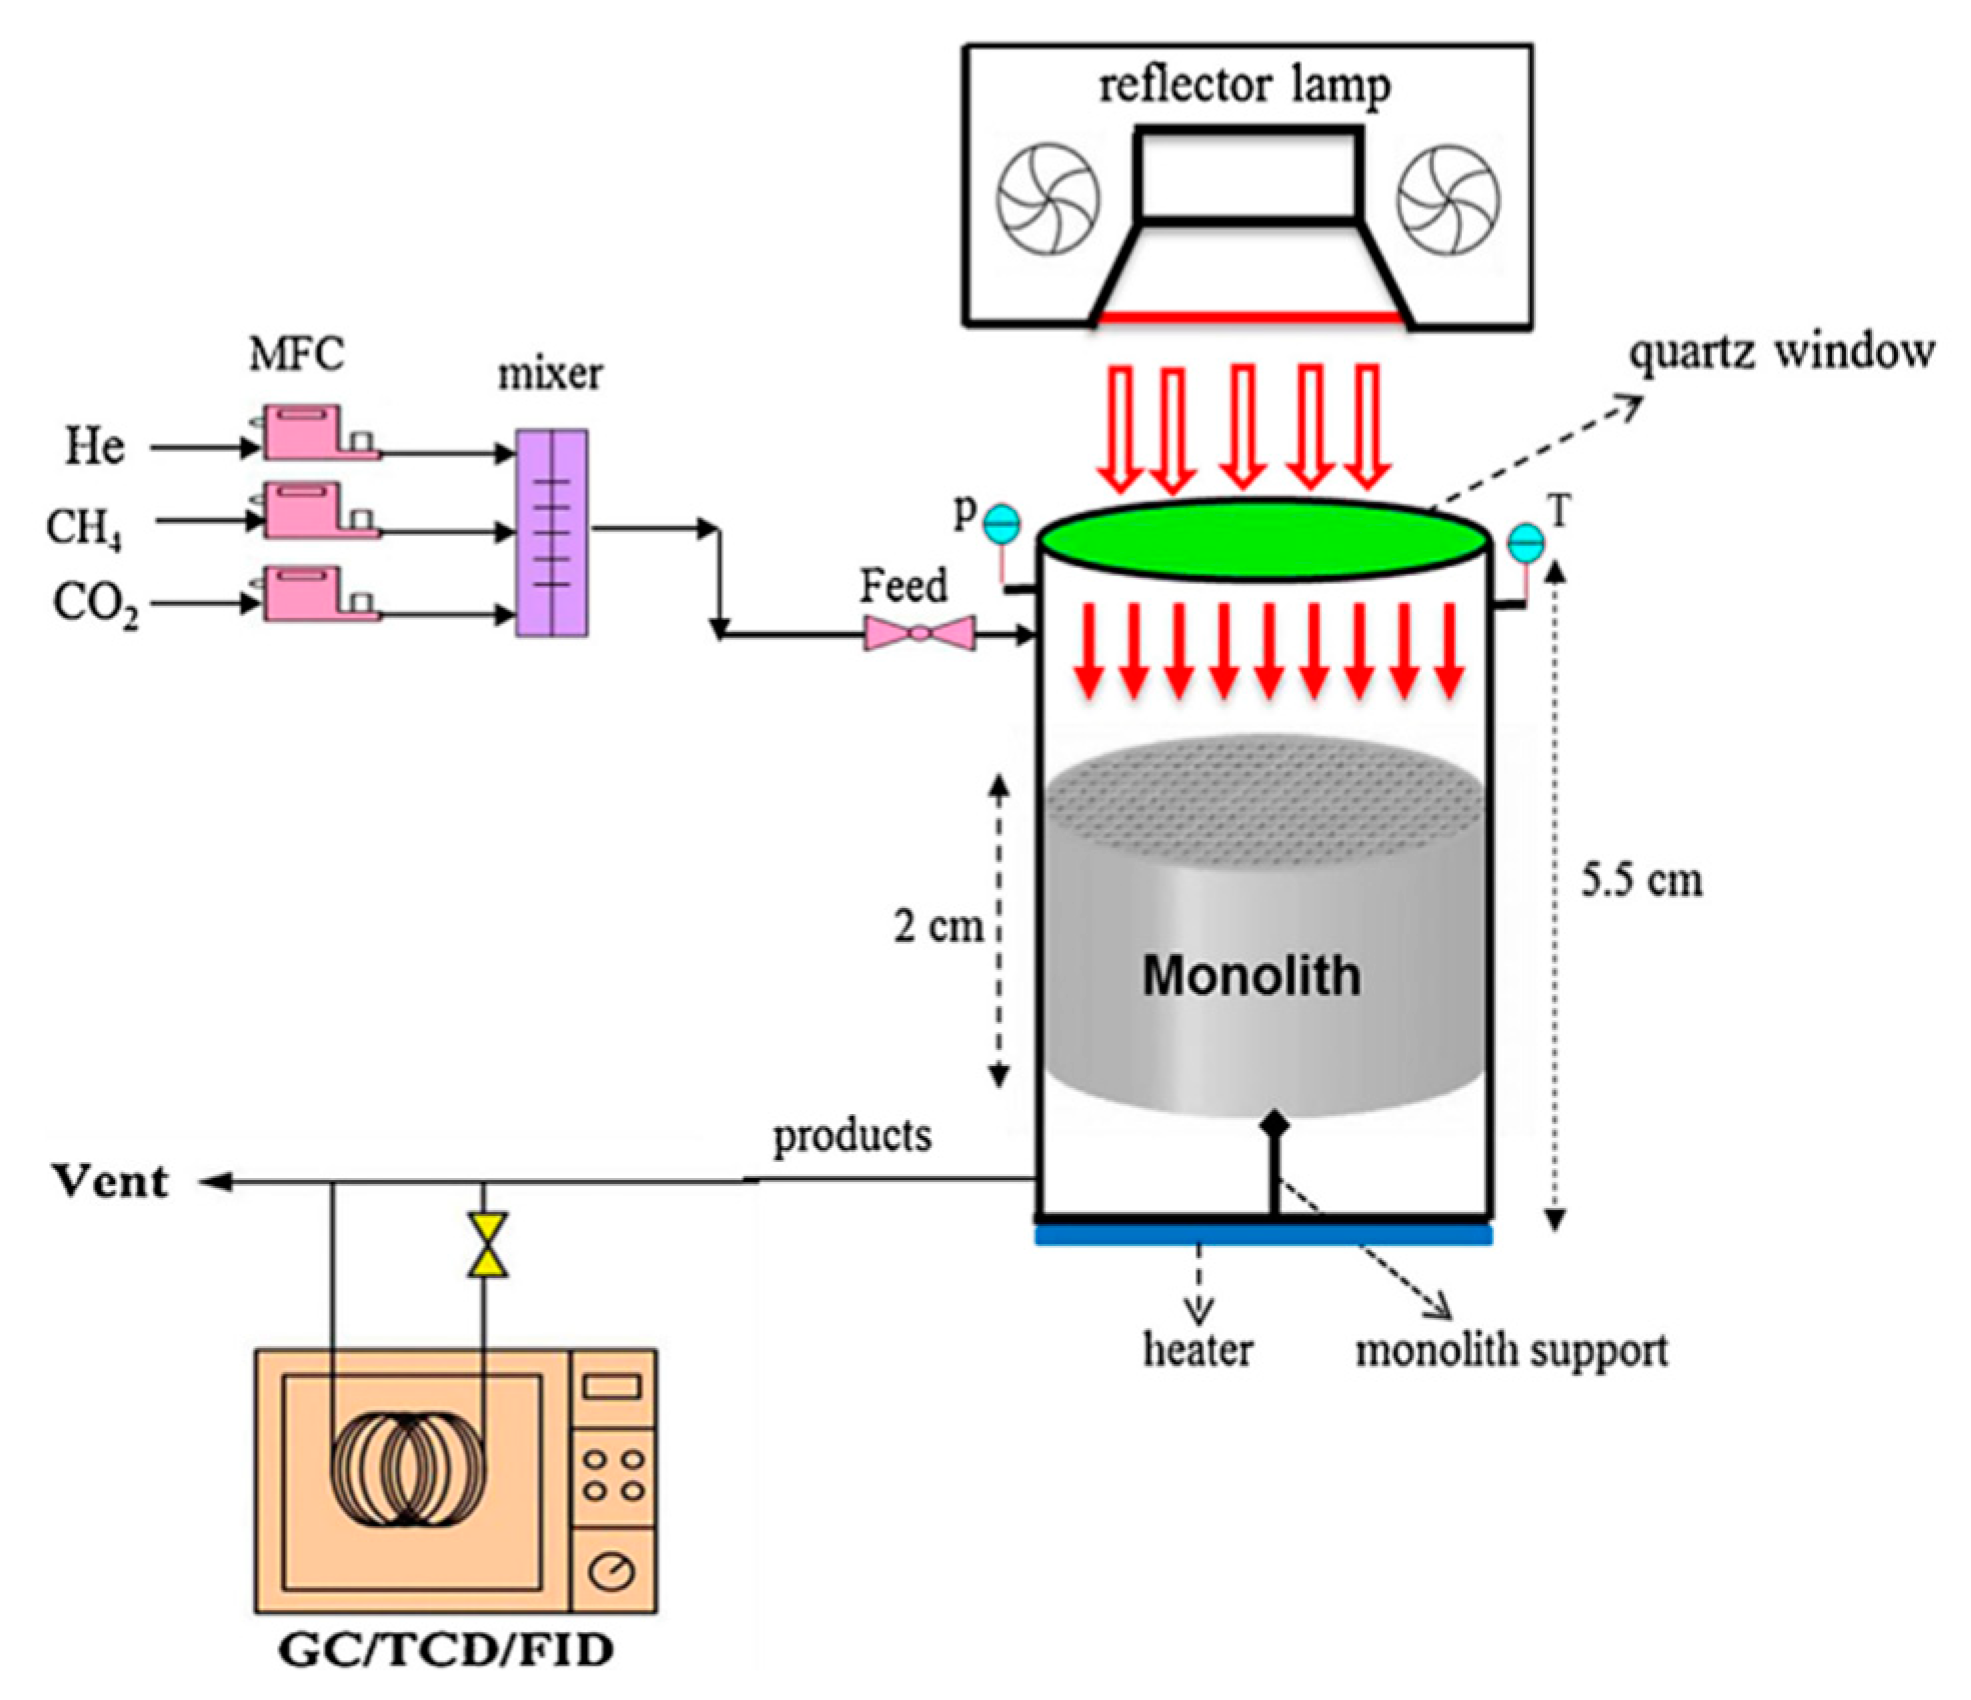
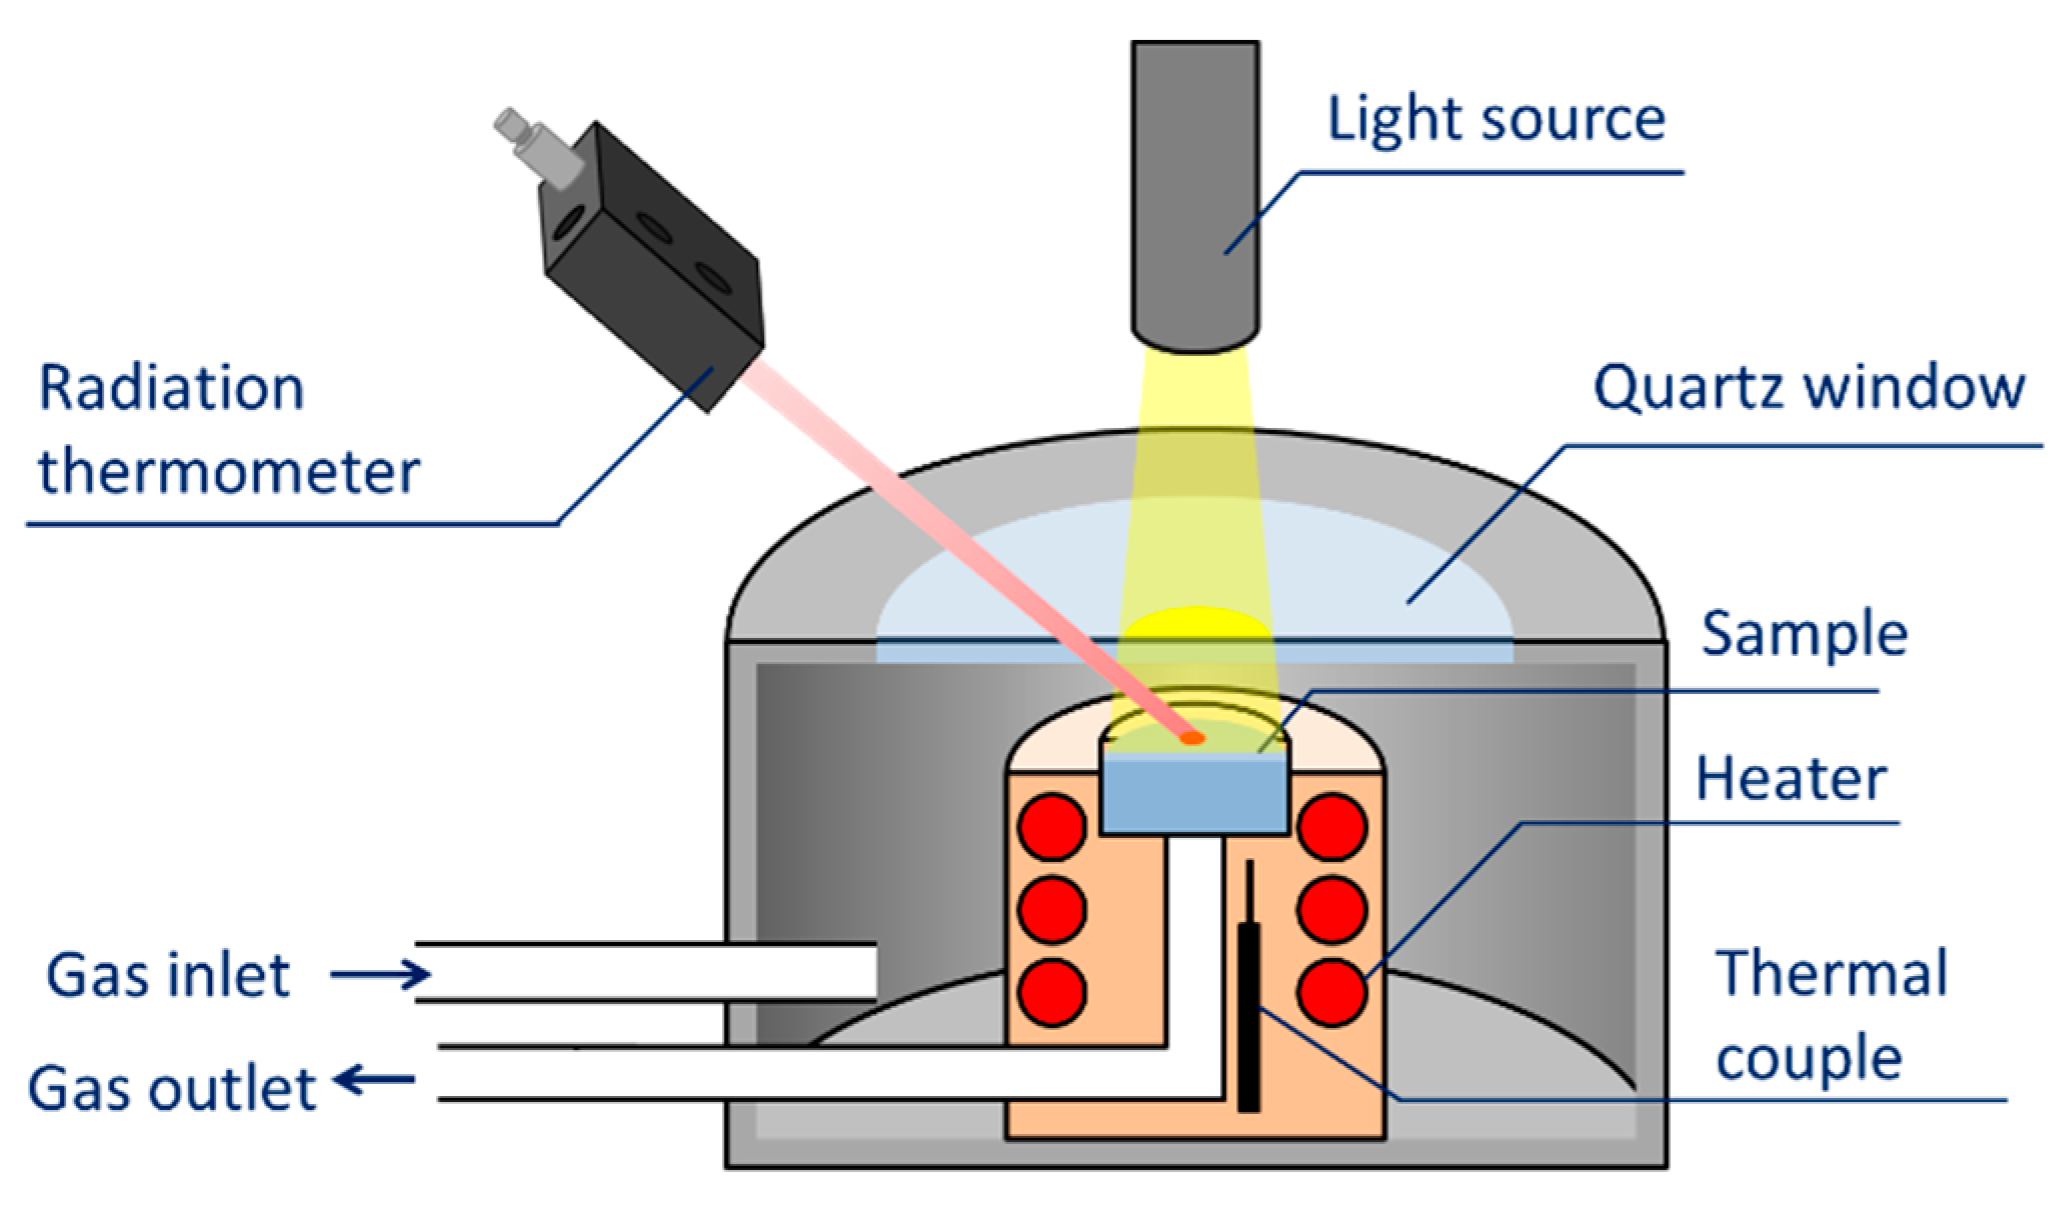
3. Evaluation System for Photocatalytic Methane Conversion

In photocatalytic methane reforming, there are many reactor designs [29,30,31,32,33]. Since there are various kinds of evaluation systems that have a strong influence on catalytic activity, it is important to examine the appropriate system before comparing it. A closed reactor was used in some previous reports, which has a longer time for compounds to react. In most cases, flow reactors are used so that gases are continuously renewed [29]. The use of a flow reactor makes it possible to remove products, which prevents unnecessary side reactions.
As the photocatalyst activity is strongly dependent on the irradiation area, some reactors are designed for large irradiation areas, as shown in Figure 9 and Figure 10. One example of the further enhancement of the irradiation area is a monolith photoreactor. A monolith reactor is defined by a single structure with thin, vertical parallel channels that are separated from each other by walls (Figure 11) [34]. This design is particularly suited for photocatalytic gas reactions because light can penetrate deep inside the reactor; therefore, efficient light absorption is possible. In addition, an improved sorption process and larger catalyst loading can make the catalytic activity relatively high [31,35,36].
A reactor that can measure surface temperature is shown in Figure 12. As the surface temperature increases when light is irradiated, the surface temperature data are important. It is also noted that the comparison of the catalysis performance between each report is extremely difficult because the degree of the photo-thermal effect is different in each report. As the surface temperature increases, the catalyst has a temperature gradient. Some previous studies reported that the temperature gradient affects catalytic properties [37]. Furthermore, if the reactor becomes complicated, such as the monolith reactor mentioned above, the comparison between the efficiencies of each material becomes far more difficult.
Quantum efficiency, which is one of the most important values when comparing photocatalyst performance, cannot be simply adapted for evaluation because it does not consider the thermal effects. Quantum efficiency is defined as the charge carriers used to generate products over the input photons. Thus, if there are thermal catalytic products, the value of quantum efficiency can easily be overestimated. It is important to measure the surface temperature at least so that the photothermal effect can be discussed.

4. Photocatalytic Steam Reforming of Methane

4.1. Overview of the Reaction

SRM is a favorable reaction for producing H2 because H2 can be produced from both methane and water. The amount of hydrogen produced per methane is higher than that produced by the other methane-reforming reactions. The disadvantage is that the reaction produces not only CO but also CO2, as shown in Equations (1) and (2) in Section 1. The selectivity of the reaction is a major problem in SRM.

4.2. Material

Titanium dioxide (TiO2), one of the most investigated photocatalysts, has been used by many researchers [38,39]. Although its photocatalysis ability was found in 1972, even pristine TiO2 has high photocatalytic activity, low cost, abundant material, and nontoxic elements. Thus, it is also employed in various types of methane reforming.
Yoshida et al. loaded platinum onto TiO2 and performed steam reforming of methane (Table 2) [40]. In their reaction, only trace amounts of carbon monoxide were observed and the ratio of H2/CO2 was close to 4, which means that the reaction proceeded according to Equation (2). It should be noted that they performed experiments where the amount of methane was 50% and water was around 1.5%.
Yoshida et al. also reported that SRM could be driven by irradiating light on Pt-loaded La-doped NaTaO3 at room temperature (Table 3) [23]. They optimized various parameters, such as the crystallite size of NaTaO3, doping element, doping amount of the element, surface area loading of the co-catalyst, and its amount. They found that the optimal element to be doped is La, to be loaded is Pt, and the optimal amount for Pt onto NaTaO3:La(2%) was approximately 0.1%.
Other than loading Pt, Yoshida et al. incorporated potassium as an alkaline element and fabricated Rh/K2Ti6O13 [24]. The catalytic activity of Rh/K2Ti6O13 was comparable with that of Pt/NaTaO3 mentioned above. They prepared samples using various methods and found that photodeposition was the best.

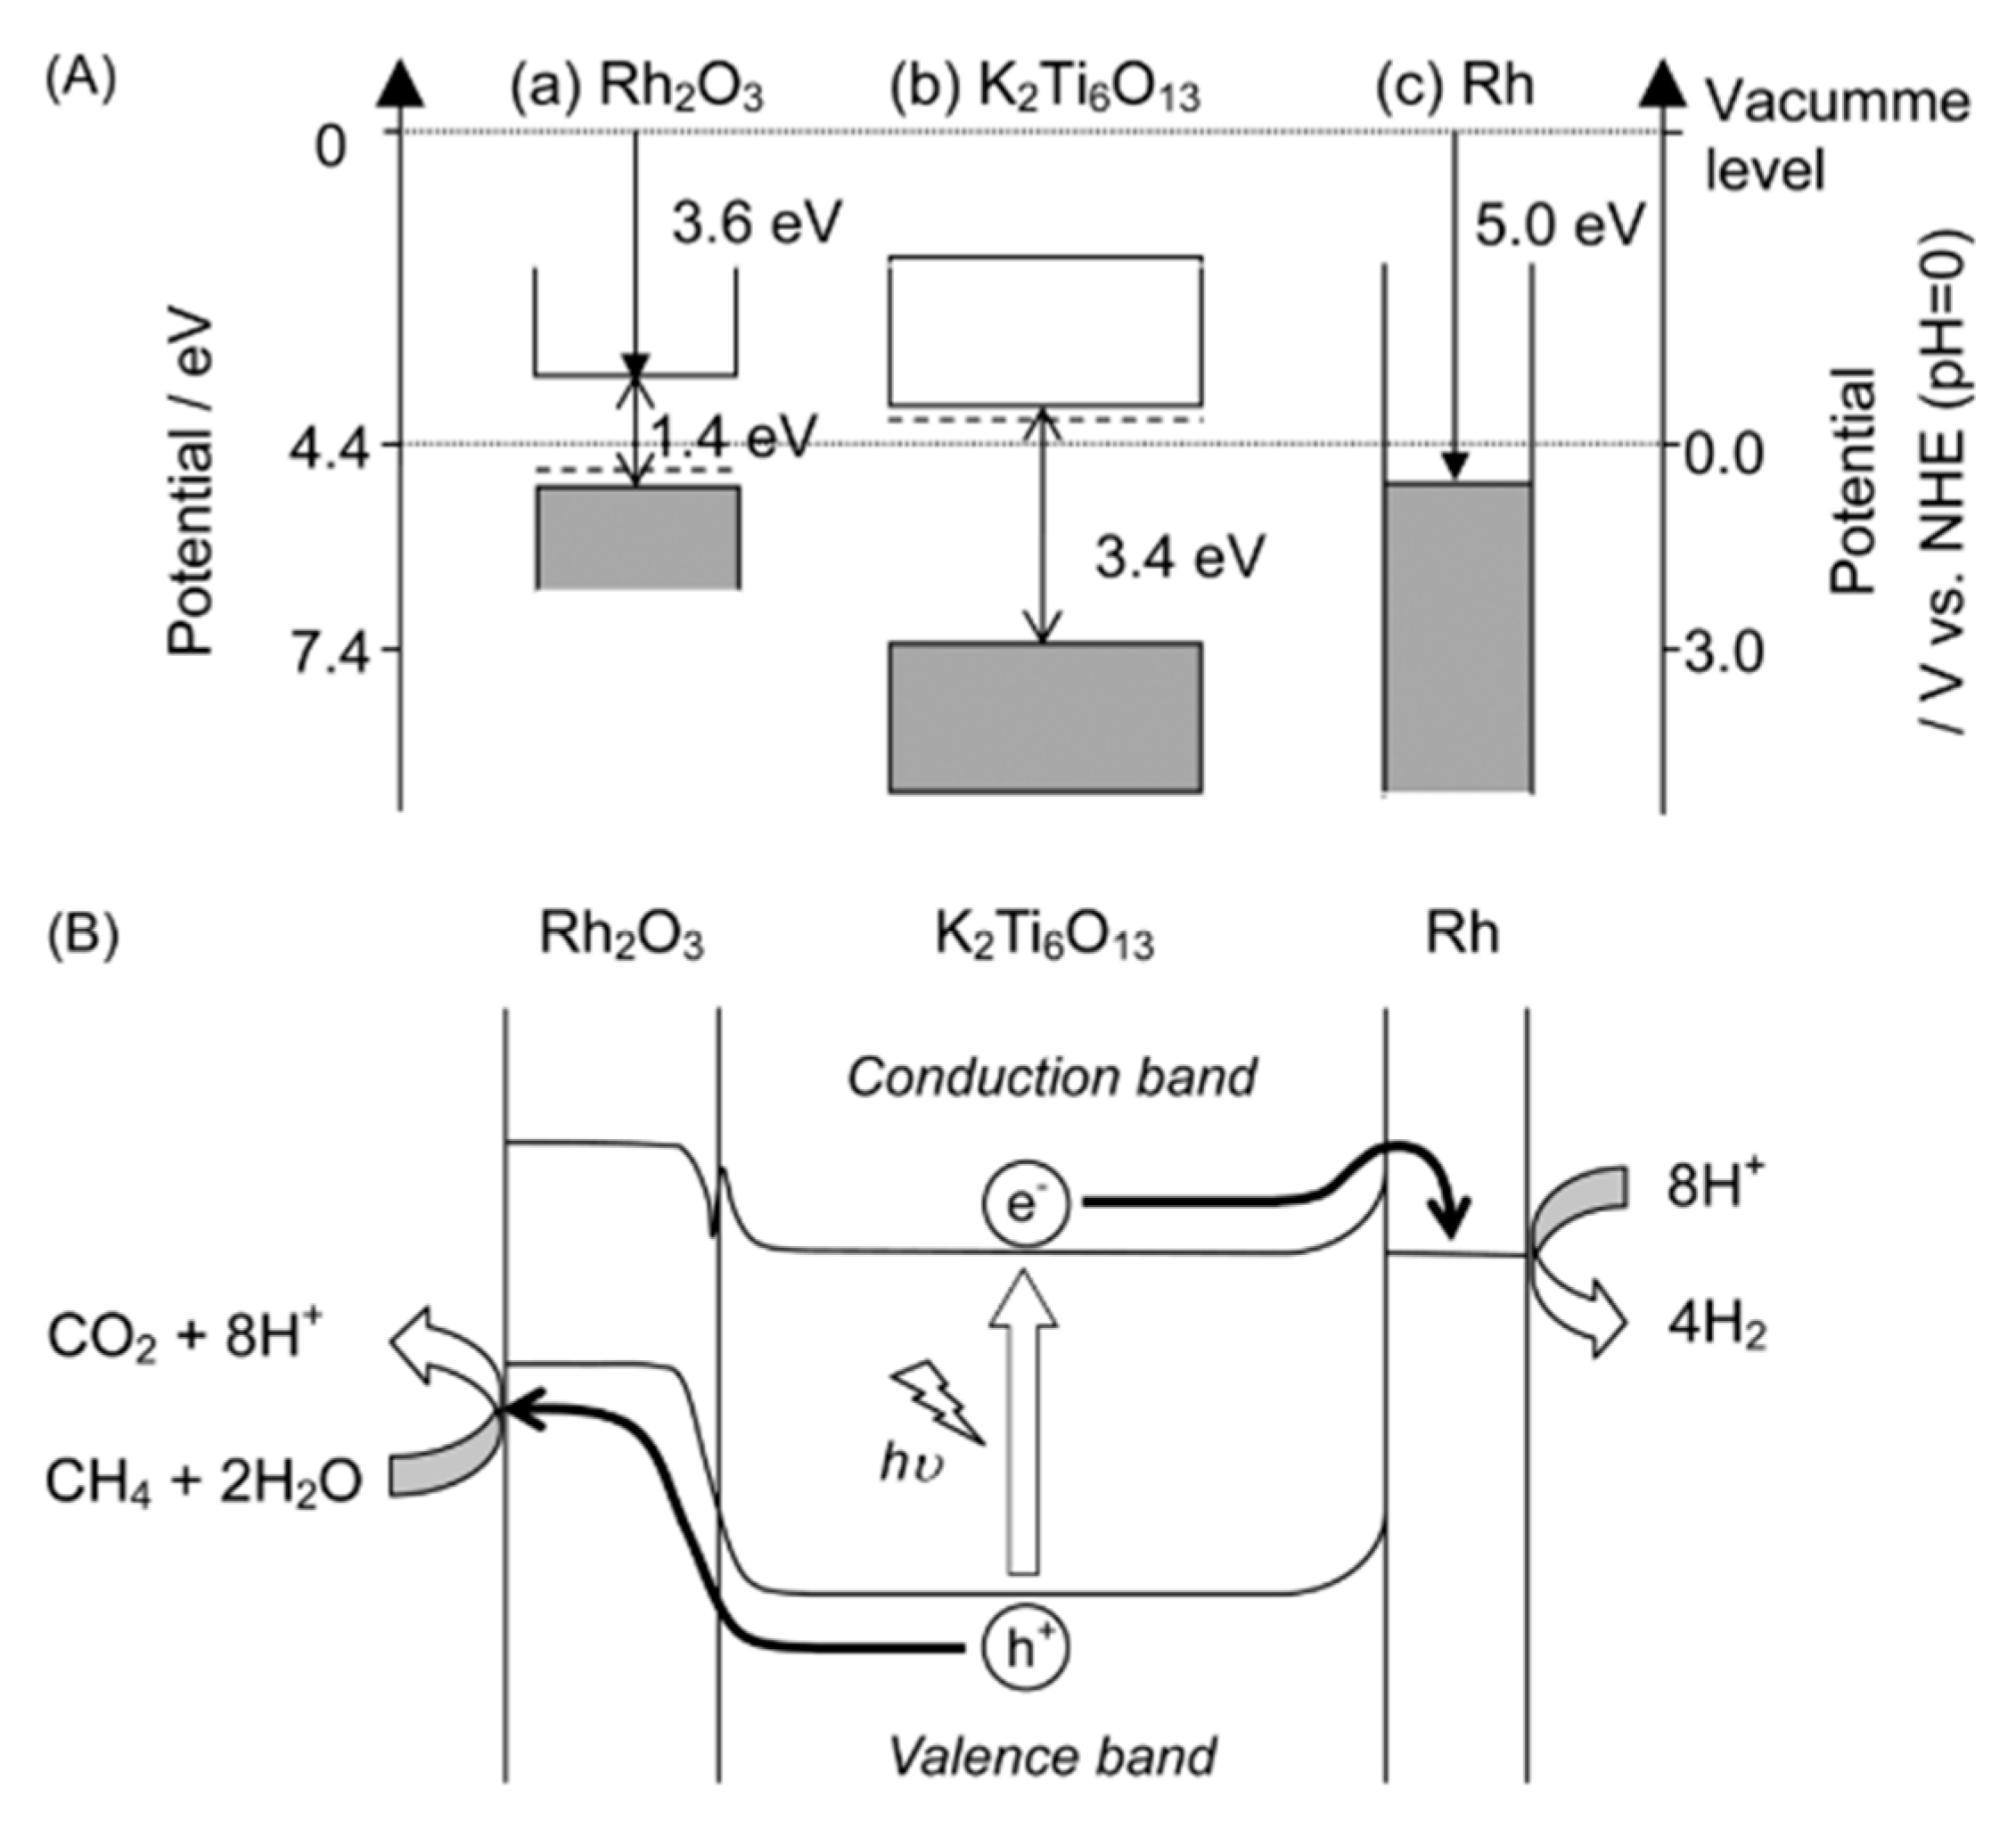
4.3. Mechanism of the Reaction

In the paper by Shimura et al., the band structure of K2Ti6O13 combined with Rh metal and Rh2O3 was demonstrated [24]. They found that their samples consisted of metal state Rh and Rh2O3, which was shown using X-ray absorption near-edge structure (XANES) analysis. Thus, they described the schematic view of the movement of excited carriers, as shown in Figure 13.
Intermediates in photocatalytic SRM have also been discussed. Pale brown species were found on Pt/TiO2, which was determined to be [CH2O]n by Yoshida et al. [40]. They first performed photocatalytic SRM, and when the reaction became stable, i.e., the H2/CO2 ratio became the stoichiometric ratio of 4, they stopped supplying CH4 into their reactor, while they continued to introduce water (Figure 14). They observed pale brown species only when SRM gas was introduced, but it was consumed when water alone was introduced. Only H2 and CO2 were observed as the output gas. They recognized that the pale brown species were composed of only carbon, hydrogen, and oxygen. Combining the results of the products obtained, they determined the intermediate to be [CH2O]n. The consumption of [CH2O]n is described in Equation (8):
[CH2O]n,ad + nH2O → 2nH2 + nCO2.
They also experimented with changing the input gas concentration (10%→50%→10%) (Figure 15). They found that at the first step, there was a low H2 production rate, but after reacting at 50%, the production rate of H2 increased significantly, even though the same concentration of CH4 was fed. This phenomenon was attributed to the accumulation of the intermediate.
Regarding the mechanism of photocatalytic SRM, Yoshida et al. examined the temperature dependence of the catalytic activity and investigated the Arrhenius plot (Figure 17) [23]. Figure 16 indicates that below 348 K, the amount of H2 produced increases as the temperature increases. The apparent activation energy was calculated to be 14 kJ mol−1, which is far smaller than the reported value of other thermal systems (122 kJ mol−1 using a Pt catalyst). This small activation energy should be different from the thermal catalysis mechanism of the SRM. At a temperature higher than 348 K, the hydrogen production rate was constant versus temperature, which was explained by noting that only the photocatalytic reaction step exists in this region.

5. Photocatalytic Dry Reforming of Methane (DRM)

5.1. Overview of the Reaction

Although the DRM reaction is attractive because it can use CO2 as a resource to produce syngas, DRM is the most difficult among the methane-reforming reactions, as shown in Figure 1. This difficulty occurs because of the stability of both methane and CO2. Dry reforming also suffers from a process of severe carbon deposition called coking. During the methane-cracking process, the completely cracked methane leaves carbon species on the surface, which can be oxidized and removed by the oxidant. In the case of CO2, it is less likely to be removed than other oxidants, such as O2 or H2O, which accelerates the carbon deposition [1,41,42]. There is even research on mixing oxygen in DRM to prevent carbon deposition.
The side reactions usually discussed are listed (the primary reaction is written in Section 1, Equation (4)):
The water gas shift reaction  CO2 + H2 ⇋ CO + H2O   ΔH°298K = 41 kJ/mol,
Carbon deposition      CH4 → C + 2H2        ΔH°298K = 74.9 kJ/mol.

5.2. Material

As early as 2004, Daxin Shi et al. used a complicated material of Cu/CdS-TiO2/SiO2 to perform DRM. They observed a 1.47% CH4 conversion, a 0.74% CO2 conversion, and the selectivity of the acetone was 92.3% (Figure 17, Table 4) [32]. Although they could successfully convert methane and carbon dioxide into acetone, the conversion became zero in approximately 2 h. They attributed this to the photo-corrosion of CdS that was promoted by TiO2.
As for bare photocatalysts, Wibowo et al. reported in 2018 that DRM was assisted by photon energy [43]. Employing each of SrTiO3, TiO2, WO3, and SnO2 as a photocatalyst, they found that the amount of CO observed significantly increased when only SrTiO3 was used, as shown in Figure 18. They further compared the activity and band position of the used photocatalyst and found that the conduction band position is an important factor (Figure 19). As CO2 is difficult to reduce in water, this is one reasonable explanation.
The bare MgO insulator exhibited photocatalytic DRM activity, according to Teramura et al. [44]. To elucidate why MgO proceeds under light irradiation, they obtained a phosphorescence-exciting spectrum with and without the flow of CO2 (Figure 20A). As a result, they found a characteristic peak at 320 nm, which can be assigned to the absorption due to a new acceptor level built between the valence band and conduction band. The yield of carbon monoxide is shown in Figure 20B. The rate of CO production decreased from 30 h onward.
Shoji et al. used rhodium metal as a co-catalyst for photocatalytic DRM because it is one of the most studied thermal DRM catalysts [30]. They compared dark conditions, UV light irradiation conditions, and thermodynamic limits calculated using the chemical equilibrium (Figure 21). As a matter of course, the catalytic activity did not surmount the limitation of the thermal system, but with UV light irradiation, methane and CO2 were effectively converted to H2 and CO, even at 100 °C.
For a co-catalyst other than a noble metal, Ti3AlC2 was proposed by Tahir et al. for deposition onto TiO2 [36]. Ti3AlC2 is a piled structure made of graphite-like layers that has good electron transport characteristics. They performed dry reforming of methane, steam reforming of methane, and methane bi-reforming (Figure 22). They claimed in their paper that the conversion was high due to the electron conductivity of Ti3AlC2. In addition, this is the first attempt at utilizing Ti3AlC2 in photocatalytic reactions.
Employing CeO2 in photocatalytic methane reforming is promising because CeO2 is known to have many oxygen vacancies, which provides various merits in catalytic activity [45]. Pan et al. doped zinc ions into CeO2 and loaded Pt, and finally coated it with atomic layer MgO (Figure 23) [46]. They focused on photocatalytic DRM, but they claimed that both the input of photon energy and thermal energy boosted the conversion. The strategy of doping zinc and coating the MgO atomic layer is beneficial in both thermocatalytic and photocatalytic DRM. As for the thermocatalytic viewpoint, MgO has a high affinity for CO2 and promotes reverse CO disproportionation. From a photocatalytic viewpoint, zinc can create localized band states and MgO can passivate the surface states of CeO2, which act as recombination centers. The optimized Zn/Ce molar ratio and atomic layer deposition cycles of MgO and the ground were 0.10 and 5 cycles, respectively (Figure 24).
Moreover, they found that light-illuminated DRM has better stability than those without illumination (Figure 25). To elucidate the reason, they performed X-ray photoelectron spectroscopy (XPS) before and after photochemical and thermochemical DRM (Figure 26). As they compared Ce4+ and Ce3+, the concentration of Ce3+ decreased drastically after the test for dark conditions, but for the light-irradiated condition, the ratio remained almost the same. Since Ce3+ indirectly indicates the number of oxygen vacancies, and the number of oxygen vacancies corresponds to the unlikeliness of carbon deposition, it can be concluded that light illumination preserves oxygen vacancies and prevents carbon deposition. This sequence is an important function of light irradiation.
Very recently, we found that Rh/TaON and Rh/Ta3N5 exhibited efficient activity, both in dark and visible light-irradiated conditions (Figure 27) [22]. As TaON was stable at higher temperatures and had better photocatalytic activity, we focused on Rh/TaON. The photocatalyst morphology was optimized and it was found that the photocatalyst prepared using the hydrothermal method had the best activity compared with those prepared using the impregnation and photodeposition methods. In addition, the activity was the highest on the 0.68 wt% Rh loaded onto TaON, which was prepared by adding 5 wt% of the precursor.
Tahir et al. modified TiO2 using montmorillonite (MMT) [31]. They utilized MMT because MMT has a good affinity for TiO2 and it is a low-cost, abundant, and environmentally friendly material. Moreover, as MMT has a silicate layer-piled structure, polar molecules, such as water, can diffuse into MMT and expand the layer gap distance. TiO2 intercalates to the enlarged gap space and then silicate layers disperse and a nanocomposite can be produced.
They found in their experiment that the layered structure of MMT was destroyed during the intercalation process. In addition, the modification of TiO2 with MMT prevented the particle from undergoing crystal growth and resulted in the formation of nanocomposites. Since the crystallite size of TiO2 was small, it was formed by MMT, preventing crystallization. Photocatalytic activity using the photocatalyst is shown in Figure 28. In the first step of the reaction, they observed a significant amount of C2H6, but it disappeared as time went by. They also observed a small amount of CH3OH with a selectivity of less than 5%.
In 2018, Tahir et al. reported that loading Ni could further enhance the photocatalytic activity of DRM on MMT/TiO2 [35]. They prepared Ni/MMT-modified TiO2 by adding Ni and MMT into a TiO2 sol, dipped it into their reactor, dried it at 110 °C, and calcined it at 500 °C for 5 h. They found that the yield rate of CO in photocatalytic DRM increased remarkably (Table 5).
As our group has explored, g-C3N4 was explored as a light absorber for the DRM photocatalyst. As both carbon and nitrogen are abundant elements and light-weight, visible light-active photocatalysts, there is great merit in photocatalytic DRM. However, there is also a demerit in that g-C3N4 decomposes from 400 to 700 °C [47]. In addition, when analyzing the products, the carbon may come out of the photocatalyst itself. Tahir et al. loaded copper at the weight ratio of 3% on g-C3N4 [48]. They reported that there are other hydrocarbon products in addition to the main products, namely, carbon monoxide and hydrogen. At 100 °C, C3H8 was observed (Figure 29).
In 2019, Tahir et al. reported the loading of silver nanoparticles onto protonated g-C3N4. The formation of C2H6 and methanol was confirmed [49]. After synthesizing g-C3N4 using melamine as a precursor, they protonated the surface by immersing their catalyst into a nitric acid solution. Afterward, silver was deposited on the protonated g-C3N4 using the sonication-assisted photodeposition method. They explained in their paper that the significantly increased amount of CH3OH produced was caused by reducing protons at the surface of the catalyst. In addition, the reaction follows the equation presented below:
2CH4 + 2CO2 → 3CO + 2H2 + CH3OH.
This result not only has the impact of producing methanol at low temperatures but it gives rise to the possibility of a proton becoming an intermediate.
Han et al. used Pt loaded onto black TiO2 to perform photocatalytic DRM [50]. Black TiO2 is a material that includes a high amount of Ti3+ defects and oxygen vacancies, which create interband levels in TiO2. They prepared the sample by reducing Pt-loaded TiO2 (P25, Degussa) at 200 °C for 24 h under an atmosphere of H2. The catalytic activity obtained shows that when light was irradiated onto the sample, the catalytic activity was much higher at 400 °C (Figure 30). They explained why the redox potential changed when heat was input into their system (Figure 31). At 25 °C, CO2 cannot be reduced by TiO2 because the redox potential is more negative, but at higher temperatures, the potential decreases, which enables the photocatalytic DRM to proceed. It was noted that the yields of H2 and CO were almost the same in both the light-illuminated and dark conditions. They also reported almost the same phenomenon using the same material in photocatalytic SRM [51].

5.3. Mechanism of the Reaction

To confirm the nonthermal effect, our group compared the activity of light-irradiated conditions and only thermal conditions by controlling the surface temperature to the same value. As we carefully measured the surface temperature under the visible light irradiated condition, it showed 316 °C, while the thermometer below the catalyst showed 210 °C. Thus, we controlled the temperature to 316 °C in the dark. The activity under both conditions is shown in Figure 32. Here, it is demonstrated that there was a certain contribution of photon energy that was directly driving the reaction.
To clarify the photocatalytic DRM mechanism, Shoji et al. performed in situ electron spin resonance (ESR) measurements on Rh/SrTiO3 photocatalysts. They found that electrons are injected from the conduction band of SrTiO3 to Rh nanoparticles under UV light irradiation because of the disappearance of the electron peak (Figure 33a,b). With the addition of methane, the number of excited holes decreased, indicating that the holes reacted with methane (Figure 33c).
In addition, they performed isotope tests to identify the reaction intermediates. Before the isotope test, they confirmed that CO was generated when methane alone was input, where lattice oxygen was the only supplier of oxygen (Figure 34). Then, they used H218O to replace the surface oxygen with 18O, after which, they input methane. When light was irradiated onto the 18O-doped SrTiO3, there was a C18O product (Figure 35). As a reference, they performed the same experiment with no 18O doping and found that the C18O originated from the lattice. Thus, they concluded that the reaction intermediate was lattice oxygen. CO2 continuously supplied oxygen into the lattice of SrTiO3, and the oxygen could react with methane to produce CO (Figure 36).
To further investigate the photocatalytic DRM mechanism, Kushida et al. constructed a unique gas-phase photoelectrochemical system (Figure 37) [52]. They used yttria-stabilized zirconia (YSZ) pellets as an electrolyte to conduct oxygen ions inside. On both sides of the YSZ pellet, they deposited the Rh/YSZ photocatalyst, the target material for discussion. When using a powder photocatalyst, the redox reaction occurs at the powder, and there is no way to see the reaction separately. Thus, the system they constructed is important in discussing the mechanism.
They first introduced inert argon gas into the cathodic and anodic sides as a control experiment, where no reaction proceeded. They found no photocurrent, regardless of irradiating light (Figure 38). Afterward, they input carbon dioxide and methane into the cathodic and anodic sides, respectively. Immediately after introducing the gasses, a negative voltage appeared, suggesting that a thermal reaction occurred. Subsequently, they chopped with UV light and observed a further negative shift, suggesting that photon energy promoted the reaction. As the electrolyte works as an oxygen conductor only at temperatures >600 °C, they had to set the temperature that high, resulting in the detection of a significant number of thermally generated products under a stoichiometric reaction (Figure 39). Then, they irradiated UV light only on one side of their photoelectrochemical cell system, utilizing the divided field of the reduction and oxidation sites. Before experimenting, they checked that there was no leakage of light to the other side of the spectrometer. As a result, they found that the voltage change was evident when the light was especially irradiated onto the anodic side (Figure 40). This result shows that the bandgap excitation in the anode is important and methane reacts with the holes generated at the semiconductor. On the other hand, carbon dioxide reacts with electrons in rhodium metal. From the results obtained above, the mechanism is illustrated in Figure 41.

6. Photocatalytic Partial Oxidation of Methane (POM)

6.1. Overview of the Reaction

The definition of the POM should be considered in this review paper. As the valence state of carbon in methane is −4, if it does not oxidize to the highest number of +4 in CO2, it can be called partial oxidation. In this review article, to differentiate between steam reforming and dry reforming, we define the partial oxidation of methane as not using H2O or CO2 as the oxidant. Thus, we include a liquid-phase reaction using metal ions or hydrogen peroxide and a gas-phase reaction utilizing O2 as the oxidant.
When using metal ions or other oxidants in the solvent, it is beneficial to control the ease of driving by choosing a relatively positive redox potential. Metal ions with a positive redox potential work as electron scavengers and make the carrier separation more efficient. Furthermore, the variety of oxidants has led to more discussion about the mechanism. In addition, if we choose an appropriate metal ion scavenger, a semiconductor photocatalyst with a low conduction band position can be used.
The selectivity of products is important, even if methane cannot be completely oxidized. Many researchers have focused on producing methanol in liquid phase studies, which is considered the “holy grail” of current catalysis research [53]. Methanol generation usually faces a significant problem of selectivity as it usually competes with ethane production. On the other hand, a gas-phase reaction utilizes oxygen as an oxidant, where CO and H2 are the main products.

6.2. Material

The partial oxidation of methane has been studied by utilizing photocatalysis. One important point relating to the band structure criteria is that the reduction potential of O2 is less positive compared to CO2 or H2O. Therefore, semiconductors with a relatively low conduction band position, such as WO3, V2O5, BiVO4, or Bi2WO6, were used in these studies [54,55,56,57,58,59]. It is noted that Bi2WO6 has no significant activity in the case of photocatalytic DRM, probably because of the insufficient conduction band potential [22].
Another important point in the partial oxidation reaction is the selectivity of the products. If methane is completely oxidized to CO2, the reaction is not valuable. Instead, the oxidization should be terminated before the complete oxidation to CO2 to produce valuable compounds. To date, carbon monoxide, methanol, or ethane have been reported to be produced from methane. However, there is a considerable amount of CO2 as a product, which needs further selectivity enhancement.
Hu et al. used NO and O2 as oxidants and performed partial oxidation using vanadium (V)-containing mesoporous silica (MCM-41) [56]. They prepared the material under both acidic and basic conditions using tetraethyl orthosilicate as the silicon source and HCl for adjusting acidity. Under basic conditions, sodium silicate, as the silicon source, and sulfuric acid was used to buffer the acidity. From the characterization, vanadium in the sample was confirmed to be a polymeric species. The results of the CO2 and CH3OH yields are shown in Figure 42. When O2 was used as the oxidant, the product was only CO2, regardless of the preparation conditions. When NO gas was used as the oxidant, the yield of CH3OH increased significantly in the V-containing MCM-41 prepared under acidic conditions. The conversion of methane in the acid and base types was 6.0 and 0.7%, respectively. Methanol was replaced as a product in the basic type with C2Hx species, acetaldehyde, and CO2. They explained the reason for the coordination of V-oxide species and loading sites according to the pH during preparation.
Villa et al. fabricated a WO3 photocatalyst on mesoporous silica as a template and performed the partial oxidation of methane in an aqueous solution using various electron scavengers, such as Fe3+, Cu2+, Ag+, and H2O2 [57]. Generally, the addition of scavengers improved the carrier separation. It can be observed from Figure 43 a,b that Fe3+ and Cu2+ enhanced the methanol production activity, but Fe3+ and H2O2 enhanced the activity of the ethane production. The authors explained that reaction selectivity occurred because the reactions proceeded through different intermediates between the methanol and ethane production. In the case of methanol production, the hydroxyl groups and H2O adsorbed on the surface of the catalyst are important (Equation (12)), whereas hydroxyl radicals are important in ethane production. This difference is because hydroxyl radicals react with methane and produce methyl radicals, which react with each other to generate ethane (Equations (13) and (14)). When H2O2 and Fe3+ were added, the selectivity of ethane increased because they produced hydroxyl radicals, as shown in Equations (15) and (16). The amount of CO produced is shown in Figure 43c.
CH3 + H2Oads → CH3OH + 0.5H2
CH4 + HO·ads → CH3· + H2O
CH3· + CH3· → C2H6
H2O2 + eCB → OH + HO
Fe3+ + H2O → (hυ) Fe2+ + HO· + H+
Murcia-Lopez et al. performed the partial photocatalytic oxidation of methane to methanol using BiVO4 in the presence of nitrite ions (NO2) [55]. As the result shows, when both BiVO4 and NO2 were present, the production of CO2 was suppressed, while the methanol production was relatively high (Figure 44). The roles of NO2 are also discussed in their report. As hydroxyl radicals can be generated by the photolysis of water, the generated hydroxyl radicals can lead to methyl radicals that produce ethane. It is better to suppress the number of existing hydroxyl radicals in the solution. To selectively produce methanol rather than ethane, the suppression of the production of hydroxyl radicals is important. Nitrite ions work as a UV filter because the nitrite ion absorbs a specific photon energy, otherwise generating hydroxyl radicals. This UV filtering effect was not very large since they only put in 1 mM of nitrite ions. In addition, the produced oxygen radicals then reacted with water to supply hydroxyl radicals. Another role of nitrite ions is directly scavenging hydroxyl radicals (Equation (19)). The authors claimed the selective conversion of methane to methanol by explaining the effects induced by nitrite ions.
NO2 + hυ → NO· + O·
+H2O → ·OH + OH
NO2 + ·OH → NO2· +OH
NO2 + hVB+ → NO2·

6.3. Proposed Mechanism

From the experimental results of photocatalytic POM using various oxidants, its mechanism has been thoroughly proposed. The result that the suppression of hydroxyl radicals promoted methanol and the increasing amount of hydroxyl radicals promoted ethane generation gives a rough mechanism outline, which is written as Equations (11)–(15).
The proposed mechanism provides a strategy to selectively produce methanol rather than ethane. First, as described above, the suppression of the number of hydroxyl radicals is important. There are two main ways to suppress their generation or to scavenge them. In other words, the possible strategies are (1) cutting off or not using photons with energy input, which can initiate the photolysis of water; (2) using a scavenger to decrease hydroxyl radicals; (3) avoiding compounds that have the possibility of generating hydroxyl radicals, such as H2O2. Another important point is the choice of oxidant. As the oxidant has strong reactivity, methane will be oxidized to CO2.
It is noted that most reports assert that methane is not directly oxidized by holes in a liquid-phase partial oxidation process. Instead, H2O or hydroxyl groups are intermediates and play an important role in methane oxidation. The reaction mechanism of POM is different from that of the SRM and DRM introduced in Section 4 and Section 5. The liquid-phase POM reaction is significantly different from gas-phase SRM and DRM, and the temperature in the POM system would be considerably lower than that in the gas-phase system. As an aqueous solution provides a reaction with abundant water, the intermediate can be sufficiently supplied. In addition, as in most cases, methane conversion is an endothermic reaction, and heat can directly assist in oxidizing methane.

7. Photocatalytic Nonoxidative Coupling of Methane

7.1. Overview of the Reaction

Non-oxidative coupling of methane (NOCM) is a desirable technique since industrially demanded C2 species can be directly made from methane [60]. However, its catalytic activity in dark conditions is extremely low compared to other methane-reforming techniques.
As for the mechanism, it is unique because it does not contain a reductant. In general, if there are oxidants and reductants, they consume holes and electrons, respectively. Since there is only methane, whose valence state of carbon is −4, it is speculated that it works only as a reductant. Thus, electrons are consumed by some intermediates, or carbon itself will be further reduced to −5. Furthermore, unlike other oxidative methane-reforming processes, there is no oxygen to remove carbon once it deposits onto the surface of the catalyst. This lack of oxygen makes it difficult for the reaction to proceed for a long time.

7.2. Material

Wu et al. reported on an efficient NOCM reaction using a Ga-doped Pt-loaded porous TiO2-SiO2 [61]. They introduced methane gas into their reactor and checked the output gas. According to their XPS results, the valence state of Pt was more cationic when more Ga was doped. Although Ga decreased the number of exciting carriers, they claimed that a larger amount of cation Pt benefited more and achieved higher photocatalytic activity. The results of the methane conversion, ethane selectivity, and yield are shown in Figure 45.
Yuliati et al. loaded various metals onto SiO2 and Al2O3 and performed non-oxidative methane reforming by introducing only methane (Figure 46) [62]. They found that only the cerium-loaded silica exhibited remarkable activity. They further performed experiments on the cerium amount dependence. As the amount increased, the ratio of Ce3+ decreased and Ce4+ increased. At the same time, the activity decreased as the loading amount increased. From this result, it was confirmed that Ce3+ was the active site.
Ga2O3 and Ga2O3/SiO2 were explored for photocatalytic non-oxidative methane-reforming catalysts at room temperature by Yuliati et al. [63], who noted that the calculated equilibrium of ethane production was 0.0004%. Their results showed that bare Ga2O3 had higher photocatalytic activity than any amount of Ga supported on silica. On the other hand, 0.1 mol% Ga-loaded silica has a higher selectivity of ethane (94%). The reason was attributed to the dispersion of Ga on the surface of silica, where a lower amount of Ga can drive photocatalytic reactions separately from neighboring Ga such that no other reaction would be likely to follow. They also performed X-ray absorption near-edge structure (XANES) analysis and found two structures of local Ga states: tetrahedral and octahedral. From the quantitative analysis, they found that the tetrahedral species exhibited high specific activity for selective ethane production.
Singh et al. further loaded palladium onto Ga2O3 and performed a non-oxidative conversion of methane [64]. The thermodynamic equilibrium of ethane generation from methane (Equation (5)) was calculated to be 0.0002%. They achieved 0.006% and the stoichiometric reaction continued as the value of C2H6/H2 was almost unity in the case of Pd (0.5 wt%)/Ga2O3, indicating that photons successfully drove the non-oxidative conversion of methane. However, they found some problems in which the catalyst became unstable if the temperature was higher than 320 K, the light intensity was strong, or the methane concentration was high.
Lang et al. performed NOCM using various metals on TiO2 and found that Au-TiO2 had the highest activity among various catalysts (Figure 6) [33]. The stability test is shown in Figure 47. The production rate of both ethane and H2 decreased by 21.5% from the initial performance, but it was noted that the rate of producing both ethane and H2 was sustained at the equivalent values during the reaction. This result is important because it can be said that the stoichiometric reaction proceeded and carbon deposition was suppressed.

7.3. Proposed Mechanism

From an analogy with other photocatalytic reactions, Singh et al. assumed the following mechanism [64]:
CH4 + h+ → ·CH3 + H+,
2·CH3 → C2H6,
2H+ + 2e → H2,
·CH3 + 3h+ → C + 3H+.
As the valence state of carbon in methane is −4, they speculated that methane oxidation to methyl radicals would be the first step for the reaction (Equation (21)). Then, a proton will be reduced such that the reaction proceeds as Equations (22) and (23). Their results also observed carbon deposition, which can easily be predicted because of the absence of extra oxidants that remove carbon. The formation of carbon deposition is described by Equation (24).
Density function theory (DFT) calculations were performed by Lang et al. for a mechanism study [33] to clarify the CH3 species after the first step of an electron and hole transfer based on Bader charge analysis. As a result, they found that CH3 exists on Au and CH3/CH3+ exists on TiO2. Furthermore, they obtained a result showing that the activation barrier for methane reduction to CH3 at the Au site was 0.47 eV, while it was 1.1 eV at the TiO2 site. Thus, it was assumed that CH4 would be reduced to CH3 on Au and oxidized to CH3+ on TiO2. It is noted from the calculations they performed that the methyl radicals are less likely to be generated. Furthermore, they investigated whether CH3+ or CH3 would be methyl radicals that generate ethane. The results of the DFT calculations are shown in Figure 48. As the activation energy of methane to CH3+ on TiO2 (1.57 eV) is much higher than that of CH3 on Au-TiO2 (0.47 eV), the carbocation pathway is less likely to occur. Therefore, they concluded that NOCM proceeded via a methyl anion-radical mechanism (Figure 49). This mechanism was supported by their diffuse reflectance infrared Fourier transform (DRIFT) experiment, where CH3 anions were observed at approximately 600 cm−1.
Different mechanisms have been proposed by researchers with various catalyst materials. Thus, a single general mechanism of the POM reaction cannot be drawn. As only methane is used as an input in the NOCM process, methane or intermediates derived from methane act as an oxidant and a reductant. To elucidate the detailed reaction path, the discussion and characterization of the intermediates are important, including CH3+, CH3, and methyl radicals. As the intermediate state analysis is difficult, further study is needed to understand the mechanism of NOCM fully.

8. Other Important Phenomena that Must Be Considered

8.1. Another Excitation Mechanism: Hot Carriers

Recently, another excitation mechanism in semiconductor–metal combined materials, so-called hot carriers, has been reported by many researchers [65,66,67,68,69]. Hot carriers are generated when photons are irradiated onto metal, causing the excitation of electrons into unoccupied bands (Figure 50). The excitation of metal should be separately discussed with that of a semiconductor. Furthermore, the electron transfer path is different from the bandgap excitation in semiconductors. Notably, some studies have focused on hot carrier-driven methane reforming.
Jiang et al. used Sr2Ta2O7, an ultrawide bandgap semiconductor, and loaded palladium onto it [70]. According to their UV-visible diffuse reflectance spectrum (UV-vis DRS), the bandgap of Sr2Ta2O7 was determined to be 4.6 eV. Photocatalytic partial oxidation of methane was performed and the result of the action spectrum using a long-wave pass filter is shown in Figure 51a. The UV-vis DRS spectrum of Pd@Sr2Ta2O7 shows a broad absorption of Pd, which was assigned to the interband charge transition in Pd, resulting in the generation of hot carriers. They found that there was no critical change between λ ≥ 250 nm and λ ≥ 300 nm. These results indicate that the bandgap excitation of Sr2Ta2O7 is not a critical requirement to drive the reaction. The claim that the bandgap excitation was unnecessary was further verified by comparing the intensity using several long-wave pass filters and conversion or yield (Figure 51b). Because photon numbers through long-wave pass filters cannot be set at equal values for each experiment, the irradiation power density varies when using different filters. These results concluded that the conversion of methane and the yield of carbon monoxide at both 423 and 623 K is only dependent on the irradiation power density, not on the wavelength.
To exclude the effect of bandgap excitation, they further used MCM-41 as a support material such that there was no possibility of bandgap excitation under the mercury-xenon lamp [71]. They employed partial photocatalytic oxidation using metal-loaded MCM-41. Figure 52 shows the UV-vis spectrum and action spectra. The absorption caused by metal (rhodium and palladium) overlapped with the average quantum yield of methane. They also compared the contributions of heat or photons as the surface temperature increased (Figure 53). The proportion of each contribution was determined by constructing an Arrhenius plot for each photocatalytic activity and the obtained apparent activation energies were compared. They found that in the case of rhodium, palladium, and ruthenium-loaded catalysts, the proportion was approximately 50% in the nonthermal photocatalytic pathways, but zero in the case of platinum. These results suggest that there are two mechanisms in the photon-driven reaction, that is, a photo-thermal effect and hot carrier generation.
Ye et al. performed steam reforming of methane using Rh/TiO2 and irradiated visible light (420 ≤ λ ≤ 800) [72]. The hydrogen production rate was drastically improved, as shown in Figure 54a. Their action spectrum showed that the reaction occurred without bandgap excitation of TiO2 (Figure 54b). The apparent activation energy decreased when the light was irradiated on the sample (Figure 54c).
As shown above, some previous studies reported that photons could drive the reaction with longer wavelengths, which is unexpected when considering the bandgap gap energies of these reports. The action spectrum analyses provide us with more knowledge that the bandgap excitation is not a sole reaction path in methane reforming. Thus, we must focus on hot carrier generation in metals. It is important to separately discuss the contribution of bandgap excitation and hot carrier generation. Action spectrum analysis and spectroscopic analysis is helpful for understanding the mechanism of photocatalytic methane reforming. In addition, the surface temperature increase due to the plasmonic effect in metal under photon irradiation is not negligible, as mentioned in the next section.

8.2. Bandgap Shift due to Thermal Energy

Regardless of the excitation mechanism, that is, bandgap excitation or hot carrier, relaxation after the excitation will contribute to increasing the surface temperature of the photocatalysts. As we have introduced in this review, many researchers perform methane reforming in the gas phase; thus, a temperature increase is not avoidable. In addition, in some studies, heat energy was intentionally added and the photocatalytic activity increased as the temperature increased.
Our group evaluated the surface temperature of the Rh/TaON photocatalyst using a long-wavelength cutoff filter under a Xenon lamp (Figure 55) [22]. As a control group, Rh/Al2O3 was prepared. In Rh/Al2O3, since there is no absorbance in the range of 350 nm ≤ λ ≤ 600 nm, the temperature increase due to rhodium was confirmed to be 49 °C. In the case of Rh/TaON, the temperature increased by 56 °C. This result shows that TaON contributed to a further 7 °C increase in addition to Rh. These results show that both rhodium and TaON act as converters of light into heat, enhancing the photocatalytic reaction. The temperature dependence of the photocatalytic activity is shown in Figure 27 in Section 5.2.
Various other reports also indicated the importance of adding heat in the photocatalytic methane reforming process. As mentioned in Section 6, Jiang et al. measured the surface temperature of the photocatalyst while performing partial oxidation of methane in the gas phase [71]. The strong light increased the surface temperature of the photocatalyst, which increased the photocatalytic activity. It is noted that they claimed that almost half of the products could not be explained only by the increased surface temperature. Pan et al. [46] and Han et al. [51] also found that photocatalytic activity increased as they induced heat energy (Figure 56).
Very recently, we found that the absorption spectra of semiconductors are largely changed under heat treatment, which was analyzed by operando UV-vis spectroscopy [73]. This bandgap shift phenomenon should be considered since the surface temperature of most of the photocatalysts increases, especially for gas-phase reactions, such as methane conversion. The temperature increase is remarkable when there is plasmonic absorption of the metal. It is a problem that the absorption spectra are usually recorded under room temperature, which is different from the actual catalysis evaluation condition. Therefore, an evaluation of the absorption spectra under heat input (operando UV-vis absorption spectra) is very important for determining the photocatalytic performance factors, such as internal quantum efficiency.
The operando UV-vis was constructed by our group, and the spectra were measured from 22 to 500 °C on various metal semiconductors (Figure 57). As we estimated bandgaps from Tauc plots, we found that the bandgap values for each semiconductor decreased linearly in this temperature range (Figure 58a). The narrowing of the bandgap was large; for example, in the case of TiO2, the bandgap decreased from 3.02 to 2.78 eV as the temperature increased from 22 to 500 °C. In the case of CeO2 and Nb2O5, white powder at room temperature turned to a vivid yellow at high temperature. It was also discovered that the effect of bandgap narrowing is more remarkable when the metal–oxygen ion distance in a crystal lattice is large (Figure 58b).
In summary, there are two issues to be considered while performing methane reforming. First, there is another mechanism for excitation apart from bandgap excitation, namely, hot carriers. The hot carriers excite metals at a dependent wavelength from the semiconductor support. Thus, there is a certain wavelength where both the bandgap is excited and hot carriers coexist, and only one exists. Second, the temperature dependence of the bandgap must be considered because it narrows significantly as temperature increases, and many studies on photocatalytic methane reforming are performed at high temperatures, either intentionally or unintentionally. As the surface temperature of the catalyst increases as light is irradiated onto the photocatalyst in the gas phase, it is impossible to achieve photocatalytic phenomena apart from the photo-thermal phenomenon. In most cases of photocatalytic methane reforming, the temperature increase has a positive effect on the activity. Therefore, optimizing each parameter to achieve high photocatalytic and photo-thermal activity is important when practical use is considered. From a scientific viewpoint, we must always be careful about all these effects.

9. Conclusions

In this review, we have introduced recent studies related to photocatalytic methane reforming. With respect to the history of the catalyst development for methane reforming, it began with thermal catalysts and has seen great advances since. It is good news that light has promoted photocatalytic activity, resulting in different product selectivities or anti-coking effects. Thus, it seems that light-irradiation solved crucial problems that thermal energy alone holds.
As for materials, various photocatalysts have been applied to photocatalytic methane reforming. Many photocatalysts, such as TiO2, ZnO, CeO2, Ta2O5, WO3, SrTiO3, NaTaO3, K2Ti6O13, and g-C3N4, were used. From various results, it can be concluded that the appropriate conduction band position should be chosen by considering the redox potentials of the reductant molecules. In addition, like thermal catalysts, the basicity of the semiconductor is quite important in photocatalytic methane reforming.
The mechanism of photocatalytic methane reforming remains controversial. As it is known, the mechanism for methane reforming in dark conditions is so complicated that the detailed mechanism is still studied in thermal catalysis. In photocatalytic methane reforming, photon energy is additionally supplied, and its mechanism is very complicated. However, many papers reported that the excited carriers in semiconductors react with reactants; electron reduces H2O, O2, or CO2, and holes oxidize CH4. In addition, the mediators in these photocatalytic reactions have multiple possibilities. There are reports that the oxygen ion is the mediator, and in some reports, protons are the mediators. In addition, there is evidence that [CH2O]n is one possibility for a mediator. The type of mediator depends on the surface structure of the catalysts and the type of methane reforming reaction. Hot carrier generation should also be considered for development. If the photon energy that causes hot carrier generation is smaller than the bandgap, there will be two carrier excitation types under irradiation with larger photon energies. The surface kinetics are also important, as we mentioned in this review paper. It should also be considered that the surface temperature of the photocatalyst is higher than the temperature measured in the reactor. As the quantum efficiency is usually a few percent, the energy of the photon is mostly converted to heat energy. Thus, the heat contribution is not negligible in the gas-phase reaction. In addition, the physical properties of the semiconductor will change as the temperature increases.
We propose two prospects for this field. One is the detailed study of the mechanism by manufacturing simple and understandable structures and conditions of catalysis. Previous studies were complex, and there were too many hypotheses. Understanding the reaction mechanism using either a simulation or experimental approach enables us to advance our research and development more strategically. For example, a spectroscopic method together with a well-defined surface, such as a single crystal, makes it possible to further discuss the reaction mechanism by observing the reaction intermediates. It can also be beneficial to fabricate a series of samples while holding one interpretable parameter; then, we can systematically compare their activity, stoichiometry, and/or stability. As there are so many parameters in photocatalytic methane reforming, an investigation of each parameter’s effect on the catalytic activity should be an important study for the future of this field. The second is to pursue higher activities; in particular, the visible-light activity is indispensable for utilizing solar energy effectively. By developing a photocatalyst that remains highly active and is composed of abundant and nontoxic elements, photocatalytic methane reforming may replace the current thermal system. As the shale gas revolution enables more methane to be produced, the technology for utilizing methane will become more important. From the standpoint of a hydrogen society, methane conversion is further important. On the other hand, as the Paris Agreement represents, global warming is one of the most serious problems humans face. Hence, methane must be activated without further CO2 emissions. Photons are one solution to solve the double-binding problem. To solve these difficult but important problems, we expect more researchers to join this field.

Author Contributions

Experimental work in this review, Y.C.; writing—original draft preparation, Y.C.; writing—review and editing, A.Y. and M.M.; project leader, M.M. All authors have read and agreed to the published version of the manuscript.

Funding

This research was supported by JST SICROP and JST CREST (grant no. JPMJCR15P1).

Institutional Review Board Statement

Not applicable.

Informed Consent Statement

Not applicable.

Conflicts of Interest

The authors declare no conflict of interest.

References

  1. Liu, C.; Ye, J.; Jiang, J.; Pan, Y. Progresses in the Preparation of Coke Resistant Ni-based Catalyst for Steam and CO2 Reforming of Methane. ChemCatChem 2011, 3, 529–541. [Google Scholar] [CrossRef]
  2. Tang, S.-B.; Qiu, F.-L.; Lu, S.-J. Effect of supports on the carbon deposition of nickel catalysts for methane reforming with CO2. Catal. Today 1995, 24, 253–255. [Google Scholar] [CrossRef]
  3. Aramouni, N.A.K.; Touma, J.G.; Tarboush, B.A.; Zeaiter, J.; Ahmad, M.N. Catalyst design for dry reforming of methane: Analysis review. Renew. Sustain. Energy Rev. 2018, 82, 2570–2585. [Google Scholar] [CrossRef]
  4. Lavoie, J.-M. Review on dry reforming of methane, a potentially more environmentally-friendly approach to the increasing natural gas exploitation. Front. Chem. 2014, 2, 81. [Google Scholar] [CrossRef] [Green Version]
  5. Chen, X.; Li, Y.; Pan, X.; Cortie, D.; Huang, X.; Yi, Z. Photocatalytic oxidation of methane over silver decorated zinc oxide nanocatalysts. Nat. Commun. 2016, 7, 12273. [Google Scholar] [CrossRef] [PubMed] [Green Version]
  6. Meng, X.; Cui, X.; Rajan, N.P.; Yu, L.; Deng, D.; Bao, X. Direct Methane Conversion under Mild Condition by Thermo-, Electro-, or Photocatalysis. Chem 2019, 5, 2296–2325. [Google Scholar] [CrossRef]
  7. Gordon, S.; Mcbride, B.J. Computer Program for Calculation of Complex Chemical Equilibrium Compositions and Application; NASA Reference Publication: Washington, DC, USA, 1994. [Google Scholar]
  8. Tomishige, K.; Himeno, Y.; Matsuo, Y.; Yoshinaga, Y.; Fujimoto, K. Catalytic Performance and Carbon Deposition Behavior of a NiO−MgO Solid Solution in Methane Reforming with Carbon Dioxide under Pressurized Conditions. Ind. Eng. Chem. Res. 2000, 39, 1891–1897. [Google Scholar] [CrossRef]
  9. Guo, X.; Fang, G.; Li, G.; Ma, H.; Fan, H.; Yu, L.; Ma, C.; Wu, X.; Deng, D.; Wei, M.; et al. Direct, Non-oxidative Conversion of Methane to Ethylene, Aromatics, and Hydrogen. Science 2014, 344, 616–619. [Google Scholar] [CrossRef] [PubMed]
  10. Xu, Y.; Bao, X.; Lin, L. Direct conversion of methane under non-oxidative conditions. J. Catal. 2003, 216, 386–395. [Google Scholar] [CrossRef]
  11. Redondo, A.B.; Troussard, E.; van Bokhoven, J.A. Non-oxidative methane conversion assisted by corona discharge. Fuel Process. Technol. 2012, 104, 265–270. [Google Scholar] [CrossRef]
  12. Fujishima, A.; Honda, K. Electrochemical Photolysis of Water at a Semiconductor Electrode. Nature 1972, 238, 37–38. [Google Scholar] [CrossRef] [PubMed]
  13. Qu, Y.; Duan, X. Progress, challenge and perspective of heterogeneous photocatalysts. Chem. Soc. Rev. 2013, 42, 2568–2580. [Google Scholar] [CrossRef] [PubMed]
  14. Kudo, A.; Miseki, Y. Heterogeneous photocatalyst materials for water splitting. Chem. Soc. Rev. 2009, 38, 253–278. [Google Scholar] [CrossRef] [PubMed]
  15. Web of Science. Analyze search Results for methane Reforming and methane Reforming Photo. Available online: https://apps.webofknowledge.com/WOS_GeneralSearch_input.do?product=WOS&search_mode=GeneralSearch&SID=F3OWgDOUyyDPjOy2WTg&preferencesSaved= (accessed on 11 November 2020).
  16. Maeda, K.; Teramura, K.; Lu, D.; Takata, T.; Saito, N.; Inoue, Y.; Domen, K. Photocatalyst releasing hydrogen from water. Nature 2006, 440, 295. [Google Scholar] [CrossRef] [PubMed]
  17. Low, J.; Cheng, B.; Yu, J. Surface modification and enhanced photocatalytic CO2 reduction performance of TiO2: A review. Appl. Surf. Sci. 2017, 392, 658–686. [Google Scholar] [CrossRef]
  18. Ye, S.; Wang, R.; Wu, M.-Z.; Yuan, Y.-P. A review on g-C3N4 for photocatalytic water splitting and CO2 reduction. Appl. Surf. Sci. 2015, 358, 15–27. [Google Scholar] [CrossRef]
  19. Wang, H.Y.; Ruckenstein, E. Carbon dioxide reforming of methane to synthesis gas over supported rhodium catalysts: The effect of support. Appl. Catal. A Gen. 2000, 204, 143–152. [Google Scholar] [CrossRef]
  20. Dębek, R.; Radlik, M.; Motak, M.; Galvez, M.E.; Turek, W.; Da Costa, P.; Grzybek, T. Ni-containing Ce-promoted hydrotalcite derived materials as catalysts for methane reforming with carbon dioxide at low temperature—On the effect of basicity. Catal. Today 2015, 257, 59–65. [Google Scholar] [CrossRef]
  21. García, V.; Fernández, J.J.; Ruíz, W.; Mondragón, F.; Moreno, A. Effect of MgO addition on the basicity of Ni/ZrO2 and on its catalytic activity in carbon dioxide reforming of methane. Catal. Commun. 2009, 11, 240–246. [Google Scholar] [CrossRef]
  22. Cho, Y.; Shoji, S.; Yamaguchi, A.; Hoshina, T.; Fujita, T.; Abe, H.; Miyauchi, M. Visible-light-driven dry reforming of methane using a semiconductor-supported catalyst. Chem. Commun. 2020, 56. [Google Scholar] [CrossRef]
  23. Shimura, K.; Kato, S.; Yoshida, T.; Itoh, H.; Hattori, T.; Yoshida, H. Photocatalytic Steam Reforming of Methane over Sodium Tantalate. J. Phys. Chem. C 2010, 114, 3493–3503. [Google Scholar] [CrossRef]
  24. Shimura, K.; Kawai, H.; Yoshida, T.; Yoshida, H. Bifunctional Rhodium Cocatalysts for Photocatalytic Steam Reforming of Methane over Alkaline Titanate. ACS Catal. 2012, 2, 2126–2134. [Google Scholar] [CrossRef]
  25. Li, D.; Nakagawa, Y.; Tomishige, K. Methane reforming to synthesis gas over Ni catalysts modified with noble metals. Appl. Catal. A Gen. 2011, 408, 1–24. [Google Scholar] [CrossRef]
  26. Rezaei, M.; Alavi, S.M.; Sahebdelfar, S.; Yan, Z.-F. Syngas Production by Methane Reforming with Carbon Dioxide on Noble Metal Catalysts. J. Nat. Gas. Chem. 2006, 15, 327–334. [Google Scholar] [CrossRef]
  27. Pakhare, D.; Spivey, J. A review of dry (CO2) reforming of methane over noble metal catalysts. Chem. Soc. Rev. 2014, 43, 7813–7837. [Google Scholar] [CrossRef]
  28. László, B.; Baán, K.; Varga, E.; Oszkó, A.; Erdőhelyi, A.; Kónya, Z.; Kiss, J. Photo-induced reactions in the CO2-methane system on titanate nanotubes modified with Au and Rh nanoparticles. Appl. Catal. B Environ. 2016, 199, 473–484. [Google Scholar] [CrossRef]
  29. Shimura, K.; Yoshida, H. Semiconductor Photocatalysts for Non-oxidative Coupling, Dry Reforming and Steam Reforming of Methane. Catal. Surv. Asia 2014, 18, 24–33. [Google Scholar] [CrossRef] [Green Version]
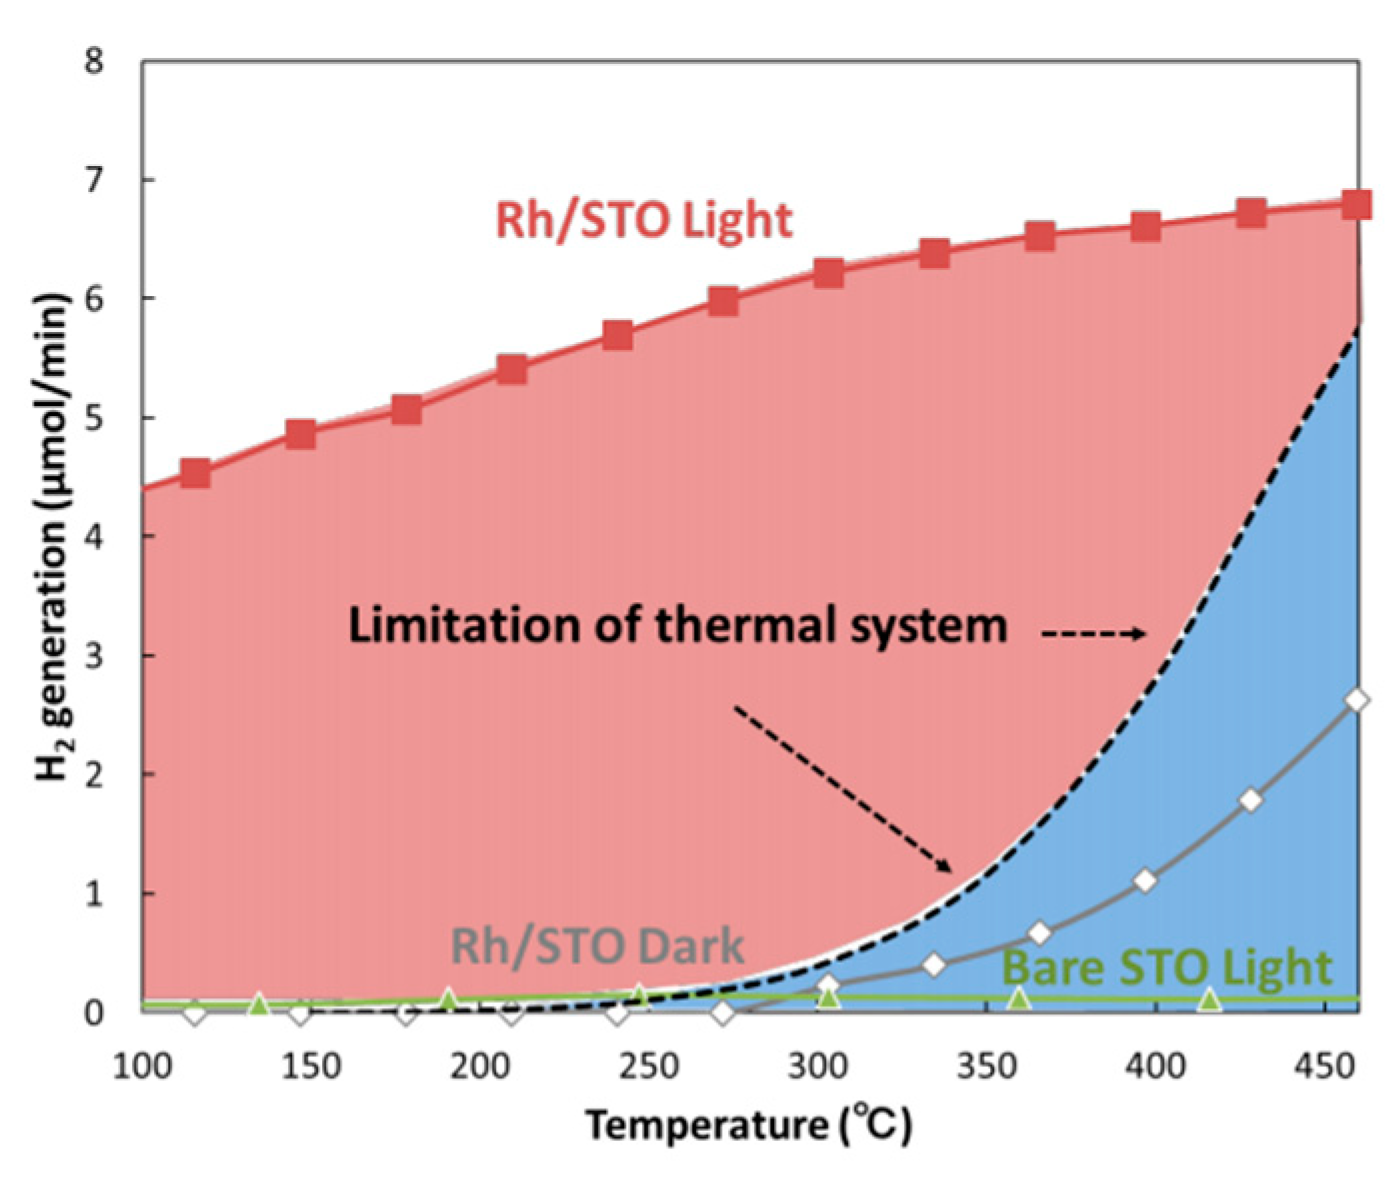
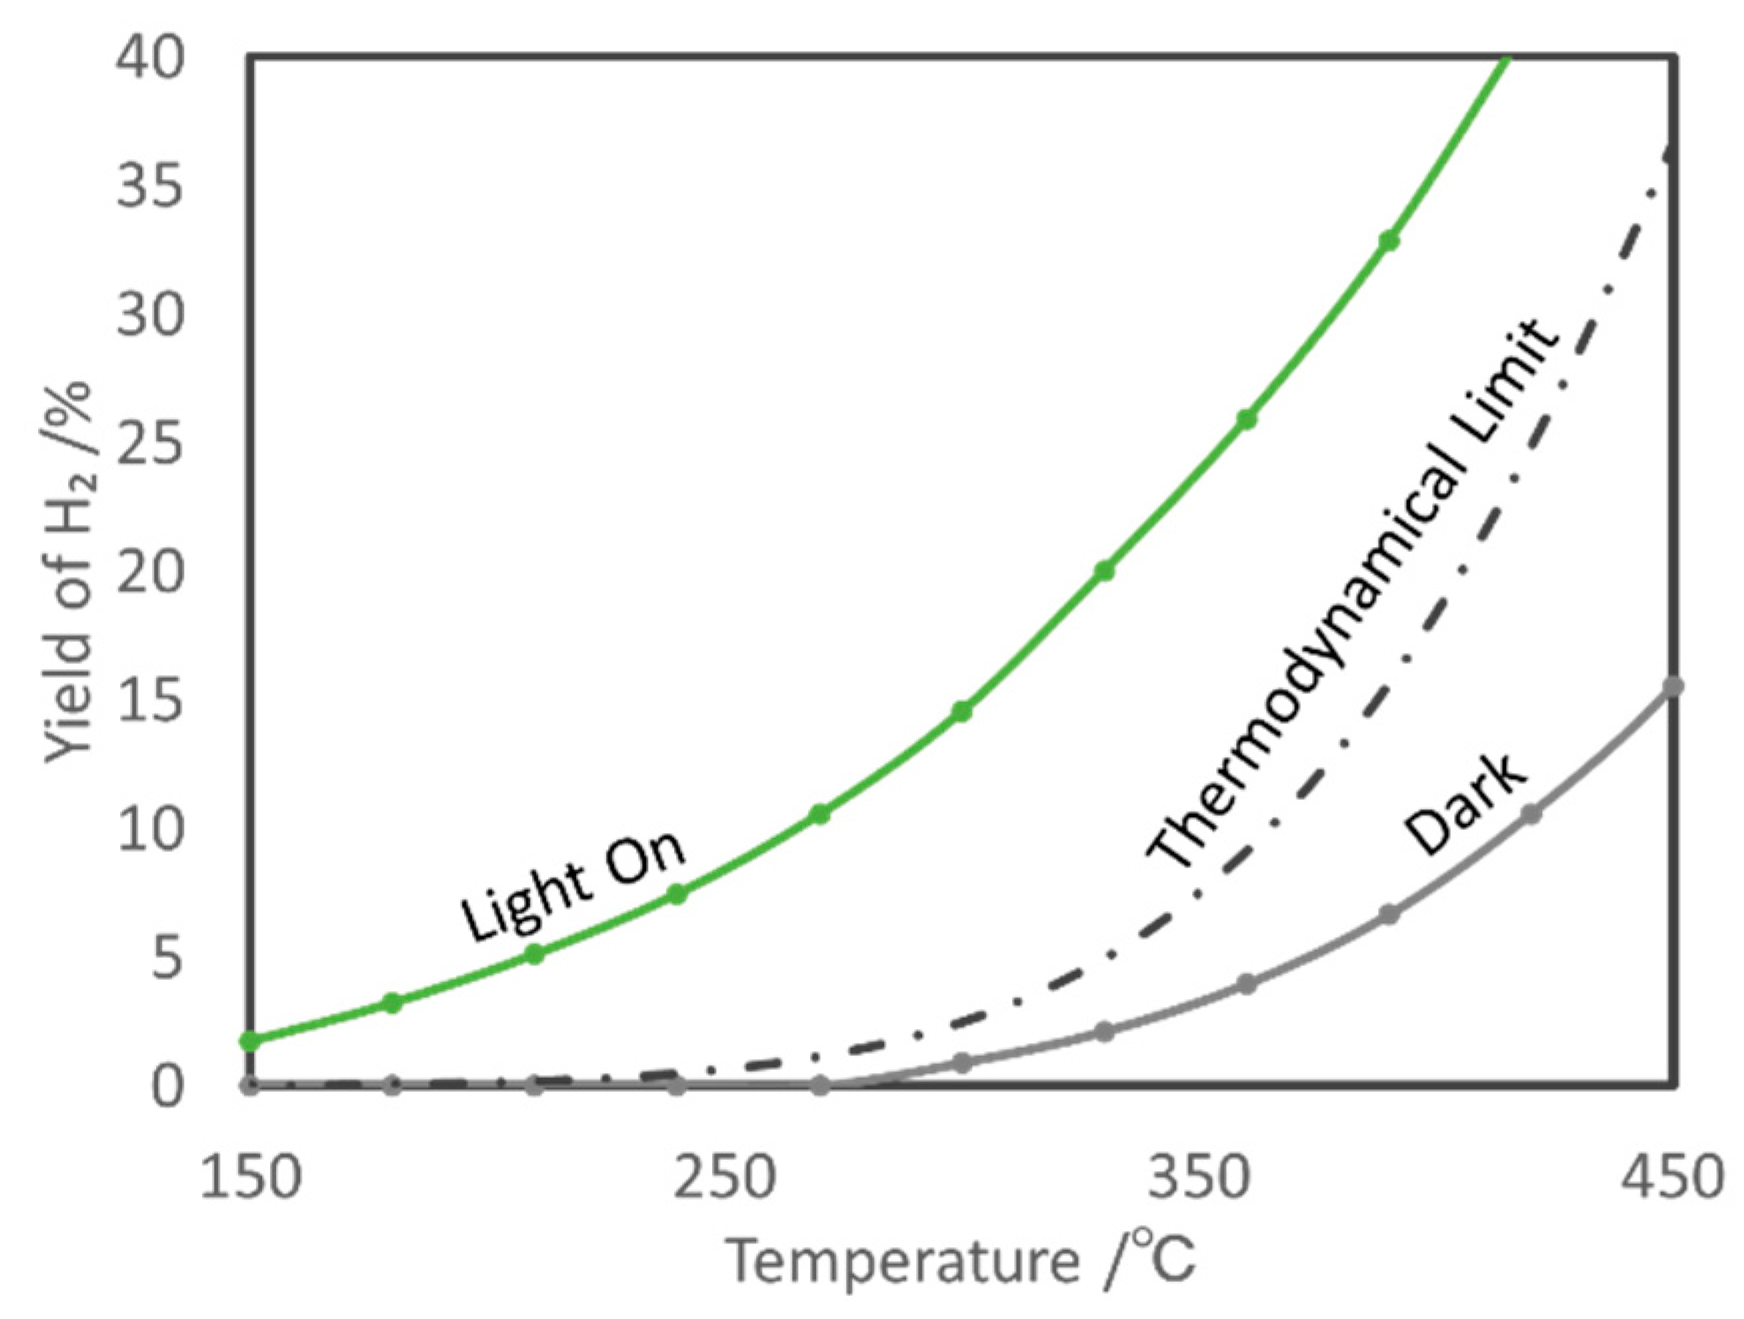
  30. Shoji, S.; Peng, X.; Yamaguchi, A.; Watanabe, R.; Fukuhara, C.; Cho, Y.; Yamamoto, T.; Matsumura, S.; Yu, M.-W.; Ishii, S.; et al. Photocatalytic uphill conversion of natural gas beyond the limitation of thermal reaction systems. Nat. Catal. 2020, 3. [Google Scholar] [CrossRef]
  31. Tahir, M.; Tahir, B.; Amin, N.S. Photocatalytic CO2 reduction by CH4 over montmorillonite modified TiO2 nanocomposites in a continuous monolith photoreactor. Mater. Res. Bull. 2015, 63, 13–23. [Google Scholar] [CrossRef]
  32. Shi, D.; Feng, Y.; Zhong, S. Photocatalytic conversion of CH4 and CO2 to oxygenated compounds over Cu/CdS–TiO2/SiO2 catalyst. Catal. Today 2004, 98, 505–509. [Google Scholar] [CrossRef]
  33. Lang, J.; Ma, Y.; Wu, X.; Jiang, Y.; Hu, Y.H. Highly efficient light-driven methane coupling under ambient conditions based on an integrated design of a photocatalytic system. Green Chem. 2020, 22, 4669–4675. [Google Scholar] [CrossRef]
  34. Roy, S.; Bauer, T.; Al-Dahhan, M.; Lehner, P.; Turek, T. Monoliths as multiphase reactors: A review. AIChE J. 2004, 50, 2918–2938. [Google Scholar] [CrossRef]
  35. Tahir, M.; Tahir, B.; Zakaria, Z.Y.; Muhammad, A. Enhanced photocatalytic carbon dioxide reforming of methane to fuels over nickel and montmorillonite supported TiO2 nanocomposite under UV-light using monolith photoreactor. J. Clean. Prod. 2019, 213, 451–461. [Google Scholar] [CrossRef]
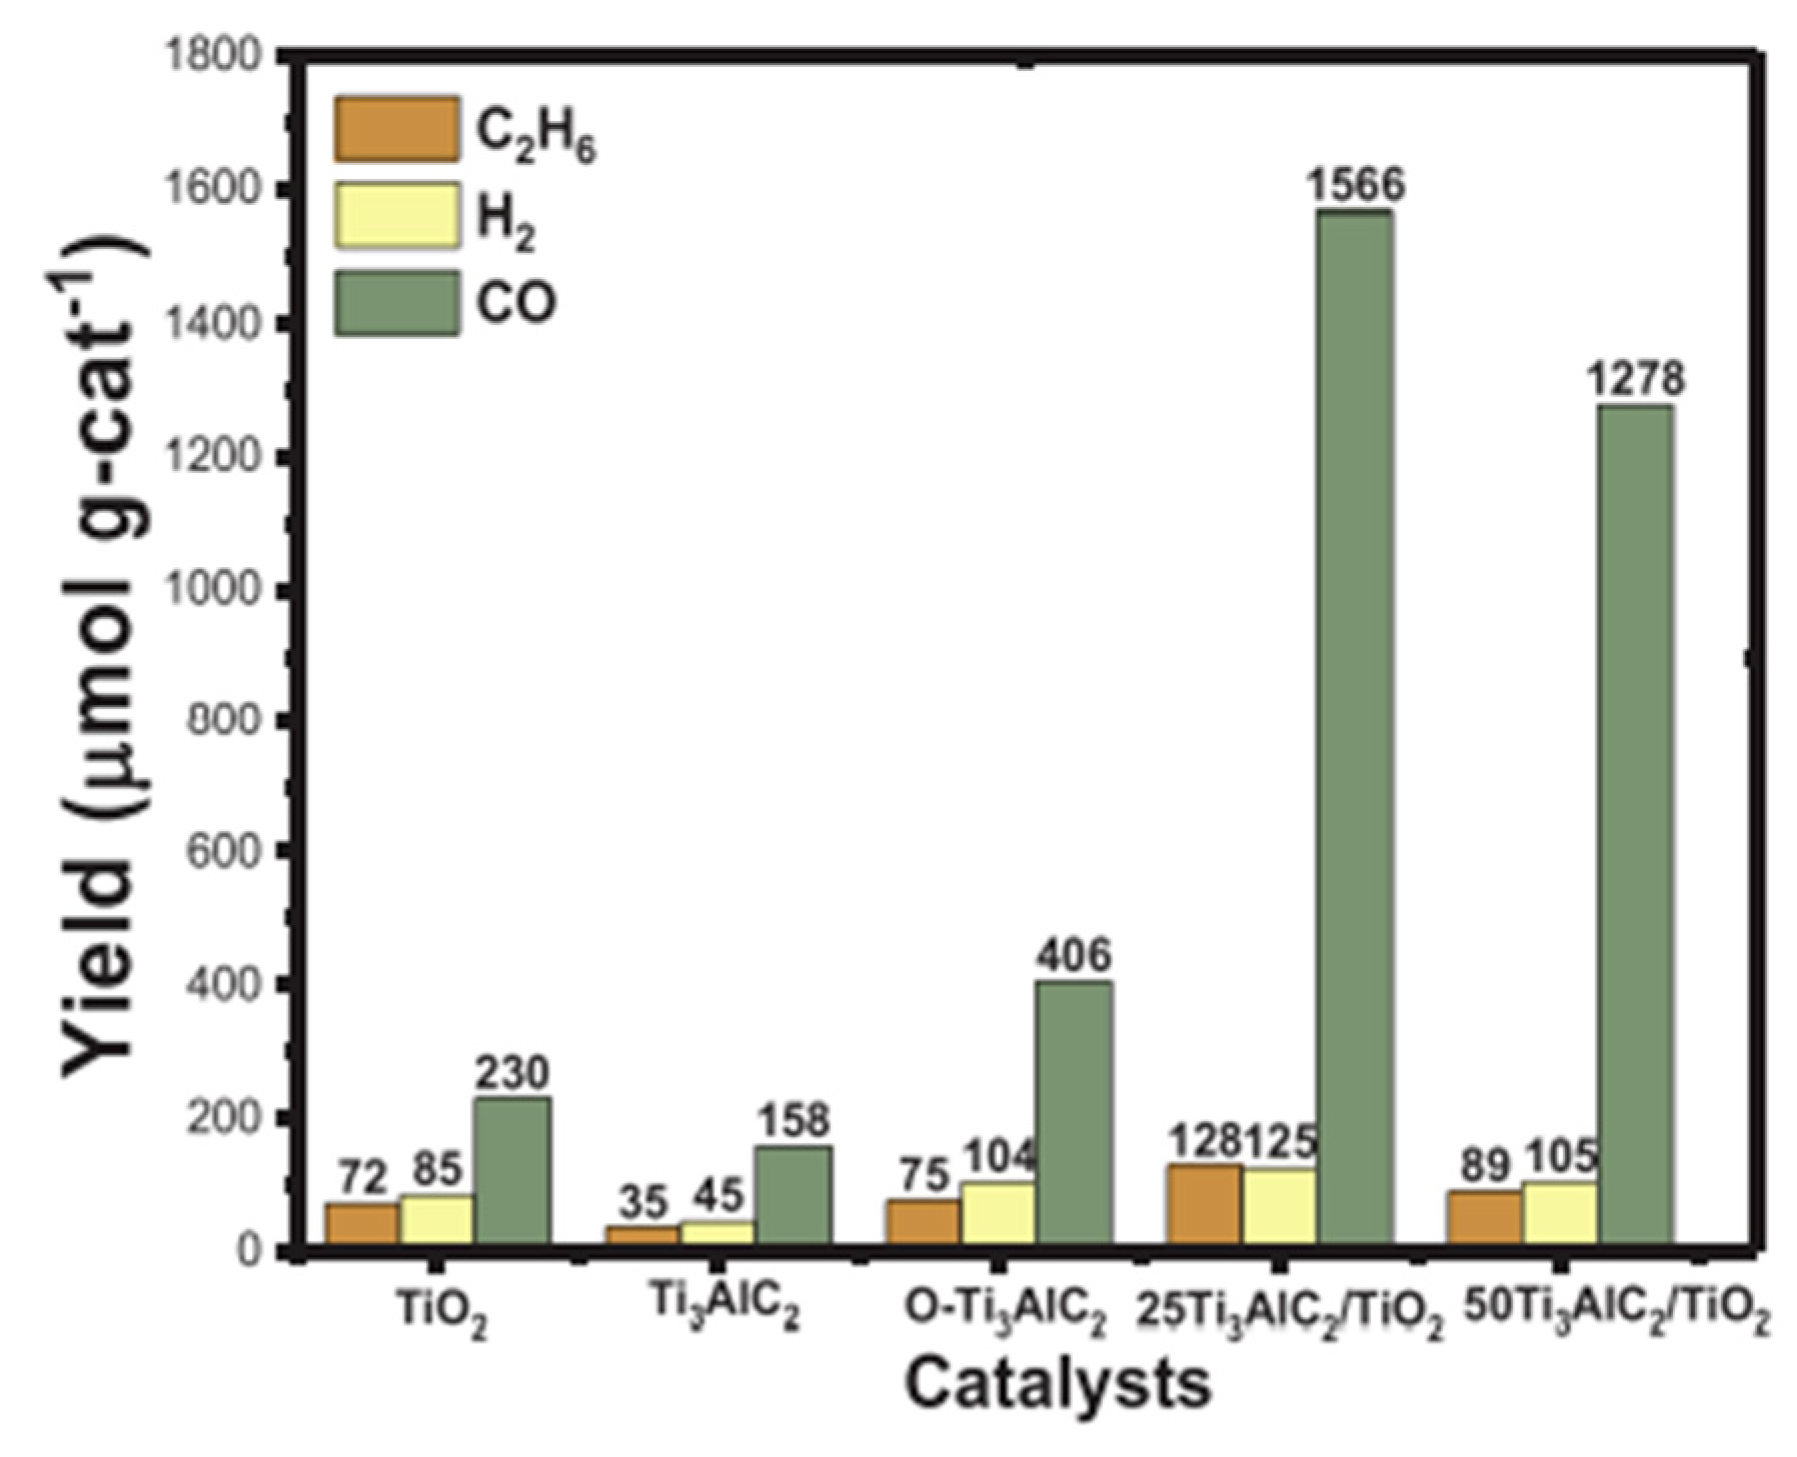
  36. Tahir, M. Enhanced photocatalytic CO2 reduction to fuels through bireforming of methane over structured 3D MAX Ti3AlC2/TiO2 heterojunction in a monolith photoreactor. J. CO2 Util. 2020, 38, 99–112. [Google Scholar] [CrossRef]
  37. Li, X.; Zhang, X.; Everitt, H.O.; Liu, J. Light-Induced Thermal Gradients in Ruthenium Catalysts Significantly Enhance Ammonia Production. Nano Lett. 2019, 19, 1706–1711. [Google Scholar] [CrossRef]
  38. Ohno, T.; Sarukawa, K.; Tokieda, K.; Matsumura, M. Morphology of a TiO2 Photocatalyst (Degussa, P-25) Consisting of Anatase and Rutile Crystalline Phases. J. Catal. 2001, 203, 82–86. [Google Scholar] [CrossRef]
  39. Park, H.; Park, Y.; Kim, W.; Choi, W. Surface modification of TiO2 photocatalyst for environmental applications. J. Photochem. Photobiol. C Photochem. Rev. 2013, 15, 1–20. [Google Scholar] [CrossRef]
  40. Yoshida, H.; Hirao, K.; Nishimoto, J.; Shimura, K.; Kato, S.; Itoh, H.; Hattori, T. Hydrogen Production from Methane and Water on Platinum Loaded Titanium Oxide Photocatalysts. J. Phys. Chem. C 2008, 112, 5542–5551. [Google Scholar] [CrossRef]
  41. Choudhary, V.R.; Mondal, K.C. CO2 reforming of methane combined with steam reforming or partial oxidation of methane to syngas over NdCoO3 perovskite-type mixed metal-oxide catalyst. Appl. Energy 2006, 83, 1024–1032. [Google Scholar] [CrossRef]
  42. Li, Y.; Wang, Y.; Zhang, X.; Mi, Z. Thermodynamic analysis of autothermal steam and CO2 reforming of methane. Int. J. Hydrogen Energy 2008, 33, 2507–2514. [Google Scholar] [CrossRef]
  43. Wibowo, S.; Yamaguchi, A.; Shoji, S.; Fujita, T.; Abe, H.; Miyauchi, M. Photo-assisted Dry Reforming of Methane over Strontium Titanate. Chem. Lett. 2018, 47, 935–937. [Google Scholar] [CrossRef]
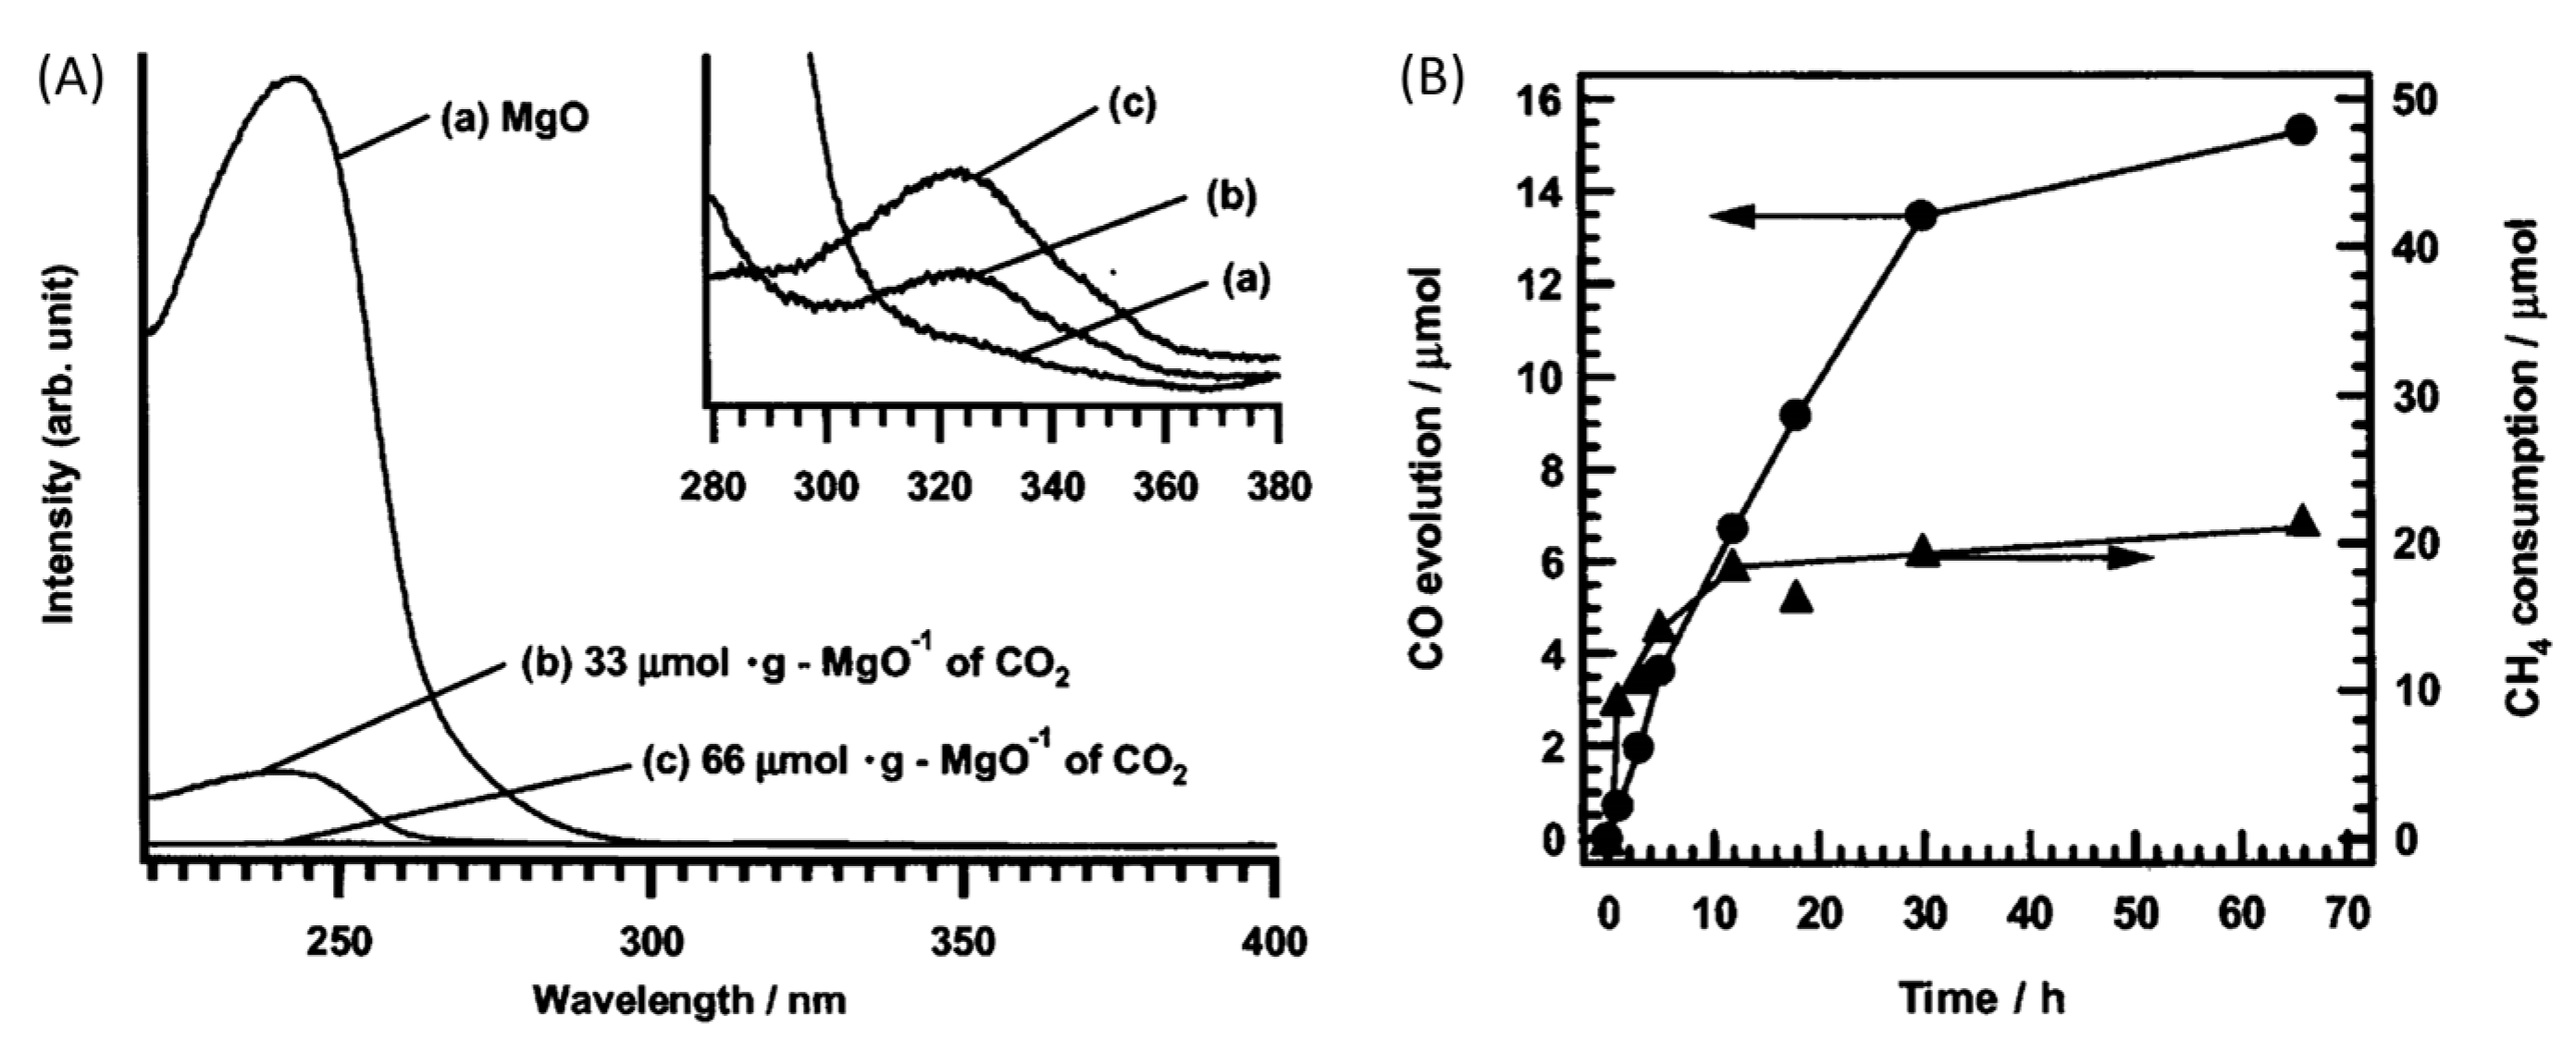
  44. Teramura, K.; Tanaka, T.; Ishikawa, H.; Kohno, Y.; Funabiki, T. Photocatalytic Reduction of CO2 to CO in the Presence of H2 or CH4 as a Reductant over MgO. J. Phys. Chem. B 2003, 108, 346–354. [Google Scholar] [CrossRef]
  45. Chang, S.; Li, M.; Hua, Q.; Zhang, L.; Ma, Y.; Ye, B.; Huang, W. Shape-dependent interplay between oxygen vacancies and Ag–CeO2 interaction in Ag/CeO2 catalysts and their influence on the catalytic activity. J. Catal. 2012, 293, 195–204. [Google Scholar] [CrossRef]
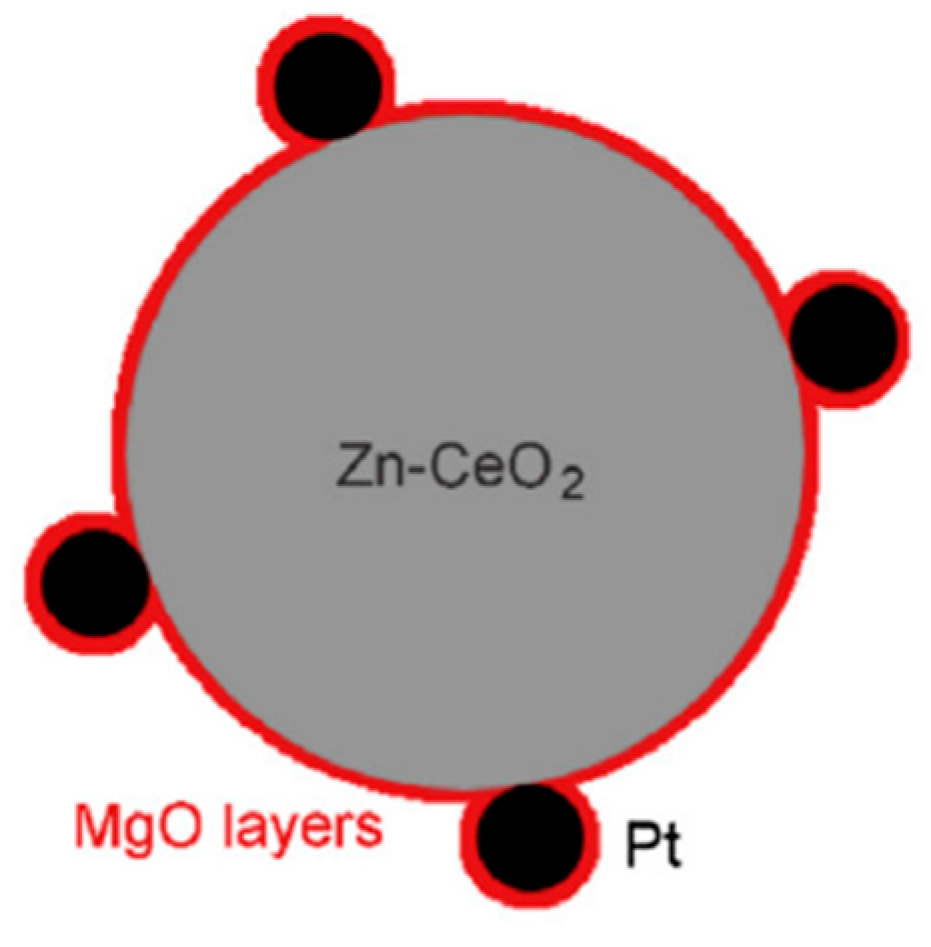
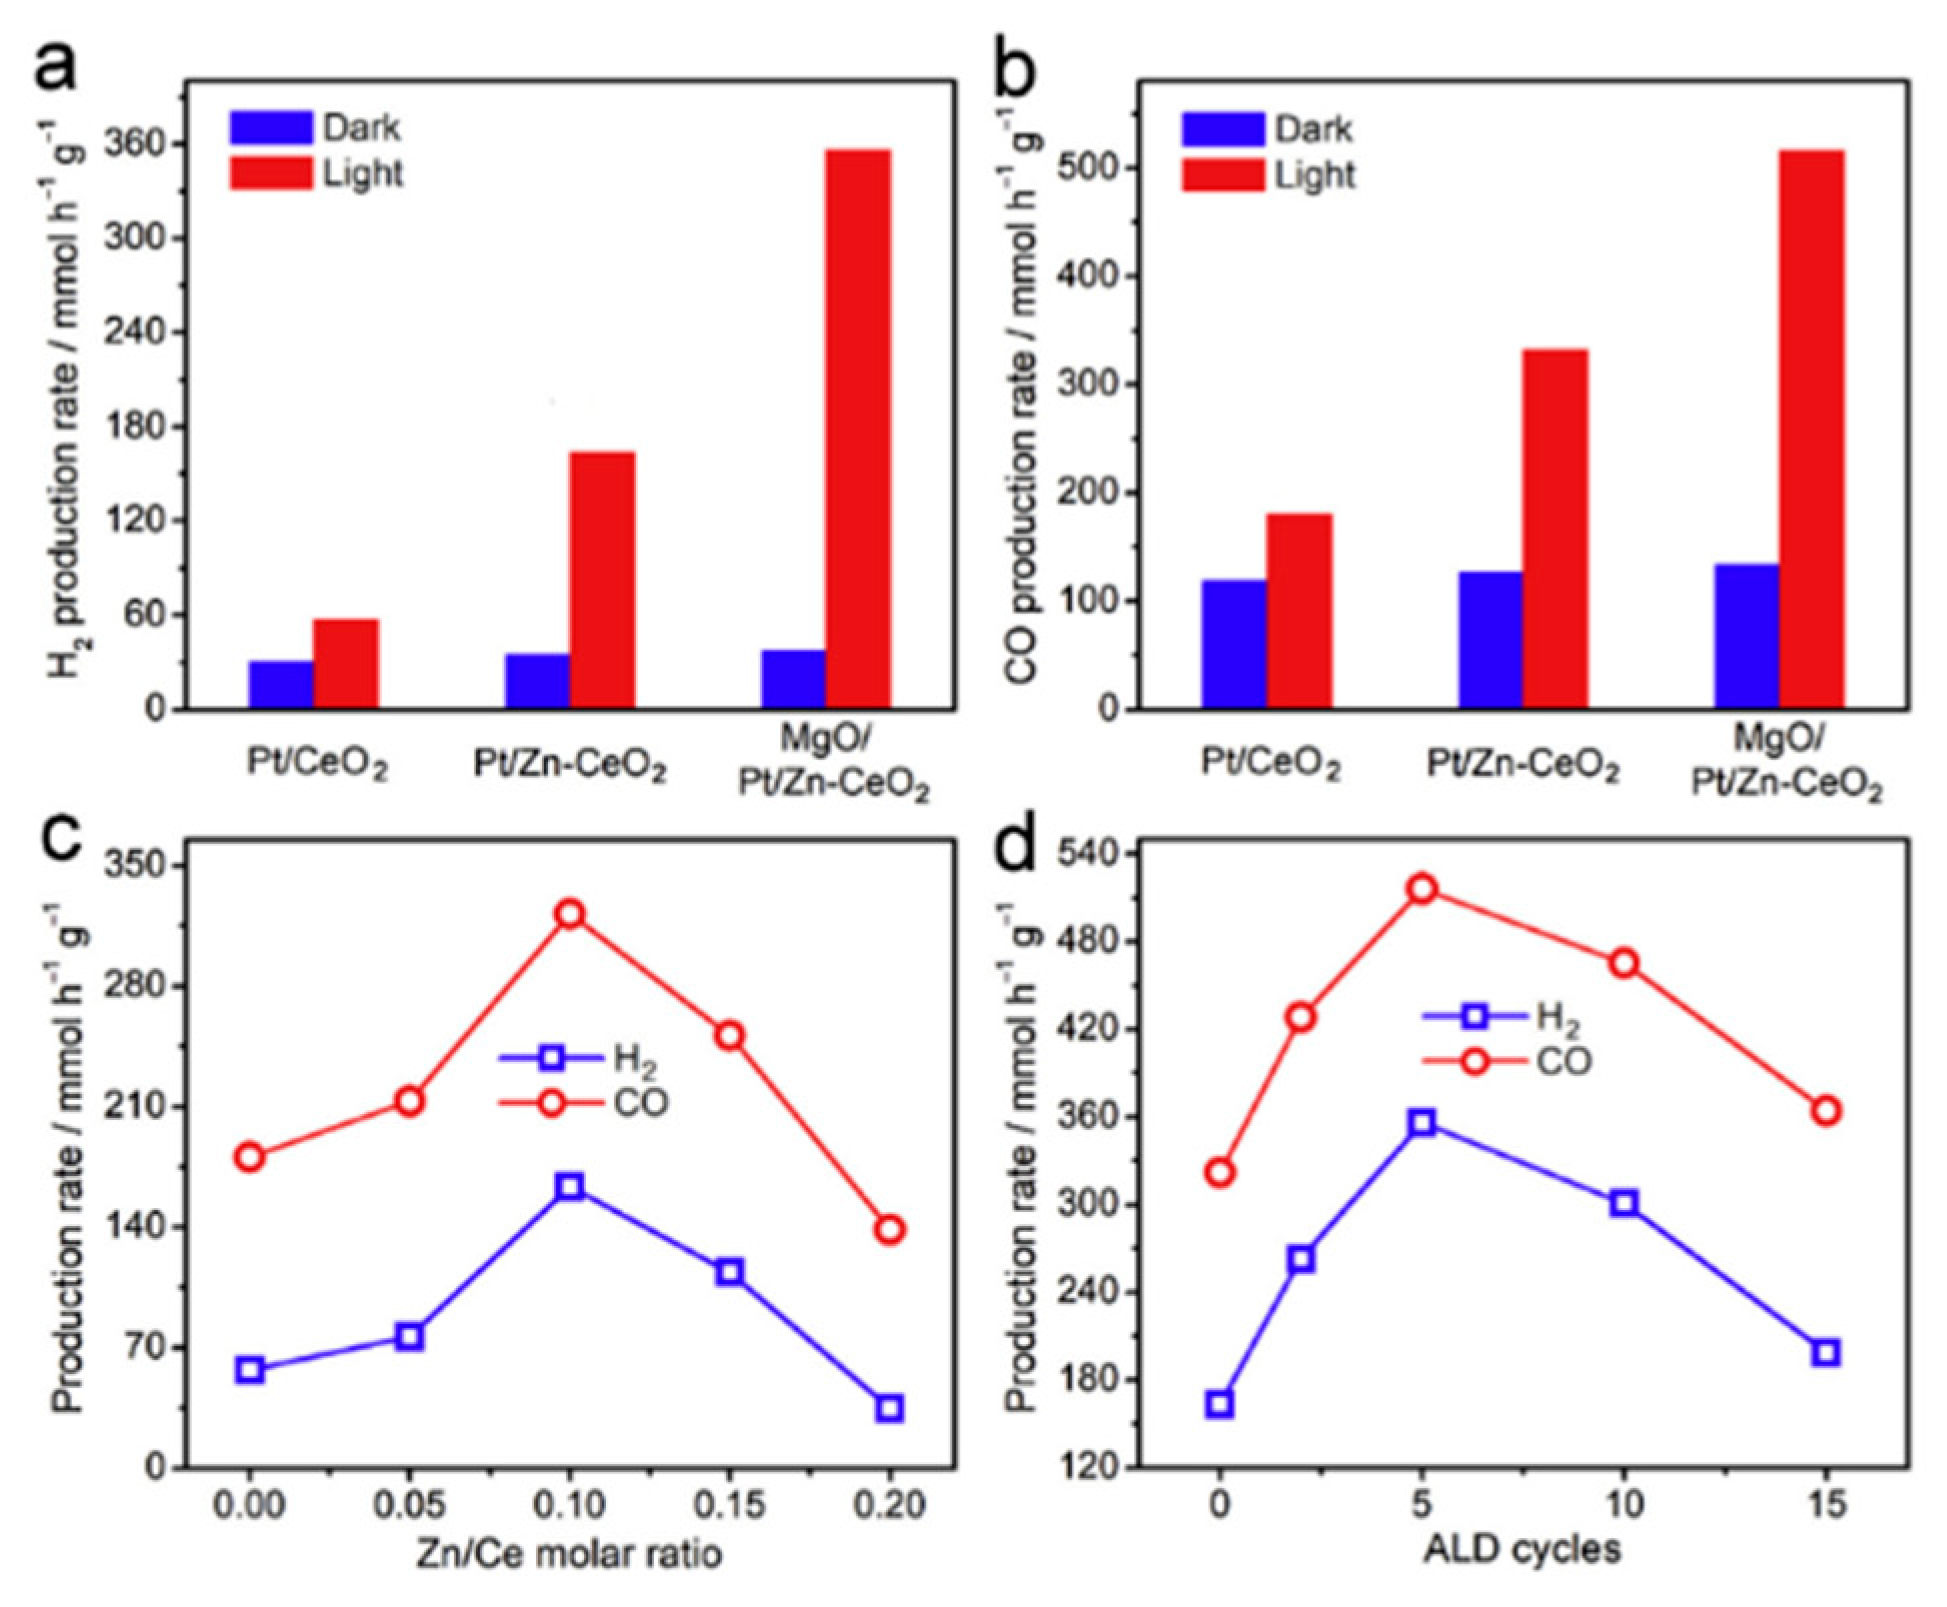
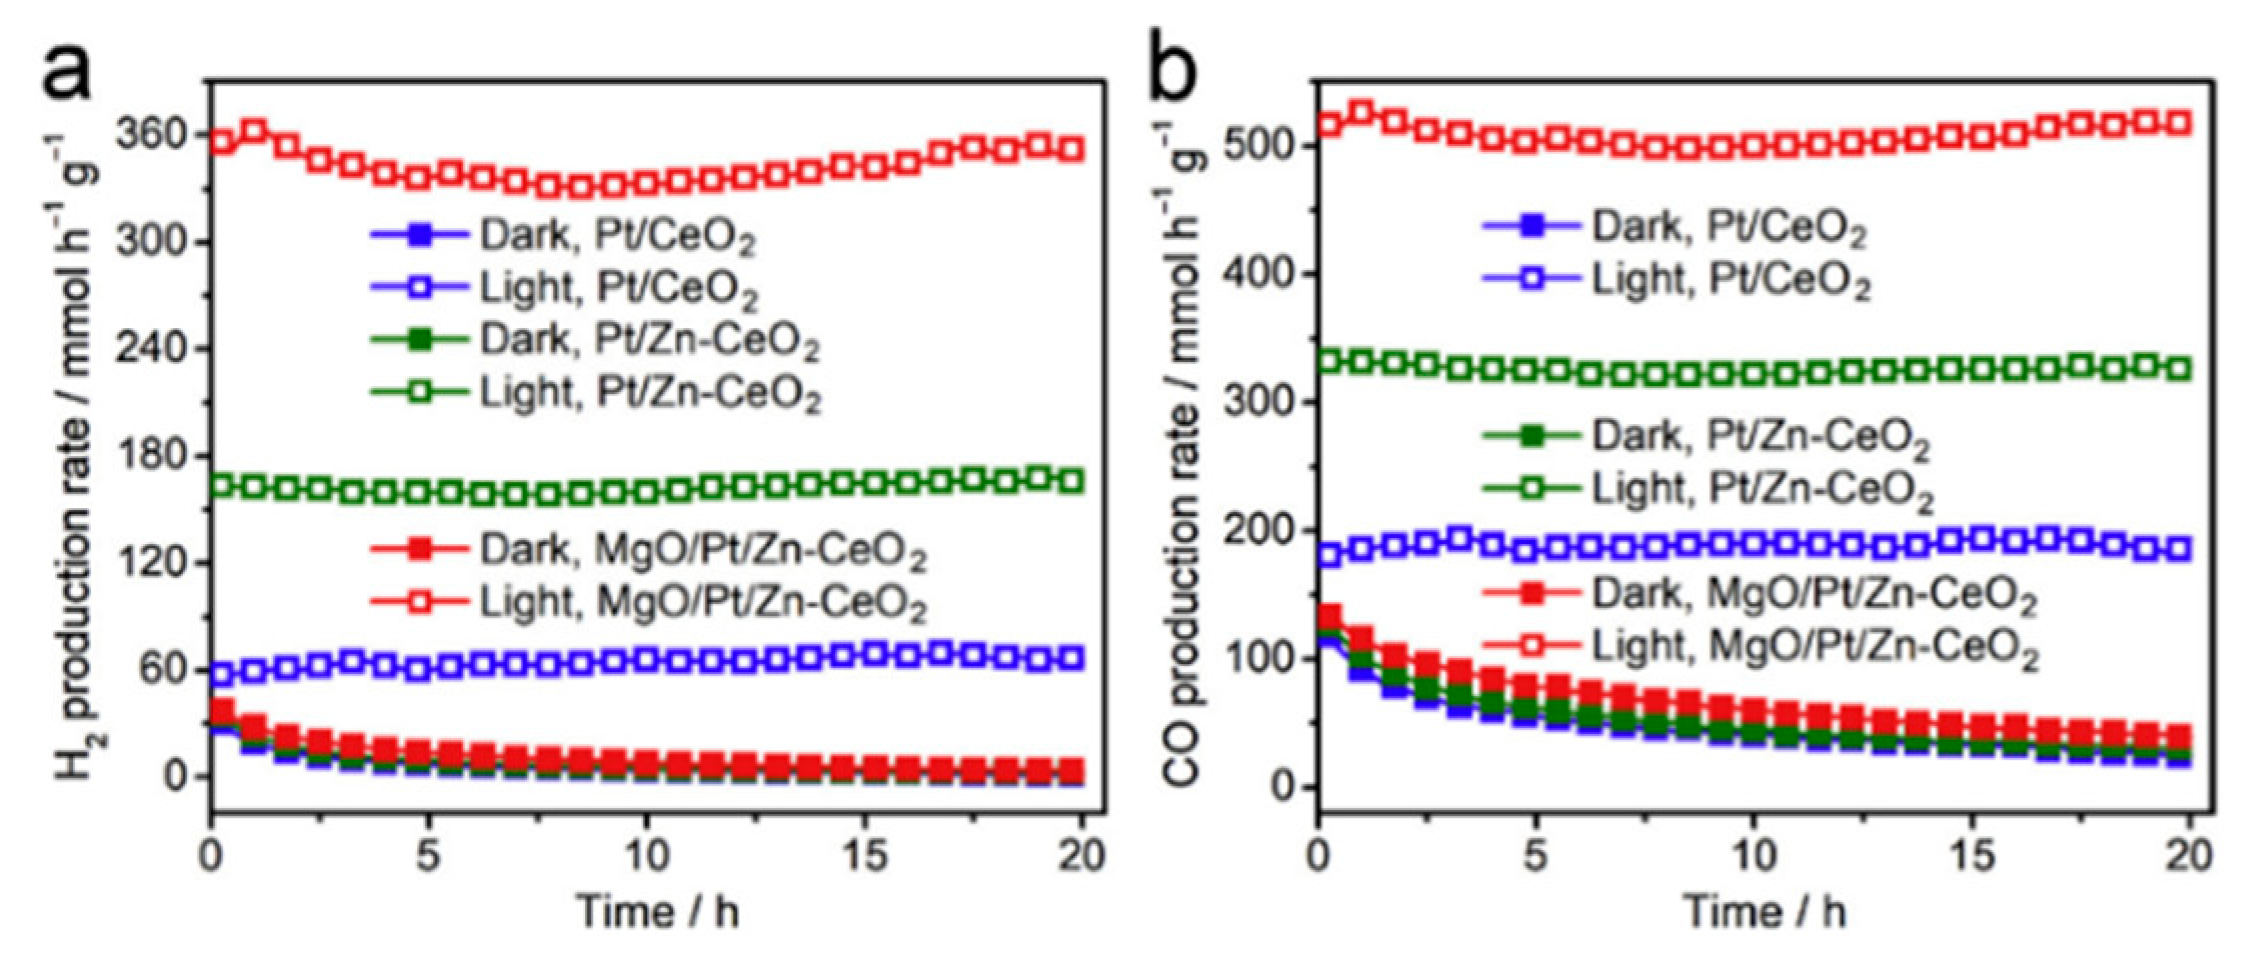
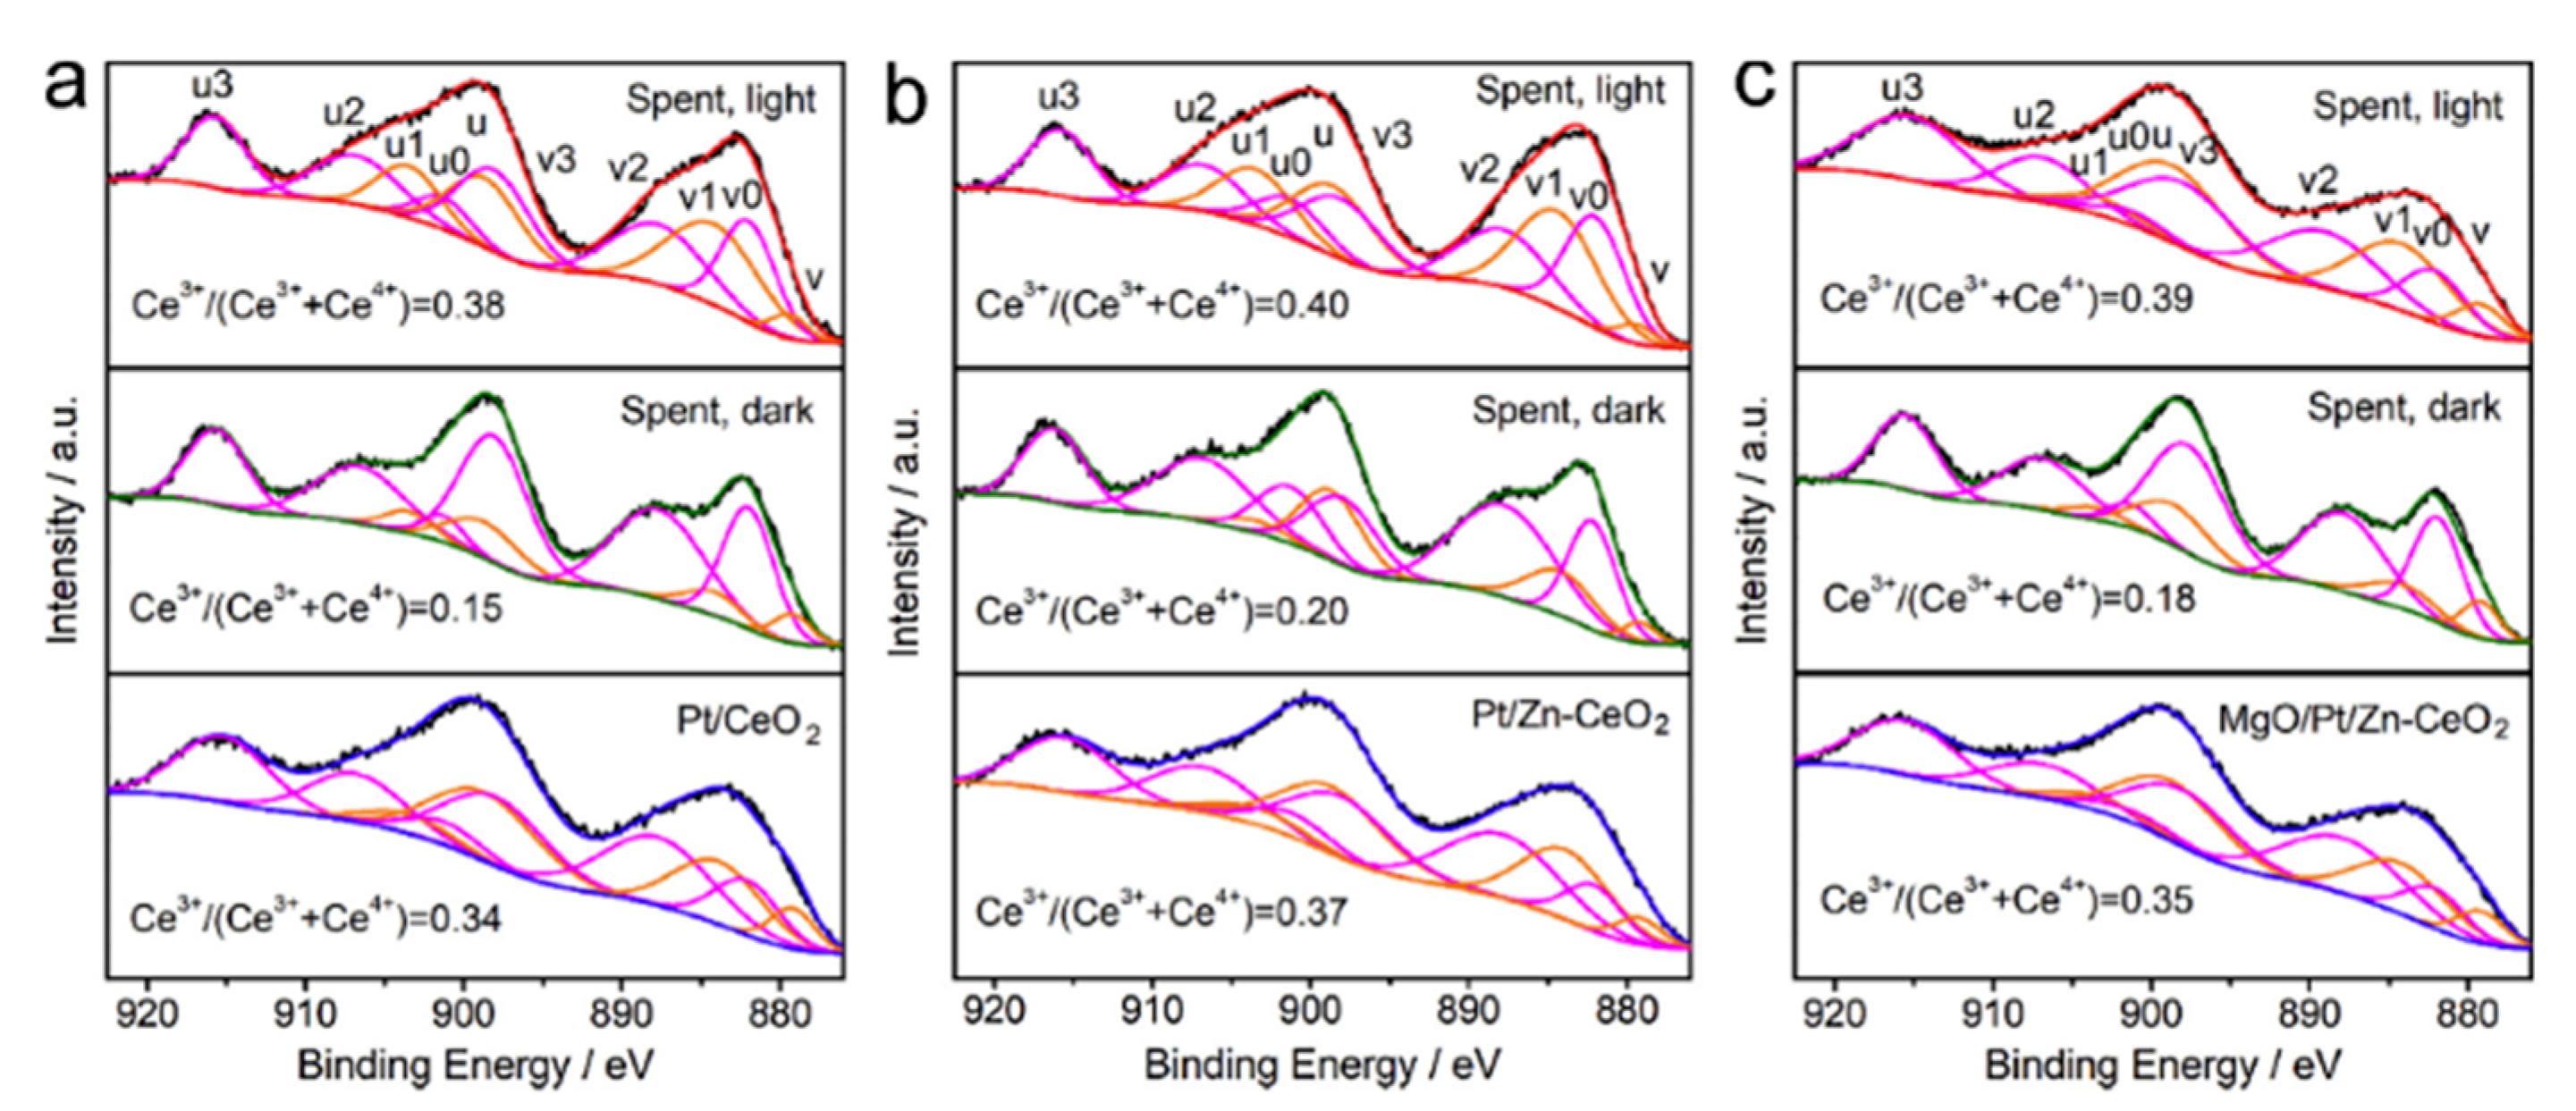
  46. Pan, F.; Xiang, X.; Du, Z.; Sarnello, E.; Li, T.; Li, Y. Integrating photocatalysis and thermocatalysis to enable efficient CO2 reforming of methane on Pt supported CeO2 with Zn doping and atomic layer deposited MgO overcoating. Appl. Catal. B Environ. 2020, 260, 118189. [Google Scholar] [CrossRef]
  47. Lei, J.; Chen, Y.; Shen, F.; Wang, L.; Liu, Y.; Zhang, J. Surface modification of TiO2 with g-C3N4 for enhanced UV and visible photocatalytic activity. J. Alloys Compd. 2015, 631, 328–334. [Google Scholar] [CrossRef]
  48. Tahir, B.; Tahir, M.; Amin, N.A.S. Photo-induced CO2 reduction by CH4/H2O to fuels over Cu-modified g-C3N4 nanorods under simulated solar energy. Appl. Surf. Sci. 2017, 419, 875–885. [Google Scholar] [CrossRef]
  49. Tahir, B.; Tahir, M.; Amin, N.A.S. Silver loaded protonated graphitic carbon nitride (Ag/pg-C3N4) nanosheets for stimulating CO2 reduction to fuels via photocatalytic bi-reforming of methane. Appl. Surf. Sci. 2019, 493, 18–31. [Google Scholar] [CrossRef]
  50. Han, B.; Wei, W.; Chang, L.; Cheng, P.; Hu, Y.H. Efficient Visible Light Photocatalytic CO2 Reforming of CH4. ACS Catal. 2015, 6, 494–497. [Google Scholar] [CrossRef]
  51. Han, B.; Wei, W.; Li, M.; Sun, K.; Hu, Y.H. A thermo-photo hybrid process for steam reforming of methane: Highly efficient visible light photocatalysis. Chem. Commun. 2019, 55, 7816–7819. [Google Scholar] [CrossRef]
  52. Kushida, M.; Yamaguchi, A.; Cho, Y.; Fujita, T.; Abe, H.; Miyauchi, M. Gas-Phase Photoelectrocatalysis Mediated by Oxygen Ions for Uphill Conversion of Greenhouse Gases. ChemPhotoChem 2020. [Google Scholar] [CrossRef]
  53. Wang, B.; Albarracín-Suazo, S.; Pagán-Torres, Y.; Nikolla, E. Advances in methane conversion processes. Catal. Today 2017, 285, 147–158. [Google Scholar] [CrossRef] [Green Version]
  54. Sari, F.N.I.; Lu, S.-H.; Ting, J.-M. Wide-bandgap HfO2-V2O5 nanowires heterostructure for visible light-driven photocatalytic degradation. J. Am. Ceram. Soc. 2020, 103, 2252–2261. [Google Scholar] [CrossRef]
  55. Murcia-López, S.; Villa, K.; Andreu, T.; Morante, J.R. Improved selectivity for partial oxidation of methane to methanol in the presence of nitrite ions and BiVO4 photocatalyst. Chem. Commun. 2015, 51, 7249–7252. [Google Scholar] [CrossRef] [PubMed]
  56. Hu, Y.; Nagai, Y.; Rahmawaty, D.; Wei, C.; Anpo, M. Characteristics of the Photocatalytic Oxidation of Methane into Methanol on V-Containing MCM-41 Catalysts. Catal. Lett. 2008, 124, 80. [Google Scholar] [CrossRef]
  57. Villa, K.; Murcia-López, S.; Andreu, T.; Morante, J.R. Mesoporous WO3 photocatalyst for the partial oxidation of methane to methanol using electron scavengers. Appl. Catal. B Environ. 2015, 163, 150–155. [Google Scholar] [CrossRef]
  58. Murcia-López, S.; Villa, K.; Andreu, T.; Morante, J.R. Partial Oxidation of Methane to Methanol Using Bismuth-Based Photocatalysts. ACS Catal. 2014, 4, 3013–3019. [Google Scholar] [CrossRef]
  59. Murcia-López, S.; Bacariza, M.C.; Villa, K.; Lopes, J.M.; Henriques, C.; Morante, J.R.; Andreu, T. Controlled Photocatalytic Oxidation of Methane to Methanol through Surface Modification of Beta Zeolites. ACS Catal. 2017, 7, 2878–2885. [Google Scholar] [CrossRef]
  60. Choudhary, T.V.; Aksoylu, E.; Wayne Goodman, D. Nonoxidative Activation of Methane. Catal. Rev. 2003, 45, 151–203. [Google Scholar] [CrossRef]
  61. Wu, S.; Tan, X.; Lei, J.; Chen, H.; Wang, L.; Zhang, J. Ga-Doped and Pt-Loaded Porous TiO2–SiO2 for Photocatalytic Nonoxidative Coupling of Methane. J. Am. Chem. Soc. 2019, 141, 6592–6600. [Google Scholar] [CrossRef]
  62. Yuliati, L.; Hamajima, T.; Hattori, T.; Yoshida, H. Nonoxidative Coupling of Methane over Supported Ceria Photocatalysts. J. Phys. Chem. C 2008, 112, 7223–7232. [Google Scholar] [CrossRef]
  63. Yuliati, L.; Hattori, T.; Itoh, H.; Yoshida, H. Photocatalytic non-oxidative coupling of methane on gallium oxide and silica-supported gallium oxide. J. Catal. 2008, 257, 396–402. [Google Scholar] [CrossRef]
  64. Singh, S.P.; Anzai, A.; Kawaharasaki, S.; Yamamoto, A.; Yoshida, H. Non-oxidative coupling of methane over Pd-loaded gallium oxide photocatalysts in a flow reactor. Catal. Today 2020. [Google Scholar] [CrossRef]
  65. Clavero, C. Plasmon-induced hot-electron generation at nanoparticle/metal-oxide interfaces for photovoltaic and photocatalytic devices. Nat. Photonics 2014, 8, 95–103. [Google Scholar] [CrossRef]
  66. Cui, J.; Li, Y.; Liu, L.; Chen, L.; Xu, J.; Ma, J.; Fang, G.; Zhu, E.; Wu, H.; Zhao, L.; et al. Near-Infrared Plasmonic-Enhanced Solar Energy Harvest for Highly Efficient Photocatalytic Reactions. Nano Lett. 2015, 15, 6295–6301. [Google Scholar] [CrossRef] [PubMed]
  67. Zhou, L.; Swearer, D.F.; Zhang, C.; Robatjazi, H.; Zhao, H.; Henderson, L.; Dong, L.; Christopher, P.; Carter, E.A.; Nordlander, P.; et al. Quantifying hot carrier and thermal contributions in plasmonic photocatalysis. Science 2018, 362, 69–72. [Google Scholar] [CrossRef] [Green Version]
  68. Zhang, X.; Li, X.; Reish, M.E.; Zhang, D.; Su, N.Q.; Gutiérrez, Y.; Moreno, F.; Yang, W.; Everitt, H.O.; Liu, J. Plasmon-Enhanced Catalysis: Distinguishing Thermal and Nonthermal Effects. Nano Lett. 2018, 18, 1714–1723. [Google Scholar] [CrossRef]
  69. Tian, Y.; Tatsuma, T. Mechanisms and Applications of Plasmon-Induced Charge Separation at TiO2 Films Loaded with Gold Nanoparticles. J. Am. Chem. Soc. 2005, 127, 7632–7637. [Google Scholar] [CrossRef]
  70. Jiang, H.; Peng, X.; Yamaguchi, A.; Ueda, S.; Fujita, T.; Abe, H.; Miyauchi, M. Photocatalytic Partial Oxidation of Methane on Palladium-Loaded Strontium Tantalate. Sol. RRL 2019, 3, 1900076. [Google Scholar] [CrossRef]
  71. Jiang, H.; Peng, X.; Yamaguchi, A.; Fujita, T.; Abe, H.; Miyauchi, M. Synergistic photo-thermal and photochemical partial oxidation of methane over noble metals incorporated in mesoporous silica. Chem. Commun. 2019, 55, 13765–13768. [Google Scholar] [CrossRef]
  72. Song, H.; Meng, X.; Wang, Z.; Wang, Z.; Chen, H.; Weng, Y.; Ichihara, F.; Oshikiri, M.; Kako, T.; Ye, J. Visible-Light-Mediated Methane Activation for Steam Methane Reforming under Mild Conditions: A Case Study of Rh/TiO2 Catalysts. ACS Catal. 2018, 8, 7556–7565. [Google Scholar] [CrossRef]
  73. Cho, Y.; Yamaguchi, A.; Uehara, R.; Yasuhara, S.; Hoshina, T.; Miyauchi, M. Temperature dependence on bandgap of semiconductor photocatalysts. J. Chem. Phys. 2020, 152, 231101. [Google Scholar] [CrossRef] [PubMed]
Figure 1. Calculated thermodynamic equilibrium of dry reforming of methane (blue line), partial oxidation of methane (using O2, orange line), and steam reforming of methane (gray line). Equation (1) was used to calculate the equilibrium for the steam reforming of methane. The input gas of methane and oxidant were both at 0.01 atm [7].
Catalysts 11 00018 g001
Figure 2. Number of publications found using the search terms “methane reforming” and “methane reforming photo” in Web of Science [15].
Catalysts 11 00018 g002
Figure 3. General electron transfer pathway in a metal-loaded semiconductor after light irradiation.
Catalysts 11 00018 g003
Figure 4. H2 production rate for metal-loaded La-doped NaTaO3 under light irradiation. The loaded amount is 0.01%. The black bars represent the data of materials calcinated at 773 K in air and the white bars show the data of samples further reduced at 673 K under H2. The dotted line represents the H2 production rate of La-loaded NaTaO3 without any co-catalyst. Reprinted with permission from [23]. Copyright (2010), American Chemical Society.
Catalysts 11 00018 g004
Figure 5. H2 production rate for metal-loaded La-loaded K2Ti6O13 under light irradiation. The loaded amount is 0.03%. The gray bar shows the H2 production over various co-catalysts loaded using a photodeposition method and the white bar represents the impregnation method followed by calcination at 773 K. Reprinted with permission from [24]. Copyright (2010), American Chemical Society.
Catalysts 11 00018 g005
Figure 6. Ethane yield by non-oxidative methane coupling using various metal-loaded TiO2 catalysts. Reproduced from [28] with permission from The Royal Society of Chemistry.
Catalysts 11 00018 g006
Figure 7. Conversion of methane and the formation of H2, CO, and C2H6 with Rh and Au loaded on titanate nanotubes (TNT). Reprinted from [29] with permission from Elsevier.
Catalysts 11 00018 g007
Figure 8. Stability test of Rh/TaON performing photocatalytic dry reforming of methane (DRM). Reproduced from [22] with permission from The Royal Society of Chemistry.
Catalysts 11 00018 g008
Figure 9. Example of a reactor for photocatalytic methane reforming: (a) a closed reactor and (b) a flow reactor [29]. Reprinted by permission from [30]. Copyright (2014), Springer Nature. GC-TCD: gas chromatography-thermal conductivity detector.
Catalysts 11 00018 g009
Figure 10. Another reactor design for photocatalytic methane reforming: (1) thermocouple, (2) gas outlet, (3) aluminum foil, (4) sieve plate, (5) heater, (6) graphite plate, (7) mercury lamp, (8) catalyst inlet, (9) quartz reactor, (10) catalyst bed, (11) gas inlet, and (12) fan [32]. Reprinted from [33], with permission from Elsevier.
Catalysts 11 00018 g010
Figure 11. Monolith reactor used in photocatalytic methane reforming. Light can be irradiated deep into the reactor [31]. Reprinted from [32], with permission from Elsevier. FID: flame ionization detector, MFC: mass flow controller.
Catalysts 11 00018 g011
Figure 12. Example of a reactor for photocatalytic methane reforming. The heater and thermocouple are equipped and the surface temperature is also measured [22].
Catalysts 11 00018 g012
Figure 13. (A) Band structure of (a) Rh2O3, (b) K2Ti6O13, and (c) rhodium metal, and (B) the proposed mechanism of the photocatalytic steam reforming of methane over Rh/Rh2O3/K2Ti6O13. Reprinted with permission from [24]. Copyright (2012), American Chemical Society. NHE: normal hydrogen electrode.
Catalysts 11 00018 g013
Figure 14. Production rates of (a) H2, (b) CO2, and a molar ratio of (c) H2/CO2, where the input gas was (A) CH4 (50%) + H2O (1.6%) and (B) H2O (1.6%). Reprinted with permission from [40]. Copyright (2008), American Chemical Society.
Catalysts 11 00018 g014
Figure 15. Time course of the production rate of H2 with the methane concentration controlled to be (A) 10%, (B) 50%, (C) 10%, (D) 0%, (E) 10%. Reprinted with permission from [40]. Copyright (2008), American Chemical Society.
Catalysts 11 00018 g015
Figure 16. Arrhenius plot constructed using the production rate of H2. Reprinted with permission from [23]. Copyright (2010), American Chemical Society.
Catalysts 11 00018 g016
Figure 17. Illustrated material fabricated by Shi et al. Reprinted from [33], Copyright (2004), with permission from Elsevier.
Catalysts 11 00018 g017
Figure 18. CO generation from a DRM reaction at 700 °C under UV light irradiation (On) and a dark condition (Off) using various metal oxide catalysts. Reprinted from [43] with permission from The Chemical Society of Japan.
Catalysts 11 00018 g018
Figure 19. Schematic diagram of the band structure of each catalyst and CO production mechanism during a photocatalytic DRM reaction. Reprinted from [43] with permission from The Chemical Society of Japan.
Catalysts 11 00018 g019
Figure 20. (A) Phosphorescence exciting spectra of MgO. (B) Time course of the CO yield and CH4 consumption over MgO. Reprinted with permission from [44]. Copyright (2004), American Chemical Society.
Catalysts 11 00018 g020
Figure 21. Photocatalytic activity of UV light-irradiated Rh/SrTiO3. The reaction was DRM. Reprinted from [30]. STO: SrTiO3.
Catalysts 11 00018 g021
Figure 22. Effect of Ti3AlC2 loading on the performance of TiO2 for photocatalytic dry reforming of methane. Copyright (2020), reprinted from [36] with permission from Elsevier.
Catalysts 11 00018 g022
Figure 23. Illustration of the photocatalyst used by Pan et al. Copyright (2020), reprinted from [46] with permission from Elsevier.
Catalysts 11 00018 g023
Figure 24. Photocatalytic activity of the material that is described in Figure 24 and the references. (a) H2 and (b) CO production rates at 600 °C in the dark and light irradiated condition. Molar ratio optimization of Zn-Ce is shown in (c), and the time of ALD cycles optimization is shown in (d). Copyright (2020), reprinted from [46] with permission from Elsevier. ALD: atomic layer deposition.
Catalysts 11 00018 g024
Figure 25. Stability test of DRM using the material described in Figure 23 and the references. The production rates of (a) H2 and (b) CO. Copyright (2020), reprinted from [46] with permission from Elsevier.
Catalysts 11 00018 g025
Figure 26. XPS profiles of (a) Pt/CeO2, (b) Pt/Zn-CeO2, and (c) MgO/Pt/Zn-CeO2. Each sample has spent data under dark light conditions and as a prepared sample. The ratio of Ce3+/(Ce3+ + Ce4+) was calculated from the data. Copyright (2020), reprinted from [46] with permission from Elsevier.
Catalysts 11 00018 g026
Figure 27. Catalytic activity under dark conditions, photocatalytic activity under visible light irradiated conditions, and thermodynamical limit calculated using the equilibrium [7]. Reproduced from [22] with permission from The Royal Society of Chemistry.
Catalysts 11 00018 g027
Figure 28. Yield of carbon monoxide and ethane under montmorillonite (MMT)-modified TiO2 performing photocatalytic methane reforming. Copyright (2015), reprinted from [32] with permission from Elsevier.
Catalysts 11 00018 g028
Figure 29. Yield of (a) CO and H2 and (b) higher hydrocarbons using Cu/g-C3N4. Copyright (2017), reprinted from [48] with permission from Elsevier.
Catalysts 11 00018 g029
Figure 30. Yield of (A) H2 and (B) CO for DRM using Pt/black TiO2 under AM 1.5G (the global standard spectrum), visible light, and dark conditions, and (C) H2 and (D) CO using Pt/Al2O3 as a reference. Reprinted with permission from [50]. Copyright (2015), American Chemical Society.
Catalysts 11 00018 g030
Figure 31. Band structure of TiO2, black TiO2, and various redox potentials at 25, 150, and 600 °C. Reprinted with permission from [50]. Copyright (2015), American Chemical Society.
Catalysts 11 00018 g031
Figure 32. Comparison of activity under light irradiation conditions (surface temperature = 316 °C, operating temperature = 210 °C) vs. dark condition (surface temperature = operating temperature = 316 °C). Reproduced from [22] with permission from The Royal Society of Chemistry.
Catalysts 11 00018 g032
Figure 33. Electron spin resonance (ESR) spectra of (a) SrTiO3 under N2; (b) Rh/SrTiO3 under N2; (c) Rh/SrTiO3 under UV N2, CO2, and CO2 + CH4. Reprinted from [30].
Catalysts 11 00018 g033
Figure 34. Sole gas experiment performed using Rh/SrTiO3. First, (a) methane only; then, (b) a mixture of methane and carbon dioxide; finally, (c) methane again. Reprinted from [30].
Catalysts 11 00018 g034
Figure 35. Yield of C18O after exchanging surface oxygen with (a) H216O and (b) H218O. Reprinted from [30].
Catalysts 11 00018 g035
Figure 36. Speculated mechanism of photocatalytic DRM using Rh/SrTiO3. Reprinted from [30].
Catalysts 11 00018 g036
Figure 37. Gas-phase photoelectron chemical (GPEC) system. Reprinted from [52]. Copyright 2020 by John Wiley & Sons, Inc. YSZ: yttria-stabilized zirconia.
Catalysts 11 00018 g037
Figure 38. (a) Result of the open-circuit voltage measured under an Ar flow into the anodic and cathodic sides with the light on and off. The feed gas was changed to CH4 into the anodic side and CO2 into the cathodic side at 370 nm. (b,c) The expanded view of (a). Reprinted from [52]. Copyright 2020 by John Wiley & Sons, Inc.
Catalysts 11 00018 g038
Figure 39. Products obtained in (a) the anodic side and (b) the cathodic side. The feed gas was CH4 into the anodic side and CO2 into the cathodic side. The reaction temperature was 600 °C and UV light was irradiated onto both sides. Reprinted from [52]. Copyright 2020 by John Wiley & Sons, Inc.
Catalysts 11 00018 g039
Figure 40. Voltage change due to light irradiation onto the cathodic side only, anodic side only, and both sides. Reprinted from [52]. Copyright 2020 by John Wiley & Sons, Inc.
Catalysts 11 00018 g040
Figure 41. Speculated mechanism illustrated from the obtained results. Reprinted from [52]. Copyright 2020 by John Wiley & Sons, Inc.
Catalysts 11 00018 g041
Figure 42. Yield of CO2 and methanol using (A) vanadium-containing mesoporous silica (V-MCM-41) (acid) and (B) V-MCM 41 (base) with different oxidants. The amount of V was 0.6%, the reaction temperature was 295 K, and the reaction time was 3 h. Reprinted with permission from [56]. Copyright (2008), Springer Nature.
Catalysts 11 00018 g042
Figure 43. Yields of (a) methanol, (b) ethane, and (c) CO2 using various oxidants and WO3 as a photocatalyst. Copyright (2015), reprinted from [57] with permission from Elsevier.
Catalysts 11 00018 g043
Figure 44. Production rate of methanol, ethane, and CO2 by BiVO4 at 30 and 90 min. Reproduced from [55] with permission from The Royal Society of Chemistry.
Catalysts 11 00018 g044
Figure 45. (a) Comparison of methane conversion and ethane selectivity using TiO2-SiO2 (HTS), Ga doped TiO2-SiO2 (HGTS), Pt/HTS, and Pt/HGTS. (b) Methane conversion, ethane, propane, and hydrogen yield performing non-oxidative coupling of methane (NOCM) using Pt/HGTS (2%). The lamp used was a 300 W Xe lamp that irradiated for 32 h. Reprinted with permission from [61]. Copyright (2019), American Chemical Society.
Catalysts 11 00018 g045
Figure 46. Total yield of hydrocarbons using 0.1 and 0.2% of various metals loaded on SiO2. Reprinted with permission from [62]. Copyright (2008), American Chemical Society.
Catalysts 11 00018 g046
Figure 47. Time course of the production rate of ethane and H2. Reproduced from [28] with permission from The Royal Society of Chemistry.
Catalysts 11 00018 g047
Figure 48. DFT calculation of the free energy of the carbanion pathway and the carbocation pathway. Reproduced from [28] with permission from The Royal Society of Chemistry. DFT: Density function theory.
Catalysts 11 00018 g048
Figure 49. Mechanism of photocatalytic NOCM over Au/TiO2 in a CH3 anion process. Reproduced from [28] with permission from The Royal Society of Chemistry.
Catalysts 11 00018 g049
Figure 50. Excited carriers’ pathway in the hot carrier mechanism.
Catalysts 11 00018 g050
Figure 51. (a) UV-vis spectra of Sr2Ta2O7 and Pd/Sr2Ta2O7 and the quantum efficiency of methane, carbon monoxide at 423 and 623 K. (b) Conversion of methane and yield of carbon monoxide using various long-wavelength cutoff filters. The horizontal axis is irradiation power density with each cutoff filter. Reprinted from [70]. Copyright (2019) by John Wiley & Sons, Inc.
Catalysts 11 00018 g051
Figure 52. Action spectra of (a) Rh/MCM at 423 K and (b) Pd/MCM at 523 K in the wavelength range from 250 to 400 nm. Reproduced from [71] with permission from The Royal Society of Chemistry.
Catalysts 11 00018 g052
Figure 53. Contribution of thermal and nonthermal effects over various metal-loaded MCM-41’s. Reproduced from [71] with permission from The Royal Society of Chemistry.
Catalysts 11 00018 g053
Figure 54. (a) Production rate of H2 with and without visible light. (b) Action spectrum and UV-vis spectrum of Rh/TiO2. (c) Arrhenius plot constructed using the production rate. Reprinted with permission from [72]. Copyright (2018), American Chemical Society.
Catalysts 11 00018 g054
Figure 55. Overlay of the absorbance of Rh/TaON and the surface temperatures of Rh/TaON and Rh/Al2O3. Reproduced from [22] with permission from The Royal Society of Chemistry.
Catalysts 11 00018 g055
Figure 56. Production rate of (a) H2 and (b) CO over MgO/Pt/Zn-CeO2 under light irradiation and dark conditions. Copyright (2020), reprinted from [46] with permission from Elsevier.
Catalysts 11 00018 g056
Figure 57. Temperature dependence of the UV-vis absorption spectra for various semiconductors. Reprinted from [73] with permission of AIP Publishing.
Catalysts 11 00018 g057
Figure 58. (a) Relationship between the bandgap values and temperature for various semiconductors. (b) The relationship between the slope obtained in (a) and the metal–oxygen (M-O) ion distance. Reprinted from [73] with permission of AIP Publishing.
Catalysts 11 00018 g058
Table 1. H2 yield (%) over visible-light-sensitive catalysts with and without visible light irradiation at 450 °C. N.D. = not detected. Reproduced from [22] with permission from The Royal Society of Chemistry.
LightCdSBi2S3TaONTa3N5Rh-Dope SrTiO3g-C3N4Bi2WO6MgFe2O4ZnFe2O4CaFe2O4
OFFN.D.N.D.N.D.N.D.N.D.N.D.1.60.1N.D.N.D.
ON1.20.2N.D.N.D.N.D.0.2N.D.N.D.N.D.N.D.
LightCu2ORh/Bi2WO6Ru/ZnFe2O4Ru/CaFe2O4Rh/Cu2ORh/g-C3N4Rh/TaONRh/Ta3N5Thermal Catalyst Limit
OFFN.D.N.D.N.D.N.D.N.D.N.D.15.622.836.3
ON0.6N.D.2.22.4N.D.0.150.333.6-
Table 2. Comparison of H2 production rate using Pt-loaded and unloaded TiO2. Reprinted with permission from [40]. Copyright (2008), American Chemical Society.
EntryCatalystFeed Gas aH2 Production Rate b (μmol min−1)
1TiO2H2On.d.
2-CH4n.d.
3-H2O+CH40.004
4PtM(0.1)/TiO2H2On.d.
5-CH40.063 c
6-H2O+CH40.76 d
a Feed gas composition was 50% for CH4 and 1.6% for H2O with an Ar carrier. Total flow rate was 30 mL min−1. b H2 production rate was the value after 6 h upon photoirradiation when it became almost constant. n.d.: not detected. c C2H6 (0.031 µmol min−1) was also produced. d CO2 (0.18 µmol min−1), C2H6 (0.014 µmol min−1), and CO (ca. 0.003 µmol min−1) were also produced.
Table 3. Result of photocatalytic reaction over various samples. Reprinted with permission from [23]. Copyright (2010), American Chemical Society.
EntryPhotocatalystSBET a (m2 g−1)D b (nm)Production Rate (μmol min−1)
Feed GasH2OH2O + CH4
ProductH2H2CO2
1NaTaO3:LaC(2%) c3.650-0.080.21- d
2NaTaO3:LaBM(2%) c1.962-0.120.29- d
3Pt(0.1)/NaTaO3:LaC(2%) c,e---0.001.50.39
4Pt(0.05)/NaTaO3:LaBM(2%) c,e----1.80.46
5NiO(0.2)/NaTaO3:LaC(2%) c---0.160.18- f
6Pt(0.1)/TiO2 c,g335--0.000.760.18
7NaTaO3BM c0.6758--0.06- f
8KTaO3BM c1.558--0.04- f
9LiTaO3BM c0.4857--0.02- f
10Pt(0.01)KTaO3:LaBM(2%) c,h5.158--0.28- d
11Pt(0.03)/NaTaO3:LaBM(2%) e,i---0.004.51.2
a BET specific surface area. b Crystallite diameter calculated from X-ray diffraction line at 22.8° for NaTaO3, 31.7° for KTaO3 and 23.8° for LiTaO3, respectively. c The light intensity measured in the range of 230–280 nm was 14 mW cm−2. The feed gas was H2O (1.5%) or a mixture of H2O (1.5%) and CH4 (50%) with an Ar carrier. The total flow rate was 50 mL min−1. The amount of the catalyst used for filling up the reaction cell was 0.6 g for Pt/TiO2 and 1.0 g for others. In the latter case, the catalyst was diluted with quartz granules (0.8 g). d A trace amount of CO2 was produced, which was lower than 0.08 µmol min−1. e Pt was loaded by impregnation method using Pt(NO2)2(NH3)2 precursor followed by calcination and H2 reduction at 773 K. f CO2 was not detected. g Pt/TiO2 was prepared from TiO2 (JRC-TIO-8) and an aqueous H2PtCl6 solution with 50% methanol by photodeposition method. h Pt was loaded by impregnation method using Pt(NO2)2(NH3)2 precursor followed by calcination at 773 K and H2 reduction at 573 K. i The light intensity measured in the range of 230–280 nm was 116 mW cm−2. The feed gas was H2O (1.0%) or a mixture of H2O (1.0%) and CH4 (10%) with an Ar carrier. The total flow rate was 50 mL min−1. The catalyst (1.0 g) was diluted with quartz granules (0.8 g).
Table 4. Photocatalytic conversion of methane and carbon dioxide over the catalyst in Figure 17. Reprinted from [33], Copyright (2004), with permission from Elsevier.
Temperature (°C)Conversion (%)Selectivity (%)
CO2CH4CH3COOHCH3CH3CH3COCH3CO
3000----
800.070.11-46.7053.3
1200.741.47Trace3.192.34.6
1500.791.54Trace7.587.64.9
Reaction conditions = 1 atm, CO2/CH4 = 1/1 (molar ratio), UV intensity = 20.0 mW cm−2, space velocity = 200 h−1.
Table 5. Performance of Ni/MMT-modified TiO2 with various loading amounts and references. Copyright (2019), reprinted from [35] with permission from Elsevier. CPSI stands for channels per square inch.
CatalystYield Rate a (μmol g-cat−1 h−1)
COCH4
TiO2190.74
5% MMT/TiO2261.01
10% MMT/TiO2511.06
15% MMT/TiO2421.06
1% Ni-10% MMT/TiO222363.69
3% Ni-10% MMT/TiO238135.58
5% Ni-10% MMT/TiO229584.56
a T = 100 °C, Irradiation time = 2 h, CO2/H2 feed ratio = 1.0, Flow rate = 20 mL/ min, CPSI = 100.
Publisher’s Note: MDPI stays neutral with regard to jurisdictional claims in published maps and institutional affiliations.

