Effect of Oxide Supports on the Activity of Pd Based Catalysts for Furfural Hydrogenation


Abstract
1. Introduction
2. Results and Discussion
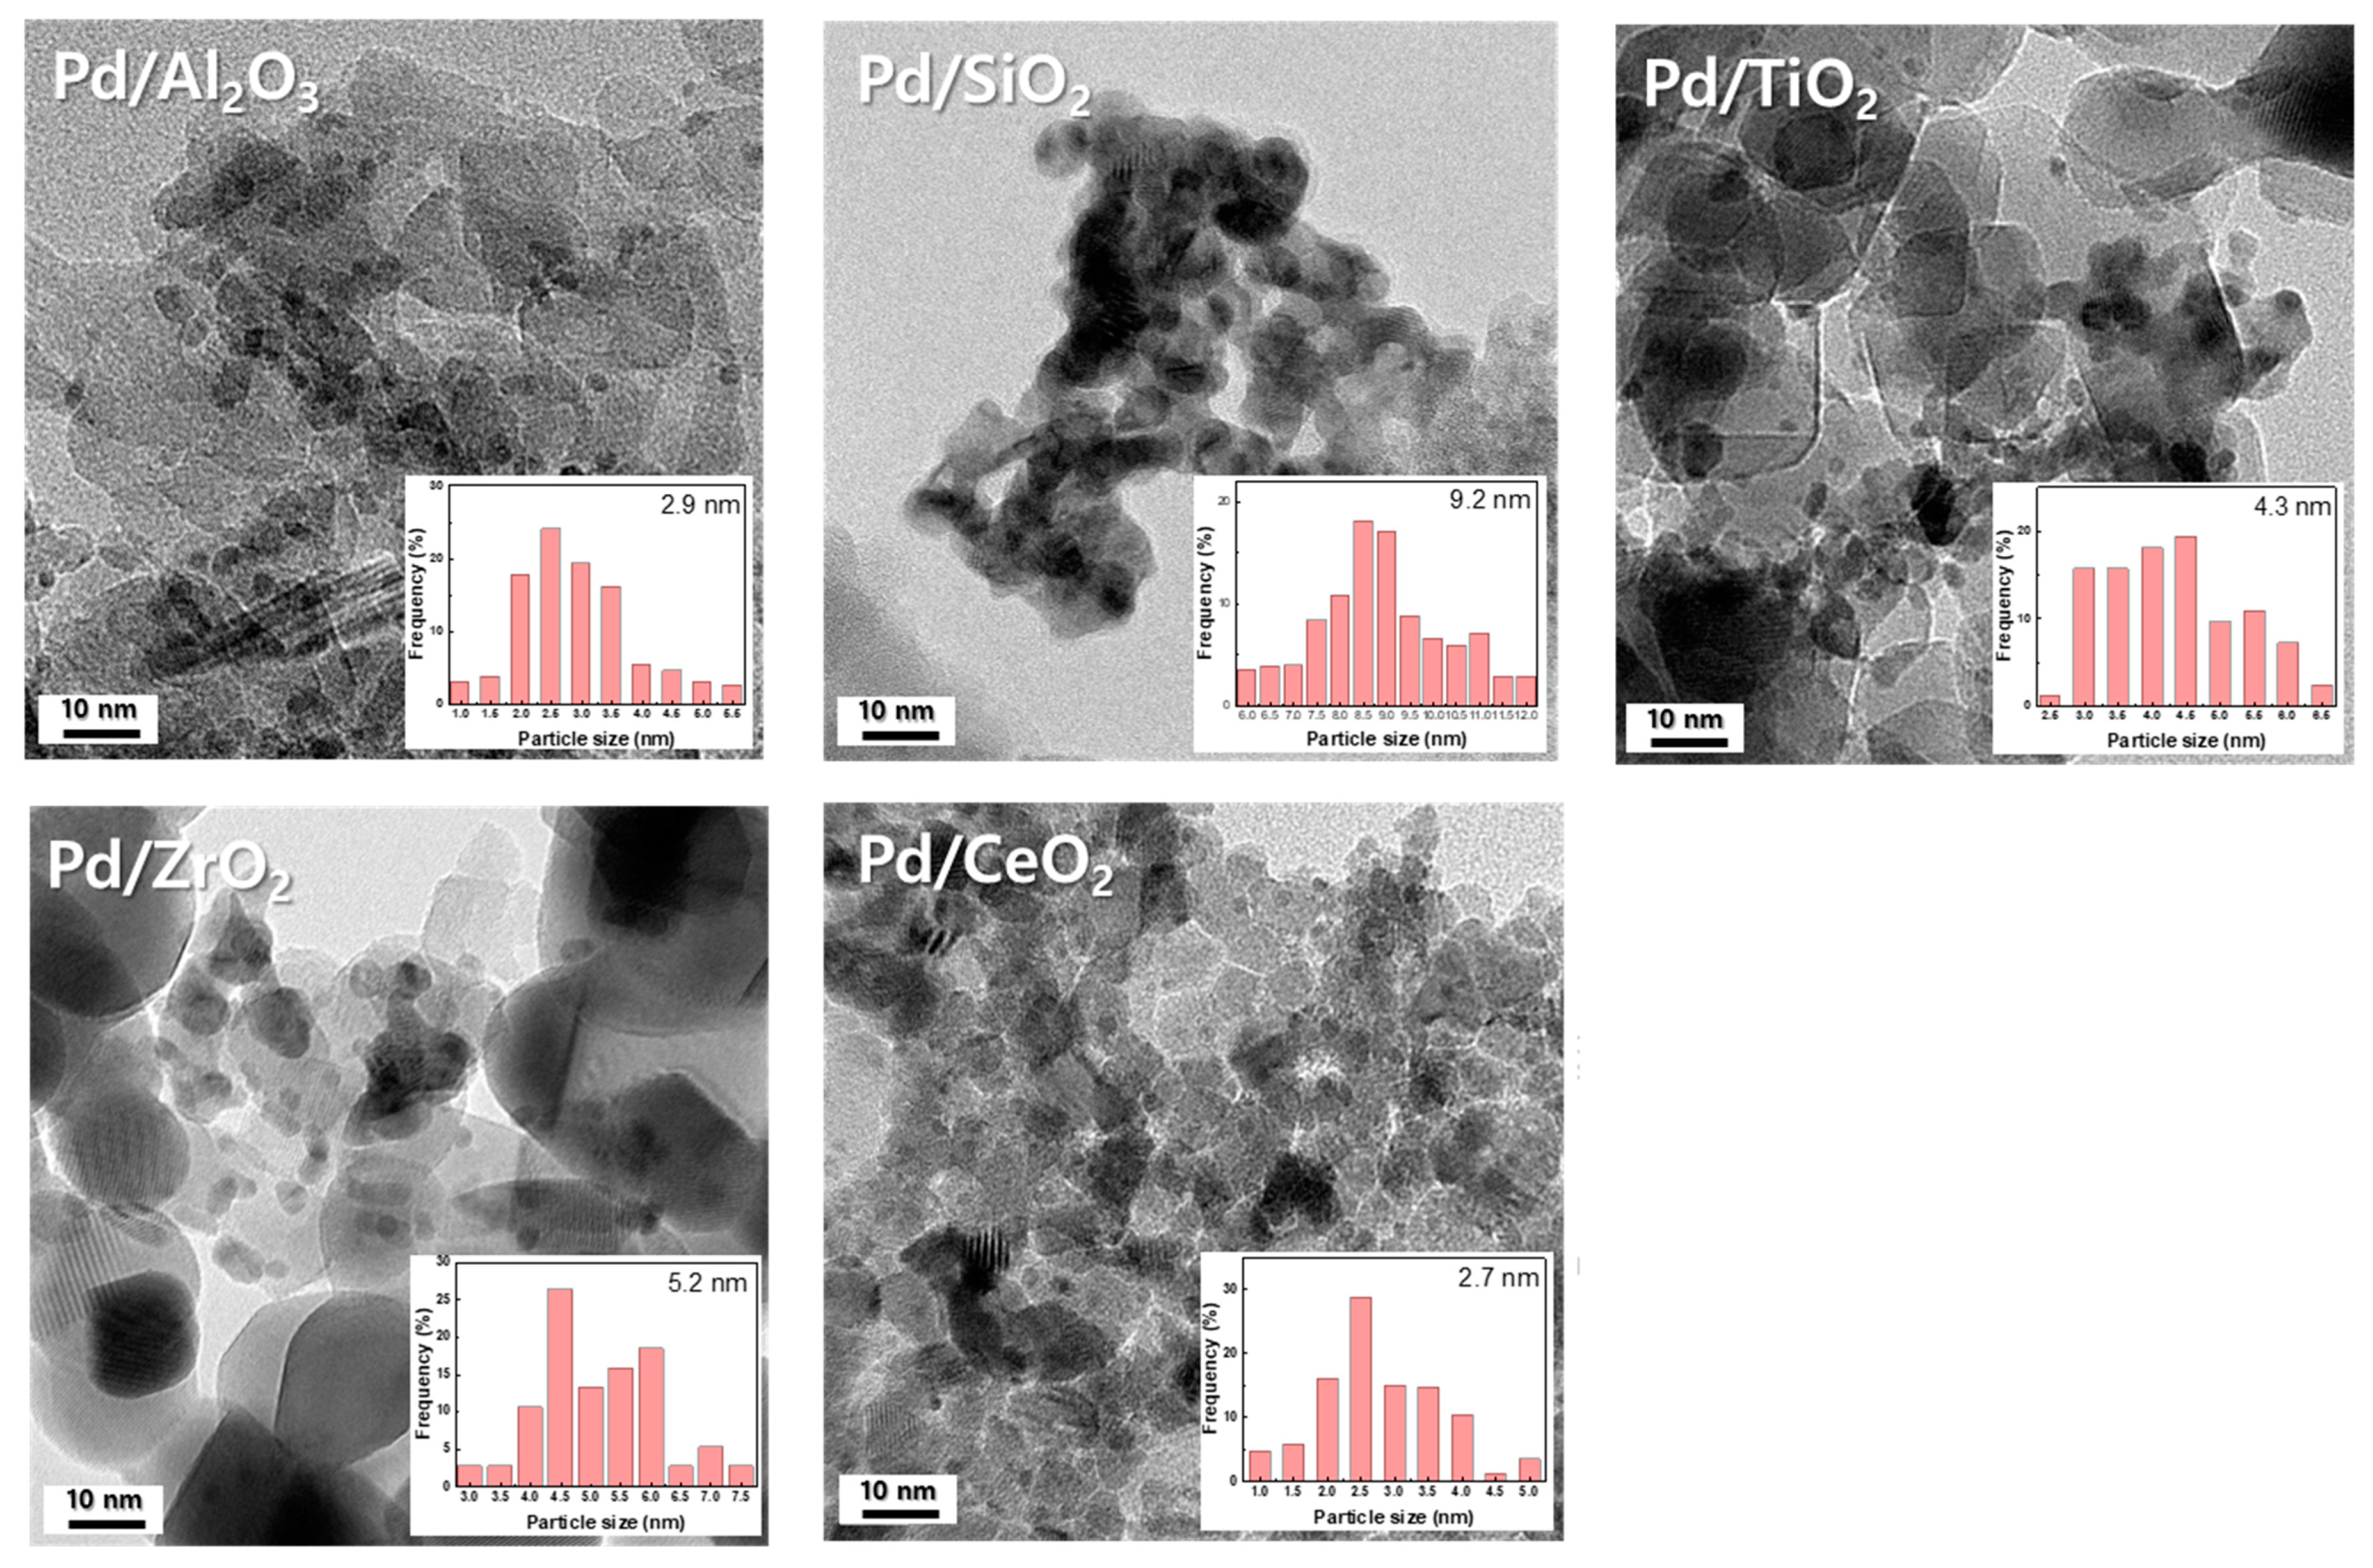
2.1. Characterization of Supports and Pd Catalysts
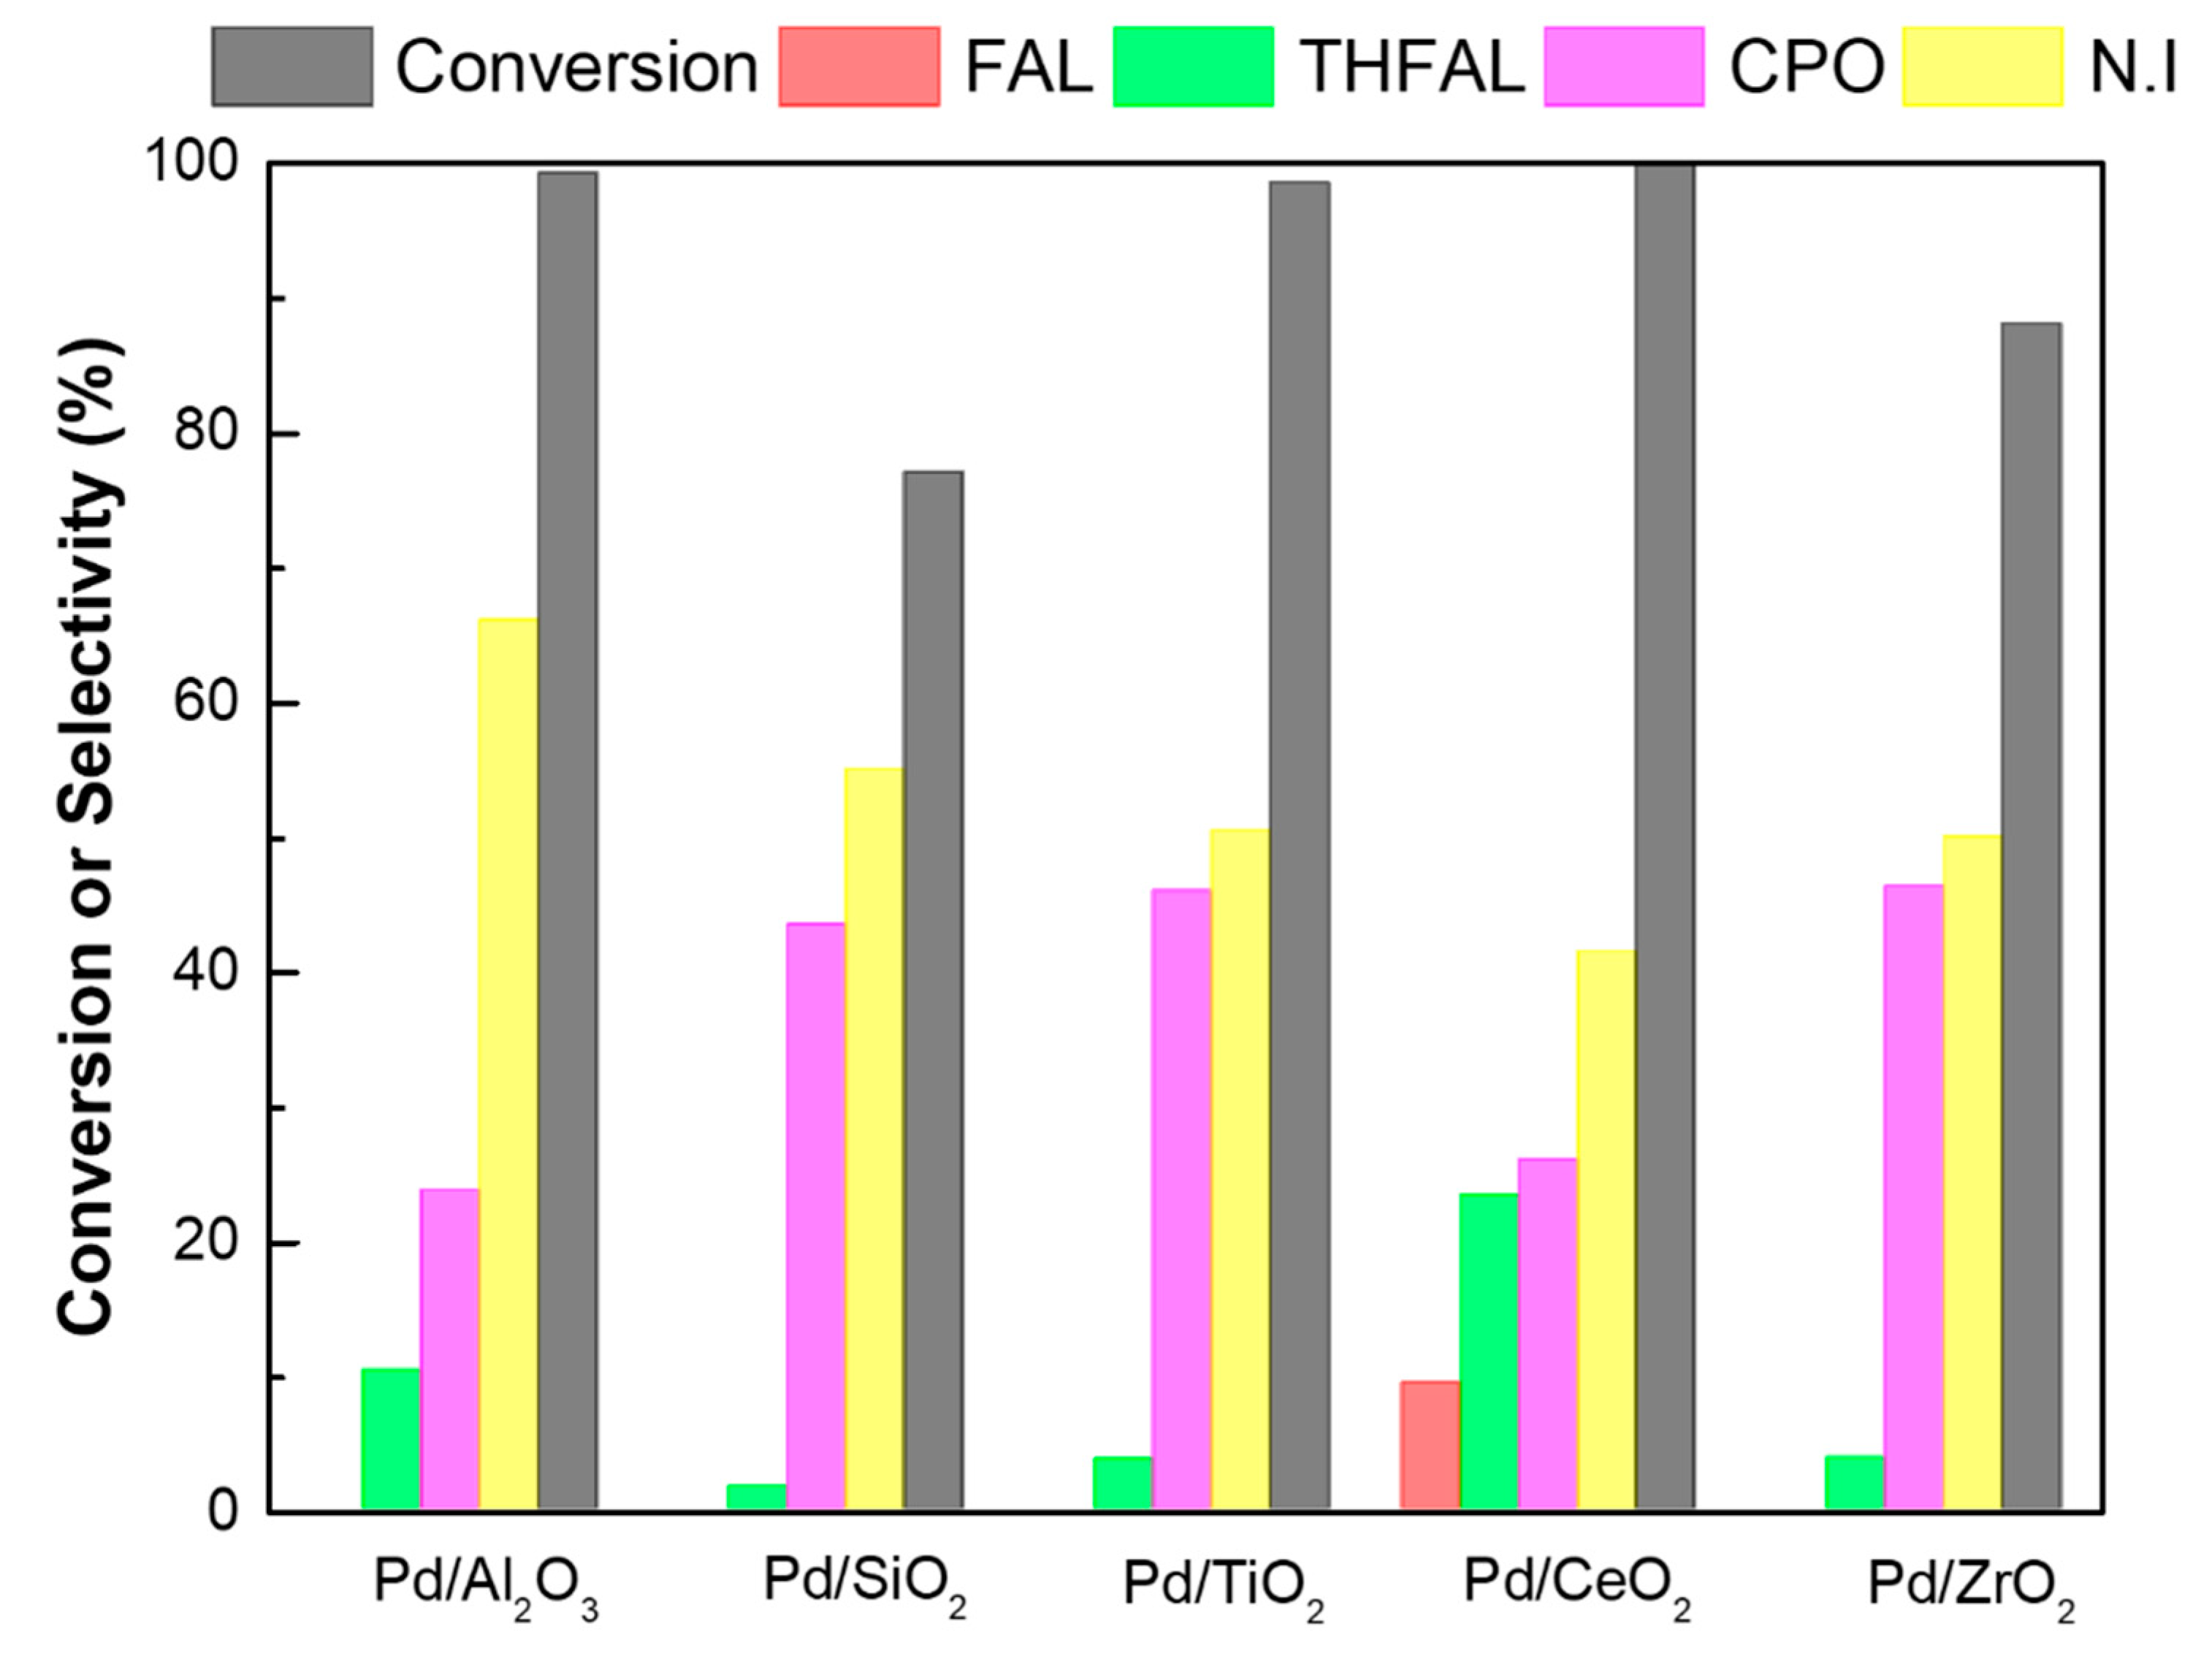
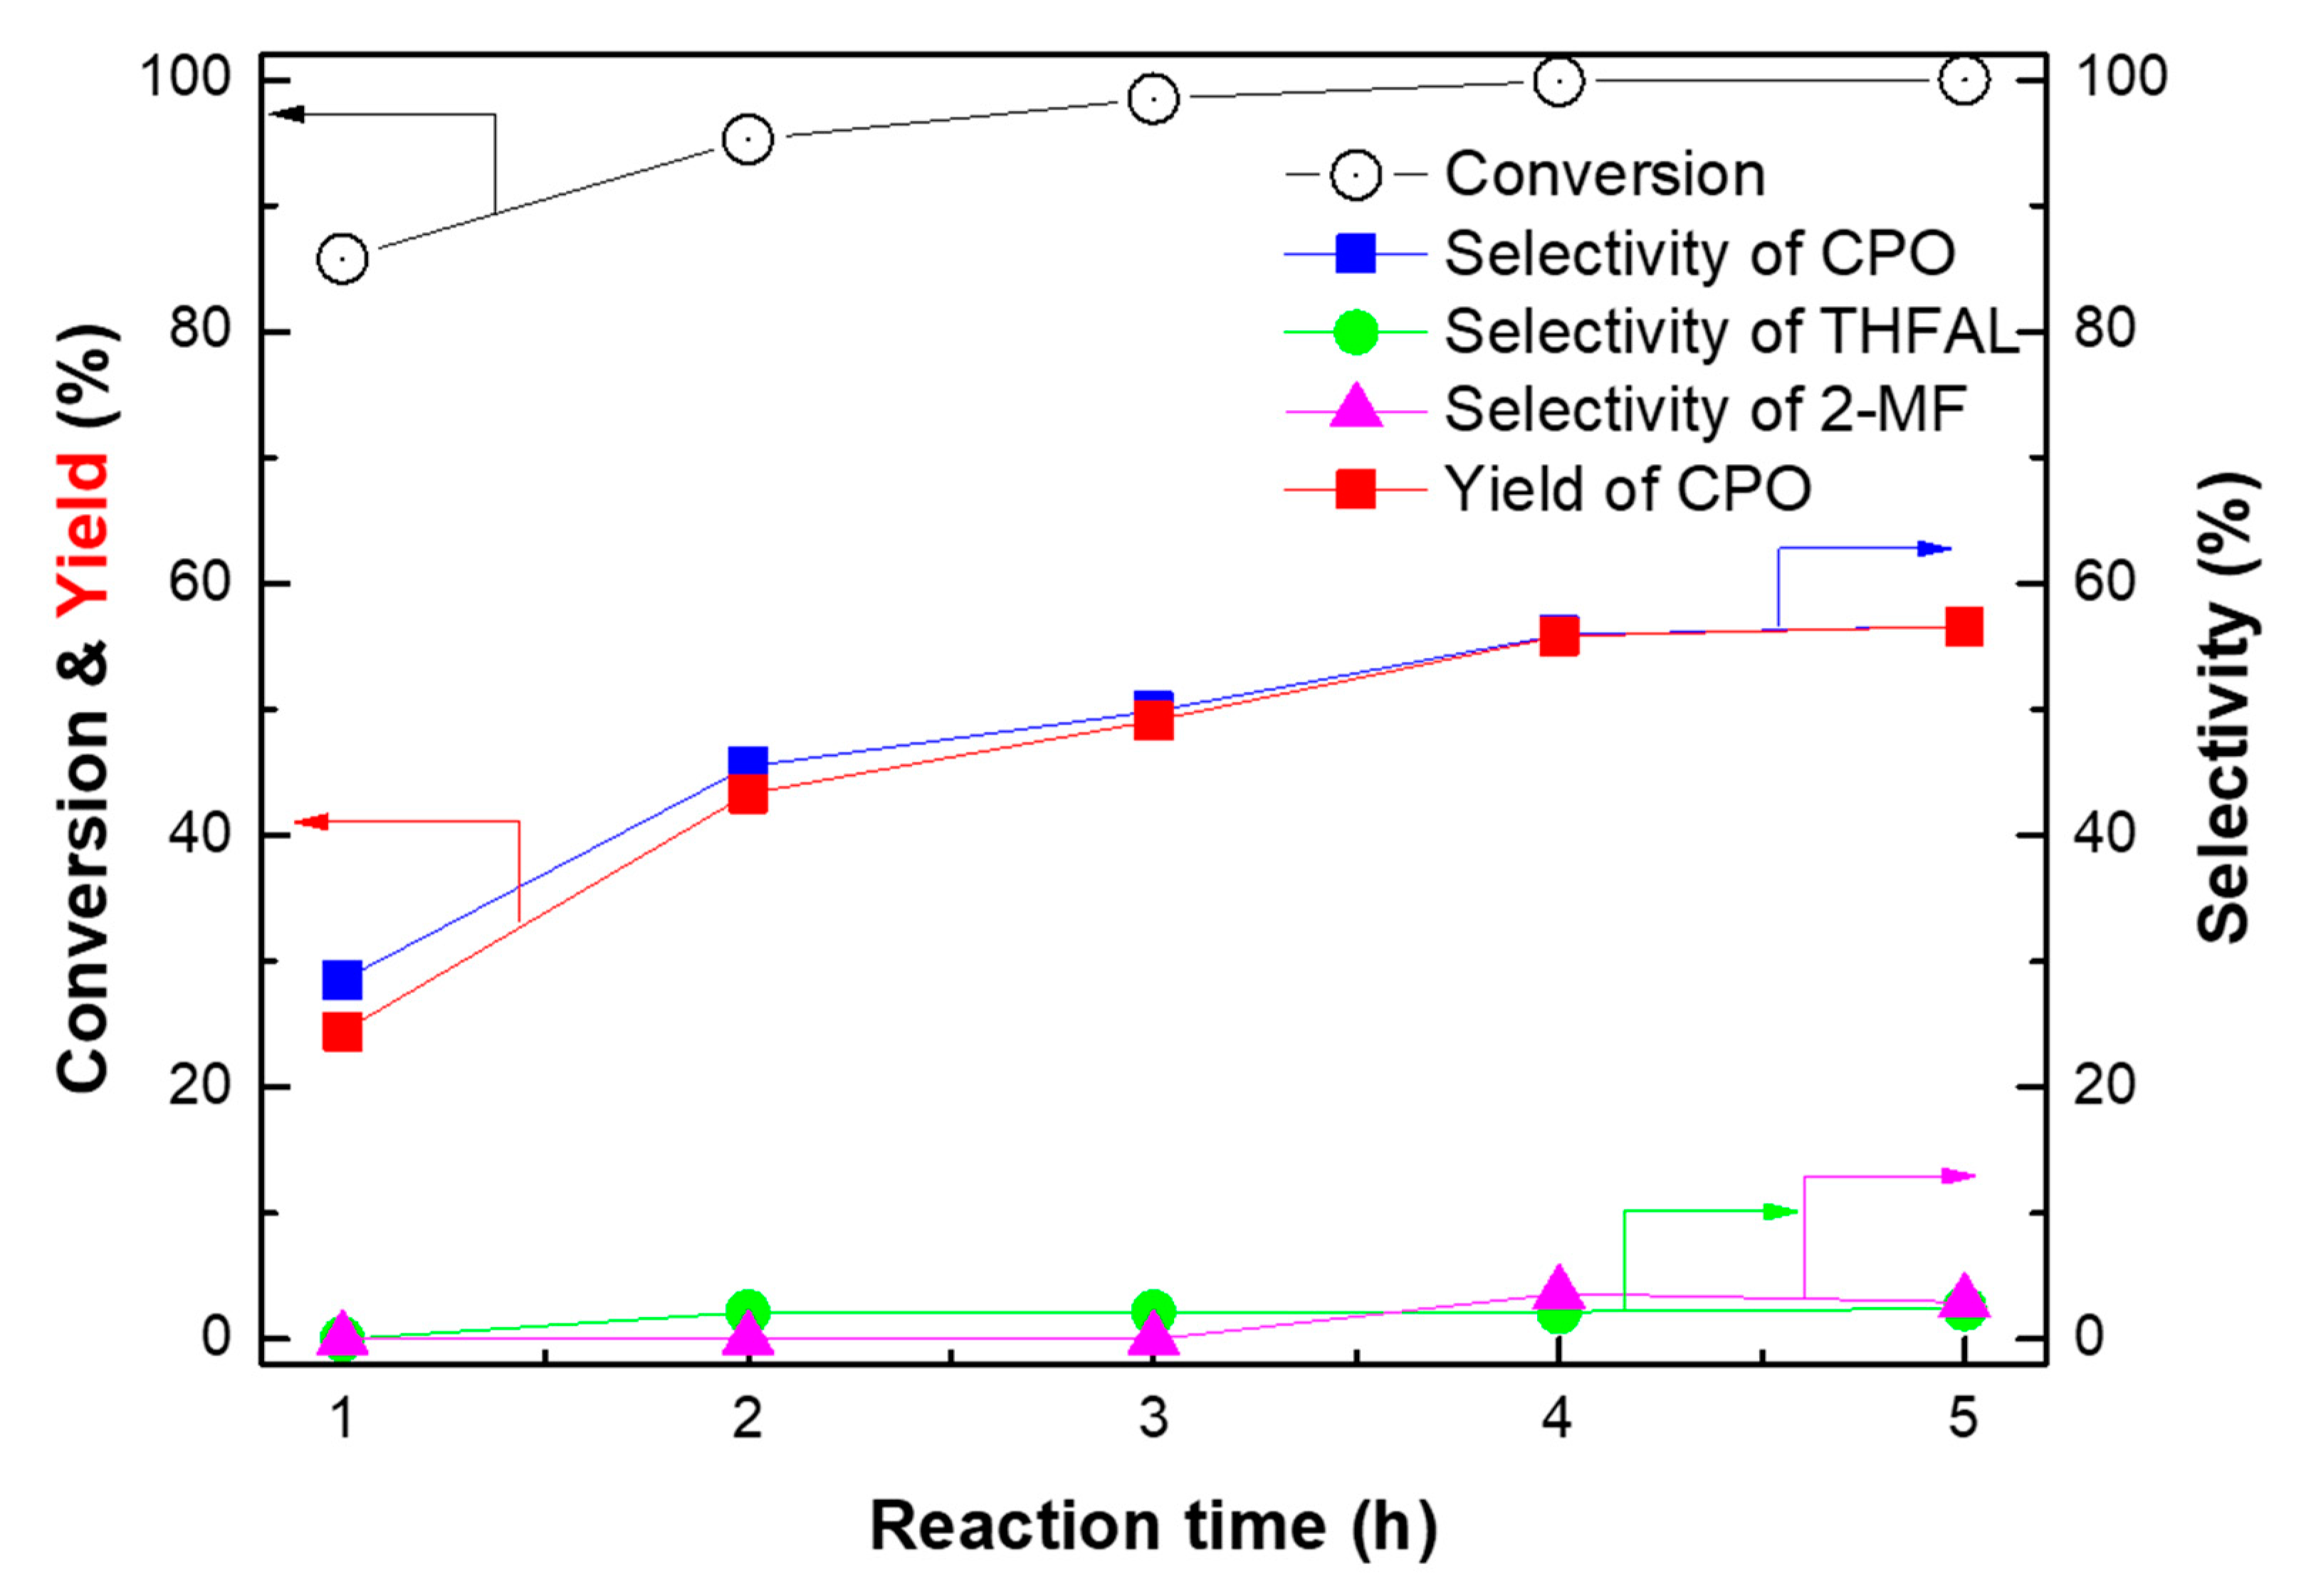
2.2. Hydrogenation of Furfural
3. Experimental
3.1. Preparation of Pd Catalysts
3.2. Characterization of Supports and Pd Catalysts
3.3. Hydrogenation of Furfural
4. Conclusions
Author Contributions
Funding
Conflicts of Interest
Abbreviations
References
- Hronec, M.; Fulajtárova, K.; Soták, T. Highly Selective Rearrangement of Furfuryl Alcohol to Cyclopentanone. Appl. Catal. B Environ. 2014, 154-155, 294–300. [Google Scholar] [CrossRef]
- Jiménez-Gómez, C.P.; Cecilia, J.A.; Márquez-Rodríguez, I.; Moreno-Tost, R.; Santamaría-González, J.; Mérida-Robles, J.; Maireles-Torres, P. Gas-Phase Hydrogenation of Furfural over Cu/CeO2 Catalysts. Catal. Today 2017, 279, 327–338. [Google Scholar] [CrossRef]
- Alonso, D.M.; Bond, J.Q.; Dumesic, J.A. Catalytic Conversion of Biomass to Biofuels. Green Chem. 2010, 12, 1493–1513. [Google Scholar] [CrossRef]
- Wang, Y.; Zhao, D.; Rodríguez-Padrón, D.; Len, C. Recent Advances in Catalytic Hydrogenation of Furfural. Catalysts 2019, 9, 796. [Google Scholar] [CrossRef]
- Zhou, M.; Li, J.; Wang, K.; Xia, H.; Xu, J.; Jiang, J. Selective Conversion of Furfural to Cyclopentanone over CNT-Supported Cu Based Catalysts: Model Reaction for Upgrading of Bio-Oil. Fuel 2017, 202, 1–11. [Google Scholar] [CrossRef]
- Ma, Y.-F.; Wang, H.; Xu, G.-Y.; Liu, X.-H.; Zhang, Y.; Fu, Y. Selective Conversion of Furfural to Cyclopentanol over Cobalt Catalysts in One Step. Chin. Chem. Lett. 2017, 28, 1153–1158. [Google Scholar] [CrossRef]
- Guo, J.; Xu, G.; Han, Z.; Zhang, Y.; Fu, Y.; Guo, Q. Selective Conversion of Furfural to Cyclopentanone with CuZnAl Catalysts. ACS Sustain. Chem. Eng. 2014, 2, 2259–2266. [Google Scholar] [CrossRef]
- Shen, T.; Hu, R.; Zhu, C.; Li, M.; Zhuang, W. Production of Cyclopentanone from Furfural over Ru/C with Al11.3PO23.7 and Application in the Synthesis of Diesel Range Alkanes. RSC Adv. 2018, 8, 37993–38001. [Google Scholar] [CrossRef]
- Albilali, R.; Douthwaite, M.; He, Q.; Taylor, S.H. The Selective Hydrogenation of Furfural over Supported Palladium Nanoparticle Catalysts Prepared by Sol-Immobilisation: Effect of Catalyst Support and Reaction Conditions. Catal. Sci. Technol. 2018, 8, 252–267. [Google Scholar] [CrossRef]
- Li, C.; Xu, G.; Liu, X.; Zhang, Y.; Fu, Y. Hydrogenation of Biomass-Derived Furfural to Tetrahydrofurfuryl Alcohol over Hydroxyapatite-Supported Pd Catalyst under Mild Conditions. Ind. Eng. Chem. Res. 2017, 56, 8843–8849. [Google Scholar] [CrossRef]
- Bhogeswararao, S.; Srinivas, D. Catalytic Conversion of Furfural to Industrial Chemicals over Supported Pt and Pd Catalysts. J. Catal. 2015, 327, 65–77. [Google Scholar] [CrossRef]
- Clair, B.; Yamamoto, H.; Chang, S.-S.; Di Renzo, F.; Zhao, G.-J.; Ruelle, J.; Beauchene, J.; Quignard, F.; Gril, J. Mesoporosity as a New Parameter for Understanding Tension Stress Generation in Trees. J. Exp. Bot. 2009, 60, 3023–3030. [Google Scholar]
- Qi, B.; Di, L.; Xu, W.; Zhang, X. Dry Plasma Reduction to Prepare a High Performance Pd/C Catalyst at Atmospheric Pressure for CO Oxidation. J. Mater. Chem. A 2014, 2, 11885–11890. [Google Scholar] [CrossRef]
- Jiang, H.; Yu, X.; Nie, R.; Lu, X.; Zhou, D.; Xia, Q. Selective Hydrogenation of Aromatic Carboxylic Acids over Basic N-Doped Mesoporous Carbon Supported Palladium Catalysts. Appl. Catal. A Gen. 2016, 520, 73–81. [Google Scholar] [CrossRef]
- Zheng, Q.; Farrauto, R.; Deeba, M. Part II: Oxidative Thermal Aging of Pd/Al2O3 and Pd/CexOy-ZrO2 in Automotive Three Way Catalysts: The Effects of Fuel Shutoff and Attempted Fuel Rich Regeneration. Catalysts 2015, 5, 1797–1814. [Google Scholar] [CrossRef]
- Palma, V.; Ruocco, C.; Meloni, E.; Ricca, A. Renewable Hydrogen from Ethanol Reforming over CeO2-SiO2 Based Catalysts. Catalysts 2017, 7, 226. [Google Scholar] [CrossRef]
- Gopinath, R.; Babu, N.S.; Kumar, J.V.; Lingaiah, N.; Prasad, P.S. Influence of Pd Precursor and Method of Preparation on Hydrodechlorination Activity of Alumina Supported Palladium Catalysts. Catal. Lett. 2008, 120, 312–319. [Google Scholar] [CrossRef]
- Garcia, S.; Smith, R.; Deacon, L.; Euaruksakul, C.; Held, G. The Partial Oxidation of Methane Over Pd/Al2O3 Catalyst Nanoparticles Studied In-Situ by Near Ambient-Pressure X-ray Photoelectron Spectroscopy. Top. Catal. 2016, 59, 516–525. [Google Scholar]
- Liu, J.; Chen, Y.; Wang, H.; Yang, M.; Wu, Y.; Chen, Z. Effects of Atmosphere Pretreatment on the Catalytic Performance of Pd/Γ-Al2O3 Catalyst in Benzene Degradation II: Crystal Structure Transformation of Pd Active Species. Catal. Today 2017, 297, 211–218. [Google Scholar] [CrossRef]
- Song, S.; Sheng, Z.; Liu, Y.; Wang, H.; Wu, Z. Influences of PH Value in Deposition-Precipitation Synthesis Process on Pt-Doped TiO2 Catalysts for Photocatalytic Oxidation of NO. J. Environ. Sci. 2012, 24, 1519–1524. [Google Scholar] [CrossRef]
- Estruga, M.; Domingo, C. Dispersion and Surface Functionalization of Oxide Nanoparticles for Transparent Photocatalytic and UV-Protecting Coatings and Sunscreens. Sci. Technol. Adv. Mater. 2013, 14, 023001. [Google Scholar]
- Centeno, M.Á.; Carrizosa, I.; Odriozola, J.A. Deposition—Precipitation Method to Obtain Supported Gold Catalysts: Dependence of the Acid-Base Properties of the Support Exemplified in the System TiO2-TiOx Ny-TiN. Appl. Catal. A Gen. 2003, 246, 365–372. [Google Scholar] [CrossRef]
- Qian, K.; Fang, J.; Huang, W.; He, B.; Jiang, Z.; Ma, Y.; Wei, S. Chemical Understanding the Deposition–Precipitation Process for the Preparation of Supported Au Catalysts. J. Mol. Catal. A 2010, 320, 97–105. [Google Scholar] [CrossRef]
- Byun, M.Y.; Kim, J.S.; Park, D.-W.; Lee, M.S. Influence of Synthetic Parameters on the Particle Size and Distribution of Pd in Pd/Al2O3 Catalysts. J. Nanosci. Nanotechnol. 2018, 18, 6283–6287. [Google Scholar] [CrossRef] [PubMed]
- Kiwi, J. The Effect of Promoters on the Photochemical Water Cleavage in Suspensions of Pt-Loaded TiO2 with Increased Light to Chemical Conversion Efficiencyitle. In Homogeneous and Heterogeneous Photocatalysis; D. Reider Publishing: Boston, MA, USA, 1986; pp. 275–302. [Google Scholar]
- Wu, Z.; Overbury, S.H. Infrared Spectroscopic Insights into the Role of the Support in Heterogeneous Gold Catalysis. In Heterogeneous Gold Catalysts and Catalysis; Royal Society of Chemistry: London, UK, 2014; pp. 512–532. [Google Scholar]
- Spivey, J.J.; Roberts, G.W.; Dooley, K.M. Catalysis of Acid/Aldehyde/Alcohol Condensations to Ketones. In Catalysis; Royal Society of Chemistry: London, UK, 2004; pp. 293–319. [Google Scholar]
- Kim, T.; Assary, R.S.; Pauls, R.E.; Marshall, C.L.; Curtiss, L.A.; Stair, P.C. Thermodynamics and Reaction Pathways of Furfuryl Alcohol Oligomer Formation. Catal. Commun. 2014, 46, 66–70. [Google Scholar] [CrossRef]
- Guigo, N.; Mija, A.; Vincent, L.; Sbirrazzuoli, N. Chemorheological Analysis and Model-Free Kinetics of Acid Catalysed Furfuryl Alcohol Polymerization. Phys. Chem. Chem. Phys. 2007, 9, 5359–5366. [Google Scholar] [CrossRef]
- Lee, J.; Burt, S.P.; Carrero, C.A.; Alba-Rubio, A.C.; Ro, I.; O’Neill, B.J.; Kim, H.J.; Jackson, D.H.K.; Kuech, T.F.; Hermans, I.; et al. Stabilizing Cobalt Catalysts for Aqueous-Phase Reactions by Strong Metal-Support Interaction. J. Catal. 2015, 330, 19–27. [Google Scholar] [CrossRef]
- Dekura, S.; Kobayashi, H.; Kusada, K.; Kitagawa, H. Hydrogen in Palladium and Storage Properties of Related Nanomaterials: Size, Shape, Alloying, and Metal-Organic Framework Coating Effects. ChemPhysChem 2019, 20, 1158–1176. [Google Scholar] [CrossRef]
- Date, N.S.; Kondawar, S.E.; Chikate, R.C.; Rode, C.V. Single-Pot Reductive Rearrangement of Furfural to Cyclopentanone over Silica-Supported Pd Catalysts. ACS Omega 2018, 3, 9860–9871. [Google Scholar] [CrossRef]
- Byun, M.Y.; Kim, J.S.; Park, D.; Lee, M.S. Influence of Calcination Temperature on the Structure and Properties of Al2O3 as Support for Pd Catalyst. Korean J. Chem. Eng. 2018, 35, 1083–1088. [Google Scholar] [CrossRef]
- Zou, W.; Gonzalez, R.D. The Preparation of Silica Supported Pd Catalysts: The Effect of Pretreatment Variables on Particle Size. Catal. Lett. 1992, 12, 73–86. [Google Scholar] [CrossRef]
- Sangeetha, P.; Shanthi, K.; Rao, K.S.R.; Viswanathan, B.; Selvam, P. Hydrogenation of Nitrobenzene over Palladium-Supported Catalysts-Effect of Support. Appl. Catal. A Gen. 2009, 353, 160–165. [Google Scholar] [CrossRef]
- Ertl, G.; Knozinger, H.; Weitkamp, J. (Eds.) Characterization of Solid Catalysts. In Handbook of Heterogeneus Catalysis; Wiley: Hoboken, NJ, USA, 1997; Volume 438, pp. 427–582. [Google Scholar]
- Nguyen-Huy, C.; Kim, J.S.; Yoon, S.; Yang, E.; Kwak, J.H.; Lee, M.S.; An, K. Supported Pd Nanoparticle Catalysts with High Activities and Selectivities in Liquid-Phase Furfural Hydrogenation. Fuel 2018, 226, 607–617. [Google Scholar] [CrossRef]


| Samples | SBET (m2/g) | VTotal (cm3/g) | Pore Diameter (nm) | Acid Site Density (mmol/g) a | ||
|---|---|---|---|---|---|---|
| Weak | Medium and Strong | Total | ||||
| Al2O3 | 135 | 0.73 | 20.3 | - | - | - |
| SiO2 | 170 | 0.33 | 11.2 | - | - | - |
| TiO2 | 51 | 0.15 | 12.5 | - | - | - |
| CeO2 | 69 | 0.16 | 8.4 | - | - | - |
| ZrO2 | 35 | 0.19 | 21.8 | - | - | - |
| Pd/Al2O3 | 150 | 0.75 | 19.2 | 0.278 | 0.435 | 0.713 |
| Pd/SiO2 | 161 | 0.84 | 25.7 | 0.134 | 0.149 | 0.283 |
| Pd/TiO2 | 43 | 0.34 | 29.2 | 0.150 | 0.131 | 0.281 |
| Pd/CeO2 | 73 | 0.20 | 10.1 | 0.337 | 0.252 | 0.589 |
| Pd/ZrO2 | 34 | 0.22 | 24.4 | 0.163 | 0.164 | 0.327 |
| Catalysts | Pt Contents a | Metal Dispersion (%) | Metallic Surface Area (m2/g) c | Binding Energy of Pd 3d5/2 (eV) d | Atomic Ratios d | ||
|---|---|---|---|---|---|---|---|
| CO Chemisorption | FE-TEM b | Pd2+ | Pd0 | Pd/Support | |||
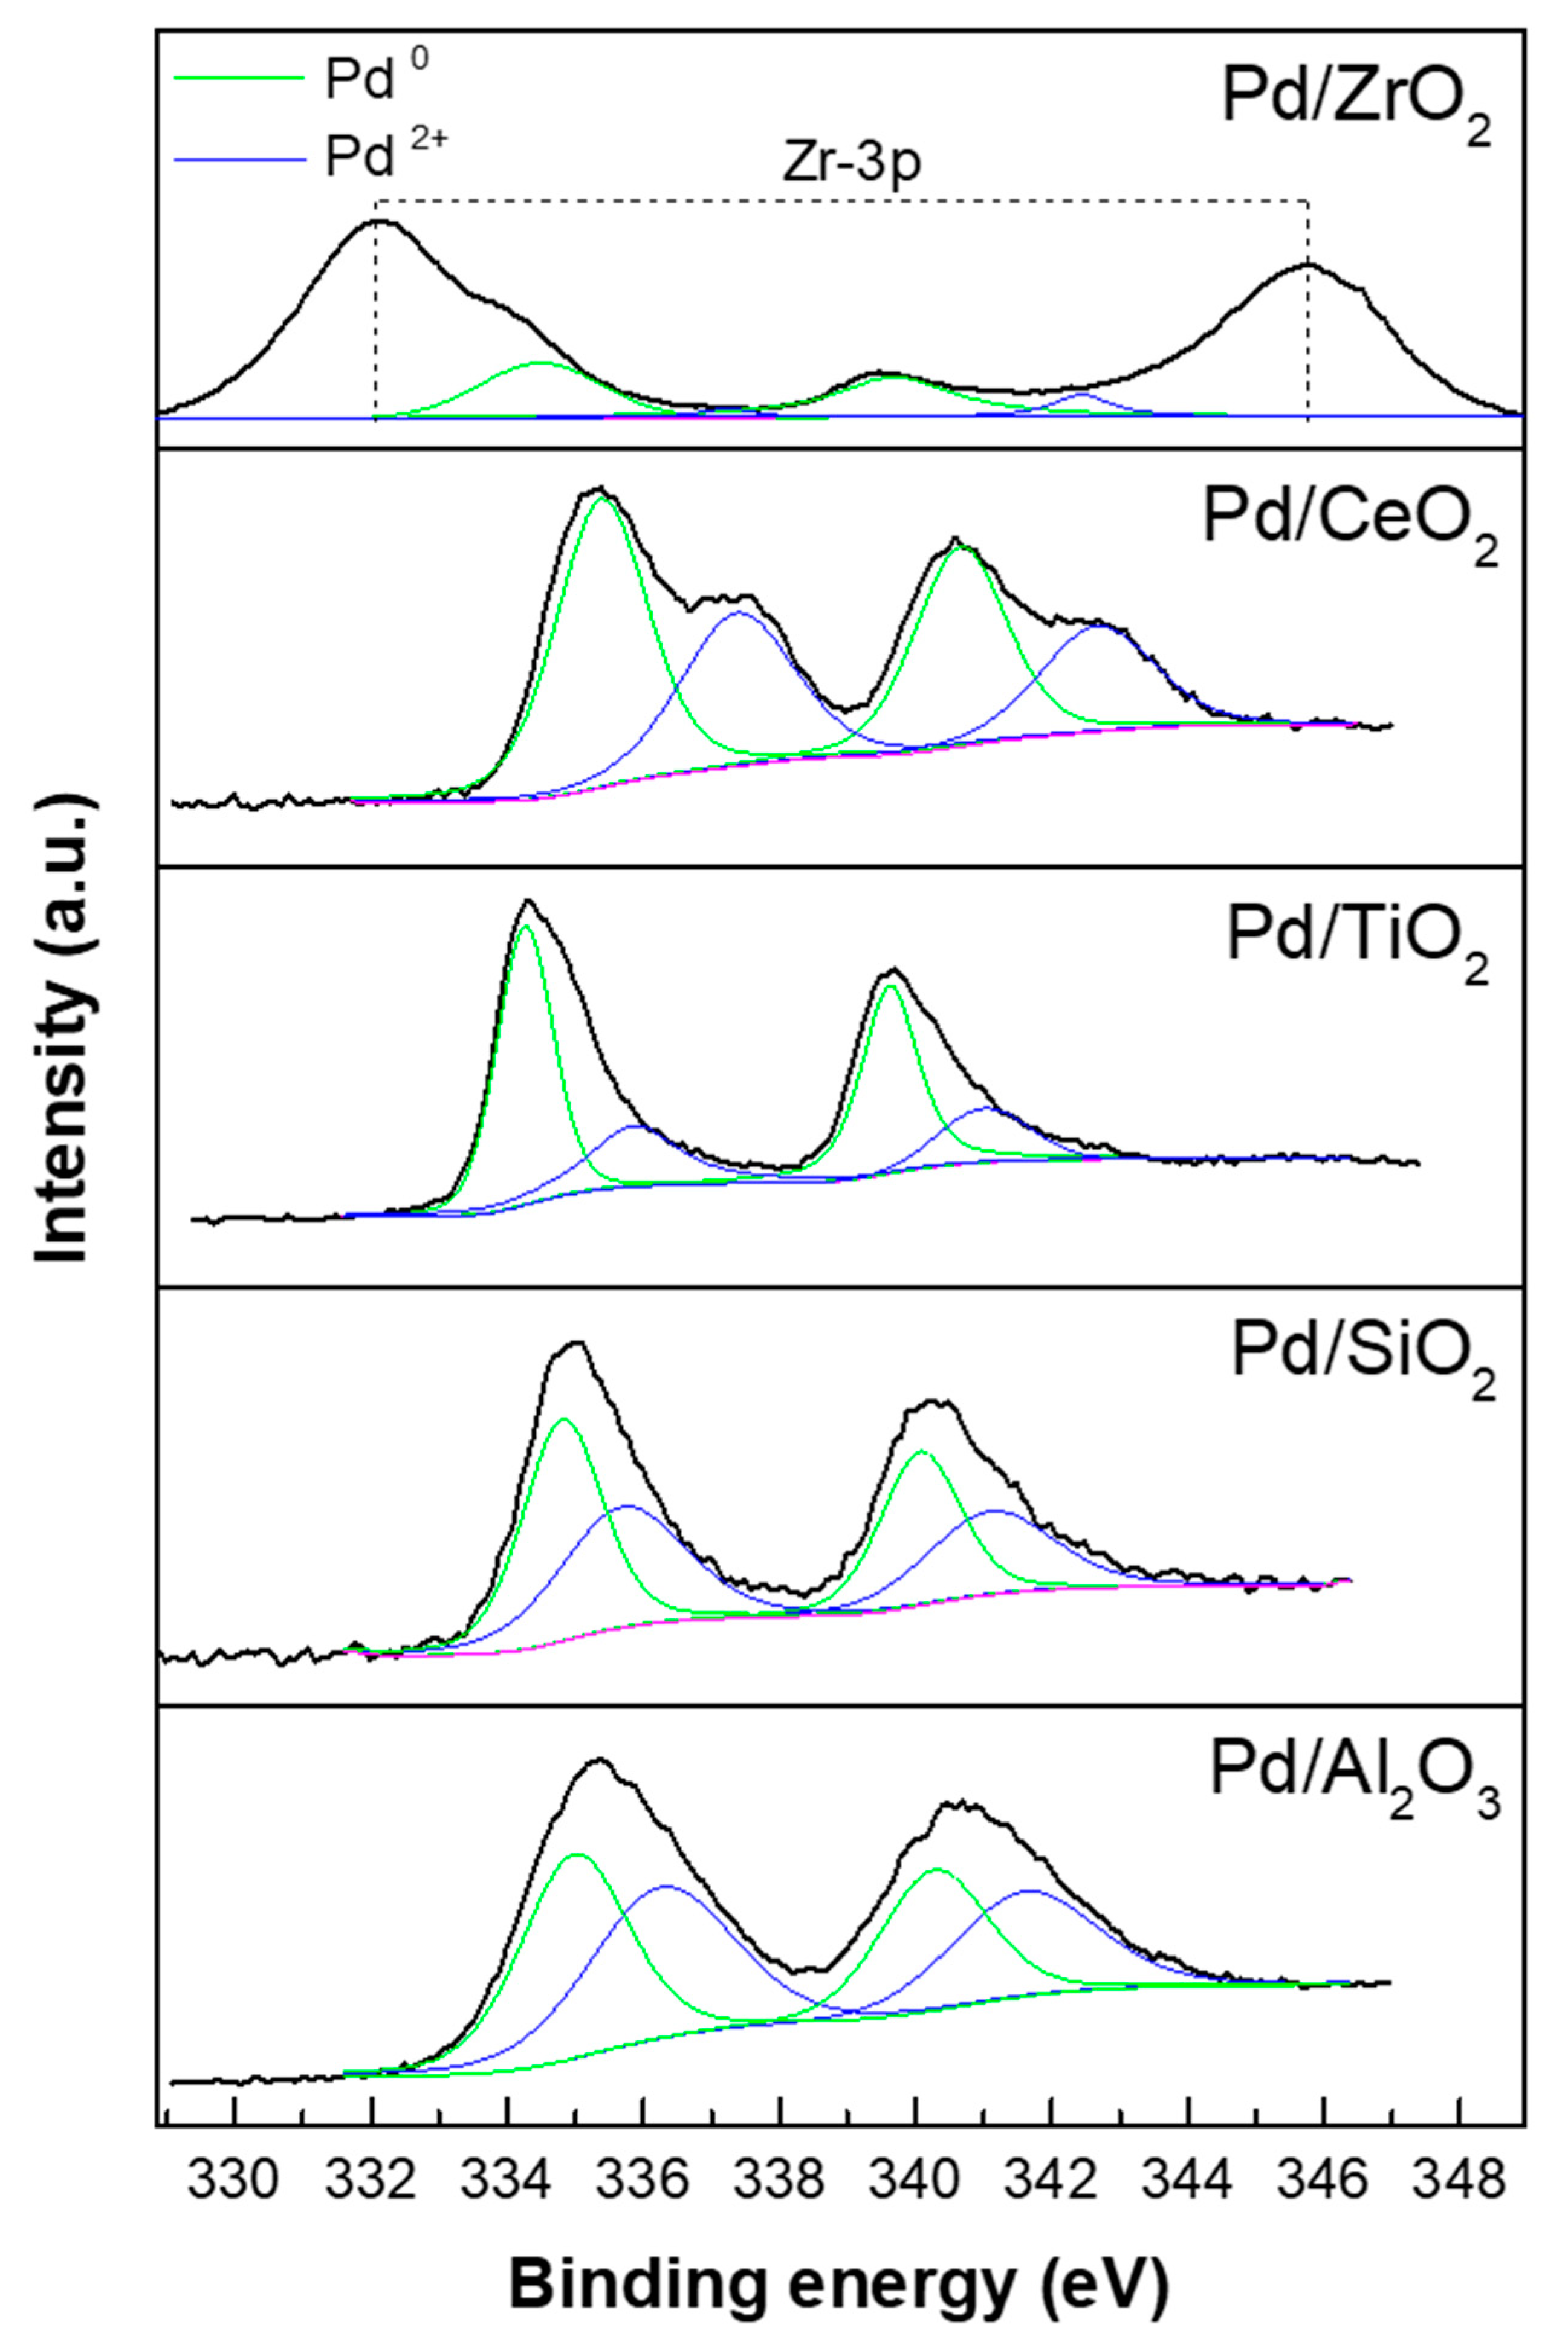
| Pd/Al2O3 | 4.9 | 26 | 38 | 115.2 | 336.2 | 334.9 | 0.09 |
| Pd/SiO2 | 4.8 | 5 | 12 | 38.8 | 335.7 | 334.8 | 0.01 |
| Pd/TiO2 | 4.9 | 10 | 25 | 45.5 | 335.9 | 334.2 | 0.05 |
| Pd/CeO2 | 4.9 | 32 | 42 | 142.1 | 337.3 | 335.3 | 0.26 |
| Pd/ZrO2 | 5.0 | 8 | 21 | 35.8 | 337.2 | 334.4 | 0.03 |
| Catalysts | Catalyst Amount (g) | Temp. (°C) | Hydrogen Pressure (bar) | Time (h) | Conversion (%) | Selectivity (%) | Yield of CPO (%) | ||||
|---|---|---|---|---|---|---|---|---|---|---|---|
| FAL | 2-MF | THFAL | CPO | NI b | |||||||
| Pd/Al2O3 | 0.03 | 150 | 20 | 1 | 56.1 | 15.6 | - | 3.1 | 13.9 | 67.4 | 7.8 |
| 0.1 | 100 | 20 | 4 | 98.4 | 15.9 | - | 17.1 | - | 67 | - | |
| 0.1 | 130 | 20 | 4 | 98.9 | - | - | 13.7 | 16.9 | 69.4 | 16.7 | |
| 0.1 | 150 | 20 | 4 | 99.2 | - | - | 10.3 | 23.7 | 66 | 23.5 | |
| 0.1 | 170 | 20 | 4 | >99 | - | 2.8 | 6.0 | 38.4 | 52.8 | 38.4 | |
| 0.1 | 190 | 20 | 4 | >99 | - | 2.9 | 5.6 | 42.8 | 48.7 | 42.8 | |
| 0.1 | 170 | 10 | 4 | 98.7 | 2.7 | 1.7 | 34.1 | 61.5 | 33.7 | ||
| 0.1 | 170 | 30 | 4 | >99 | - | 3.0 | 0.9 | 42.5 | 53.6 | 42.5 | |
| Pd/SiO2 | 0.03 | 150 | 20 | 1 | 19.7 | 27.4 | - | 5.1 | 32.3 | 35.2 | 6.4 |
| 0.1 | 150 | 20 | 4 | 77 | - | - | 1.7 | 43.4 | 54.9 | 33.4 | |
| Pd/TiO2 | 0.03 | 150 | 20 | 1 | 44.6 | 14.2 | - | 4.9 | 28.5 | 52.4 | 12.7 |
| 0.1 | 100 | 20 | 4 | 97.7 | 18.2 | - | 8.9 | 0.001 | 72.9 | 0.0009 | |
| 0.1 | 130 | 20 | 4 | 98 | - | - | 7.8 | 41.0 | 51.2 | 40.2 | |
| 0.1 | 150 | 20 | 4 | 98.5 | - | - | 3.7 | 45.9 | 50.4 | 45.2 | |
| 0.1 | 170 | 20 | 4 | >99 | - | 3.6 | 3.9 | 55.6 | 36.9 | 55.5 | |
| 0.1 | 190 | 20 | 4 | >99 | - | 4.3 | 3.7 | 59.1 | 32.9 | 59.0 | |
| 0.1 | 170 | 10 | 4 | 91.2 | 3.1 | 0.2 | 36.4 | 60.3 | 33.2 | ||
| 0.1 | 170 | 30 | 4 | 100 | - | 3.7 | 15.3 | 45.3 | 35.7 | 45.3 | |
| Pd/CeO2 | 0.03 | 150 | 20 | 1 | 70.9 | 34.3 | - | 4.0 | 6.1 | 55.6 | 4.3 |
| 0.1 | 150 | 20 | 4 | >99 | 9.4 | - | 23.3 | 25.9 | 41.4 | 25.9 | |
| Pd/ZrO2 | 0.03 | 150 | 20 | 1 | 27.6 | 31.1 | - | 6.5 | 28.2 | 34.2 | 7.8 |
| 0.1 | 150 | 20 | 4 | 88 | - | - | 3.8 | 46.3 | 49.9 | 40.7 | |
© 2020 by the authors. Licensee MDPI, Basel, Switzerland. This article is an open access article distributed under the terms and conditions of the Creative Commons Attribution (CC BY) license (http://creativecommons.org/licenses/by/4.0/).
Share and Cite
Byun, M.Y.; Park, D.-W.; Lee, M.S. Effect of Oxide Supports on the Activity of Pd Based Catalysts for Furfural Hydrogenation. Catalysts 2020, 10, 837. https://doi.org/10.3390/catal10080837
Byun MY, Park D-W, Lee MS. Effect of Oxide Supports on the Activity of Pd Based Catalysts for Furfural Hydrogenation. Catalysts. 2020; 10(8):837. https://doi.org/10.3390/catal10080837
Chicago/Turabian StyleByun, Mi Yeon, Dae-Won Park, and Man Sig Lee. 2020. "Effect of Oxide Supports on the Activity of Pd Based Catalysts for Furfural Hydrogenation" Catalysts 10, no. 8: 837. https://doi.org/10.3390/catal10080837
APA StyleByun, M. Y., Park, D.-W., & Lee, M. S. (2020). Effect of Oxide Supports on the Activity of Pd Based Catalysts for Furfural Hydrogenation. Catalysts, 10(8), 837. https://doi.org/10.3390/catal10080837