Abstract
Electrochemical Impedance Spectroscopy (EIS) is here used to characterize highly porous Ce0.9Gd0.1O1.95 (CGO, ca. 90% vol. of porosity) free-supporting nano-fibrous thick (100μm) membranes, fabricated via an electrospinning technique. The investigation of the calcination temperature influence on the microstructure indicates an evolution of the single nanofiber’s microstructure with a gradual grain growth from densely packed polycrystalline to pearl collar-like structures at increasing temperatures. This evolution is accompanied by brittleness for samples treated at temperatures above 800 °C. The electrochemical characterization suggests an ionic percolative conductivity that exploits both the bulk-lattice conduction along the individual nanofibers and interfacial conduction across different nanofibers at their intersections. Optimized membranes treated at 600 and 700 °C exhibit a similar electrochemical bulk response, but different interfacial electrochemical behavior (low frequency) associated with a grain size effect.
1. Introduction
Cerium-based oxides are materials of interest in a huge host of applications due to their excellent oxygen storage, ionic conductivity and redox (Ce4+/Ce3+) properties, associated with a remarkably high chemical stability in extreme environmental conditions (e.g., corrosive) [1,2,3,4,5,6,7,8]. A list of eminent examples of their uses includes chemical, electrochemical and electromechanical systems [2,3,4,5,6,7,8,9,10,11], catalysis and photocatalysis units [2,3,4,6,12,13,14,15,16,17,18], biomedical scaffolds [2,19,20,21], microelectronics and optical devices [2,22,23,24].
Most of the mentioned applications require the processing of materials into the form of porous structures, such as for instance, driven-pressure technologies (e.g., catalytic filters) [9,15,16,24,25,26,27] or functional components in electrochemical devices (e.g., cathode or three-phase-boundary, TPB) [8,28]. In such applications the porous structure exerts its function, providing either an extended surface area that facilitates the exposure of reaction/active sites [8,9,25,26,27,28], or an interconnected porous network that promotes the transport and diffusion of the reagents [25,26,27,28].
Ceramic porous membranes are typically prepared via colloidal processing through the formulation of a slurry, which is later shaped via traditional techniques (e.g., tape casting) [9,29,30,31]. However, this approach suffers from limitations such as the formation of closed pores that can act as defects weakening the structure [31], and a relative low porosity (around 50% in volume) [31]. Yet, the colloidal method poses the further issue of being a time-consuming multi-step approach.
A quicker viable alternative to increase porosity while maintaining the required structural stability is offered by electrospinning. This is a simple and inexpensive technique that enables the shaping of materials in the form of continuous one-dimensional (1D) nanofibers arranged into a three-dimensional (3D), well-interconnected, wide-open and highly porous network (ca. 80–90%) [15,16,25,26,27,28,32,33,34,35,36]. These characteristics along with a high surface-to-volume ratio associated with the 1D structure have been demonstrated to facilitate gas transport and diffusion, enable an efficient exposure of the reaction/active sites, and provide continuous pathways for current collectors [8,15,16,25,26,27,28,32,33,34,35,36]. In addition, the electrospinning offers the advantages of a versatile approach and an easy control over the chemical compositions [8,15,16,25,26,27,28,32,33,34,35,36]. However, ceramic nanofibers suffer from an inherent brittleness that limits their applications [37,38,39,40,41,42,43,44,45], and often prevents their use in the form of a 3D nanofibrous network [7,37,38,39,40,41,42,46]. In the last few years, a number of studies have explored the option of using the ceramic nanofibers as 3D electrospun components for electrochemical devices, chemical reactors [28,46,47], and as thick free-supporting nanofibrous membranes [16,42,43,44]. The structural stability of the ceramic 3D nanofibrous network has been associated with the stability of the single nanofiber, proven to depend on the dimensions of the diameters and of the crystallites [48,49]. Specifically, the larger the diameters and the smaller the crystallites, the more stable the nanofibers result [48,49]. This is ascribed to a larger grain boundary that enables an efficient dispersion of the mechanical stress within the 1D nanostructure. As a result, the single nanofiber strength increases, making the nanofibrous 3D network structurally stable [48]. Flexible titania mats have been obtained with grains at dimensions lower than 15 nm [48]. The electrochemical response of the single nanofibers has been also demonstrated to be dependent on the dimension of the crystallites [50,51,52]. Specifically, Zhang et al. have reported, for gadolinium-doped cerium oxide nanofibers, a conductivity five times higher than the conductivity of bulk material when the crystallites sizes are lower than 10 nm [50]. This study indicates electrochemical impedance spectroscopy (EIS) as a sensitive method able to detect minimal variation in the morphology of the nanofibers.
We herein report the preparation of 3D electrospun thick (100 μm) highly porous (ca. 90% vol.) free-supporting gadolinium-doped cerium oxide (hereafter CGO) membranes. The dimensions of the grains’ sizes have been controlled to confer the membrane the required structural stability. The results point out a significant effect of the grain size on the interfacial conductivity component, whereas the bulk-lattice one results not affected. To the best of our knowledge, this is the first report on 3D self-supporting thick highly porous nanofibrous CGO membranes and their electrochemical characterization.
2. Results and Discussion
The CGO nanofibrous membranes proposed in this work are synthesized from a spinning water/ethanol-based solution containing the cations of interest (dissolved from nitrate salts), and an appropriate polymer (spinning polymer, PVP) that sustains the formation of nanofibers during the whipping step of the electrospinning process (evaporation of the solvent) [26,53,54]. A thermal treatment is conducted on the as-spun organic–inorganic nanofibrous substrate (green) to remove the organic component (spinning polymer) and to promote the formation of the crystallographic phase. A scheme of the experimental procedure can be found in the supplementary information, Figure S1. The thermal properties of the electrospun membranes are investigated via thermal analysis. The thermalgravimetric analysis (TGA) profile (Figure S2) suggests a complete decomposition of the polymeric constituent at a temperature around 330 °C. Typically, the cubic fluorite phase of CGO is observed to occur at calcination temperature of around 400 °C [55]. Based on these indications, green nanofibrous membranes are treated at five different and increasing temperatures in the range of 500–900 °C. Upon the thermal treatment, only two nanofibrous samples (CGO600 and CGO700) out of the five prepared are structurally stable and free-supporting. The others (e.g., CGO500, CGO800, and CGO900) are extremely brittle and definitely not free-supporting. The composition of nanofibrous membranes is confirmed via Energy-dispersive X-ray spectroscopy (hereafter EDS) analysis (see Figure S3). The influence of the temperature on crystallinity of the membranes is then explored analyzing the corresponding X-ray diffraction (hereafter XRD) patterns, shown in Figure 1a. For all of the samples, the main reflections of the cubic fluorite are identified and indexed, and no secondary phases are observed. The peaks become sharper with increasing calcining temperature, indicating a gradual growth of the crystallites size. A zoom of the (111) plane for the developed materials is shown in Figure S4. The sizes of these latter ones are estimated applying the Debye–Scherrer equation and summarized in Table 1. The sizes of the crystallites are observed to gradually increase with the temperature, likely as a result of the mass diffusion effect.
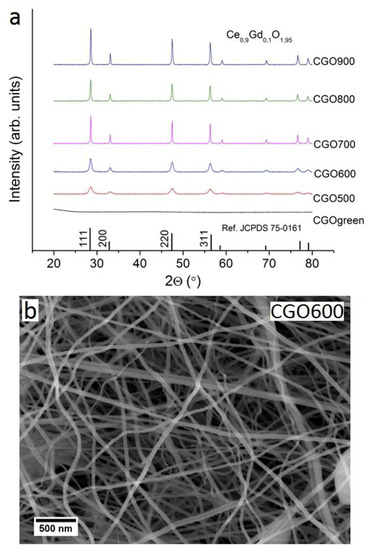
Figure 1.
(a) XRD pattern of CGO as electrospun (green) and calcinated at different temperatures; (b) SEM image of nanofibers calcinated at 600 °C.

Table 1.
Main properties determined by XRD and SEM.
The influence of the calcination temperature on 3D structure of the nanofibrous membranes is crucial both in terms of final grain size at the fibers and for the sintering effect at the intersections between fibers. As the microscopic features of the membranes exhibit similar morphology, for the sake of brevity, only the results of the substrate treated at 600 °C are here in discussed into details. The scanning electron microscopy (hereafter SEM) micrograph at low magnification for the selected membrane (Figure 1b) shows an extended 3D nanofibrous structure composed of nanofibers with high aspect ratios and a narrow and homogeneous distribution of diameters (< 100 nm). The average nanofiber’s diameters are estimated for all the samples and are reported in Table 1. The formation of any dead-end pores (close porosity) is not observed, whilst a wide, open and interconnected porosity is obtained and associated with an exceptionally high porosity. The pore volume is evaluated via the estimation of the mean intercept length in the SEM micrographs [25,56]. The values obtained are in the range of 84–88%, and in agreement with the values obtained in previous research studies in our group [16,25]. Despite the similarity in microscopic morphology, the different calcination temperatures on the single nanofibers (mesoscale and at nanoscale level) lead to significant differences, as also suggested by the analysis of the XRD patterns. In Figure 2a–e, high magnification SEM images for the five samples are shown. For all the CGO membranes, the single nanofibers exhibit a polycrystalline structure that evolves with the temperature from a morphology, with grains increasingly larger and densely packed up to the 1D nanostructures of CGO900, which consist of single grains connected in series like pearls in a necklace. The dimensions of the grains are then estimated from Figure S5 (see Table 1) resulting, within the experimental errors, similar to the crystallite sizes (Figure 2f). For sample CGO500, it is not possible to estimate the grain sizes as they are extremely small. Yet, it is worth mentioning that for CGO900, the dimensions of the grains are comparable with the dimension of the nanofiber’s diameters. Transmission electron microscopy (hereafter TEM) images (Figure 3a,d,g) of three selected samples (CGO600, CGO700, and CGO800) confirm the evolution of the polycrystalline morphology with the grains that gradually grow up to form the pearl collar-like structures (CGO900). The selected-area electron diffraction (SAED) (Figure 3b,e,h) indicates for the three samples a fluorite phase arrangement at the short scale (nanoscale), in agreement with the XRD patterns. The observation is further supported by the high resolution TEM (hereafter HR-TEM) image (Figure 3c,f,i) that shows a well-defined organization of the atoms with a fringe spacing indexed to the (111) plane of the fluorite phase.
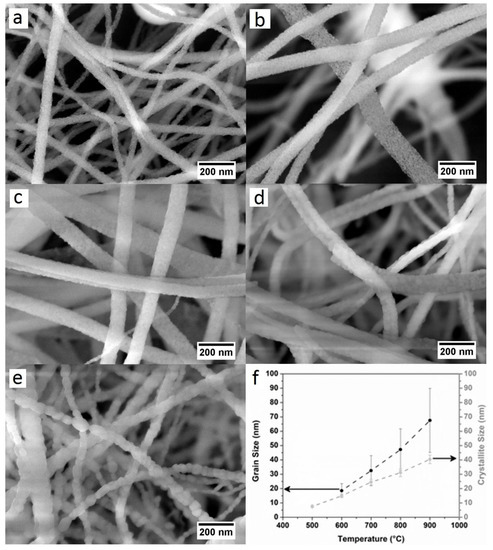
Figure 2.
SEM images for the different samples: (a) CGO500, (b) CGO600, (c) CGO700, (d) CGO800, and (e) CGO900; (f) evolution of crystallite and grain sizes with the calcination temperatures.
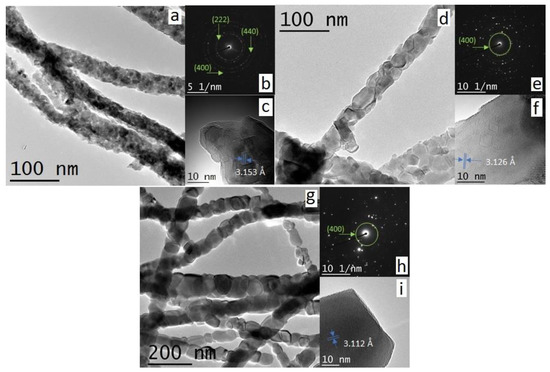
Figure 3.
TEM, SAED and HR-TEM images of (a–c) CGO600, (d–f) CGO700, and (g–i) CGO900, respectively.
The different structural stability of the CGO nanofibrous membranes is explained by the different microstructural and morphological features of the single nanofibers developed at the different calcination temperatures. A crystallites/grain sizes effect on strength of the nanofibers has been already reported [48,49]. Specifically, smaller grains correspond to more robust single nanofibers and more structurally stable membranes. These empirical observations demonstrate that the structural stability of highly porous nanofibrous membranes ultimately depends on the structural stability of the single nanofibers. In light of that, CGO800 and CGO900 result brittle because of the larger dimensions of their crystallites/grains that hinder an efficient dispersion of the structural stress. Yet, despite its small crystallite sizes, the brittleness of CGO500 can be ascribed to the low treatment temperature that hampers the formation of a sufficiently dense packed structure. By contrast, in CGO600 and CGO700, the crystallite size effect enables an efficient dispersion of the stress within the single nanofibers, conferring structural stability to the entire high porous membrane.
The CGO600 and CGO700 samples are the only ones possessing the required structural stability to be prepared in the form of thick free-supporting membranes endowed with exceptionally high porosity (> 88%). Interestingly, the two samples preserve their structural integrity despite a significant volume contraction upon the calcination process, evaluated to be around 88%.
Electrochemical properties of these samples are then investigated. As indicated in Figure 4a, CGO nanofibrous membranes are prepared as disc symmetric cells with a diameter of around 10 mm (after calcination). Gold meshes with a diameter of around 8 mm are coated on both sides of the membranes. The thickness of the membranes is estimated to be around 100 μm by analyzing the cross-section SEM image (see Figure 4b). Notably, despite the high porosity of the system, no short circuit is observed for the membranes, suggesting, thus, a percolative ionic conduction through the nanofibrous cells. Due to the morphological features of the nanofibers, the conduction likely occurs both along and across the nanofibers, exploiting, thus, the “channel” offered by 1D structure and across the interface at the nanofibers’ intersection. Such a model is schematically shown in Figure 4c, where two contributions to the ionic transport can be recognized. Figure 5a–d show the Nyquist plots for CGO600 and CGO700 at increasing temperatures. Interestingly, we distinguished two main semi arcs in the plot: a first one at the high frequencies and a second one at the low frequencies. The best total equivalent circuit was a series of an almost negligible R with three Voight elements in series, Ri//Qi with I = 1, 2, 3. The high frequency arc well fit a single Voight element, i.e., one resistor and one constant phase element, R1//Q1. Such fitting typically represents the ionic response of CGO at intermediate temperatures, which is generally attributed to the lattice ionic conduction, reasonably corresponding to the conduction along the nanofibers (crystalline bulk).
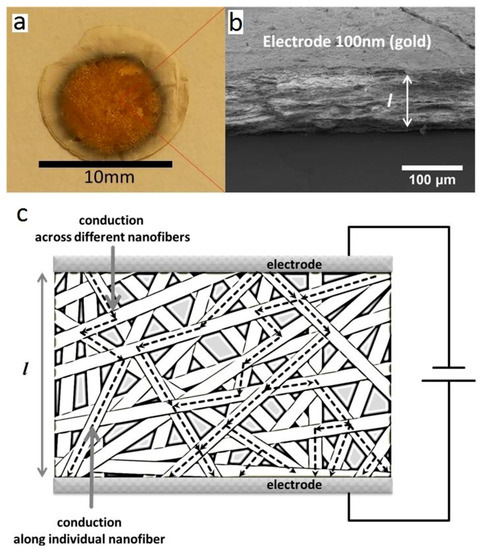
Figure 4.
(a) Digital photo of a symmetric CGO600 nanofibrous cell; (b) SEM micrograph of the same cell; the thickness (ca. 100 μm) and the gold electrodes are indicated; (c) scheme of the symmetric CGO cell showing the ionic conduction pathway along the individual nanofibers (bulk component) and across different nanofibers (interface component).
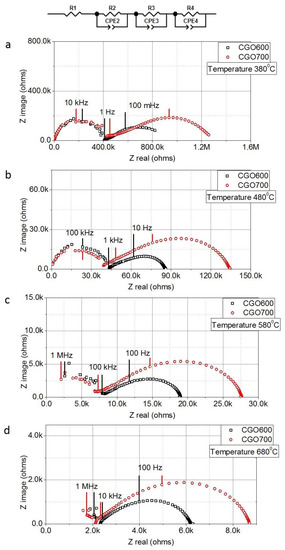
Figure 5.
Equivalent circuit and Nyquist plots for CGO600 and CGO700 in the range of temperature investigated increasing respectively from (a–d).
On the contrary, the low frequency arc results in being composed of two remaining Voight elements (R2//Q2 and R3//Q3). However, due to the significant overlap between the contributions, other possible elements could also fit. Such spreading of the electrochemical response at the low frequencies in the fibrous material generally results from the clustering of heterogeneous interfaces. Low frequency contributions are typically attributed to interface effects such as grain boundaries and disorder as well as to the electrode/electrolyte interface and effects occurring during the polarization of the electrochemical cell [57]. Notably, as shown by the microscopy, several possible grain-to-grain and fiber-to-fiber contacts can be achieved in the samples. Due to the low temperature of the measurements (380 °C) and the blocking nature of the electrodes (Au), no electrode polarization contributions are measured in the samples. The most relevant aspect emerging from Figure 5a–d concerns the different electrochemical responses, with the frequencies of the materials calcined at 600 and 700 °C. Specifically, while the two samples exhibit similar bulk responses, they differ for the interfacial conduction, with CGO600 showing lower resistance at all the temperatures investigated. This experimental observation can be interpreted by considering structural and microstructural features as well as by accounting those effects that impact on the ionic conduction. For the 1D nanostructure, the ionic conduction benefits from a high surface-to-volume aspect ratio and nanoscale grain size effect [48,55,56]. For the developed ceria-based nanofibers, no significant variation of the diameters is observed (all diameters lower than 100 μm). Therefore, no variation of the surface-to-volume ratio is expected for samples calcined at different temperatures. The only effect expected to influence the ionic conductivity is the dimensions of the grains. As already mentioned, the two samples exhibit the same bulk response, thus, suggesting no effect of the grain dimensions on the ionic conduction along the nanofibers. By contrast, we could observe an evident impact on the conductions at the interfaces (low frequencies region). In general, an increase in the grains’ sizes leads to a decrease in the grain boundary density, with a consequent reduction in ionic conductivity [50,52,57]. In the specific case of nanofibers, the minimum increment of the grain sizes from CGO600 to CGO700 may not affect the bulk ionic conduction (along the nanofibers) because of more substantial dimensions of the conductive pathway (microscale) to the grain size (nanoscale). However, when the dimensions of the grains and of the area across which the conduction occurs are comparable, any minimal variation might have a significant impact on the conduction. This is the case of the interface conduction at the nanofibers’ intersection, where the two morphological entities responsible for conduction (interface and grains) have dimensions in the same order of magnitude (nanoscale). Therefore, even the slight increment in the grain sizes from CGO600 to CGO700 have an evident impact on the ionic conductivity [50,52,57]. Specifically, the smaller the grains, the lower the resistance as a consequence of an increase in the density of grain boundary.
We used the Arrhenius formalism to analyze the thermal activation of the process. The activation energies (Ea) are then estimated and compared with the value corresponding to CGO dense polycrystalline [57], as indicated in Figure 6. For the high frequencies’ contribution, we could define a typical linear trend. Conversely, for the low frequencies, the substantial overlap between the elements did not allow us a clear interpretation of the effects. For simplicity, we only report the overall resistance in Figure 6. Despite the simplification, the calculated values for the different contributions (between 0.73 and 0.8 eV) indicate that similar thermally activated mechanisms are in play, also compared to the previously reported sample with the dense bulk mechanisms (high frequency) and grain boundary blocking barrier (low frequencies) [9,57]. Such a result confirms the validity of the model.
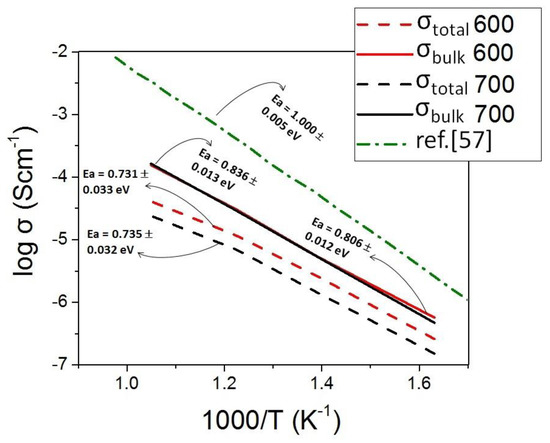
Figure 6.
Arrhenius plot comparing the behavior of dense polycrystalline CGO [57] with the bulk response (high frequency region, conduction along the nanofibers) and with the total electrochemical response (along the nanofibers and across the nanofibers).
3. Experimental
3.1. Materials and Methods
The electrospinning process was carried out in an RT Advanced (Linari Engineering, Pisa, Italy). The precursor materials were all reagent grade and used as received. Precursors sensitive to environmental humidity were stored in a desiccator. Gd(NO3)3⋅6H2O (99.90% purity, Sigma-Aldrich, Copenhagen, Denmark) and Ce(NO3)3⋅6H2O (99.90% purity, Sigma-Aldrich Denmark) were used as cationic precursors. Polyvinylpyrrolidone (PVP, (Mw ≈ 1,300,000, Sigma-Aldrich, Copenhagen, Denmark) was used as the carrier polymer. Ethanol (Anhydrous, 99.9%, Sigma-Aldrich, Copenhagen, Denmark) and distilled water were used as solvents.
The spinning solution was prepared mixing the solution containing the cations of interest and the solution of the carrier polymer. The solution of the cations was prepared by dissolving Gd(NO3)3⋅6H2O and Ce(NO3)3⋅6H2O at the desired stoichiometric amount in 25 mL of a mixed solution at 50%wt of ethyl alcohol and distilled water. The overall cation concentration was kept at 0.53 Molar. The solution of the carrier polymer was prepared by dissolving polyvinylpyrrolidone in a solution containing 50%wt of ethyl alcohol and distilled water to obtain a 15% wt/wt solution. The polymer solution was added to the cation’s solution under mild magnetic stirring (20 °C) for 15 min in a volume ratio of 1:1. The transparent obtained solution was then loaded into a glass syringe equipped with 21-gauge stainless steel needles.
The polymeric nanofibers were collected on an Al-foil covering a cylinder collector rotating at 100 rpm. The Al-foil was coated with a complete organic oil to better detach the electrospun nanofibers. The operation parameters were fixed with a working distance tip-collector of 15 cm, solution feeding rate of 0.25 mL/h and 22.5 kV of applied voltage. This process was conducted in air at 20 °C.
The green CGO10 nanofibers were thermal treated in air at 500, 600, 700, 800, and 900 °C for 3 h with a heat rate of 5 °C/min in order to remove the polymeric agent and form the desired ceramic phase. The samples produced were designated as CGO green (not calcined), CGO500, CGO600, CGO700, CGO800 and CGO900, where the numbers refer to the calcination temperature.
3.2. Materials Characterization
The thermal analysis was conducted (TGA, NETZSCH, STA 409C, CD) in air flux from 20 to 1000 °C at the rate of 1 °C/min to understand how the fibers behave during the calcination process and to choose a set of meaningful temperatures for the calcination.
The morphology, microstructure and pore formation in the nanofibers were investigated by scanning electron microscopy (SEM, Merlin, Carl Zeiss, Oberkochen, Germany) for all temperatures and by transmission electron microscopy (TEM, JEOL 3000F, Oxford Instruments, Abingdon, UK) for nanofibers treated at 600, 700, 900 °C. Selected-area electron diffraction-TEM (SEAD-TEM) investigations were run for samples treated at 600, 700, 900 °C. The chemical composition of the samples was determined by energy-dispersive spectroscopy (EDS) coupled with SEM.
The crystal structure and crystallinity of calcined nanofibers were analyzed using X-ray diffraction techniques (XRD, Brucker D8, Brucker, Germany) (CuKα operated) at 40 kV, 40 mA and 2θ = 20 to 80°, with a rate of 0.05 °/min and step of 1s. The average size of the grain was determined using the Debye–Scherrer equation. The trend for the average crystallite sizes is reported in Table 1.
3.3. Electrochemical Characterization
The samples for EIS characterization were prepared by pressing manually for a few seconds several layers of green disk with diameter of 26 mm. Samples were then calcined at 600 and 700 °C for 3 h. A layer of Au was sputtered through a mask over the cell to serve as an electrode and an Au mesh was used as current collectors.
EIS measurements were performed on samples treated at 600 and 700 °C. The electrochemical measurements were run in a one-atmosphere setup that could hold the two samples at the same time. The cells were sandwiched between two gold meshes. For the electrochemical measurements, a Gamry REF600 was used in standalone mode. The Gamry was controlled by Gamry software running in potentiostatic mode. The covered frequency ranged from 1 MHz to 1 mHz with 10 points measured per decade, starting at high frequency. An amplitude of 36 mV RMS was used. The EIS measurements were conducted at four temperatures—380, 480, 580, and 680 °C. All the measurements were conducted in an atmosphere containing 20% of oxygen in argon. The flow rate was 100 mL/min. The gas composition was controlled by Brooks mass flow controllers.
The conductivity of the nanofibrous CGO membranes was estimated applying the following formula:
where σNF, RNF, and VNF refer to conductivity, resistance and volume of the nanofibers, respectively; Vporosity refers to volume of the porosity obtained via estimation of mean intercept length in the SEM micrographs, while Vtot is the total volume (nanofibers + porosity) obtained from the geometrical dimensions (diameters of the gold meshes and thickness of the membranes).
4. Conclusions
Nanoscale grain size effect is proven to be critical in the optimization of structural and electrochemical properties of CGO free-supporting nanofibrous membranes. Specifically, the structural stability is adjusted by identifying the range of grain size that enables an efficient dissipation of the mechanical stresses and confers the required stability to the 1D structure. The optimization of the structure is achieved by controlling the calcination temperature. Polycrystalline nanofibers with diameters lower than 100 nm and grain sizes in the range of 32–18 nm (calcinated at 600 and 700 °C) are found to confer structural stability to highly porous (ca. 88%) thick (ca. 100 μm) CGO membranes. Yet, electrochemical characterization by impedance spectroscopy shows that efficient percolation mechanisms of ionic conduction are activated through the highly porous 3D nanofibrous network. Interestingly, the results point out only an evident grain size effect on the interfacial conductivity component, that together with other interfacial contributions also include the conduction across the nanofibers (at their intersection). In contrast, in the range of grain size identified as optimal to confer structural stability to the nanofibrous thick CGO membranes, the bulk-lattice component results almost unchanged. The different behavior has been ascribed to a different “scale” matching of the morphological entities involved in the conduction—grain size and conductive pathway. For the bulk-lattice component (conduction along the nanofibers), the grain size and the conductive pathway are in the nanoscale and microscale ranges, respectively. In contrast, for the interfacial conduction, both entities are in the nanoscale range. Any minimal variation then produces a significant effect.
Supplementary Materials
The following are available online at https://www.mdpi.com/2073-4344/10/7/756/s1. Figure S1: Scheme of the experimental procedure, Figure S2: TGA and DTA profiles, Figure S3: EDS analysis of CGO600, Figure S4: Zoom on (111) plane, Figure S5: High magnification SEM images of (a) CGO green, (b) CGO500, (c) CGO600, (d) CGO700, (e) CGO800, and (f) CGO900.
Author Contributions
Conceptualization, V.E., D.M. and R.H.S.; methodology, V.E., D.M. and R.H.S.; software, A.D.; validation, V.E., D.M. and C.P.B.; formal analysis, D.M., R.H.S., V.E.; investigation, D.M., R.H.S., V.E.; resources, V.E., C.P.B.; data curation, R.H.S., D.M.; writing—original draft preparation, D.M., R.H.S., V.E.; writing—review and editing, V.E., D.M., R.H.S., A.D., and C.P.B.; supervision, V.E., D.M.; project administration, D.M., V.E. and C.P.B.; funding acquisition, D.M., V.E. and C.P.B. All authors have read and agreed to the published version of the manuscript.
Funding
This research was supported by the Science Without Borders Program/CAPES, Coordenação de Aperfeiçoamento de Pessoal de Nível Superior—Brazil.
Acknowledgments
V.E. thanks VILLUM FONDEN for partially supporting this work by the research grant 00022862. The authors also acknowledge the technical staff at the Department of Energy Conversion and Storage of the Technical University of Denmark for the valuable technical support.
Conflicts of Interest
The authors declare no conflict of interest.
References
- Campbell, C.T.; Peden, C.H.F. Oxygen Vacancies and Catalysis on Ceria Surfaces. Science 2005, 309, 713–714. [Google Scholar] [CrossRef] [PubMed]
- Schmitt, R.; Nenning, A.; Kraynis, O.; Korobko, R.; Frenkel, A.I.; Lubomirsky, I.; Hailef, S.M.; Rupp, J.L.M. A review of defect structure and chemistry in ceria and its solid solutions. Chem. Soc. Rev. 2020, 49, 554–592. [Google Scholar] [CrossRef] [PubMed]
- Seal, S.; Jeyaranjan, A.; Neal, C.J.; Kumar, U.; Sakthivel, T.S.; Sayle, D.C. Engineered defects in cerium oxides: Tuning chemical reactivity for biomedical, environmental, & energy applications. Nanoscale 2020, 12, 6879–6899. [Google Scholar] [PubMed]
- Ma, Y.; Gao, W.; Zhang, Z.; Zhang, S.; Tian, Z.; Liu, Y.; Ho, J.C.; Qu, Y. Regulating the surface of nanoceria and its applications in heterogeneous catalysis. Surf. Sci. Rep. 2018, 73, 1–36. [Google Scholar] [CrossRef]
- Ni, D.W.; de Florio, D.Z.; Marani, D.; Kaiser, A.; Tinti, V.B.; Esposito, V. Effect of chemical redox on Gd-doped ceria mass diffusion. J Mater. Chem. A 2015, 3, 18835–18838. [Google Scholar] [CrossRef]
- Paier, J.; Penschke, C.; Sauer, J. Oxygen Defects and Surface Chemistry of Ceria: Quantum Chemical Studies Compared to Experiment. Chem. Rev. 2013, 113, 3949–3985. [Google Scholar] [CrossRef]
- Lee, J.G.; Park, J.H.; Shul, Y.G. Tailoring gadolinium-doped ceria-based solid oxide fuel cells to achieve 2 W cm−2 at 550 °C. Nat. Commun. 2014, 5, 4045. [Google Scholar] [CrossRef]
- Ahna, M.; Chob, J.; Lee, W. One-step fabrication of composite nanofibers for solid oxide fuel cell electrodes. J. Power Sources 2019, 434, 226749. [Google Scholar] [CrossRef]
- Schmidt, C.G.; Hansen, K.K.; Andersen, K.B.; Fu, Z.; Roosen, A.; Kaiser, A. Effect of pore formers on properties of tape cast porous sheets for electrochemical flue gas purification. J. Eur. Ceram. Soc 2016, 36, 645–653. [Google Scholar] [CrossRef]
- Kabir, A.; Santucci, S.; van Nong, N.; Varenik, M.; Lubomirsky, I.; Nigon, R.; Muralt, P.; Esposito, V. Effect of oxygen defects blocking barriers on gadolinium doped ceria (GDC) electro-chemo-mechanical properties. Acta Mater. 2019, 174, 53–60. [Google Scholar] [CrossRef]
- Santucci, S.; Zhang, H.; Sanna, S.; Pryds, N.; Esposito, V. Enhanced electro-mechanical coupling of TiN/Ce0.8Gd0.2O1.9 thin film electrostrictor. APL Mater. 2019, 7, 071104. [Google Scholar] [CrossRef]
- Rodriguez, J.A.; Grinter, D.C.; Liu, Z.; Palomino, R.M.; Senanayake, S.D. Ceria-based model catalysts: Fundamental studies on the importance of the metal–ceria interface in CO oxidation, the water–gas shift, CO2 hydrogenation, and methane and alcohol reforming. Chem. Soc. Rev. 2017, 46, 1824–1841. [Google Scholar] [CrossRef] [PubMed]
- Trovarelli, A. Catalytic Properties of Ceria and CeO2-Containing Materials. Catal Rev. Sci. Eng. 1996, 38, 439–520. [Google Scholar] [CrossRef]
- Wu, K.; Sun, L.-D.; Yan, C.-H. Recent Progress in Well-Controlled Synthesis of Ceria-Based Nanocatalysts towards Enhanced Catalytic Performance. Adv. Energy Mater. 2016, 6, 1600501. [Google Scholar] [CrossRef]
- Dankeaw, A.; Gualandris, F.; Silva, R.H.; Norrman, K.; Gudik-Sørensen, M.; Hansen, K.K.; Ksapabutr, B.; Esposito, V.; Marani, D. Amorphous saturated cerium–tungsten–titanium oxide nanofiber catalysts for NOx selective catalytic reaction. New J. Chem. 2018, 42, 9501–9509. [Google Scholar] [CrossRef]
- Dankeaw, A.; Gualandris, F.; Silva, R.H.; Scipioni, R.; Hansen, K.K.; Ksapabutr, B.; Esposito, V.; Marani, D. Highly porous Ce–W–TiO2 free-standing electrospun catalytic membranes for efficient de-NOx via ammonia selective catalytic reduction. Environ. Sci. Nano 2019, 6, 94–104. [Google Scholar] [CrossRef]
- Castano, C.E.; O’Keefe, M.J.; Fahrenholtz, W.G. Photo-assisted reduction in nanostructured cerium-based coatings. Scrip. Mater. 2013, 69, 489–492. [Google Scholar] [CrossRef]
- Corma, A.; Atienzar, P.; Garcia, H.; Chane-Ching, J.Y. Hierarchically mesostructured doped CeO2 with potential for solar-cell use. Nat. Mater. 2004, 3, 394–397. [Google Scholar] [CrossRef]
- Kargozar, S.; Baino, F.; Hoseini, S.J.; Hamzehlou, S.; Darroudi, M.; Verdi, J.; Hasanzadeh, L.; Kim, H.W.; Mozafari, M. Biomedical applications of nanoceria: New roles for an old player. Nanomedicine 2018, 13, 3051–3069. [Google Scholar] [CrossRef]
- Naganuma, T.; Traversa, E. The effect of cerium valence states at cerium oxide nanoparticle surfaces on cell proliferation. Biomaterials 2014, 35, 4441–4453. [Google Scholar] [CrossRef]
- Caputo, F.; Mameli, M.; Sienkiewicz, A.; Licoccia, S.; Stellacci, F.; Ghibelli, L.; Traversa, E. A novel synthetic approach of cerium oxide nanoparticles with improved biomedical activity. Sci. Rep. 2017, 7, 4636. [Google Scholar] [CrossRef]
- Suresh, R.; Ponnuswamy, V.; Mariappan, R. Nanostructured cerium oxide thin films by nebulised spray pyrolysis (NSP) technique: Impact of surfactants on the structural, optical and compositional properties. Ceram. Int. 2014, 40, 13515–13527. [Google Scholar]
- Vorokhta, M.; Matolínová, I.; Dubau, M.; Haviar, S.; Khalakhan, I.; Ševčíková, K.; Mori, T.; Yoshikawa, H.; Matolín, V. HAXPES study of CeOx thin film–silicon oxide interface. Appl. Surf. Sci. 2014, 303, 46–53. [Google Scholar] [CrossRef]
- Xie, S.L.; Wang, Z.L.; Cheng, F.L.; Zhang, P.; Mai, W.J.; Tong, Y.X. Ceria and ceria-based nanostructured materials for photoenergy applications. Nano Energy 2017, 34, 313–337. [Google Scholar] [CrossRef]
- Marani, D.; Silva, R.H.; Dankeaw, A.; Norrman, K.; Werchmeister, R.M.L.; Ippolito, D.; Gudik-Sørensen, M.; Hansen, K.K.; Esposito, V. NOx selective catalytic reduction (SCR) on self-supported V–W-doped TiO2 nanofibers. New J. Chem. 2017, 41, 3466–3472. [Google Scholar] [CrossRef]
- Marani, D.; Silva, R.H.; Dankeaw, A.; Gudik-Sørensen, M.; Norrman, K.; Hansen, K.K.; Esposito, V. Effect of the sol-gel conditions on the morphology and SCR performance of electrospun VW-TiO2 catalysts. J. Phys. Chem. Solids 2018, 118, 255–261. [Google Scholar] [CrossRef]
- Shahreen, L.; Chase, G.G.; Turinske, A.J.; Nelson, S.A.; Stojilovic, N. NO decomposition by CO over Pd catalyst supported on TiO2 nanofibers. Chem. Eng. J. 2013, 225, 340–349. [Google Scholar] [CrossRef]
- Kong, Y.; Sun, C.; Wu, X.; Sun, K.; Yin, X.; Zhang, N. One-Dimensional CuCo2O4−Er0.4Bi1.6O3 Composite Fiber as Cathode of Intermediate Temperature Solid Oxide Fuel Cells. ACS Sustain. Chem. Eng. 2020, 8, 3950–3958. [Google Scholar] [CrossRef]
- Marani, D.; Hjelm, J.; Wandel, M. Rheological analysis of stabilised cerium-gadolinium oxide (CGO) dispersons. J. Eur. Ceram. Soc. 2014, 34, 695–702. [Google Scholar] [CrossRef]
- Marani, D.; Gadea, C.; Hjelm, J.; Hjalmarsson, P.; Wandel, M.; Kiebach, R. Influence of hydroxyl groups of binders on rheological properties of cerium-gadolinium oxide (CGO) screen printing inks. J. Eur. Ceram. Soc. 2015, 35, 1495–1504. [Google Scholar] [CrossRef]
- Teocoli, F.; Marani, D.; Kiebach, R.; Esposito, V. Effect of spherical porosity on co-fired dense/porous zirconia bi-layers cambering. J. Eur. Ceram. Soc. 2018, 38, 173–179. [Google Scholar] [CrossRef]
- Thenmozhi, S.; Dharmaraj, N.; Kadirvelu, K.; Kim, H.Y. Electrospun nanofibers: New generation of materials for advanced applications. Mater. Sci. Eng. B 2017, 217, 39–48. [Google Scholar] [CrossRef]
- Sahay, R.; Kumar, P.S.; Sridhar, R.; Sundaramurthy, J.; Venugopal, J.; Mhaisalkar, S.G.; Ramakrishn, S. Electrospun composite nanofibers and their multifaceted applications. J. Mater. Chem. 2012, 22, 12953–12971. [Google Scholar] [CrossRef]
- Xue, J.; Xie, J.; Liu, W.; Xia, Y. Electrospun Nanofibers: New Concepts, Materials, and Applications. Acc. Chem. Res. 2017, 50, 1976–1987. [Google Scholar] [CrossRef] [PubMed]
- Agarwal, S.; Greiner, A.; Wendorff, J.H. Functional materials by electrospinning of polymers. Prog. Polym. Sci. 2013, 38, 963–991. [Google Scholar] [CrossRef]
- Jung, J.-W.; Lee, C.-L.; Yu, S.; Kim, I.-D. Electrospun nanofibers as a platform for advanced secondary batteries: A comprehensive review. J. Mater. Chem. A 2016, 4, 703–750. [Google Scholar] [CrossRef]
- Ahn, M.; Han, S.; Lee, J.; Lee, W. Electrospun composite nanofibers for intermediate-temperature solid oxide fuel cell electrodes. Ceram. Int. 2020, 46, 6006–6011. [Google Scholar] [CrossRef]
- Zhi, M.; Mariani, N.; Gemmen, R.; Gerdes, K.; Wu, N. Nanofiber scaffold for cathode of solid oxide fuel cell. Energy Environ. Sci. 2011, 4, 417–420. [Google Scholar] [CrossRef]
- Lee, J.G.; Lee, C.M.; Park, M.G.; Jung, S.-J.; Shul, Y.G. Performance evaluation of anode-supported Gd0.1Ce0.9O1.95 cell with electrospun La0.6Sr0.4Co0.2Fe0.8O3−ı-Gd0.1Ce0.9O1.95 cathode. Electrochim. Acta 2013, 108, 356–360. [Google Scholar] [CrossRef]
- Lee, J.G.; Lee, C.M.; Park, M.; Shul, Y.G. Direct methane fuel cell with La2Sn2O7–Ni– Gd0.1Ce0.9O1.95 anode and electrospun La0.6Sr0.4Co0.2Fe0.8O3-δ–Gd0.1Ce0.9O1.95 cathode. RSC Adv. 2013, 3, 11816–11822. [Google Scholar] [CrossRef]
- Zhou, H.; Ding, X.; Yin, Z.; Xu, G.; Xue, Q.; Li, J.; Jiao, S.; Wang, X. Fabrication and electrochemical characteristics of electrospun LiMn2O4 nanofiber cathode for Li-ion batteries. Mater. Lett. 2014, 117, 175–178. [Google Scholar] [CrossRef]
- Wang, Y.; Li, W.; Xia, Y.; Jiao, X.; Chen, D. Electrospun flexible self-supporting γ-alumina fibrous membranes and their potential as high efficiency fine particulate filtration media. J. Mater. Chem. A 2014, 2, 15124–15131. [Google Scholar] [CrossRef]
- Wen, Q.; Di, J.; Zhao, Y.; Wang, Y.; Jiang, L.; Yu, J. Flexible inorganic nanofibrous membranes with hierarchical porosity for efficient water purification. Chem. Sci. 2013, 4, 4378–4382. [Google Scholar] [CrossRef]
- Mao, X.; Si, Y.; Chen, Y.; Yang, L.; Zhao, F.; Ding, B.; Yu, J. Silica nanofibrous membranes with robust flexibility and thermal stability for high-efficiency fine particulate filtration. RSC Adv. 2012, 2, 12216–12223. [Google Scholar] [CrossRef]
- Li, W.; Wang, Y.; Ji, B.; Jiao, X.; Chen, D. Flexible Pd/CeO2–TiO2 nanofibrous membrane with high efficiency ultrafine particulate filtration and improved CO catalytic oxidation performance. RSC Adv. 2014, 5, 58120–58127. [Google Scholar] [CrossRef]
- Chen, Y.; Bu, Y.; Zhao, B.; Zhang, Y.; Ding, D.; Hua, R.; Wei, T.; Rainwater, B.; Ding, Y.; Chen, F.; et al. High-Performance Hollow-Nanofiber Cathode for Intermediate Temperature Fuel Cells. Nano Energy 2016, 26, 90–99. [Google Scholar] [CrossRef]
- Zhi, M.; Lee, S.; Miller, N.; Menzler, N.H.; Wu, N. An intermediate-temperature solid oxide fuel cell with electrospun nanofiber cathode. Energy Environ. Sci. 2012, 5, 7066–7071. [Google Scholar] [CrossRef]
- Park, S.-J.; Chase, G.G.; Jeong, K.-U.; Kim, H.Y. Mechanical properties of titania nanofiber mats fabricated by electrospinning of sol–gel precursor. J. Sol. Gel. Sci. Technol. 2010, 54, 188–194. [Google Scholar] [CrossRef]
- Kumar, A.; Jose, R.; Fujihara, K.; Wang, J.; Ramakrishna, S. Structural and Optical Properties of Electrospun TiO2 Nanofibers. Chem. Mater. 2007, 19, 6536–6542. [Google Scholar] [CrossRef]
- Zhang, M.F.; Li, T.J.; Zhao, X.H.; Zhou, H.J. Enhanced ionic conductivity in ce0.8gd0.2o2-δ nanofiber: Effect of the crystallite size. Solid State Phenom 2017, 281, 761–766. [Google Scholar] [CrossRef]
- Ou, G.; Liu, W.; Yao, L.; Wu, H.; Pan, W. High conductivity of La2Zr2O7 nanofibers by phase control. J. Mater. Chem. A 2014, 2, 1855–1861. [Google Scholar] [CrossRef]
- Yao, L.; Liu, W.; Ou, G.; Nishijima, H.; Pan, W. Phase stability and high conductivity of ScSZ nanofibers: Effect of the crystallite size. J. Mater. Chem. A 2015, 3, 10795–10800. [Google Scholar] [CrossRef]
- Thompson, C.J.; Chase, G.G.; Yarin, A.L.; Reniker, D.H. Effects of parameters on nanofiber diameters determined from electrospinning model. Polymer 2007, 48, 6913–6922. [Google Scholar] [CrossRef]
- Gazquez, G.C.; Smulders, V.; Veldhuis, S.A.; Wieringa, P.; Moroni, L.; Boukamp, B.A.; Elshof, J.E.t. Influence of Solution Properties and Process Parameters on the Formation and Morphology of YSZ and NiO Ceramic Nanofibers by Electrospinning. Nanomaterials 2017, 7, 16. [Google Scholar] [CrossRef] [PubMed]
- Artini, C.; Pani, M.; Lausi, A.; Masini, R.; Costa, G.A. High Temperature Structural Study of Gd-Doped Ceria by Synchrotron X-ray Diffraction (673 K ≤ T ≤ 1073 K). Inorg. Chem. 2014, 53, 10140–10149. [Google Scholar] [CrossRef]
- Tomadakis, M.M.; Robertson, T.J. Viscous Permeability of Random Fiber Structures: Comparison of Electrical and Diffusional Estimates with Experimental and Analytical Results. J. Compos. Mater. 2005, 39, 163. [Google Scholar] [CrossRef]
- Esposito, V.; Traversa, E. Design of Electroceramics for Solid Oxides Fuel Cell Applications: Playing with Ceria. J. Am. Ceram. Soc. 2008, 91, 1037–1051. [Google Scholar] [CrossRef]
© 2020 by the authors. Licensee MDPI, Basel, Switzerland. This article is an open access article distributed under the terms and conditions of the Creative Commons Attribution (CC BY) license (http://creativecommons.org/licenses/by/4.0/).