Article

Asymmetry in Charge Transfer Pathways Caused by Pigment–Protein Interactions in the Photosystem II Reaction Center Complex

Department of Physics, Gettysburg College, 300 North Washington Street, Gettysburg, PA 17325, USA
*
Author to whom correspondence should be addressed.
Catalysts 2020, 10(6), 718; https://doi.org/10.3390/catal10060718
Submission received: 5 June 2020 / Revised: 21 June 2020 / Accepted: 23 June 2020 / Published: 26 June 2020
(This article belongs to the Special Issue Photo-Induced Electron Transfer Kinetics in Catalysis)

Abstract

:
This article discusses the photoinduced charge transfer (CT) kinetics within the reaction center complex of photosystem II (PSII RC). The PSII RC exhibits a structural symmetry in its arrangement of pigments forming two prominent branches, D1 and D2. Despite this symmetry, the CT has been observed to occur exclusively in the D1 branch. The mechanism to realize such functional asymmetry is yet to be understood. To approach this matter, we applied the theoretical tight-binding model of pigment excitations and simulated CT dynamics based upon the framework of an open quantum system. This simulation used a recently developed method of computation based on the quasi-adiabatic propagator path integral. A quantum CT state is found to be dynamically active when its site energy is resonant with the exciton energies of the PSII RC, regardless of the excitonic landscape we utilized. Through our investigation, it was found that the relative displacement between the local molecular energy levels of pigments can play a crucial role in realizing this resonance and therefore greatly affects the CT asymmetry in the PSII RC. Using this mechanism phenomenologically, we demonstrate that a near 100-to-1 ratio of reduction between the pheophytins in the D1 and D2 branches can be realized at both 77 K and 300 K. Our results indicate that the chlorophyll Chl D 1 is the most active precursor of the primary charge separation in the D1 branch and that the reduction of the pheophytins can occur within pico-seconds. Additionally, a broad resonance of the active CT state implies that a large static disorder observed in the CT state originates in the fluctuations of the relative displacements between the local molecular energy levels of the pigments in the PSII RC.

1. Introduction

Photosystem II (PSII) is the only biological system that has the unique ability to oxidize H 2 O to O 2 [1]. The oxygen produced in the photosystem II reaction center (PSII RC) provides the source of oxygen in Earth’s atmosphere providing the essential basis of life.
The PSII RC is comprised of D1 and D2 proteins, core antenna proteins CP43 and CP47, and several small subunits [1,2]. Similar to reaction centers found in purple bacteria, the D1 and D2 proteins comprise the core of the PSII RC along with a number of noncovalently associated cofactors, including pheophytins, two quinones, and an iron ion ( Fe 2 + ), as shown in Figure 1 [3]. Located near the PSII RC, the oxygen-evolving complex (OEC), made up of a Mn 4 Ca cluster, is responsible for water oxidization [4,5] which makes the PSII RC unique.
The entire structure of the PSII RC includes two closely related proteins which form one large unit dimeric in structure, resulting in a symmetrical complex. [2,6]. This symmetry in the PSII RC can be clearly seen in the arrangement of the central pair of pigments, P D 1 and P D 2 , accessory chlorophylls, Chl D 1 and Chl D 2 , pheophytin pigments, Pheo D 1 and Pheo D 2 , and plastoquinone cofactors, Q A and Q B [3]. Functionally, however, the PSII RC is not symmetrical. The functional asymmetry in the PSII RC has been observed in the exclusive reduction of the plastoquinone Q A after the photo-excitation of the PSII RC. This indicates that only the D1 branch is active during the primary photochemistry process [7,8,9]. This differs from the function of the RC in photosystem I, another type of RC found in oxygen evolving organisms. This photosystem also has a dimeric structure in the arrangement of pigments but unlike the PSII RC, does not exhibit functional photochemical asymmetry [10].
Molecular mechanisms containing functional asymmetry have been investigated, but the cause and function of this asymmetry are still under debate [1,11]. Spectral analysis of the charge transfer kinetics in the PSII RC has been examined thoroughly and has shown that the electron donor for primary charge separation in PSII RC involves Chl D 1 [12] as well as the central pair, P D 1 and P D 2 [13,14,15,16]. Thus even within the D1 branch, multiple pathways for charge transfer are observed to be active. This also implies that the energetic landscape of the D1 is different from that of D2 which possibly serves as the cause of the asymmetry in the photochemical pathway [17]. Recent theoretical studies of molecular dynamics (MD) using the quantum mechanics/molecular mechanics (QM/MM) approach support the concept of an energy landscape that favors active charge transfer in the D1 branch [11,18]. However, to what extent this energy landscape could affect the CT dynamics in the complex requires further investigation.
In this work, a theoretical model of a mechanism by which the charge transfer kinetics in the PSII RC are highly asymmetric is presented. The pigments in the PSII RC non-covalently interact with local protein residues, causing variations in molecular excitation energies (site energies) among the pigments [11,18]. We postulate that such interactions cause variances in the relative displacements among the local molecular energy levels of the pigments as well as their excitation energies. To investigate effect of the molecular energy levels on the charge transfer phenomena, we adopt the tight-binding model of the PSII RC [19,20,21] as a starting point and then incorporate the energy levels as parameters to the model. We then simulate the dynamics of photo-excited charge transfer for various parameter settings using a non-Markovian and non-perturbative method of computation [22]. We find that charge transfer states are active only when their excitation energies are resonant with those of delocalized excitons of the PSII RC regardless of the particular excitonic landscape. Thus we show that the activity of charge transfer states is controlled by the shifting of the local molecular energy levels and the strong asymmetry of charge separation between the D1 and D2 branches which can be explained quantitatively in a phenomenological manner.

2. Results

2.1. Frenkel Excitation and Charge Transfer States of Pigment–Protein Complex

We represent the reaction center of PSII as a pigment–protein complex (PPC), a molecular aggregate of M pigments being held in a protein scaffolding. Molecular excitations of the pigments in the PPC are described in terms of electrons and holes residing in the highest occupied molecular orbital (HOMO) and the lowest unoccupied molecular orbital (LUMO) within each pigment [19]. The ground state of the PPC, | 0 , is defined as the state in which all of the HOMOs are occupied and all of the LUMOs unoccupied (see Figure 2a). The excited state of the PPC, | m + n is defined to have one hole in the HOMO at pigment m and one electron in the LUMO at pigment n (see Figure 2b). In what follows, we refer to the excited state for m n as the charge transfer (CT) state and that for m = n as the Frenkel exciton (FE) state which is denoted by | m * = | m + m (see Figure 2c). The total charge is conserved under these excitations so the PPC as a whole remains neutral.
The pigments in the PPC are affected by vibrational fluctuations originating in the protein scaffolding and surrounding solvent. To incorporate this phenomenon, the Hamiltonian of the PPC is divided into three parts as H ^ = H ^ S + H ^ B + H ^ S B , where H ^ S is the system Hamiltonian describing the excitation dynamics of the pigment sites, H ^ B is the bath Hamiltonian describing the environmental vibrations, and H ^ S B is the system–bath Hamiltonian that determines the way that the pigments are influenced by the vibrations. For the system Hamiltonian, we employ the tight-binding model of PPC [19], whose matrix elements are specified by
m + n | H ^ s | k + = t m k ( + ) δ n + t n ( ) δ m k + U m n δ m k δ n + V m k δ m n δ k ,
where t m n ( ± ) ( = t n m ( ± ) * ) are the tunneling matrix elements [23], U m n is the (renormalized) Coulomb interaction potential between the hole in the HOMO at pigment m and the electron in the LUMO at pigment n, and V m n ( = V n m ) is the Förster resonance coupling between the FEs at pigments m and n, satisfying V m m = 0 . For later convenience, we define the site energy ε m n by the diagonal elements ( k = m and = n ) of H ^ s ,
ε m n = m + n | H ^ S | m + n = t m m ( + ) + t n n ( ) + U m n .
This represents the amount of energy it takes to excite the ground state | 0 to | m + n . The matrix element between two FE states is obtained from Equation (1) as m * | H ^ s | n * = ε m m δ m n + V m n , indicating that the coupling between the FE states are determined only by V m n . In contrast, coupling between CT states and between FE and CT states are determined only by the off-diagonal elements of the tunneling matrix, t m n ( ± ) of m n . These are associated with the overlap integrals of the electronic wavefunctions related to the molecular orbitals which are well approximated by the exponential function of distance [19,23]. We therefore model the tunneling matrix by
t m n ( ± ) = δ m n t m m ( ± ) + A m n ( ± ) exp | R m R n | / a m n ,
where A m n ( ± ) is the coefficient representing the overall strength of coupling satisfying A m m ( ± ) = 0 , R m is the representative position of pigment m, and a m n is a length scale that generally depends on the pigment pair [19].
The bath of vibrations described by H ^ B originates in the protein structure and surrounding solvent [23]. The influence of these vibrations on the system described by H ^ S B gives rise to a renormalization of the interaction potentials U m n in Equation (1). Such renormalization takes the form of
U m n = U m n ( C ) + λ m n ,
where U m n ( C ) is the (bare) Coulomb potential of the hole–electron interactions and λ m n is the reorganization energy of the excited state | m + n (including | m * for m = n ). The Coulomb interaction potential we use here is
U m n ( C ) = e 2 4 π ϵ ϵ 0 1 | R m R n | + δ m n η ,
where ϵ is the dielectric constant, and η is a cutoff parameter yielding the exciton binding energy for n = m that we denote by U B = U m m ( C ) .
With the detailed form of U m n , the physical content of the diagonal elements of the tunneling matrix, t m m ( ± ) , is considered. Let us denote the energy level of the HOMO by E m ( HOMO ) and that of the LUMO by E m ( LUMO ) for pigment m. These energy levels are measured from the vacuum level (infinitely far from the PPC) which defines the zero-energy level. The HOMO-LUMO gap, E m ( LUMO ) E m ( HOMO ) , is by definition the amount of energy it takes to excite an electron from the HOMO to the LUMO state [1]. This value is identical to the amount of energy required to create the FE at pigment m at the ground state. Thus, the binding energy of FE, U B , is included in the HOMO-LUMO gap. Based on this, we assign t m m ( + ) the amount of energy required to create a hole in the HOMO of pigment m by removing an electron from the ground state to the vacuum level, that is t m m ( + ) = E m ( HOMO ) , as illustrated in Figure 3a. Likewise, as shown in Figure 3b, we assign t m m ( ) the amount of energy it takes to bring an electron from the vacuum level to the LUMO at pigment m while its HOMO is occupied, so that t m m ( ) = E m ( LUMO ) U B . Here, the biding energy is subtracted from the energy level of the LUMO level because an electron, instead of a hole, resides in the HOMO.
Incorporating our argument above, we introduce an alternative expression for the site energy. Substituting t m m ( ± ) obtained above for Equation (2), the site energies are written as ε m n = E m ( HOMO ) + E n ( LUMO ) + U m n U B . Hereafter, we set the HOMO level of pigment 1 ( m = 1 ) as the reference level and define Δ E m = E m ( HOMO ) E 1 ( HOMO ) as illustrated in Figure 3c. We refer to this quantity as the level shift of pigment m. Rearranging the expression of site energy of the FE for the energy level of the LUMO, E m ( LUMO ) = E m ( HOMO ) + ε m m λ m m , we express Equation (2) in terms of the level shift as
ε m n = ε m n 0 Δ E m + Δ E n ,
where ε m n 0 = ε n n λ n n + U m n U B which we refer to as the zero-shift site energy of | m + n . Since Δ E 1 = 0 holds, the site energies of Equation (6) depend on M 1 variables which are Δ E 2 , Δ E 3 , , Δ E M , provided the values of ε m n 0 are all determined.

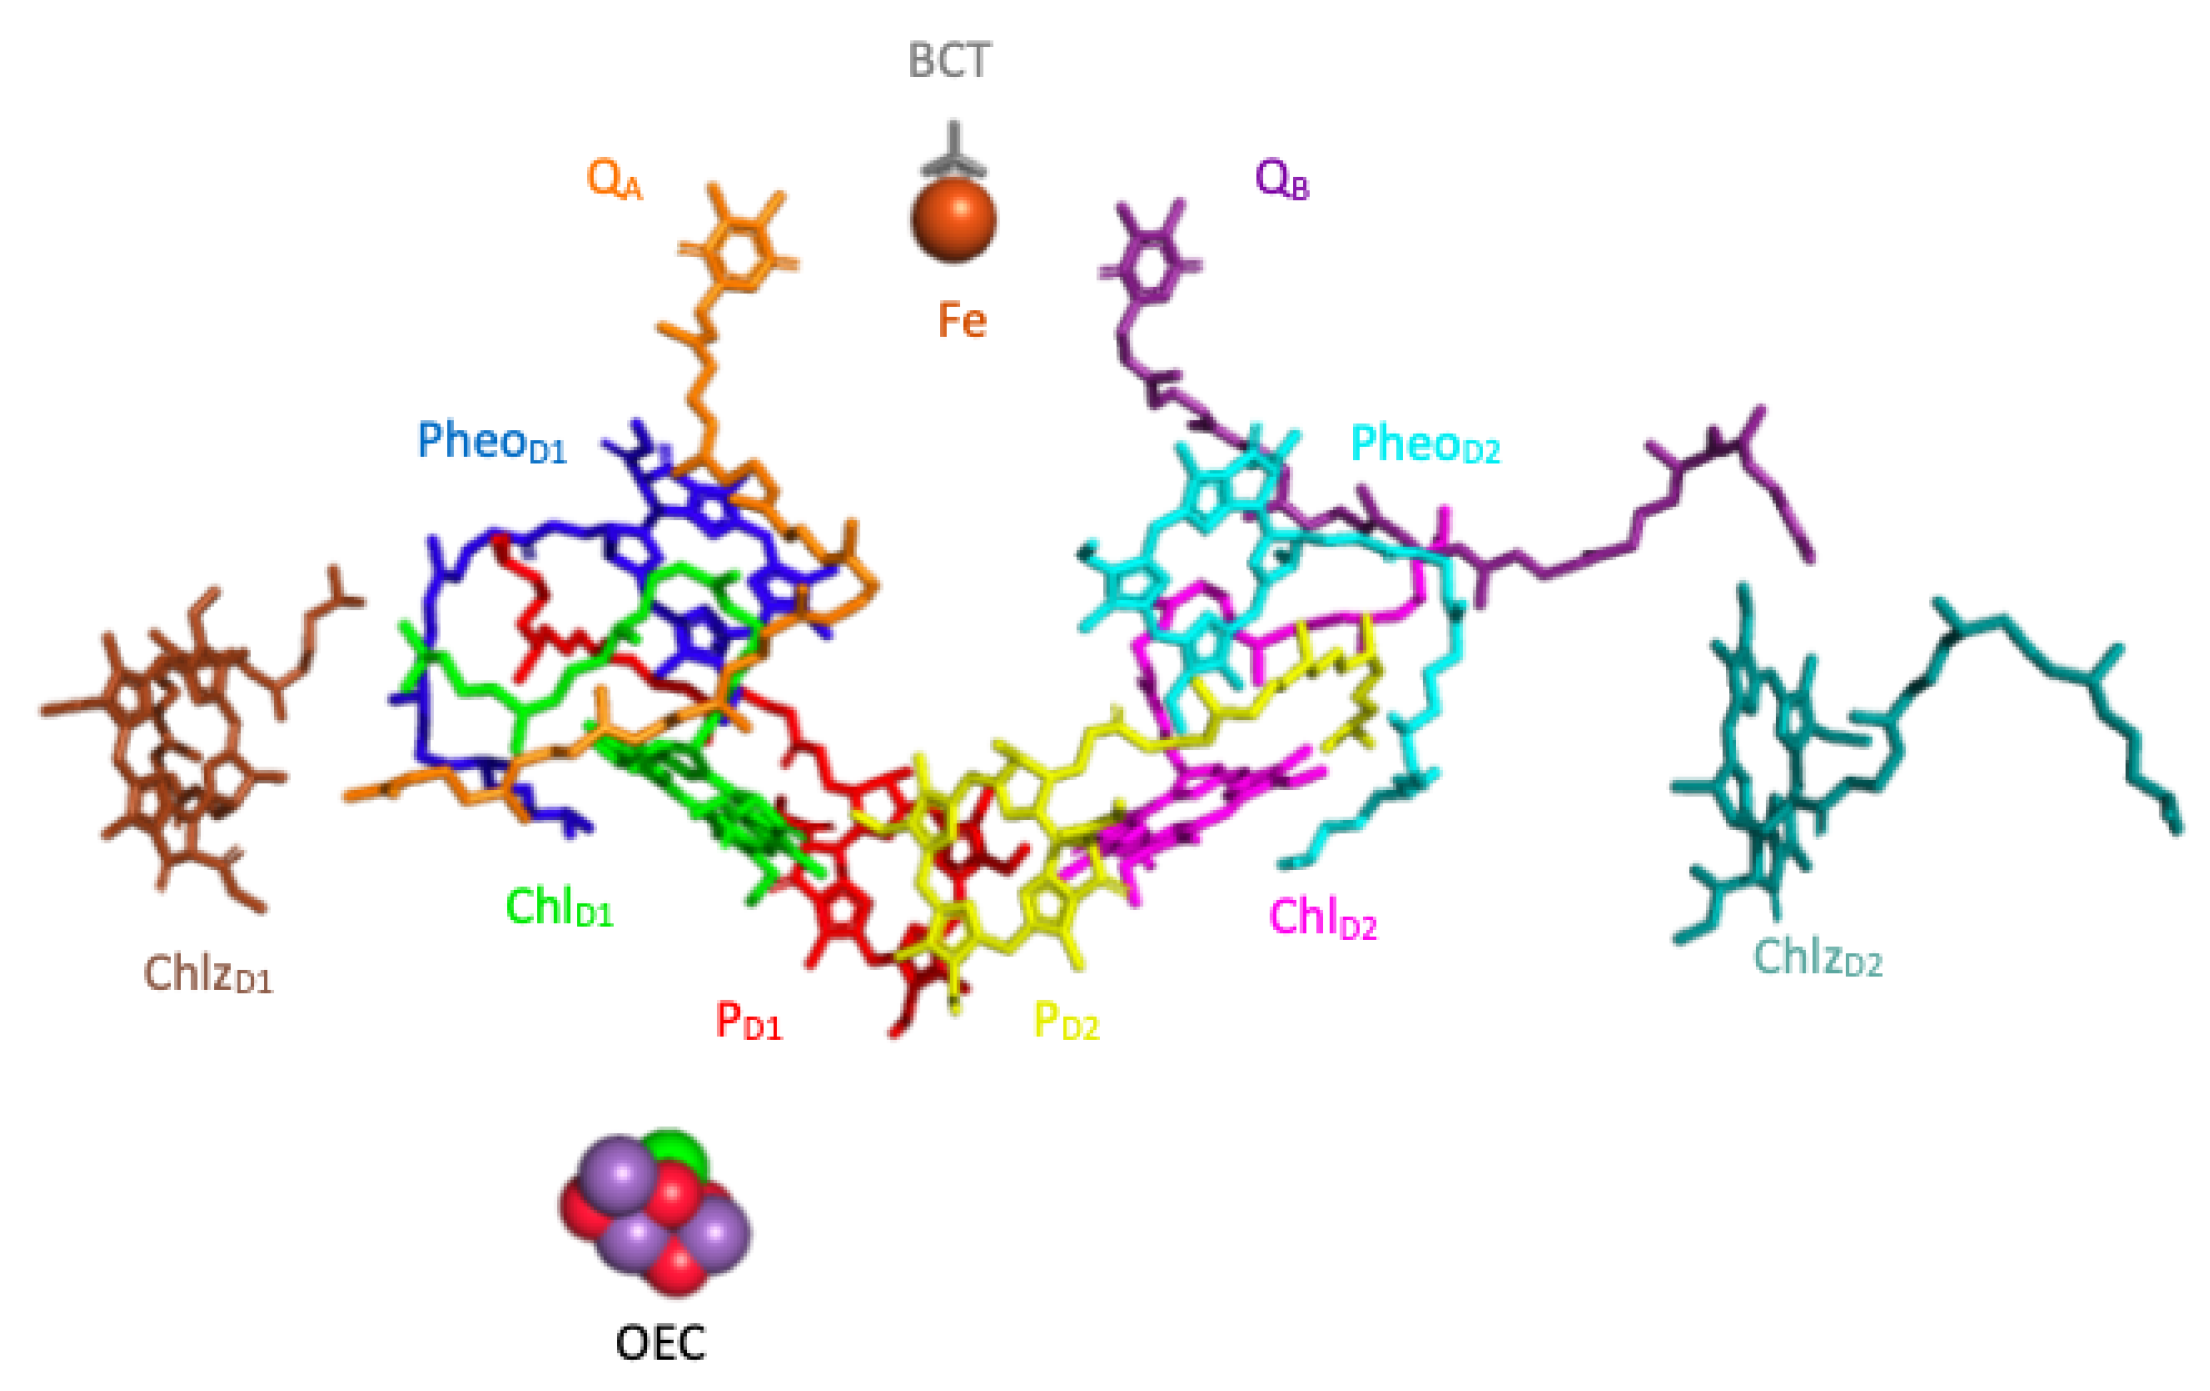
2.2. The Model of the PSII Reaction Center

The reaction center of the PSII contains four chlorophylls ( P D 1 , P D 2 , Chl D 1 and Chl D 2 ), two pheophytins ( Pheo D 1 and Pheo D 2 ), and two plastoquinones ( Q A and Q B ). The timescale of the kinetics of the charge transfer between the pigments is on the order of a few pico-seconds (ps) whereas the timescale of Q A reduction is on the order of 100 ps [24]. For this reason we exclude the plastoquinones from our model, focusing on the first few pico-seconds (ps) after the photo-excitation of the complex. In what follows, for the sake of notational simplicity, we also refer to each of the six pigments by numbers (1 through 6) assigned as shown in Figure 4.
For the FE–FE sector of Equation (1), we adopt the site energies, ε m m for m = 1 , 2 , , 6 , from Gelzinis et al. [21] and the FE couplings V m n from Shibata et al. [25]. The relevant values are illustrated in Figure 4b and are also summarized in Table A1. For the CT–CT and FE–CT sectors of Equation (1), we must obtain the zero-shift site energies ε m n 0 and the off-diagonal elements of tunneling matrix, t m n ( ± ) . The parameters specifying ε m n 0 are ε m m , ϵ , η , and λ m n , among which ε m m are the previously determinded site energies of the FEs. For the protein environment of the PSII RC, we use ϵ = 1.5 as suggested by Müh and Renger [11]. For η , we examined the zero-phonon lines given by Novoderezhkin et al. [15] and found that η = 7.4 Å is an optimum value. This η yields the binding energy of FE, U B = U m m ( C ) = 10463 cm 1 1.30 eV , for all of the pigment sites. The positions R m have been adopted from Gelzinis et al. [21]. These values are summarized in Table A2. The reorganization energy for the FE states are obtained once the spectral density of the pigment–protein interaction is determined. As discussed in more depth later on in the Methods section, we set λ m m = 50 cm 1 for all of the FE states and ( m n ) λ m n = 3 λ m m = 150 cm 1 for all of the CT states. The zero-shift site energies are then evaluated for each of the 36 states (6 FE states and 30 CT states), the results from which are shown in Figure 5a. Note that the site energies of the FEs are identical to their zero-shift site energies, ε m m = ε m m 0 , due to Equation (6). To specify the CT–CT and FE–CT couplings, we further require the inclusion of A m n ( ± ) and a m n in the tunneling matrix elements of Equation (3). For these parameters, we aim to adjust the coupling between P D 2 * and P D 1 + P D 2 to be 75 cm 1 as given by Novoderezhkin et al. [26]. This can be achieved by taking A m n ( ± ) = 415 cm 1 assuming a m n = 4.5 Å [19]. These values are used for all m and n of m n for simplicity. The results of the coupling strength, | m + n | H ^ S | k + | for | m + n | k + , are shown in Figure 5b.
We now investigate how the population dynamics of the excited states depend on the level shifts of the pigments in the PSII RC. The populations of excited states are represented as the diagonal elements of the reduced density matrix, m + n | ρ ^ ( t ) | m + n . In order to see correlations among the FE and CT populations, we quantify the transfer efficiency by the time average of population for each state,
p ¯ m n = 1 τ 0 τ m + n | ρ ^ ( t ) | m + n d t ,
where τ is the time over which the average is computed. It has been observed in past experimental studies that the PSII RC strongly prefers the reduction to occur at Pheo D 1 , the pheophytin in the D1 branch. To characterize this asymmetry, we define the efficiency of electron transfer (ET) to Pheo D 1 by ET D 1 = m 5 6 p ¯ m 5 , and likewise the efficiency to Pheo D 2 by ET D 2 = m 6 6 p ¯ m 6 . Their difference,
Δ ET = ET D 1 ET D 2 ,
is a measure of the asymmetry. Δ ET > 0 stipulates that ET is more likely to occur at the D1 branch, as observed experimentally, while Δ ET < 0 specifies that ET is expected to occur at the D2 branch.

2.3. Level Shifts in the D1 Branch

As the starting point of the analysis of charge transfer phenomena in the PSII RC, we first set all of the level shifts to zero so that ϵ m n = ϵ m n 0 . Then, a simulation of the FE and CT states after the photo-excitation of the PSII RC by a δ pulse was run to visualize the population dynamics within the system. The result for the first ps of the simulation is shown in Figure 6. Although each of the 36 states (see Figure 5) are included in the computation, the populations are dominated by FE states while the contribution from CT states is limited. Within the FE states, a major transition is observed to occur during the first 0.4 ps. After this event, | 3 * and | 6 * steadily increase while the others decrease. This is mainly because | 3 * and | 6 * have the lowest site energies (see Figure 4b) within the D1 and D2 branches respectively and therefore act as sink sites of the exciton in the PSII RC. Similarly, the two CT populations of | 1 + 2 and | 2 + 1 seen in Figure 6 have the first and the second lowest zero-shift site energies respectively amongst all of the CT states (see Figure 5a). Considering this similarity, we therefore expect the CT states to become more excited as their site energies are lowered by manipulating the level shifts.
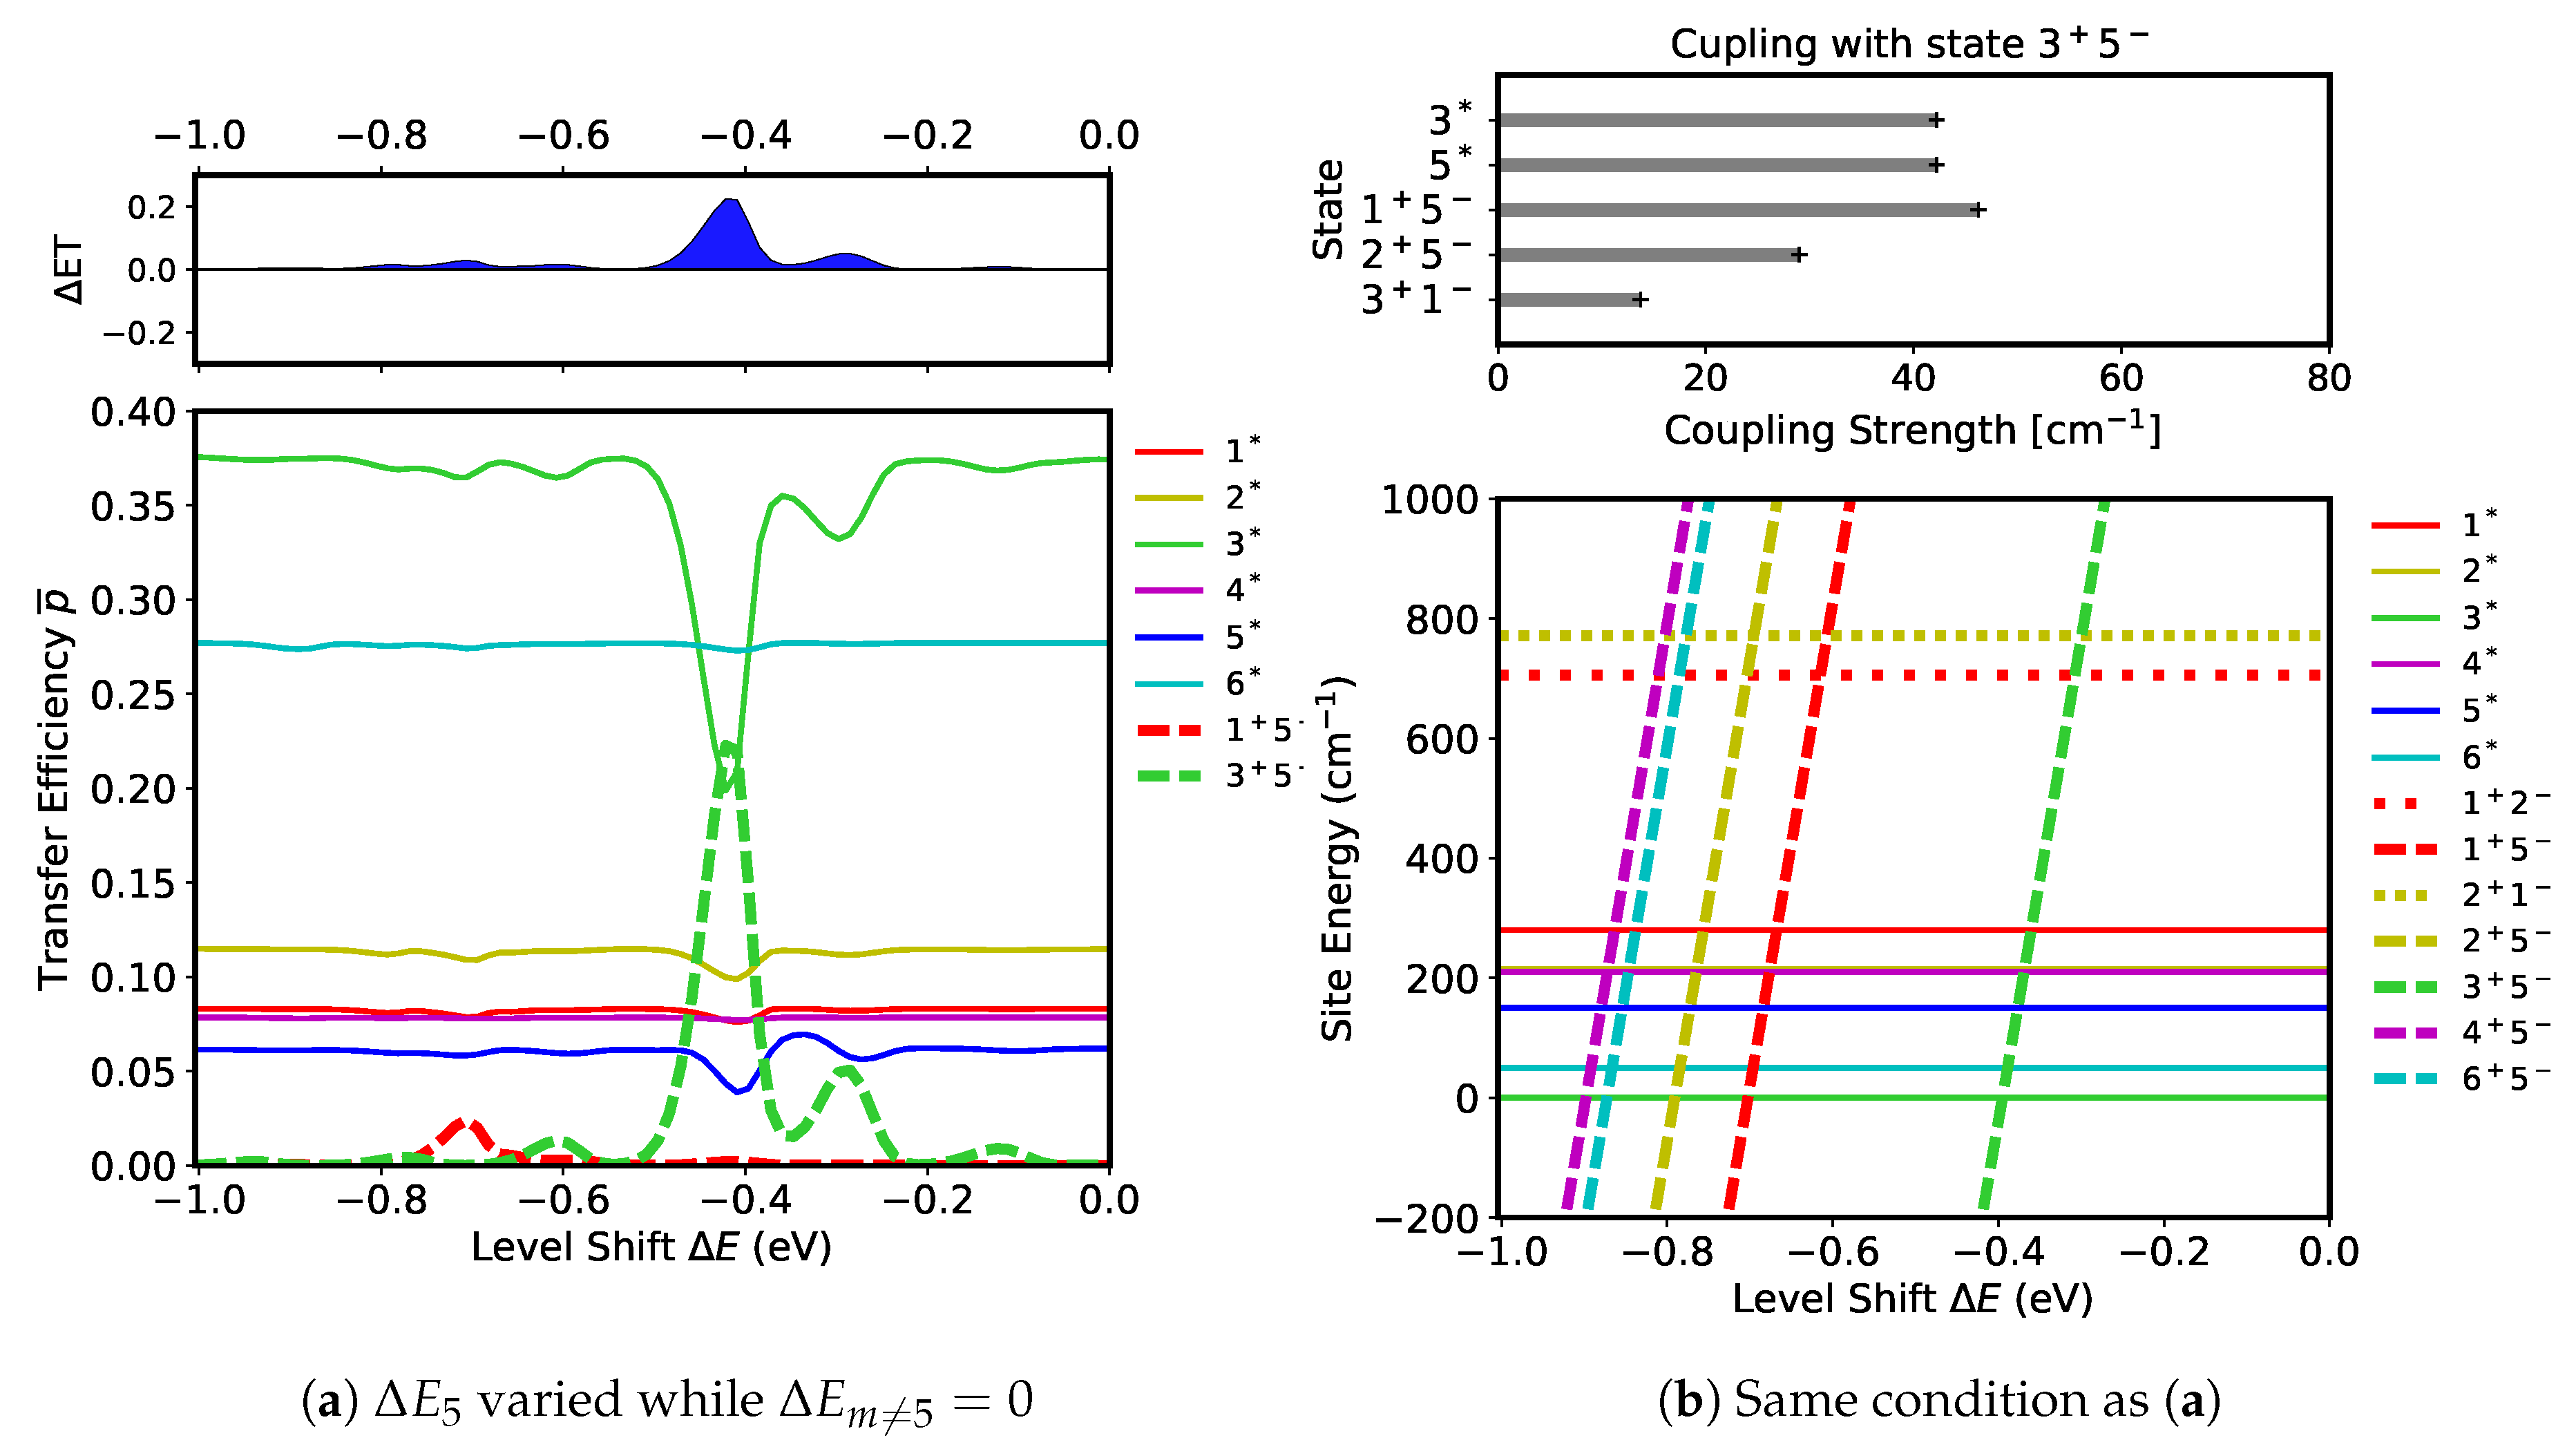
First, we evaluate which CT states can be excited if the level shifts are changed in the D1 branch. We begin by observing how the level shift at Pheo D 1 ( m = 5 ) , that is Δ E 5 , affects the transfer efficiency by maintaining all other level shifts at zero, Δ E m 5 = 0 . Simulations were run to obtain a range of Δ E 5 values to secure transfer efficiencies for τ = 1 (in Equation (7)). The results of the simulations are shown in Figure 7a. A remarkable feature can be seen in the data collected of the transfer efficiencies in the form of a large peak of p ¯ 35 (dashed green) at Δ E 5 = 0.422 eV ( = 3400 cm 1 ) accompanied by large fractional decreases in p ¯ 33 (solid green) and in p ¯ 55 (solid blue). This peak indicates that the CT state | 3 + 5 is being activated by the two FE states, | 3 * and | 5 * . This is interpreted as a formation of the radical pair Chl D 1 + Pheo D 1 by the photo-induced charge transfer process occurring between the excited molecules Chl D 1 * and Pheo D 1 * . In the upper panel of Figure 7a, there is a prominent positive peak in Δ ET associated with the formation of Chl D 1 + Pheo D 1 , representing an efficient electron transfer to Pheo D 1 . In addition to the large peak in p ¯ 35 , there is a very small peak of p ¯ 15 (dashed red) at Δ E 5 = 0.707 eV ( = 5700 cm 1 ) corresponding to a slight ET increase in the D1 branch.
The peaks in the transfer efficiencies can be interpreted in terms of resonance and coupling strength among the excited states. The site energies of the states for the range of Δ E 5 values are shown in Figure 7b. Resonance between the states can be induced when their site energies are close together, illustrated by the crossing points of the site energies in Figure 7b. The five CT states | m + 5 for m 5 whose site energies depend on Δ E 5 as ε m 5 = ε m 5 0 + Δ E 5 , have site energies which are seen to cross with all of the FE states within the parameter window. Inspecting Figure 7a, however, only two of them, ( | 3 + 5 and | 1 + 5 ), are found to be active in the actual dynamics. Such selection of CT states can be understood in terms of coupling strength between the excited states. The CT states strongly coupled with | 3 + 5 are shown in the upper panel of Figure 7b. The FE states, | 3 * and | 5 * , are both strongly coupled with | 3 + 5 , thus active transfers between these states can occur around the crossing point, Δ E 5 ε 35 0 = 0.395 eV . This is exactly what is observed in Figure 7a where Δ E 5 is lower than this value by the amount of ∼ 0.02 eV ( 150 cm 1 ) . This shift of the resonance point is on the order of 100 cm 1 , indicting that it can be induced by pigment-pigment and pigment–protein interactions. The CT state | 1 + 5 is also strongly coupled with | 3 + 5 . However, because their site energies do not cross each other, the charge transfer will not occur between them. Likewise, a transfer between | 2 + 5 and | 3 + 5 does not occur because their site energies also do not cross each other. The small peak of p ¯ 15 in Figure 7a is another result of resonance between | 1 + 5 and the FE states, | 1 * and | 5 * , around Δ E 5 ε 15 0 = 0.703 eV . However, the charge transfer here is not as active as that of | 3 + 5 because the populations of | 1 * and | 5 * are small (see Figure 7a). Additionally, the coupling strength between these FE states and | 1 + 5 is weak at 14 cm 1 (see Figure 5b), further restricting the CT activity. The rest of the linearly changing states in Figure 7b, which are | 2 + 5 , | 4 + 5 , and | 6 + 5 , remain inactive because none are coupled strongly enough with the FE states, as can be noted in Figure 5b. There is an additional small peak of p ¯ 35 at Δ E 5 = 0.285 eV ( = 2300 cm 1 ) in Figure 7a whose origin is yet to be identified.
Next, the effects of the level shift at Chl D 1 ( m = 3 ) on the transfer efficiencies are examined. Simulations were run for a range of Δ E 3 keeping all other level shifts unchanged at zero, Δ E m 3 = 0 . The results from these simulations are shown in Figure S1a of the Supplementary Materials. Remarkably, three large peaks of the CT states are seen in the transfer efficiency, p ¯ 13 (dash-dotted red) at Δ E 3 = 0.360 eV ( = 2900 cm 1 ), of p ¯ 53 (dash-dotted blue) at Δ E 3 = 0.409 eV ( = 3300 cm 1 ), and of p ¯ 23 (dash-dotted yellow) at Δ E 3 = 0.533 eV ( = 4300 cm 1 ). As shown in Figure S1b of the Supplementary Materials, these peaks correspond to the resonance of the three CT states, | 1 + 3 , | 5 + 3 , and | 2 + 3 , with FE states at their crossing points. Thus three radical pairs P D 1 + Chl D 1 , Pheo D 1 + Chl D 1 , and P D 2 + Chl D 1 are formed by this resonance. The site energies of | 4 + 3 and | 6 + 3 are also crossing with those of FE states (shown in Figure S1b), but they remain inactive because they are coupled only weakly with FE states, as can be seen in Figure 5b.
Now it must be considered how the population of the radical pair P D 1 + Pheo D 1 ( | 1 + 5 ) can dominate the terminal sate of the PSII RC. We do this by seeking charge transfer pathways that maximize the transfer efficiency p ¯ 15 . As can be seen in Figure 5b, the FE states do not couple strongly with | 1 + 5 , so | 1 + 5 needs to be excited by other CT states. We refer to such states as the primary CT states. Inspecting Figure 5b, | 1 + 5 is strongly coupled with | 1 + 3 , | 2 + 5 , | 3 + 5 , and | 4 + 5 . Meanwhile, | 2 + 5 and | 4 + 5 are not as active because they are only slightly coupled with the FE states. Since no coupling exists between | 1 + 3 and | 3 + 5 , they independently couple with | 1 + 5 . Thus, we have narrowed down the possibilities to the following two pathways: FEs | 1 + 3 | 1 + 5 and FEs | 3 + 5 | 1 + 5 . The first pathway depends on the activity of | 1 + 3 , which can be excited efficiently by the FE states around the resonance peak at Δ E 3 = 0.360 eV ε 13 0 as seen in Figure S1a of Supplementary Material. To activate the pathway, the Δ E 3 value is kept constant at 0.360 eV ( = 2900 cm 1 ) while Δ E 5 is adjusted to bring | 1 + 5 in resonance with | 1 + 3 . From ε 15 = ε 15 0 + Δ E 5 , we expect the resonance to happen around Δ E 5 ε 15 0 = 0.70 eV . To see how p ¯ 15 reacts to this adjustment, we ran simulations for a range of Δ E 5 values around the expected resonance value. The results are shown in Figure 8a. The peak of p ¯ 15 (dashed red) is seen at Δ E 5 = 0.744 eV ( = 6000 cm 1 ) which is around the expected point though shifted by 0.04 eV ( 300 cm 1 ). It is also evident that the increase in p ¯ 15 (dashed red) is correlated to the decrease in p ¯ 13 (dash-dotted red), demonstrating the resonant charge transfer between | 1 + 5 and | 1 + 3 .
The second possible pathway to excite P D 1 + Pheo D 1 is FEs | 3 + 5 | 1 + 5 . This pathway is expected to be active when these CT states are mutually in resonance by ε 35 ε 15 . From Figure 7a, we have gathered that the transfer efficiency of | 3 + 5 is maximized when ε 35 = ε 35 0 0.422 eV . Using Equation (6), this implies that the condition Δ E 3 = Δ E 5 + 0.422 eV will induce the highest activity of | 3 + 5 . To examine the activity of | 1 + 5 in the pathway, simulations were run for a range of Δ E 5 values under this condition. The results from these simulations are shown in Figure 8b. The peak of p ¯ 15 (dashed red) is observed at Δ E 5 = 0.744 eV ( = 6000 cm 1 ) accompanied by the largest decrease in p ¯ 35 , indicating that the pathway is most active at this point. Interestingly, we have obtained the same Δ E 5 value as that of the first pathway. This leads to Δ E 3 = 0.322 eV ( = 2600 cm 1 ) for the activation of the second pathway, which only deviates 0.038 eV ( 300 cm 1 ) from that of the first pathway.
The radical pair, P D 1 + Pheo D 1 ( | 1 + 5 ), can thus be excited efficiently from the FE states mediated by the two primary CT states, P D 1 + Chl D 1 ( | 1 + 3 ) and Chl D 1 + Pheo D 1 ( | 3 + 5 ). To visualize how these efficient pathways impact the population dynamics, simulations were run for an extended time up to 10 ps at T = 77 K . The result for the first pathway, FEs | 1 + 3 | 1 + 5 , is shown in Figure 9a. A very quick excitation of the radical pair is observed as its population (dashed red) reaches the greatest value within the first 2 ps. Paying close attention on the first 0.4 ps, the population dynamics of the FE states shown in the inset of Figure 9a are observed to be similar to those in Figure 6, except that the population of | 3 * in Figure 9a (solid green) does not increase monotonically but begins to decrease around 0.1 ps. This difference indicates that | 3 * is the primary donor of the excitation energy for the three CT states, | 1 + 5 , | 1 + 3 , and | 3 + 5 . From 0.4 ps to 2 ps , the population of | 1 + 5 continues to grow until it reaches its maximum value of 0.38 at 1.9 ps, whereas the populations of | 3 * and | 1 + 3 continue to decrease exponentially. Hence the radical pair P D 1 + Pheo D 1 causes the dominant population. After the first 2 ps, the excited CT states remain active by keeping their populations mostly steady but with a slow decrease in | 1 + 5 over time. Note that the population of | 6 * (solid cyan) appears to behave differently from other states because it belongs to the D2 branch. During the course of population change, Δ ET is always positive and increasing until t = 10 ps , indicating that the election continues to be transferred to the D1 branch through the interplay between | 1 + 5 and other states. As a result of this, ET D 1 and ET D 2 reaches 0.664 and 0.003, respectively, at 10 ps. This produces a Δ ET value of 0.661 in Figure 9a. Viewing the asymmetry by the ratio of these ET populations, that is ( ET D 1 ET D 2 ) / ( ET D 1 + ET D 2 ) = 99.1 % , it is suggested that ET in the PSII RC is extremely biased toward the D1 branch by the charge transfer pathway.
At the higher temperature of 300 K, the populations shown in Figure 9b appear to behave similarly to those at 77 K. The major transition at both temperatures happens within the first 3 ps and the population of | 1 + 5 is the largest. However, the population of | 1 + 5 is much lower with a maximum value of only 0.16 at 2.7 ps while other CT states appear to be more active at the higher temperature. In particular, the populations of | 1 + 2 (dotted red) and | 2 + 1 (dotted yellow) are more pronounced compared to those at 77 K, possibly due to thermal excitations induced in the FE and CT states via the system–bath coupling. In regard to the ET dynamics, the overall value of Δ ET is also lower but is still positive and increasing over time. At 10 ps, ET D 1 and ET D 1 are 0.411 and 0.012 respectively, making the asymmetry ratio of ( ET D 1 ET D 2 ) / ( ET D 1 + ET D 2 ) = 94 % . This large value indicates ET in the PSII RC is still substantially biased toward the D1 branch even at 300 K by the active pathway.
The result of our simulation for the second pathway, FEs | 3 + 5 | 1 + 5 , is shown in Figure S2 of Supplementary Material. The dynamics of | 1 + 5 are similar to those of the first pathway, but its initial ascent progresses slightly slower and overall population is about 3/4 as much of that of the first pathway. The population reaches its maximum value of 0.29 at 2.2 ps , and then decays slowly over time. Despite the lower population in the radical pair, the ET and its asymmetry are comparable to that of the first pathway. At 10 ps , ET D 1 and ET D 2 reaches 0.611 and 0.003 at 77 K, respectively, which amounts to the asymmetry ratio of ( ET D 1 ET D 2 ) / ( ET D 1 + ET D 2 ) = 98.9 % . At 300 K, ET D 1 and ET D 2 reach 0.476 and 0.011 respectively which produces a asymmetry ratio of 95.3 % . Thus, the ET is highly biased toward the D1 branch at both 77 K and 300 K.

2.4. Level Shifts in the D2 Branch

We now turn our attention to the other branch of the PSII RC, the D2 branch, which has been experimentally observed to be mostly inactive in ET dynamics. Here, we examine to what extent the D2 branch could be active in the PSII RC. In particular, we seek a pathway to activate the radical pair P D 2 + Pheo D 2 , the counter part of P D 1 + Pheo D 1 + in the D2 branch. As we have done for the D1 branch, we change the level shifts of the pigments in the D2 branch to maximize the transfer efficiency p ¯ 26 . For simplicity, we keep Δ E m = 0 for m = 2 , 3 , 5 , and adjust Δ E 4 and Δ E 6 to form a resonance that activates | 2 + 6 . The results of the simulations for a range of Δ E 4 values are shown in Figure S3a of the Supplementary Materials. By analogy with the FEs | 1 + 3 | 1 + 5 pathway of the D1 branch, we consider the FEs | 2 + 4 | 2 + 6 pathway here. The resonance peak of p ¯ 24 (dash-dotted yellow) is found at Δ E 4 = 0.384 eV ( = 3100 cm 1 ) , and thus we use this to search for the Δ E 6 value that maximizes p ¯ 26 . The results of the simulations are shown in Figure S3b of Supplementary Material. We locate the peak of p ¯ 26 (dashed yellow) at Δ E 6 = 0.694 eV ( = 5600 cm 1 ) .
With these values of level shifts, we see how the populations of the radical pair P D 2 + Pheo D 2 are formed through dynamics. The first 10 ps of the simulation run at 77 K is shown in Figure 10. Comparing this with Figure 9a, the behavior of active CT states are observed to be similar to their counter parts in the D1 branch, which are | 2 + 6 | 1 + 5 , | 4 + 6 | 3 + 5 , and | 2 + 4 | 1 + 3 . In particular, the major transitions that occur during the first 3 ps of the simulation and the population is dominated by the radical pair, | 2 + 6 . However, the maximum population of | 2 + 6 is recorded at 0.29 in Figure 10, so it is lower than its D1 counterpart, | 1 + 5 in Figure 9a, by a factor of 0.76. This ratio roughly holds for their subsequent populations after 3 ps. This difference in the populations of the radical pairs can be caused by the difference in molecular species of their primary donor sites. The donor of | 2 + 6 is the FE of a pheophytin | 6 * , whereas the donor of | 1 + 5 is the FE of a chlorophyll | 3 * . As can be seen in Figure 6, the initial populations of | 6 * and | 3 * in our simulations are 0.115 and 0.193 respectively which implies that the population of | 6 * is lower by a factor of 0.6. This is partly the consequence of the transition dipole moment of pheophytin and that of chlorophyll, which are 3.4 debye and 4.4 debye , respectively, making the ratio of oscillator strengths roughly ( 3.4 / 4.4 ) 2 = 0.6 . Thus, the activity of the radical pairs is largely affected by the intrinsic photo-activity of their donor FE states. Although the population of P D 2 + Pheo D 2 is low in Figure 10, the asymmetry in ET is strongly biased toward the D2 branch. This is quantified by the ET populations in the D1 and D2 branches, ET D 1 and ET D 2 which are 0.03 and 0.49 at 10 ps, respectively, yielding the asymmetry ratio of ( ET D 1 ET D 2 ) / ( ET D 1 + ET D 2 ) = 99 % , indicating the electron is almost certainly found in the D2 branch. This is the complete opposite to what is observed in experiments.

3. Discussion

Our results show that the activities of the CT states in the PSII RC depend highly on the level shifts representing the relative displacements in the molecular energy levels of the pigments. The level shifts control whether a CT state is resonant or not with the FE and other CT states. When a CT state is resonant and coupled with the photoactive FE states, it becomes the primary CT state. If the CT state is resonant and coupled instead with the primary CT state, it becomes the secondary CT state.
Our results also show that the energy landscape of the FE states is not the determining factor of the CT asymmetry in the PSII RC. It was demonstrated that the CT in the D2 branch could be activated by a specific arrangement of level shifts, even with the FE landscape favoring the D1 branch to be more excitonic than the D2 branch [11,18]. Thus our results suggest that in the naturally occurring PSII RC, the D1 branch is exclusively active as a consequence of the level shifts arranged in a way so that the CT states in the D1 branch are resonant with the FE states while those in the D2 branch are not.
The CT states thus activated in the D1 branch are seen to be robust around their corresponding resonances. Our results show that the widths of resonant peaks in the transfer efficiencies are around 0.05 eV (≃ 400 cm 1 ) (see Figure 8). This is in agreement with experimental results which show that the static disorders of the CT states are much larger than those of the FE states which are typically around 50 cm 1 [20,21]. Based on this, we speculate that the site energy disorders of CT states are induced by fluctuations of the level shifts (difference in HOMO levels between pigments, see Figure 3c) in the PSII RC. Meanwhile, the disorders of FE states are due to fluctuations of HOMO-LUMO gaps within individual pigments [11,18]. Therefore the hypothesis can be tested by examining the correlations between the disorders of the CT states based on Equation (6).
Concerning the timescale, our simulations suggest that the formation of the primary CT states, Chl D 1 + Pheo D 1 and P D 1 + Chl D 1 , occurs during the first 0.4 ps after the initial photo-excitation, followed by the formation of the secondary CT state, P D 1 + Pheo D 1 , within the first 2 ps at 77 K and 3 ps at 300 K (see Figure 9). On the formation of the primary CT states, our result is largely consistent with a sub-pico-second timescale for the reduction rate of Pheo D 1 obtained experimentally by Groot et al. [12] and then further quantified to 0.3 ps by Raszewski and Renger [9,27]. This is also similar to the timescale of the FE dynamics (see Figure 6) as the strength of coupling between the FEs and the primary CT states (∼ 40 cm 1 ) is similar to the FE–FE couplings in the D1 branch. However, several experiments using two-dimensional electronic spectroscopy have reported pico-second timescales; 1–3 ps at 77 K by Myers et al. [28] and 1.5 ps at room temperature by Duan et al. [29]. Furthermore, on the formation of the secondary CT state, Groot et al. [12] reported a time scale of 6 ps for the oxidation of P D 1 at room temperature, which is about two times larger than our result. These experimental results indicate that the FE–CT and CT–CT couplings are likely to be weaker than those we used here, so the off-diagonal elements of the tunneling matrix (Equation (3) for m n ) needs to be refined in future work.
Another prospect to examine is an additional CT pathway involving the central pair, P D 1 + P D 2 and P D 2 + P D 1 , which has been proposed by van Grondelle and coworkers [13,14,15,16]. Although we did not explore this possibility here, such a pathway can be realized in our model by carefully adjusting the level shift Δ E 2 while keeping all other CT states in the D2 branch off resonant with the FE and CT states.
In this work, we focused on how the level shifts can contribute to producing the CT asymmetry seen in the PSII RC. For this naturally occurring complex, we estimate that the HOMO levels in the D1 branch are progressively lowered from P D 1 to Chl D 1 and Chl D 1 to Pheo D 1 roughly by the interval of ∼ 0.35 eV , which amounts to ∼ 19 % of the FE site energy of each pigment. We theroize that such shifts may be realized by the pigment–protein interactions. However, it is still a question as to which particular interactions at each of the pigment sites can cause such ideal displacements between the energy levels. Additionally, we did not consider the site dependence of the off-diagonal elements of the tunneling matrix which can also contribute to the CT asymmetry. We anticipate that further theoretical investigations using ab initio approach, such as MD and QM/MM, can reveal the precise nature of the local molecular energy levels in the PSII RC.

4. Methods

4.1. Tight-Biding Model of Molecular Excitations and Pigment–Protein Interactions

In the tight-binding model, the excited states | m + n of PPC are constructed by using two sets of fermionic operators, c ^ m and d ^ m for m = 1 , 2 , M , satisfying the anti-commutation relations for arbitrary m and n, c ^ m , c ^ n = d ^ m , d ^ n = 0 , and c ^ m , c ^ n = d ^ m , d ^ n = δ m n . As c ^ m and d ^ m belong to different degrees of freedom, the commutation relations hold as c ^ m , d ^ n = c ^ m , d ^ n = c ^ m , d ^ n = c ^ m , d ^ n = 0 . The ground state has been chosen to be the simultaneous zero-eigenvalue state of c ^ m and d ^ n , that is c ^ m | 0 = d ^ n | 0 = 0 . The operator c ^ m ( d ^ m ) creates an electron (hole) in LUMO (HOMO) at pigment m by acting on the ground state. Thus the excited state | m + n = c ^ n d ^ m | 0 has one hole in HOMO at pigment m and one electron in LUMO at pigment n. Then the structure of pigment excitations in a PPC is modeled as
H ^ S = m M n M t m n ( + ) d ^ m d ^ n + t m n ( ) c ^ m c ^ n + U m n c ^ n c ^ n d ^ m d ^ m + V m n c ^ m c ^ n d ^ m d ^ n .
Then the matrix elements of H ^ S in the excited-state representation are readily obtained as given in Equation (1) by using the commutation and anti-commutation relations.
The bath of vibrations originated in proteins and solvent is modeled by simple harmonic oscillators [23]. We allow them to vibrate independently at each pigment site. By decomposing the vibrations into normal modes, the bath is described by the annihilation (creation) operators for the ξ th normal mode, b ^ m ξ ( b ^ m ξ ), satisfying the bosonic commutation relation [ b ^ m ξ , b ^ m ξ ] = δ m m δ ξ ξ . The bath Hamiltonian is then written as H ^ B = m M ξ ω ξ b ^ m ξ b ^ m ξ + 1 / 2 . Introducing a dimensionless position operator by Q ^ m ξ = b ^ m ξ + b ^ m ξ , the system–bath coupling is then modeled [30] as
H ^ S B = m M c ^ m c ^ m d ^ m d ^ m ξ ω ξ g m ξ Q ^ m ξ + m M n m M c ^ n c ^ n d ^ m d ^ m ξ ω ξ g m ξ ( + ) Q ^ m ξ + g n ξ ( ) Q ^ n ξ ,
where n m M runs for all values of n except m. Here the first term of Equation (10) describes the coupling between the vibration and the electron–hole pair in the FE states at pigment m with the strength g m ξ , and the second term describes the coupling between the vibration and individual electrons (holes) in the CT states at strength g n ξ ( ) ( g m ξ ( + ) ). We further assume that the coupling constants of the CT states are proportional to that of the FE states, g m ξ ( ± ) = s m ( ± ) g m ξ , with site-dependent scaling factors s m ( ± ) . By this assumption, the system–bath coupling Hamiltonian is simplified as
H ^ S B = m M s ^ m ξ ω ξ g m ξ Q ^ m ξ ,
where the site-dependent coupling operator s ^ m has been defined by
s ^ m = | m * m * | + s m ( + ) n m M | m + n m + n | + s m ( ) n m M | n + m n + m | .
By virtue of the form of Equation (11), the nature of system–bath interaction is captured by the spectral density, J m ( ω ) = ω 2 ξ g m ξ 2 δ ( ω ω ξ ) . The reorganization energy at pigment m is then defined using the spectral density as λ m = 0 J m ( ω ) d ω / ω . Since the system–bath coupling (Equation (10)) depends on the operator c ^ n c ^ n d ^ m d ^ m , it gives rise to a renormalization of the interaction potentials U m n in Equation (9). This renormalization is made by U m n = U m n ( C ) + λ m n , where U m n ( C ) is the Coulomb interaction potential of the hole–electron pair of Equation (5), and λ m n is given by λ m m = λ m and λ m n = ( s m ( + ) ) 2 λ m + ( s n ( ) ) 2 λ n for m n , which cancels the shifts of potential minima induced by the system–bath interaction. We refer to λ m n as the reorganization energy of the excited state | m + n .
For the model of PSII RC, we employed the spectral density of low-frequency fluctuation by Gelzinis et al. [21],
J m ( ω ) = j = 1 2 Λ j 2 ω Ω j 3 e ω / Ω j ,
where Λ 1 = 15 cm 1 , Λ 2 = 35 cm 1 , Ω 1 = 20 cm 1 , and Ω 2 = 80 cm 1 . This yields the reorganization energy of FE states λ m = 50 cm 1 . For the scaling factors in Equation (12), we simplify them by s m ( + ) = s m ( ) = 3 / 2 , yielding the reorganization energy of CT sates λ m n = 3 λ m = 150 cm 1 .

4.2. Photo Excitation of the PPC

We consider initial state of PPC prepared by photo-excitation. The transition dipole operator is defined by D ^ = m M μ m ( c ^ m d ^ m + c ^ m d ^ m ) , where μ m is the transition dipole moment of pigment m. This operator acts on the ground state to yield the transition dipole,
μ a ( ex ) = E a | D ^ | 0 = m M μ m E a | m * ,
where | E a is the ath eigenstate of H ^ S , satisfying H ^ S | E a = E a | E a . The total number of the eigenstates is the number of FE states (M) plus that of CT states. The oscillator strength of the ath eigenstate is then obtained as | μ a ( ex ) | 2 . With the transition dipole thus defined, the initial state of PPC is made by the δ pulse as E a | ρ ^ ( 0 ) | E b μ a ( ex ) · μ b ( ex ) [31].

4.3. Computing Quantum Dynamics with the Scalable QuAPI Method

The quantum dynamics of our model is described with the theory of open quantum systems which uses the reduced density operator ρ ^ ( t ) [23,32]. This contains all of the information about the system under the influence of a thermal bath of temperature T. For numerical computations of ρ ^ ( t ) , we employ the scalable QuAPI method (S-QuAPI) [22] which is one of the recent updates of the quasi-adiabatic propagator path integral (QuAPI) scheme [33,34,35,36] for enhanced scalability and memory efficiency to deal with large quantum systems such as our model of the PSII RC. The method has been designed to be most effective for the modern architecture of massively-parallel platforms. For our simulations, we use a high-performance computer cluster utilizing 12 units of NVIDIA Tesla K80 GPU.
S-QuAPI has three parameters to control its accuracy of dynamics, which are the time slice of path integral Δ t , the number of time steps for preserving the memory effect Δ k max , and the threshold ϑ for dropping insignificant propagators from computations. The method is both non-Markovian and non-perturbative converging to the exact result at the limit of Δ t 0 , Δ k max , and ϑ = 0 . Thus an approximation is made by setting finite values for these parameters. For our simulations, we set Δ t = 25 fs and Δ k max = 3 for all computations and optimized the ϑ values in between 5.0 × 10 6 and 1.0 × 10 5 depending on time t for which ρ ^ ( t ) is evaluated. In general, smaller ϑ is required for larger t to achieve better accuracy [22].

Supplementary Materials

The following are available online at https://www.mdpi.com/2073-4344/10/6/718/s1, Figure S1: Transfer efficiencies, site energy change, and coupling strength, Figure S2: Population and Δ ET dynamics of FE and CT states for the CT pathway of FEs | 3 + 5 | 1 + 5 , Figure S3: Transfer efficiencies and Δ ET with τ = 1 ps at T = 77 K .

Author Contributions

Conceptualization, Y.S. and D.S.; methodology, Y.S.; software, Y.S.; validation, Y.S. and D.S.; formal analysis, Y.S.; investigation, Y.S. and D.S.; resources, Y.S.; data curation, Y.S.; writing–original draft preparation, Y.S. and D.S.; writing–review and editing, Y.S. and D.S.; visualization, Y.S. and D.S.; supervision, Y.S.; project administration, Y.S.; funding acquisition, Y.S. All authors have read and agreed to the published version of the manuscript.

Funding

This research received no external funding.

Acknowledgments

Y.S. gratefully acknowledges the support from a Research and Professional Development Grant of Gettysburg College.

Conflicts of Interest

The author declares no conflict of interest.

Abbreviations

The following abbreviations are used in this manuscript:
CTcharge transfer
RCreaction center
PSIIphotosystem II
PSII RCreaction cetner of photosystem II
OECoxygen evolving complex
ATPadenosine triphosphate
MDmolecular dynamics
QM/MMquantum mechanics/molecular mechanics
PPCpigment–protein complex
HOMOhighest occupied molecular orbital
LUMOlowest unoccupied molecular orbital
FEFrenkel exciton
ETelectron transfer
QuAPIquasi-adiabatic propagator path integral
S-QuAPIscalable QuAPI
GPUgraphics processing unit

Appendix A. Model Parameters for the PSII RC

Table A1. FE site energies (diagonal) adapted from Gelzinis et al. [21] and FE–FE couplings (off-diagonal) from Shibata et al. [25]. All numbers are in units of cm 1 . The site energies are subtracted by 14 , 800 cm 1 for clarity.
State P D 1 * P D 2 * Chl D 1 * Chl D 2 * Pheo D 1 * Pheo D 2 *
P D 1 * 280158 27.32 41.83 3.96 12.61
P D 2 * 158215 46.77 22.04 15.06 2.99
Chl D 1 * 27.32 46.77 0 3.54 43.51 2.18
Chl D 2 * 41.83 22.04 3.54 210 2.37 41.65
Pheo D 1 * 3.96 15.06 43.51 2.37 150 1.55
Pheo D 2 * 12.61 2.99 2.18 41.65 1.55 50
Table A2. Data of pigment sites adapted from Gelzinis et al. [21]. The coordinates of geometric center of pigment, R = ( R x , R y , R z ) , are in units of Å, and the transition dipole moment of pigment, μ = ( μ x , μ y , μ z ) , are in units of debye.
Pigmentm R x R y R z μ x μ y μ z
P D 1 1 37.87 4.05 11.99 1.08 3.74 2.05
P D 2 2 32.57 9.55 11.12 0.66 3.73 2.24
Chl D 1 3 30.65 2.13 9.30 0.33 4.06 1.67
Chl D 2 4 40.19 15.45 8.24 0.11 4.04 1.74
Pheo D 1 5 33.73 4.13 0.31 1.65 0.55 2.92
Pheo D 2 6 36.67 16.71 1.41 1.77 0.19 2.90

References

  1. Blankenship, R.E. Molecular Mechanisms of Photosynthesis, 2nd ed.; Wiley Blackwell: Hoboken, NJ, USA, 2014. [Google Scholar]
  2. Kouřil, R.; Dekker, J.P.; Boekema, E.J. Supramolecular organization of photosystem II in green plants. Biochim. Biophys. Acta Bioenerg. 2012, 1817, 2–12. [Google Scholar] [CrossRef] [PubMed] [Green Version]
  3. Umena, Y.; Kawakami, K.; Shen, J.R.; Kamiya, N. Crystal structure of oxygen-evolving photosystem II at a resolution of 1.9Å. Nature 2011, 473, 55–60. [Google Scholar] [CrossRef]
  4. Yano, J.; Kern, J.; Sauer, K.; Latimer, M.J.; Pushkar, Y.; Biesiadka, J.; Loll, B.; Saenger, W.; Messinger, J.; Zouni, A.; et al. Where water is oxidized to dioxygen: Structure of the photosynthetic Mn4Ca cluster from X-ray spectroscopy. Science 2006, 314, 821–825. [Google Scholar] [CrossRef] [PubMed] [Green Version]
  5. Vinyard, D.J.; Ananyev, G.M.; Charles Dismukes, G. Photosystem II: The Reaction Center of Oxygenic Photosynthesis. Annu. Rev. Biochem. 2013, 82, 577–606. [Google Scholar] [CrossRef] [PubMed] [Green Version]
  6. Rhee, K.H.R.; Morris, E.P.; Barber, J.; Kühlbrandt, W. Three-dimensional structure of theplant photosystem II reactioncentreat 8A resolution. Nature 1998, 396, 283–286. [Google Scholar] [CrossRef] [PubMed]
  7. Diner, B.A.; Schlodder, E.; Nixon, P.J.; Coleman, W.J.; Rappaport, F.; Lavergne, J.; Vermaas, W.F.; Chisholm, D.A. Site-directed mutations at D1-His198 and D2-His197 of photosystem II in Synechocystis PCC 6803: Sites of primary charge separation and cation and triplet stabilization. Biochemistry 2001, 40, 9265–9281. [Google Scholar] [CrossRef] [Green Version]
  8. Rappaport, F.; Diner, B.A. Primary photochemistry and energetics leading to the oxidation of the (Mn)4Ca cluster and to the evolution of molecular oxygen in Photosystem II. Coord. Chem. Rev. 2008, 252, 259–272. [Google Scholar] [CrossRef]
  9. Renger, T.; Schlodder, E. Primary photophysical processes in photosystem II: Bridging the gap between crystal structure and optical spectra. ChemPhysChem 2010, 11, 1141–1153. [Google Scholar] [CrossRef]
  10. Nelson, N.; Yocum, C.F. Structure and Function of Photosystems I and II. Annu. Rev. Plant Biol. 2006, 57, 521–565. [Google Scholar] [CrossRef] [Green Version]
  11. Müh, F.; Plöckinger, M.; Renger, T. Electrostatic Asymmetry in the Reaction Center of Photosystem II. J. Phys. Chem. Lett. 2017, 8, 850–858. [Google Scholar] [CrossRef]
  12. Groot, M.L.; Pawlowicz, N.P.; Van Wilderen, L.J.; Breton, J.; Van Stokkum, I.H.; Van Grondelle, R. Initial electron donor and acceptor in isolated Photosystem II reaction centers identified with femtosecond mid-IR spectroscopy. Proc. Natl. Acad. Sci. USA 2005, 102, 13087–13092. [Google Scholar] [CrossRef] [PubMed] [Green Version]
  13. Novoderezhkin, V.I.; Dekker, J.P.; Van Grondelley, R. Mixing of exciton and charge-transfer states in photosystem II reaction centers: Modeling of stark spectra with modified redfield theory. Biophys. J. 2007, 93, 1293–1311. [Google Scholar] [CrossRef] [PubMed] [Green Version]
  14. Romero, E.; Van Stokkum, I.H.; Novoderezhkin, V.I.; Dekker, J.P.; Van Grondelle, R. Two different charge separation pathways in photosystem II. Biochemistry 2010, 49, 4300–4307. [Google Scholar] [CrossRef] [PubMed] [Green Version]
  15. Novoderezhkin, V.I.; Romero, E.; Dekker, J.P.; Van Grondelle, R. Multiple charge-separation pathways in photosystem II: Modeling of transient absorption kinetics. ChemPhysChem 2011, 12, 681–688. [Google Scholar] [CrossRef] [PubMed]
  16. Romero, E.; Diner, B.A.; Nixon, P.J.; Coleman, W.J.; Dekker, J.P.; Van Grondelle, R. Mixed exciton-charge- transfer states in photosystem II: Stark spectroscopy on site-directed mutants. Biophys. J. 2012, 103, 185–194. [Google Scholar] [CrossRef] [Green Version]
  17. Romero, E.; Novoderezhkin, V.I.; Van Grondelle, R. Quantum design of photosynthesis for bio-inspired solar-energy conversion. Nature 2017, 543, 355–365. [Google Scholar] [CrossRef]
  18. Zhang, L.; Silva, D.A.; Zhang, H.; Yue, A.; Yan, Y.; Huang, X. Dynamic protein conformations preferentially drive energy transfer along the active chain of the photosystem II reaction centre. Nat. Commun. 2014, 5, 4170/1–4170/9. [Google Scholar] [CrossRef] [PubMed] [Green Version]
  19. Abramavicius, D.; Mukamel, S. Energy-transfer and charge-separation pathways in the reaction center of photosystem II revealed by coherent two-dimensional optical spectroscopy. J. Chem. Phys. 2010, 133, 184501. [Google Scholar] [CrossRef] [Green Version]
  20. Gelzinis, A.; Valkunas, L.; Fuller, F.D.; Ogilvie, J.P.; Mukamel, S.; Abramavicius, D. Tight-binding model of the photosystem II reaction center: Application to two-dimensional electronic spectroscopy. New J. Phys. 2013, 15, 075013. [Google Scholar] [CrossRef]
  21. Gelzinis, A.; Abramavicius, D.; Ogilvie, J.P.; Valkunas, L. Spectroscopic properties of photosystem II reaction center revisited. J. Chem. Phys. 2017, 147. [Google Scholar] [CrossRef]
  22. Sato, Y. A scalable algorithm of numerical real-time path integral for quantum dissipative systems. J. Chem. Phys. 2019, 150, 224108. [Google Scholar] [CrossRef] [PubMed]
  23. May, V.; Kühn, O. Charge and Energy Transfer Dynamics in Molecular Systems, 3rd ed.; Wiley-VCH: Weinheim, Germany, 2011. [Google Scholar]
  24. Renger, T.; Schlodder, E. Optical properties, excitation energy and primary charge transfer in photosystem II: Theory meets experiment. J. Photochem. Photobiol. B Biol. 2011, 104, 126–141. [Google Scholar] [CrossRef]
  25. Shibata, Y.; Nishi, S.; Kawakami, K.; Shen, J.R.; Renger, T. Photosystem II does not possess a simple excitation energy funnel: Time-resolved fluorescence spectroscopy meets theory. J. Am. Chem. Soc. 2013, 135, 6903–6914. [Google Scholar] [CrossRef] [PubMed]
  26. Novoderezhkin, V.I.; Romero, E.; Prior, J.; Van Grondelle, R. Exciton-vibrational resonance and dynamics of charge separation in the photosystem II reaction center. Phys. Chem. Chem. Phys. 2017, 19, 5195–5208. [Google Scholar] [CrossRef] [PubMed] [Green Version]
  27. Raszewski, G.; Renger, T. Light harvesting in photosystem II core complexes is limited by the transfer to the trap: Can the core complex turn into a photoprotective mode? J. Am. Chem. Soc. 2008, 130, 4431–4446. [Google Scholar] [CrossRef] [PubMed]
  28. Myers, J.A.; Lewis, K.L.; Fuller, F.D.; Tekavec, P.F.; Yocum, C.F.; Ogilvie, J.P. Two-dimensional electronic spectroscopy of the D1-D2-cyt b559 photosystem II reaction center complex. J. Phys. Chem. Lett. 2010, 1, 2774–2780. [Google Scholar] [CrossRef] [Green Version]
  29. Duan, H.G.; Prokhorenko, V.I.; Wientjes, E.; Croce, R.; Thorwart, M.; Miller, R.J. Primary Charge separation in the Photosystem II reaction center revealed by a global analysis of the two-dimensional electronic spectra. Sci. Rep. 2017, 7, 12347. [Google Scholar] [CrossRef] [Green Version]
  30. Hestand, N.J.; Kazantsev, R.V.; Weingarten, A.S.; Palmer, L.C.; Stupp, S.I.; Spano, F.C. Extended-Charge- Transfer Excitons in Crystalline Supramolecular Photocatalytic Scaffolds. J. Am. Chem. Soc. 2016, 138, 11762–11774. [Google Scholar] [CrossRef] [Green Version]
  31. Renger, T.; Klinger, A.; Steinecker, F.; Schmidt am Busch, M.; Numata, J.; Müh, F. Normal Mode Analysis of the Spectral Density of the Fenna-Matthews-Olson Light-Harvesting Protein: How the Protein Dissipates the Excess Energy of Excitons. J. Phys. Chem. B 2012, 116, 14565–14580. [Google Scholar] [CrossRef]
  32. Weiss, U. Quantum Dissipative Systems, 3rd ed.; World Scientific: Singapore, 2008. [Google Scholar]
  33. Makri, N.; Makarov, D.E. Tensor propagator for iterative quantum time evolution of reduced density matrices. II. Numerical methodology. J. Chem. Phys. 1995, 102, 4611–4618. [Google Scholar] [CrossRef]
  34. Makri, N. Numerical path integral techniques for long time dynamics of quantum dissipative systems. J. Math. Phys. 1995, 36, 2430–2457. [Google Scholar] [CrossRef]
  35. Richter, M.; Fingerhut, B.P. Coarse-grained representation of the quasi adiabatic propagator path integral for the treatment of non-Markovian long-time bath memory. J. Chem. Phys. 2017, 146, 214101. [Google Scholar] [CrossRef] [PubMed]
  36. Strathearn, A.; Lovett, B.W.; Kirton, P. Efficient real-time path integrals for non-Markovian spin-boson models. New J. Phys. 2017, 19, 093009. [Google Scholar] [CrossRef] [Green Version]
Figure 1. Pigments and plastoquinones in the D1 and D2 proteins from 3WU2 provided by the Protein Data Bank [3]. The oxygen-evolving complex (OEC) and the bicarbonate ligand (BCT) are also shown.
Catalysts 10 00718 g001
Figure 2. The ground and excited states in the PPC. Electrons and holes are represented by filled circles and open circles respectively. The arrows show how the excited states are created from the ground state by the transfer of an electron from HOMO to LUMO. (a) All of the HOMOs are occupied in the ground state, | 0 . (b) The excited state, |m+n〉, is created by transferring an electron from the HOMO at pigment m to the LUMO at pigment n. (c) The FE state is a special case of |m+n〉 in which electron transfer is made within the same pigment (n = m).
Catalysts 10 00718 g002
Figure 3. The diagonal elements of the tunneling matrix and the level shift. Filled and open circles represent electrons and holes respectively and VAC represents the vacuum level whose energy value is zero. The arrows with dashed lines represent the direction of electron transfer. (a) t m m ( + ) is the amount of energy to create a hole in HOMO. (b) t m m ( ) is the amount of energy to create an electron in LUMO. (c) The level shift ΔEm is the energy gap between the HOMO of pigment m and that of pigment 1; E m ( H O M O ) E l ( H O M O ) .
Catalysts 10 00718 g003
Figure 4. PSII RC pigments selected for the model. (a) Configuration of the chlorophylls and pheophytins extracted from PDB 3WU2 [3]. (b) FE site energies from Gelzinis et al. [21] and major couplings from Shibata et al. [25]. In each circle, the number on the top is the reference number assigned to the pigment and the number on the bottom is the site energy in units of cm−1 subtracted by 14, 800 cm−1. Lines connecting the circles indicate FE–FE couplings of an absolute value greater than 10 cm−1. Their values are shown by the numbers along the line in units of cm−1.
Catalysts 10 00718 g004
Figure 5. (a) The zero-shift site energy ε m n 0 in units of eV. All of the values are subtracted by 14, 800 cm−1 = 1.835 eV. The color code corresponds to that of Figure 4 for the pigment at which the hole resides. (b) The coupling strength between states in units of cm−1 which are the magnitudes of the off-diagonal elements (|m+n〉 ≠ |k+〉) of the system Hamiltonian given earlier in Equation (1).
Catalysts 10 00718 g005
Figure 6. Population dynamics of FE and CT states at T = 77 K . All of the levels shifts are set to zero, Δ E m = 0 for m = 2 , , 6 . All of the 36 states in Figure 5 are used for computation, but those of populations less than 0.01 are not displayed.
Catalysts 10 00718 g006
Figure 7. Transfer efficiencies, ΔET, site energy change, and coupling strength. (a) Transfer efficiencies and ΔET have been computed with values τ = 1 ps and T = 77K for a range of level shift at PheoD1, ΔE5. The level shift at other pigments are all zero as Δ E m 5 = 0 . The CT states of less than 0.02 transfer efficiencies are not displayed. (b) The site energies #mn are shown for the values of ΔE5. The top panel shows the major states coupled with |3+5〉, extracted from Figure 5b for those above 10 cm−1.
Catalysts 10 00718 g007
Figure 8. Transfer efficiencies and ΔET with τ = 1 ps at 77K. CT states whose transfer efficiencies are less than 0.02 are not displayed. ΔEm = 0 for m = 2, 4, 6. (a) The level shift ΔE5 varied while ΔE3 = −2900 cm−1. (b) The level shift ΔE5 varied while ΔE3 = ΔE5 + 3400 cm−1.
Catalysts 10 00718 g008
Figure 9. Population and Δ ET dynamics of FE and CT states for the CT pathway of FEs | 1 + 3 | 1 + 5 Out of the 36 states used for computations, only the selected 14 states are displayed for clarity. The levels shifts are set to Δ E 3 = 2900 cm 1 , Δ E 5 = 6000 cm 1 , and Δ E 2 = Δ E 4 = Δ E 6 = 0 . ΔET at each moment of time t has been computed by setting τ = t in Equation (7). The insets show the populations for the first 400 fs. (a) Results for 77 K. (b) Results for 300 K.
Catalysts 10 00718 g009
Figure 10. Population and Δ ET dynamics of FE and CT states at 77 K. Out of the 36 states used for computations, only the selected 14 states are displayed for clarity. The level shifts are set to Δ E 4 = 3100 cm 1 , Δ E 6 = 5600 cm 1 , and Δ E 2 = Δ E 3 = Δ E 5 = 0 to activate FEs | 2 + 4 | 2 + 6 pathway.
Catalysts 10 00718 g010

