Article

Self-Nitrogen-Doped Carbon Nanosheets Modification of Anodes for Improving Microbial Fuel Cells’ Performance

1
Key Laboratory of Enhanced Heat Transfer and Energy Conservation, Ministry of Education, College Environmental and Energy Engineering, Beijing University of Technology, Beijing 100124, China
2
Key Laboratory of Low-Grade Energy Utilization Technologies and Systems, Ministry of Education, Chongqing University, Chongqing 400030, China
*
Author to whom correspondence should be addressed.
Catalysts 2020, 10(4), 381; https://doi.org/10.3390/catal10040381
Submission received: 7 February 2020 / Revised: 26 March 2020 / Accepted: 30 March 2020 / Published: 1 April 2020
(This article belongs to the Special Issue Catalysts for Microbial Fuel Cells)

Abstract

:
Dandelion seeds (DSs) have the advantages of high nitrogen content, low cost and easy availability and thus are ideal carbon precursors for fabricating carbon nanomaterials. Herein, this paper prepared a carbon nanosheet material by one-step carbonizing DSs with KOH activation (self-doped-nitrogen porous carbon nanosheets (N-CNS)) and without KOH activation (unactivated self-doped-nitrogen porous carbon nanosheets (N-UA-CNS)), which could dope nitrogen atoms directly into carbon materials without additional processes. Scanning electron microscopy(SEM) images and X-ray diffraction(XRD) patterns both showed that N-CNS was of macro-porous structure, and beneficial for microorganisms’ growth. The Brunauer Emmett Teller(BET) surface area of N-CNS was 2107.5 m2 g−1, which was much higher than that of N-UA-CNS. After carbon clothes were modified by the obtained materials, the internal resistance of both N-CNS-modified carbon cloth (N-CNS-CC) and N-UA-CNS-modified carbon cloth (N-UA-CNS-CC) was greatly reduced and was found to be only 2.7 Ω and 4.0 Ω, respectively which are all significantly smaller than that of blank carbon cloth (65.1 Ω). These electrodes were assembled in microbial fuel cells (MFCs) as anode, and the operation experiments showed that the N-CNS modification shortened start-up time, improved output stability and increased maximum output voltage significantly. The maximum power density of N-CNS-CC MFC was 1122.41 mW m−2 which was 1.3 times of that of N-UA-CNS-CC MFC and 1.6 times of that of CC MFC. The results demonstrated that N-CNS was an ideal modification material for fabricating MFC anodes with simple preparation process and low cost.

1. Introduction

Microbial fuel cell (MFC) is a new method that can treat wastewater and generates electrical energy simultaneously, and has broad application prospects [1,2]. MFCs use bacteria as catalysts to treat wastewater and produce bioelectric energy [1,2,3]. During this reaction, the most imperative process is electron transfer between microorganisms and anode which takes place in an anode chamber. The electron transport efficiency depends on the multiplication of electricigens in/on the anode, and the properties of anode material affect the growth of electricigens. Therefore, screening anode materials of high conductivity, good biocompatibility, large specific surface area and low cost has become one of MFCs research hotspots.
Conventional carbon materials such as carbon cloth [4], graphite rod [5] and carbon paper [6] have long been considered as ideal MFC anode material because of their good conductivity and biocompatibility. In order to improve MFC performance, carbon nanomaterials such as graphene, carbon nanotubes have been widely used to modify conventional carbon material because of their large specific area, good biocompatibility and high conductivity. Chen et al. [7] proposed a porous carbon material of defined pore size as a carbon nano-modified material which delivered a power output of 1060 W m−2. Hou et al. [8] used graphene modified carbon cloth as MFC anode to obtain a maximum power density of 653 m W m−2. Nguyen et al. [9] used multiwalled carbon nanotubes as catalyst support and anneal iron salts to prepare low-cost and high catalytic activity towards oxygen reduction reaction iron-chelated catalysts for microbial fuel cells.
Afterwards, researchers tried to dope carbon materials with other elements to enhance their performance. Rahmawati et al. [10] used boron-doped diamond electrode as an anode, considering its wide potential window, low background current and high stability of the surface. Khare et al. [11] prepared nickel nanoparticle-doped carbon film with three dimensional micropillars on both sides. Then they used the thus-prepared anode in MFC and showed that the MFC generated a maximum power density 10 times greater than MFCs using the pristine carbon film-based electrodes. Guo et al. [12] fabricated a visible-light-assisted microbial fuel cell with a three-dimensional nitrogen-doped graphene self-standing sponge anode for achieving multiple energy conversion and a large power output. Among these, nitrogen doping could introduce active nitrogen species and increase reactive sites, and was reported to be beneficial for forming electron donors and improve MFCs performance [13]. However, the preparation method of adding a hetero atom dopant into carbon materials is both complicated and cumbersome. Carbonizing nitrogen-containing biomass can greatly simplify the preparation process and reduce cost.
Ci et al. [14] prepared nitrogen-doped carbon nanotubes with a bamboo-like nanostructure to modify MFCs’ anodes. The performance of MFCs was significantly improved compared with that of the unmodified anodes. Tian et al. [15] fabricated N-doped carbon aerogel by one-pot synthesis without template and chemically activated with KOH. The MFCs’ highest maximum power density was as large as 967 mW m−2 and was 283.7% higher than pure carbon aerogel. Yong et al. [16] prepared an open three-dimensional structured electrode with loofah sponge as carbon precursor material. Their experimental results showed that the electrode greatly increased the ability for carrying microorganisms. Pan et al. [17] carbonized natural ginkgo leaves at high-temperature. After purification and ammonia post-treatment, porous carbon nanosheets with excellent electrocatalytic properties were obtained. Recently, self-nitrogen-doped porous cross-linked carbon nanosheets were prepared by carbonization and activation of dandelion seeds, and it was used to assemble the symmetric supercapacitor. The XPS results of the carbon material showed that the relative atomic percent of nitrogen element is 2.88 atm.% and the supercapacitor exhibited good electrochemical performance [18]. Based on these recent findings, it may be also an effective method to modify carbon cloth anodes and improve their electrochemical performance. This, as far as the present authors could know, has not been reported in open literature.
In this paper, dandelion seeds of high nitrogen content were activated with KOH and carbonized to prepare self-doped-nitrogen porous carbon nanosheets (N-CNS). Then N-CNS was used to modify carbon cloth (CC) for fabricating MFC anodes. Activation with chemical methods such as KOH has been used as an efficient method to increase carbon materials’ specific surface area [15,19,20]. Dandelion seeds were also carbonized without the activation treatment to produce unactivated self-doped-nitrogen porous carbon nanosheets (N-UA-CNS) which were also used to modify MFCs’ anodes. The experimental results confirmed the effectiveness of using self-nitrogen-doped carbon nanosheet to modify MFCs anodes.

2. Results and Discussion

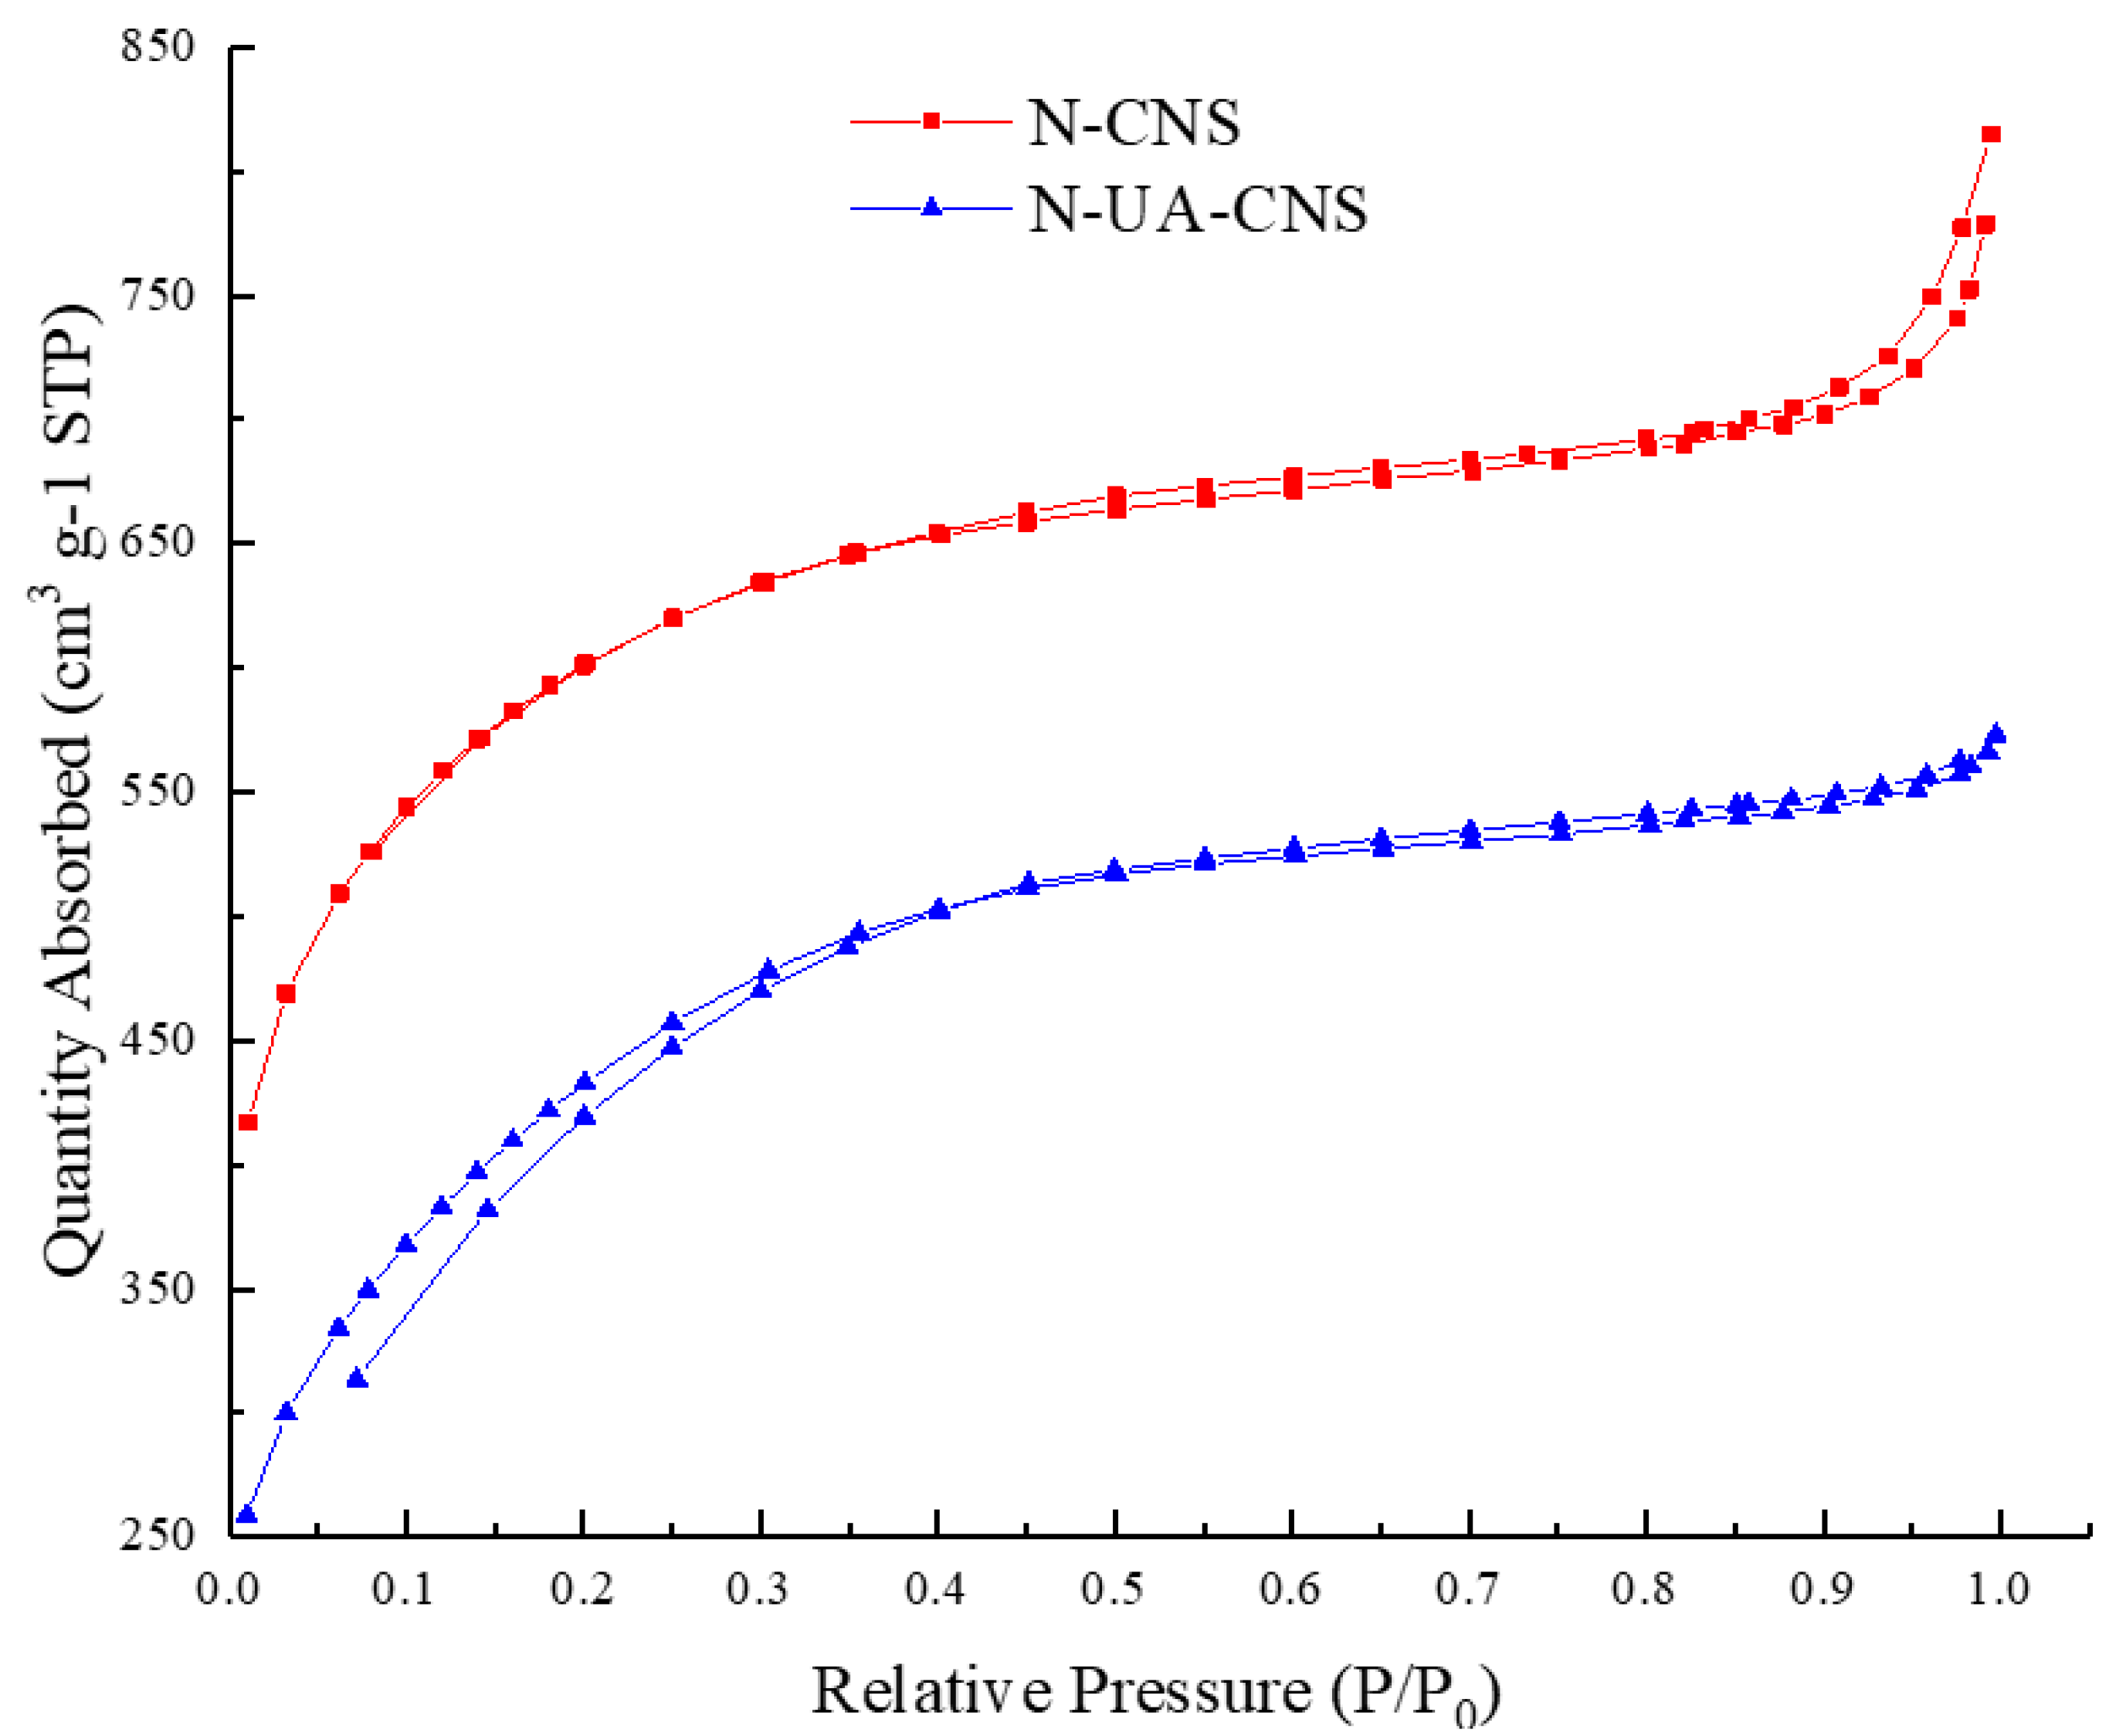
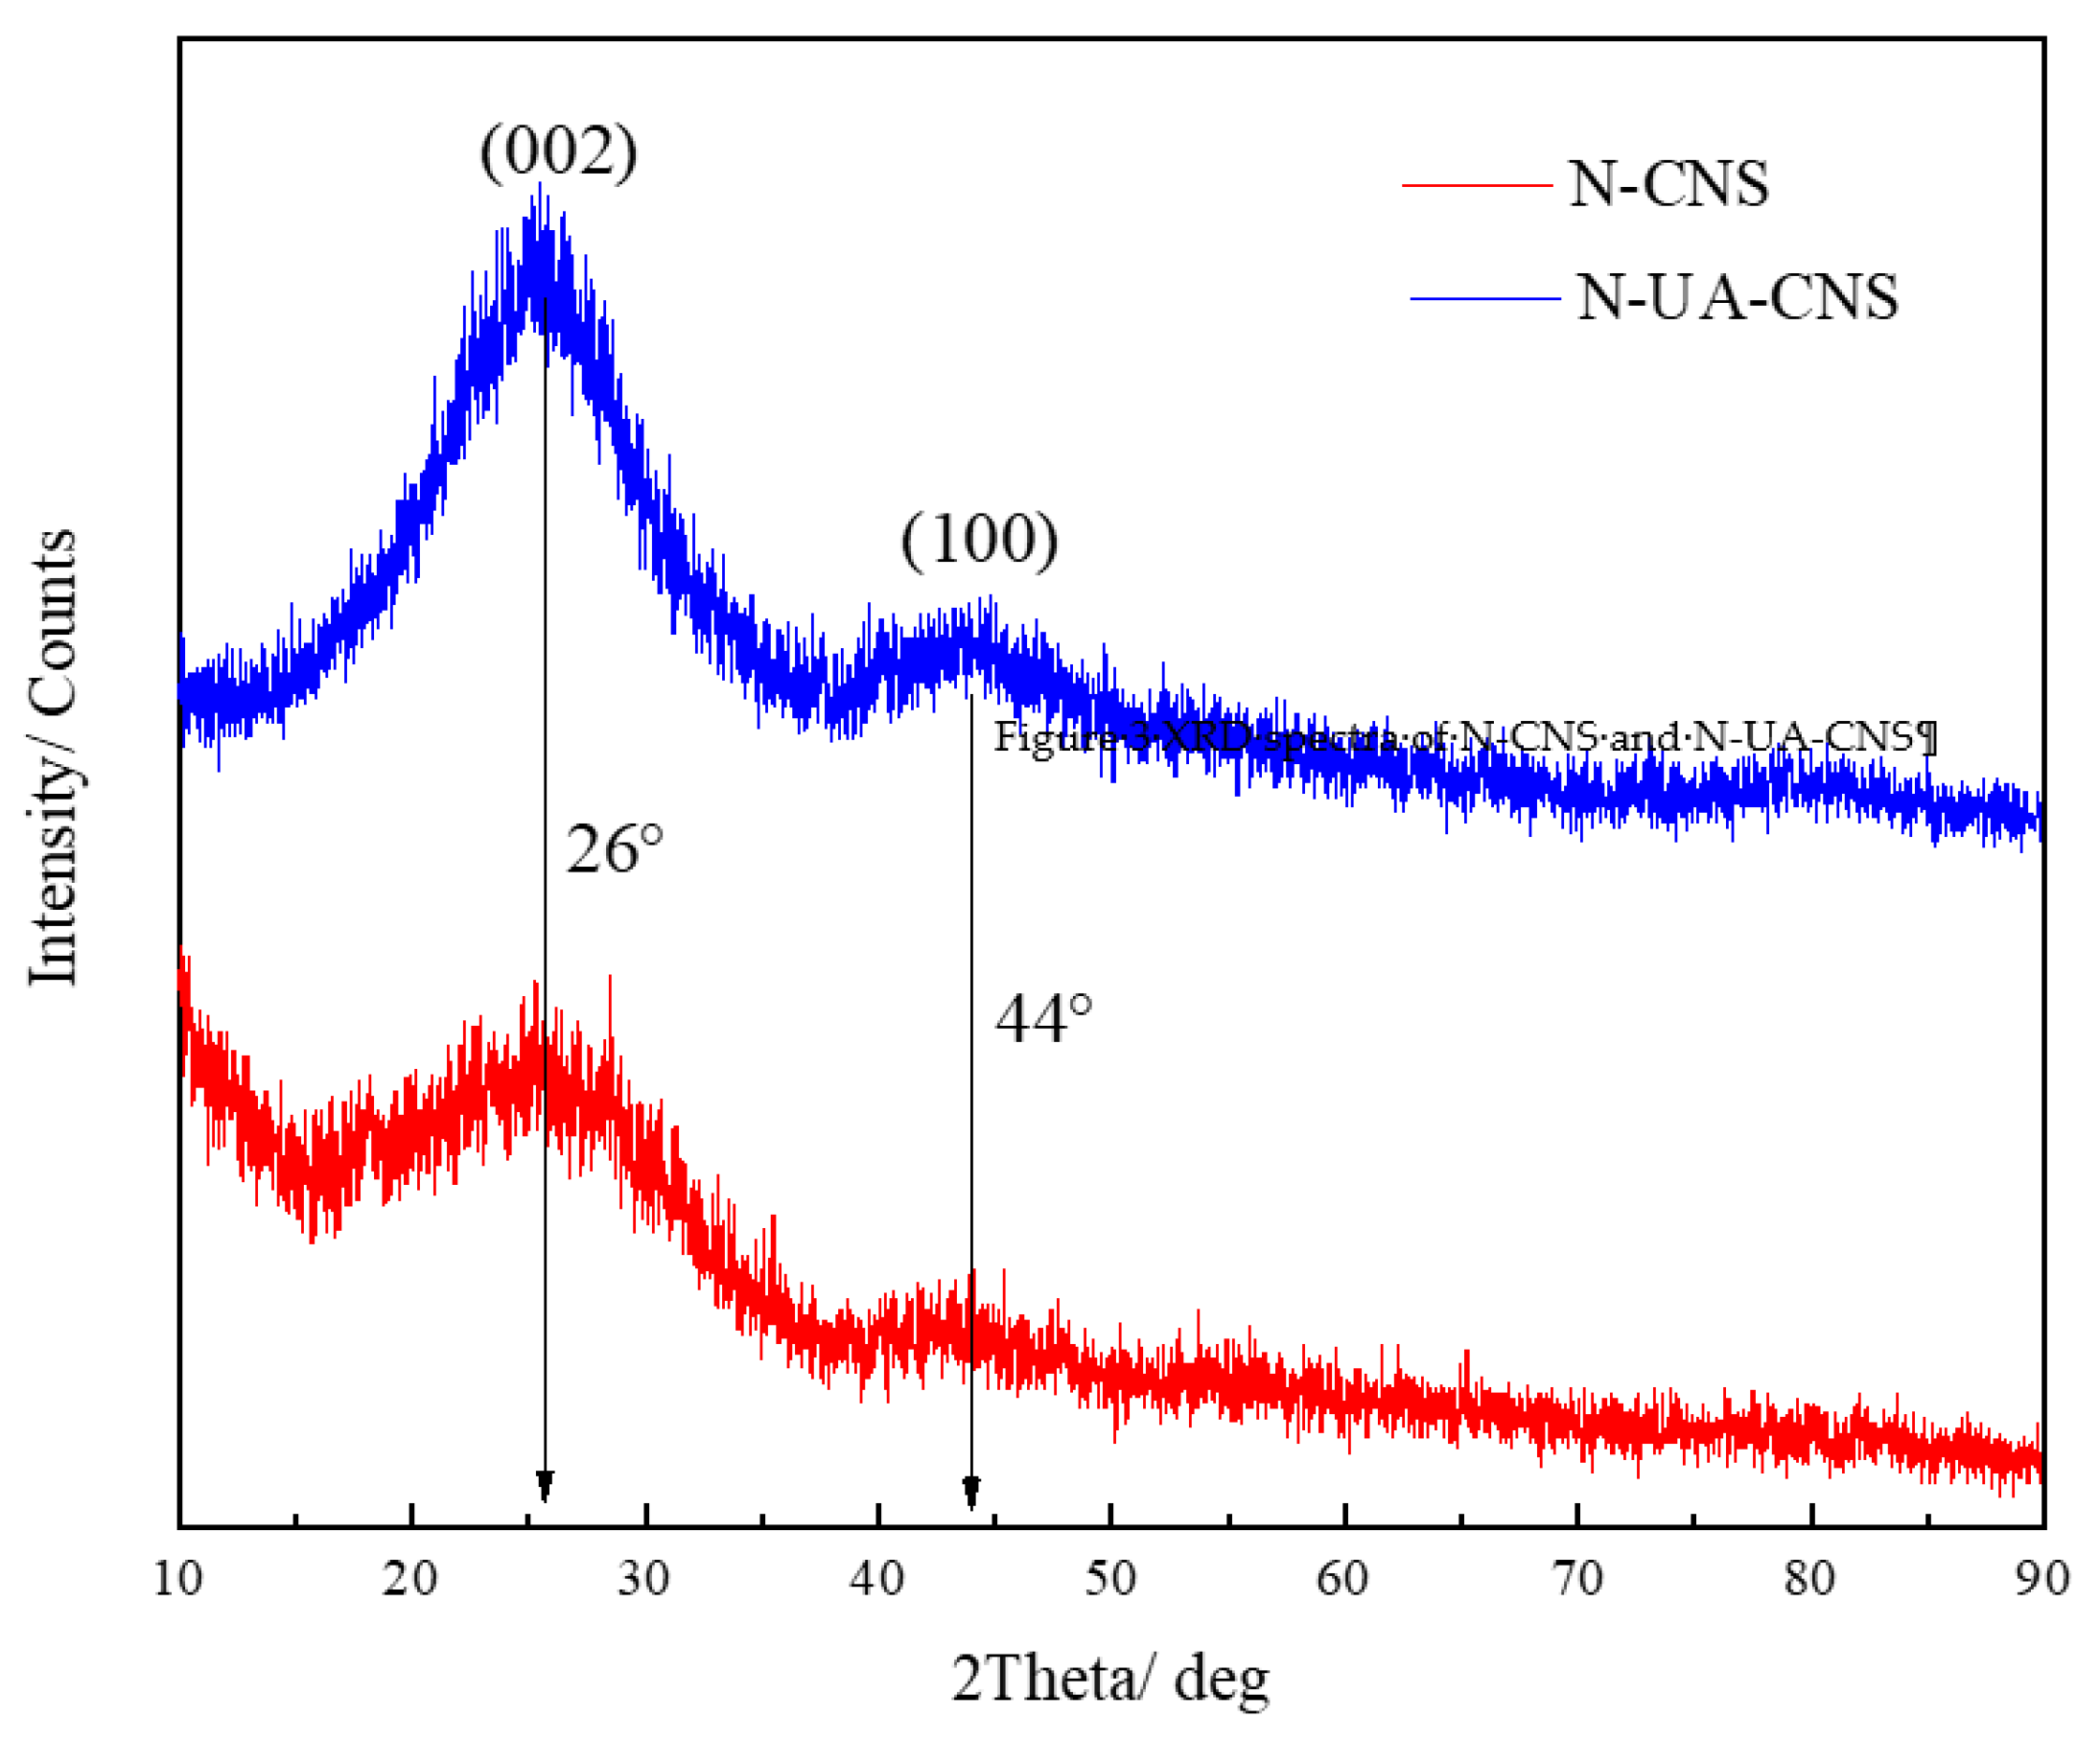
2.1. Characterization of N-CNS and N-UA-CNS

The surface morphology of the electrode CC, N-CNS-CC and N-UA-CNS-CC was characterized by SEM. Figure 1a is a SEM image of CC. It clearly showed that the carbon fibers on the blank carbon cloth were arranged neatly and the surface was smooth. Figure 1b,c and Figure 1e,f were SEM images of N-CNS-CC and N-UA-CNS-CC, respectively. It could be seen from Figure 1b that a large amount of activated carbon material (N-CNS) was loaded on the surface of N-CNS-CC carbon fibers. Figure 1c was the locally magnified SEM image indicated by the rectangular box in Figure 1b. Figure 1d was the locally magnified SEM image indicated by the rectangular box in Figure 1c. From these figures one could see that N-CNS had multiple layers of nanosheet structure and a large number of pores sized between 100 and 300 nm. The structure provided the spaces in sub-micrometer scales that permitted the microorganisms to arrive at the active electrode surface. This was because that, as we know that most of E. coli cells’ sizes range from several hundred nanometers to several micrometers [21]. Figure 1e,f showed that the surface morphology of N-UA-CNS-CC was very different from that of N-CNS-CC. Figure 1e disclosed that a large amount of N-UA-CNS was also loaded on the surface of the carbon fibers. Figure 1f, which was a locally magnified SEM image indicated by the rectangular box in Figure 1e, showed more clearly that N-UA-CNS had less pores than N-CNS, and had a lot of carbon particles rather than nanosheet layers.
Specific surface area was determined by BET method. Figure 2 presented the measured nitrogen adsorption-desorption isotherms of N-CNS and N-UA-CNS. According to the IUPAC(International union of pure and applied chemistry) classification, the N-CNS isotherm was of a type II shape, which confirms the existence of macro-porous structure (>50 nm). The N-UA-CNS isotherm was more likely to be a combination of type I and type II, which confirmed the existence of both the micro (<2 nm) and the macro-pores. The adsorption hysteresis was both observed of N-CNS and N-UA-CNS, the loop of N-CNS belonged to the type H3 and that of N-UA-CNS the type H4. The type H3 loop was observed with aggregates of plate-like particles giving rise to slit-shaped pores, which achieved a high level of compliance with the carbon nanosheet structure showed in SEM test for N-CNS. The type H4 assisted with type I indicated micro-porous structure [22,23]. According to the test of N2 adsorption-desorption, the BET surface area for N-CNS was calculated to be 2107.5 m2 g−1, and was 1.4 times of that of N-UA-CNS (1541.8 m2 g−1).
As we know, the only difference between N-CNS and N-UA-CNS was that the dandelion seeds were not activated before carbonization in fabricating N-UA-CNS. Therefore, one may conclude that the great difference in their specific surface areas was from this KOH activation process. According to Deng et al.’s work, KOH activation associated with gasification reaction could develop the porosity of the carbon materials and the reaction was as follows [20]:
6 KOH   + 2 C 2 K   + 3 H 2 + 2 K 2 CO 3
XRD was conducted to confirm the degree of graphitization and acid pickling process. Figure 3 presented the XRD spectra of N-CNS and N-UA-CNS. It showed that a diffraction peak appeared at 2θ = 26° and 2θ = 44°, which corresponded to the (002) and (100) diffraction peak of graphite, respectively. The diffraction peak of N-CNS was broader than that of N-UA-CNS, which indicated that the graphitization degree of N-CNS was lower and the phase of carbon was amorphous. There was no impurity phase showed, which demonstrated that the extraction process thoroughly removed all the impurity ions. The broad diffraction peak also confirmed that the large number of defects that had been shown by its SEM image [24].

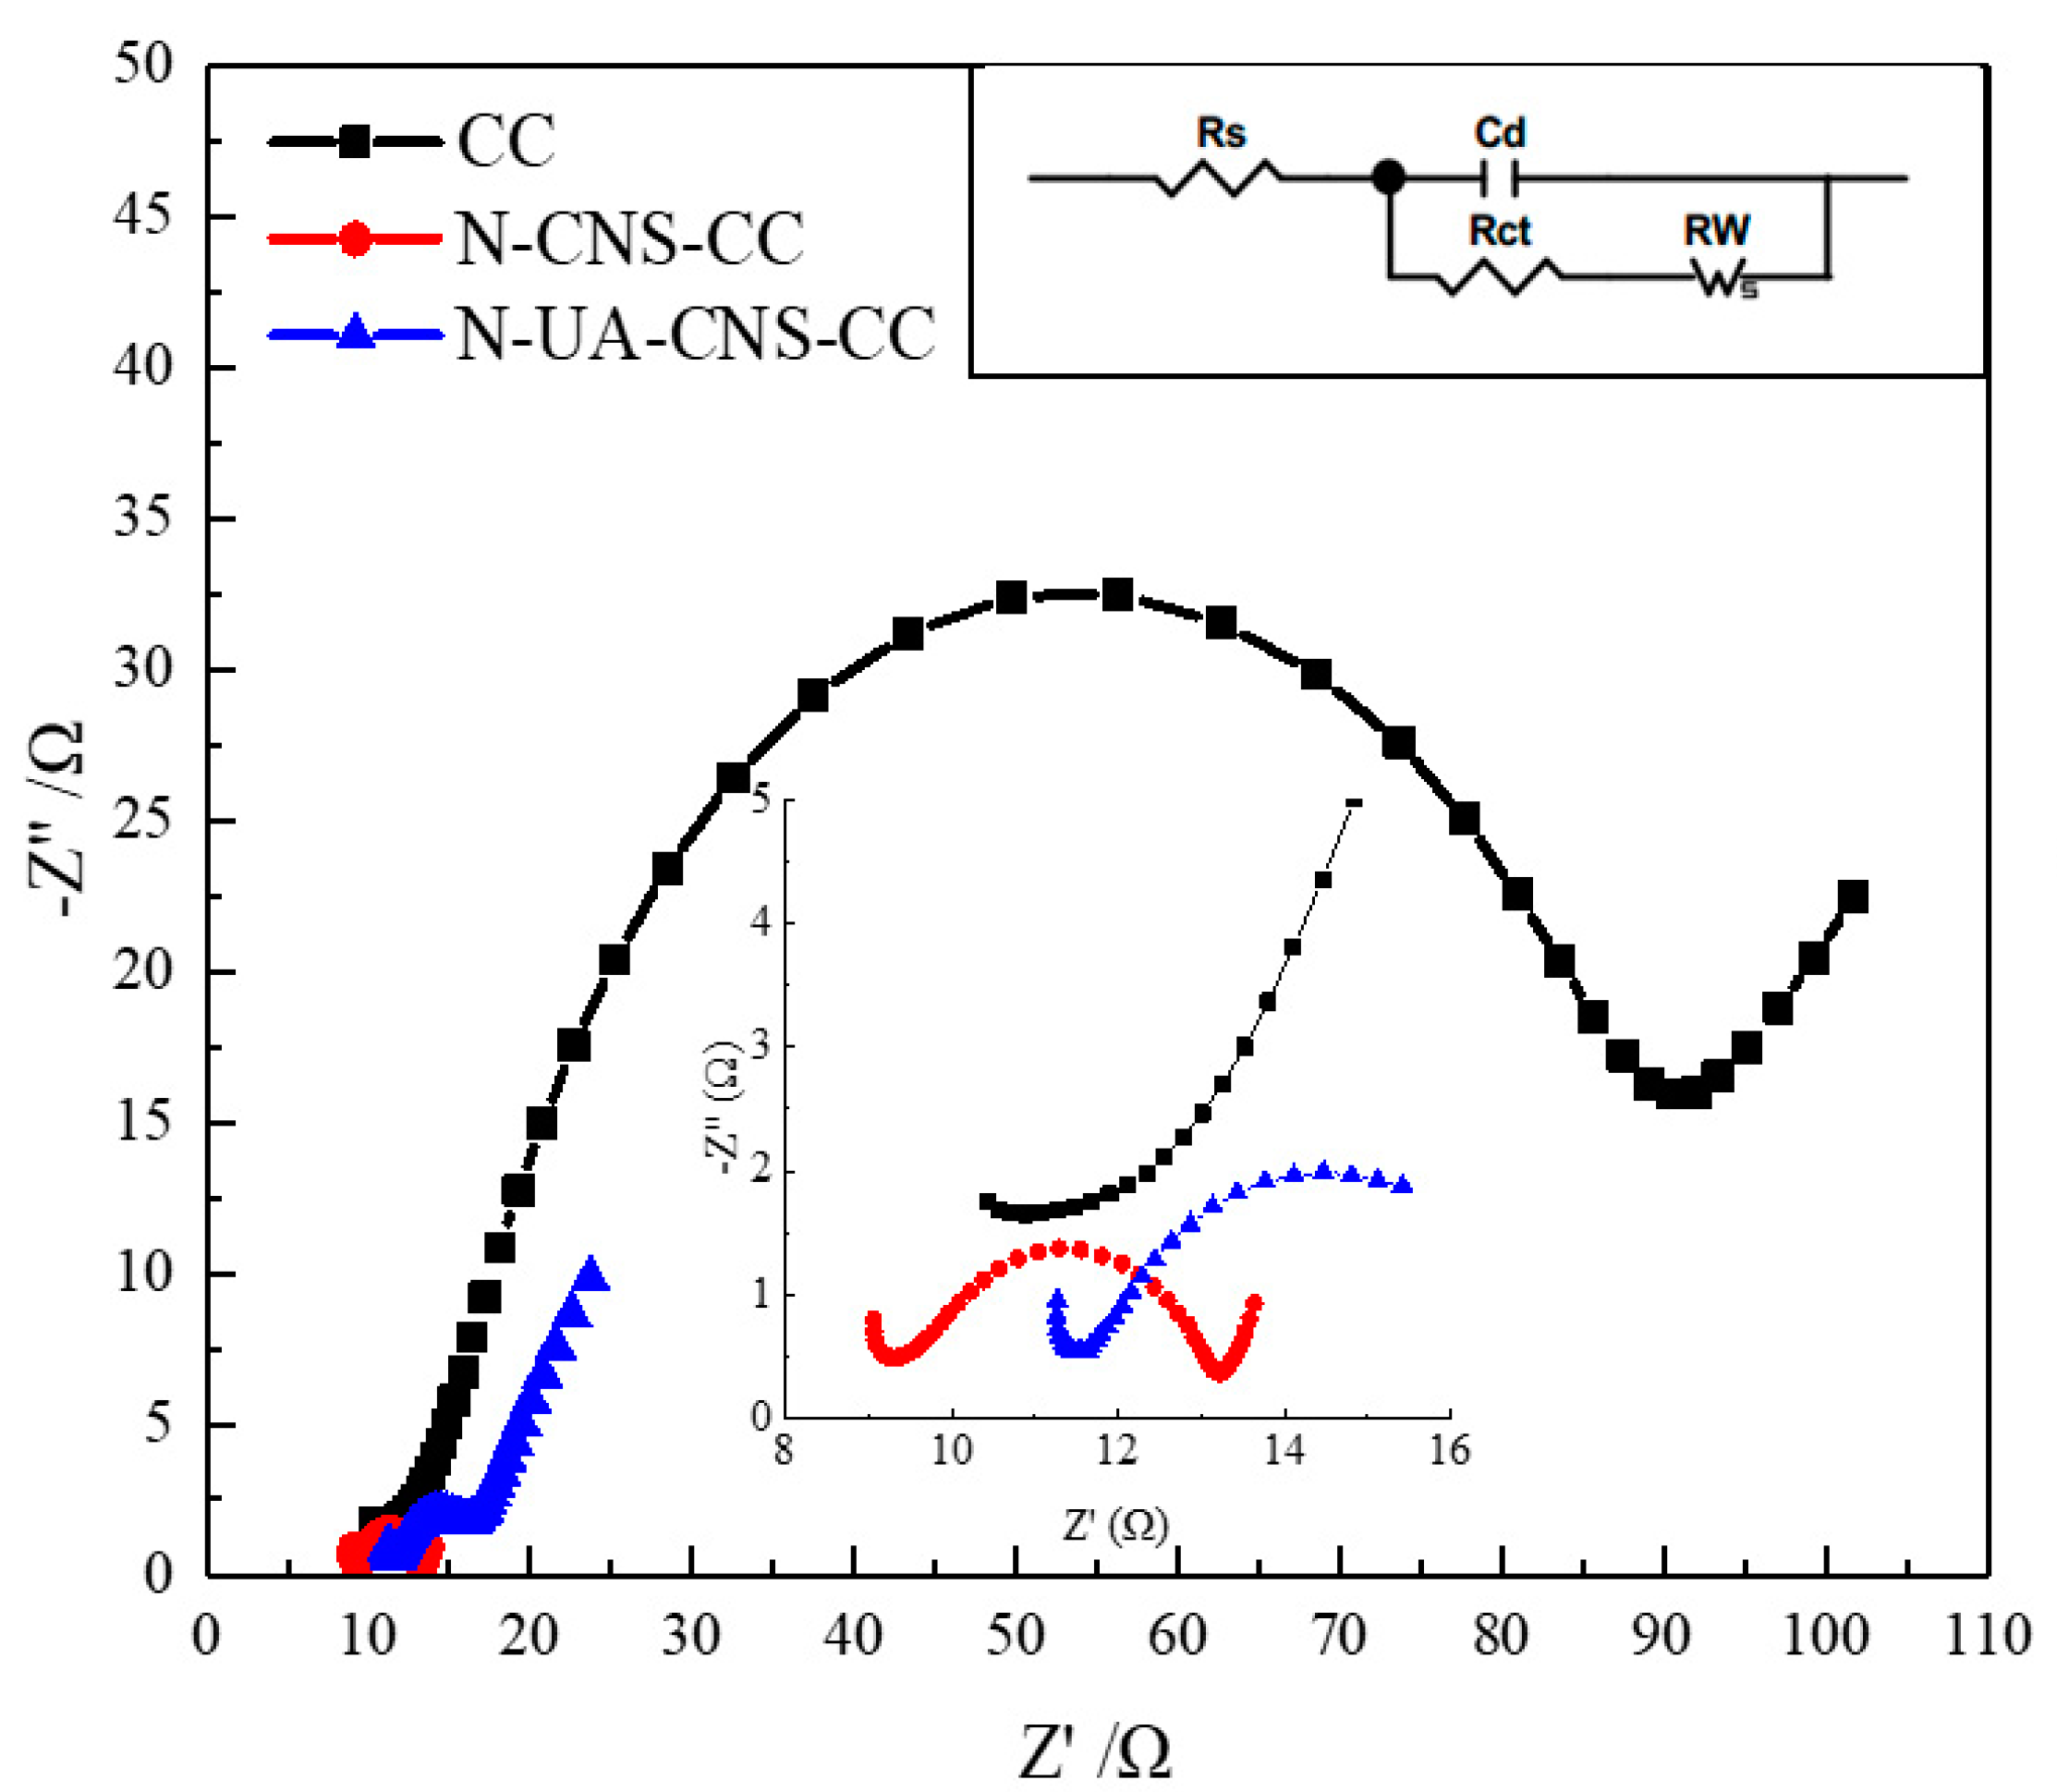
2.2. Electrochemical Characteristics of N-CNS-CC and N-UA-CNS-CC

EIS is an important method for characterizing the electrodes’ electrochemical properties. A Nyquist curve usually consists of a circular arc in high frequency region and a straight line in low frequency region. The first intersection of the curve with the x-axis (horizontal axis) is the value of ohmic internal resistance, and the diameter of the arc is the value of activation internal resistance [25]. The ohmic internal resistance is generated when electrons flow through the electrode contact points and ions are transferred in the electrolyte and the separator; the activation internal resistance is the energy loss caused by initial oxidation reaction or reduction reaction [26].
Figure 4 displayed the Nyquist plots of CC, N-CNS-CC and N-UA-CNS-CC electrodes and the equivalent circuit. According to the results fitted by Zview software, the measured ohmic internal resistance from their Nyquist plot of these three different anodes showed no great difference, which was 10.9 ± 1.5 Ω, 9.3 ± 1.5 Ω and 11.5 ± 1.5 Ω, respectively. This was because the base material of the three electrodes was all carbon cloth, not mentioning that the EIS test is performed in the same three-electrode system. It also proved that the resistance of the attached material had little influence on the internal resistance of the electrode and was mainly determined by the resistance of the carbon cloth. However, in the high frequency region, they showed great difference. This difference indicated that the activation internal resistance of the three was different greatly. As one could expect, the activation internal resistance of CC was the largest, 65.1 ± 5 Ω. N-CNS-CC had the smallest activation resistance of only 2.7 ± 1 Ω and that of N-UA-CNS-CC was 4.0 ± 1 Ω. These results demonstrated that the modification could greatly reduce the internal activation resistance. Compared with CC anode, the internal activation resistance of N-CNS-CC was reduced by 95.8% and that of N-UA-CNS-CC by 93.8%.
The reason behind this may be that the N-CNS and N-UA-CNS have good electrical conductivity and large specific surface area and the improved conductivity and hydrophilicity by nitrogen doping. All these may reduce the activation energy barrier of electrochemical redox reaction on the anode surfaces and improve the anode performance [27].

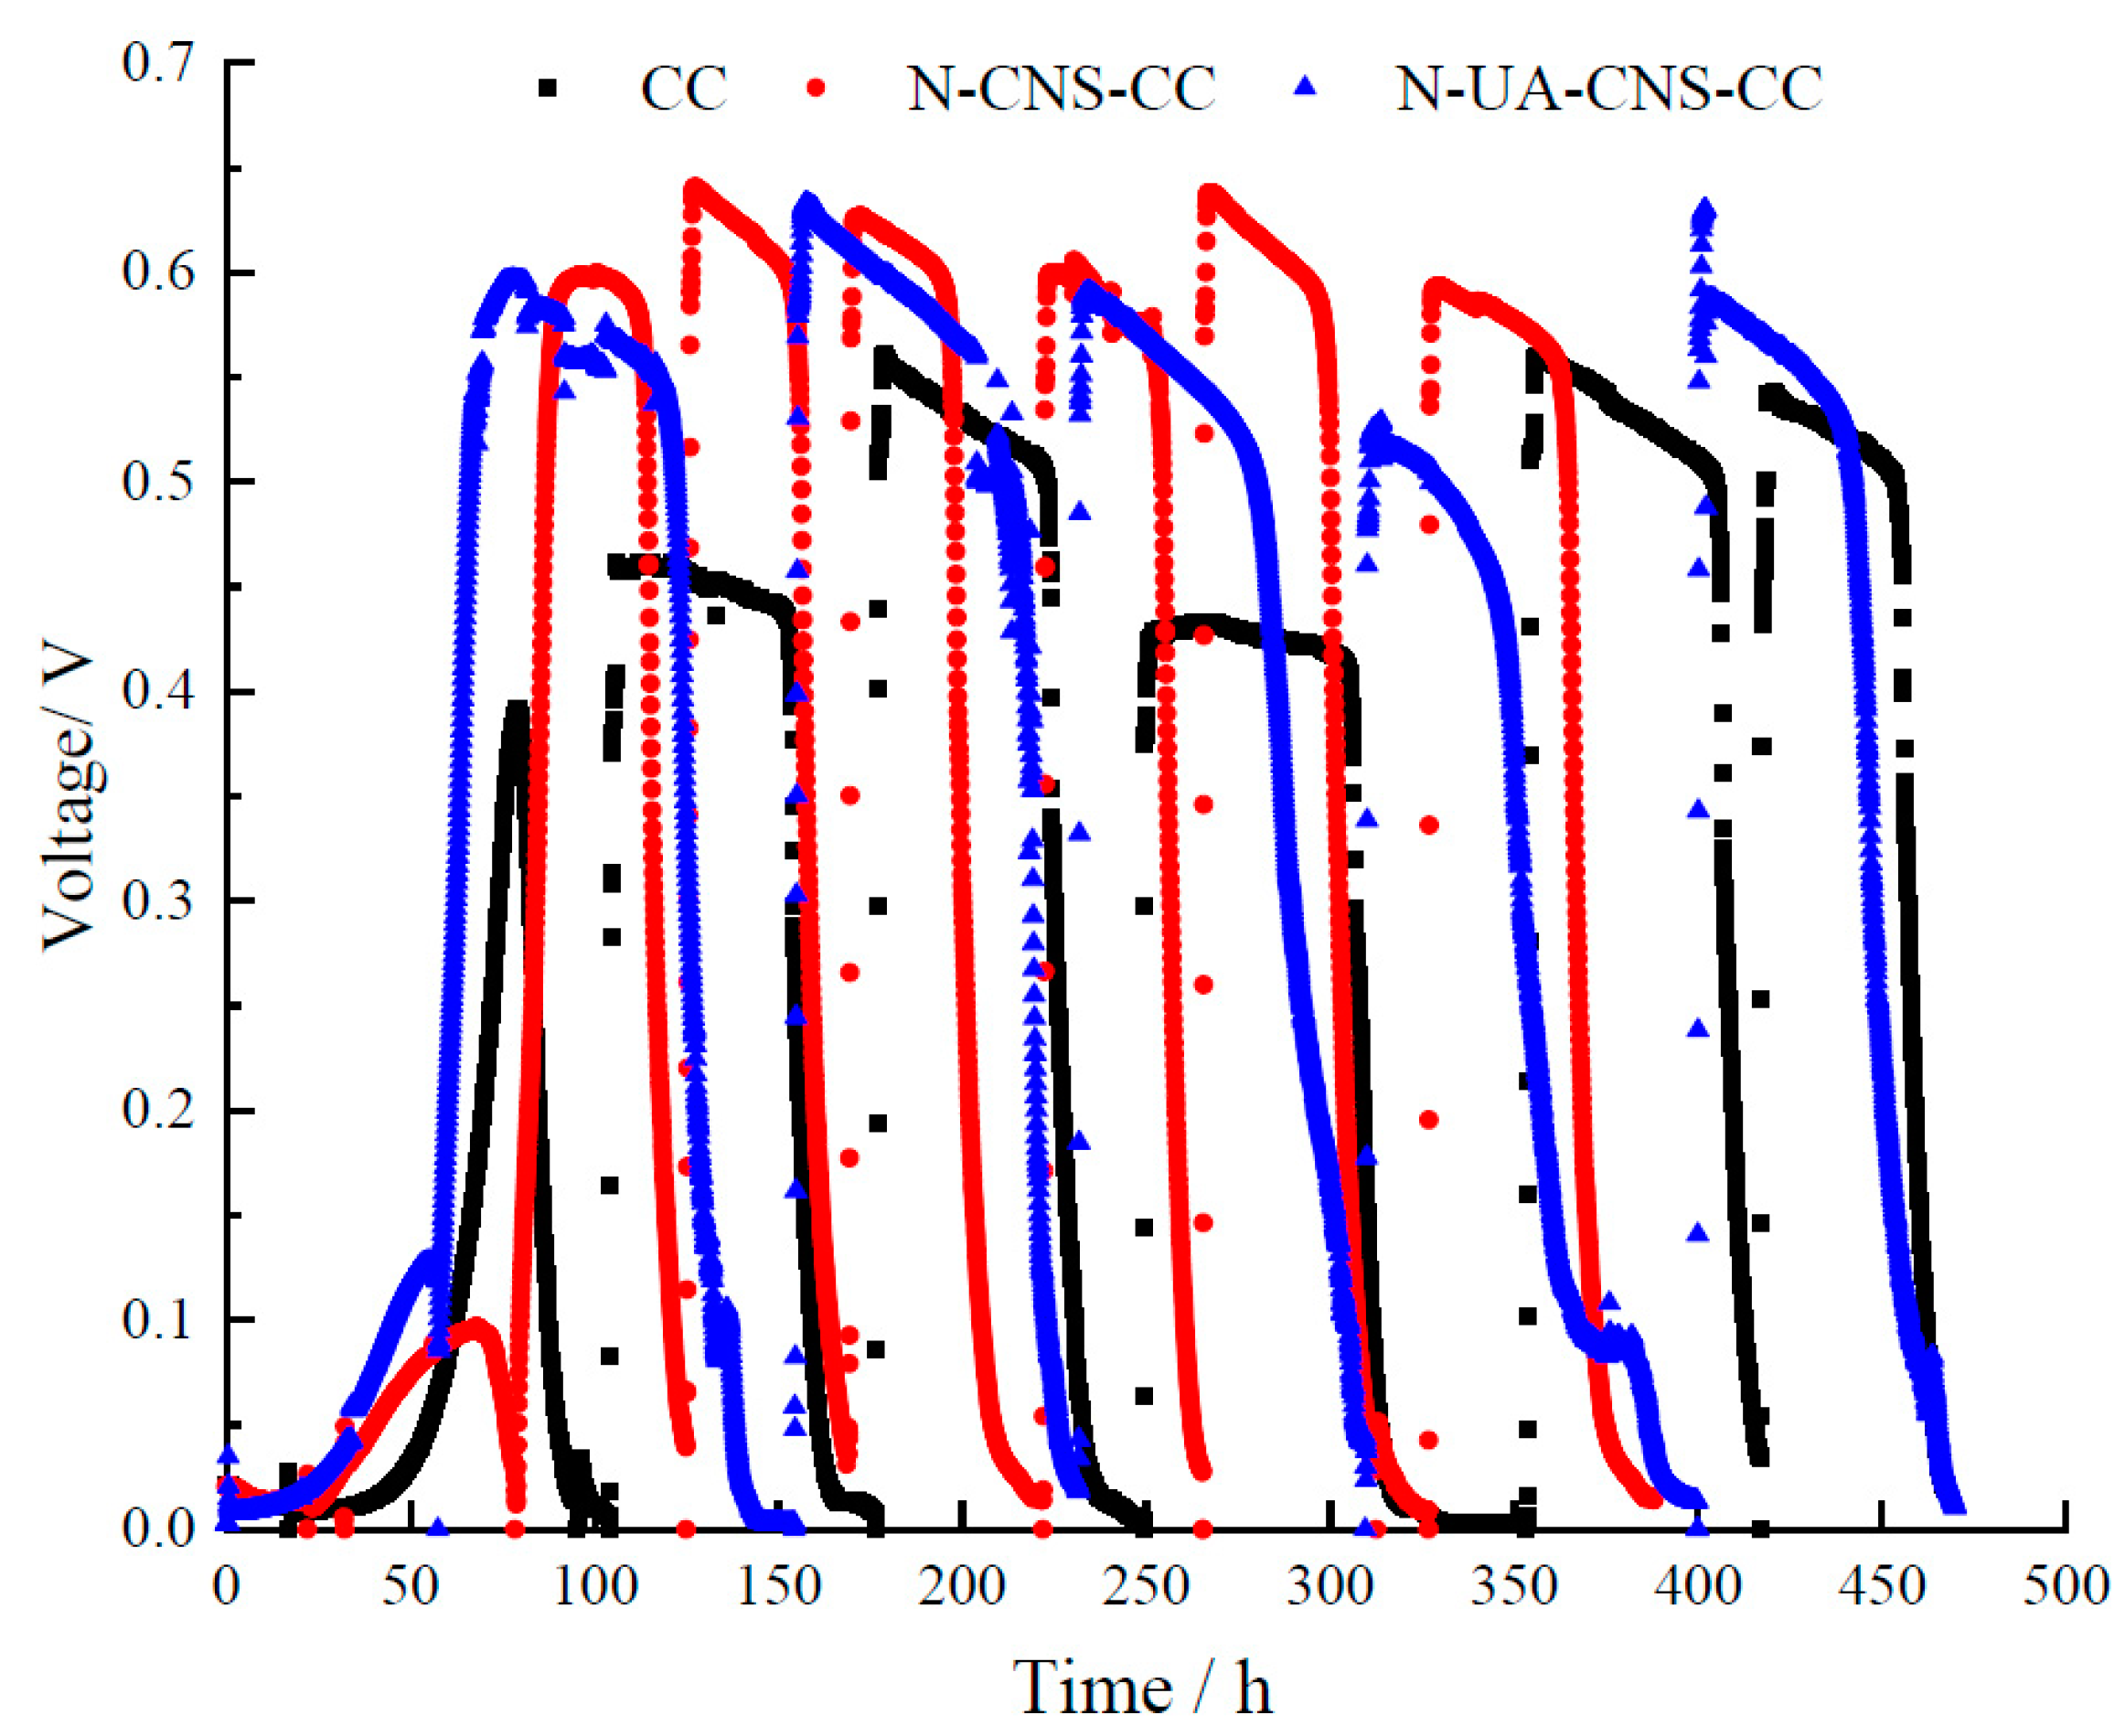
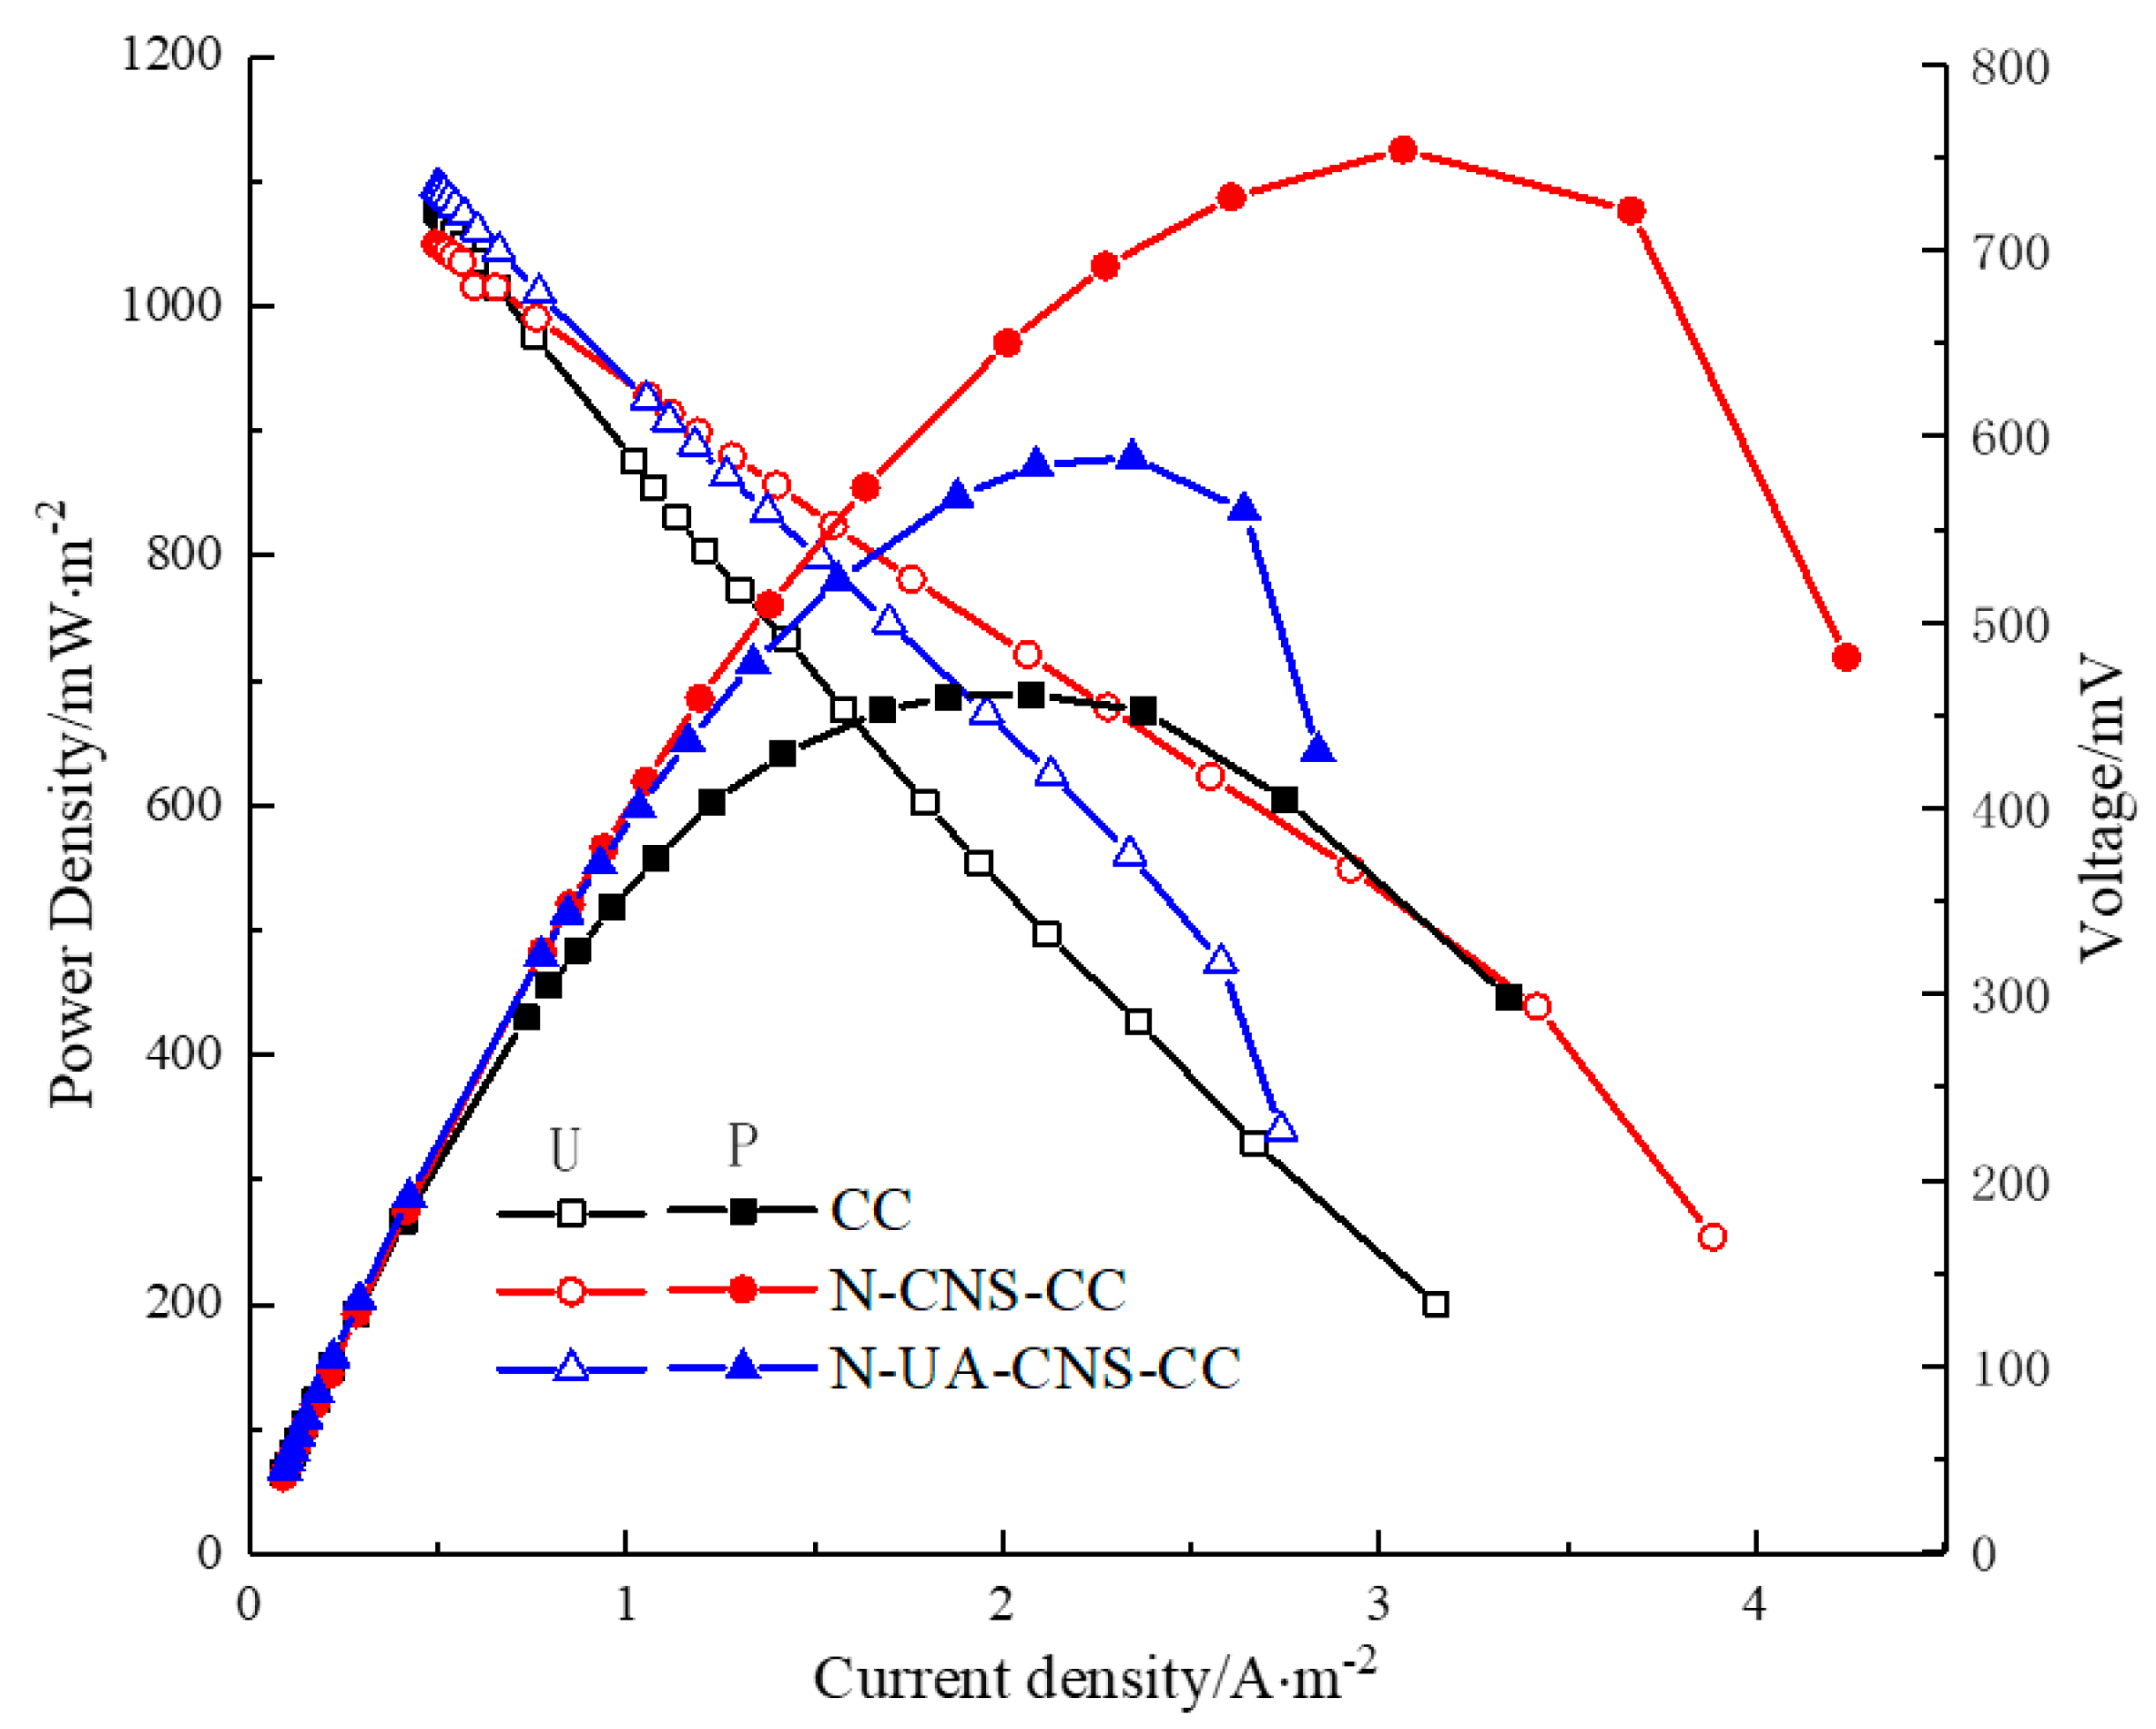
2.3. MFC Performance

As stated above, the observation of the surface morphology and the electrochemical characterization show that the performance of the N-CNS-CC anode has a significant improvement over CC because of its higher specific surface area. Based on Wang et al.’s [26] research, there are two kinds of electron transfer mechanisms from bacteria to the anode, the direct electron transfer via microbial wall and long-range electron transfer via microbial nanowires. For accelerating the electron transfer, the contact area of bacteria to anode plays a key role, which is related to the specific surface area of anode material [7]. Generally, higher specific surface area of anode means larger microorganisms growth space and better environment [28]. Furthermore, better biofilms make a contribution to maximize the efficiency of power generation [29]. Microorganisms have a larger growth space, better environment and thus, the electron transfer efficiency is also higher. To further confirm the effectiveness of the anode modification, the CC, N-CNS-CC and N-UA-CNS-CC were assembled as the anodes into their corresponding MFCs, respectively. The operation conditions have been described in Section 2.3.
Figure 5 depicts the variation of the output voltage of the three MFC reactors as a function of time up to 500 h. The start-up time is an important indicator of the MFC performance. The start-up time for the MFC with the CC anode was as long as 100 h and that of the MFC reactors with N-CNS-CC and N-UA-CNS-CC as the anode was significantly shortened and found to be 70 h and 55 h, respectively. The fluctuation range of CC-anode MFC is 400–550 mV. The fluctuation range of the N-CNS-CC- and N-UA-CNS-CC-anode MFC was within 600–650 mV and 550–600 mV, respectively. Not only was the highest output voltage stability of the N-CNS-CC- and the N-UA-CNS-CC-anode MFC much better than that of the CC-anode MFC, but also the output voltage of the N-CNS-CC- and the N-UA-CNS-CC-anode MFC was much higher than that of the CC-anode MFC. The N-CNS-CC-anode MFC’s maximum output voltage could be stabilized above 600 mV, and the highest value was as large as 650 mV, which is about 1.2 times that of the CC-anode MFC. It is worth to mention that the output voltage of the N-UA-CNS-CC-anode MFC’ maximum output voltage also could be stabilized above 550 mV. The results showed that the modification could shorten the start-up time, improve the output voltage stability and increase the maximum output voltage.
After the MFCs operated stably, they were subjected to a steady-state discharge test. Figure 6 shows the polarization and power density curves of the CC-, the N-CNS-CC- and the N-UA-CNS-CC-anode MFC. As shown in Figure 6, the maximum power density of the CC-, the N-CNS-CC- and the N-UA-CNS-CC-anode MFC was 689.13 mW∙m−2, 1122.41 mW∙m−2 and 878.92 mW∙m−2, respectively, and their corresponding current density at which their maximum power density was acquired is 2.08 A∙m−2, 3.06 A∙m−2 and 2.34 A∙m−2, respectively. Obviously, the N-CNS-CC-anode MFC performs the best, the N-UA-CNS-CC-anode MFC is the next, and the unmodified CC-anode MFC was the worst. The maximum power density obtained by the N-CNS-CC-anode MFC was 1.3 times and 1.6 times of that of the N-UA-CNS-CC- and the CC-anode MFC, respectively. The SEM image showed that the porous structures on the surface increased the specific area of the material, which could provide more growth sites for microorganisms. Nitrogen doping also increased conductivity and hydrophilicity of carbon cloth. These are all factors that improve anode performance, which explains that the maximum power density of MFCs with N-CNS-CC as the anode was the largest of the three [30].

3. Materials and Methods

3.1. Preparation of Self-Nitrogen-Doped Carbon

The preparation process of self-nitrogen-doped carbon nanosheet material could be divided into four steps: Pretreatment, activation, carbonization and extraction. The samples obtained by this complete process were named as N-CNS. The samples obtained without the activation were named as N-UA-CNS. The details of each step are as follows.
Pretreatment: The natural dandelion seeds (Chaoyang Planting Cooperation, Baoding, Hebei Province, China) were first soaked in acetone (All the chemical reagents used in this experiment were analytically pure and purchased from Beijing Chemical Reagent Company, Beijing, China) for 6 h to remove impurities such as surface oil and other dirt. Then, they were washed three times with water (all the water used in this experiment was deionized water), and dried in a vacuum drying oven (DZF-6050, Shanghai Yiheng Scientific Instrument Co., Ltd., Shanghai, China, vacuum degree: <133 Pa, temperature control range: 10 °C~ 250 °C) at 60 °C for 24 h.
Activation: The pretreated dandelion seeds were immersed in the KOH solution (molar concentration: 0.1 mol L−1) at a mass ratio of 1:1. The dandelion seeds used in an independent experiment had a mass of 5 g, and KOH as well. The solution containing dandelion seeds was heated to 100 °C for 10 h and the activated dandelion seeds were dried in a vacuum oven at 60 °C for further 24 h.
Carbonization: Then, argon was used as shielding gas and forced into tube furnace with a flow rate of 50 mL min−1 during the carbonization process. The temperature was raised to 400 °C at the heating rate of 5 °C min−1, maintained for 1 h and then raised to 800 °C at a heating rate of 5 °C min−1 and maintained for another 1 h.
Extraction: After the samples were carbonized, they were washed with 150 mL hydrochloric acid (molar concentration: 3.0 mol L−1). They were stirred with the magnetic agitator for 1 h. Then the sample were rinsed to neutral (pH = 7.0) with water, water was removed by centrifugation and the samples were dried in a vacuum oven at 60 °C for 24 h.

3.2. Preparation of Electrodes

The anodes of the MFC reactors used in this paper were square carbon clothes (Shanghai Hesen Electric Co., Ltd., Shanghai, China) with a side length of 2 cm. The cathodes were made of carbon felts (Shanghai Hesen Electric Co., Ltd., China) with a volume of 1 cm by 1 cm by 4 cm. The pretreatment processes of the anodes and cathodes were the same and followed the following steps: (1) immersed in acetone for 6 h to remove impurities such as surface oil and other dirt and washed with water for three times; (2) immersed in the mixed acid solution which was a mixture of concentrated nitric acid (molar concentration: 14.4 mol L−1) and concentrated sulfuric acid (molar concentration: 18.4 mol L−1) at a volume ratio of 1: 3, for 6 h and (3) dried in a vacuum drying oven.
10 mg of N-CNS powder, 0.25 mL of absolute ethanol (mass fraction: 99.5%) and 1.5 mL of Nafion solution (mass fraction: 5%) were mixed. To ensure homogenous mixing, the mixture was placed in an ultrasonic cleaner (KQ-400KDE, Kunshan Ultrasonic Instrument Co., Ltd., Kunshan, Jiangsu Province, China) for ultrasonic treatment for 40 min. The obtained mixture solution was uniformly dispensed onto a pretreated carbon cloth with a micro syringe. Then, the carbon cloth was air-dried at room temperature for 24 h, and the obtained modified carbon cloth was named N-CNS-CC. The carbon cloth modified with N-UA-CNS with the same process was named as N-UA-CNS-CC.

3.3. MFC Setup and Operation

The MFC reactor was of two-chamber structure and was made of plexiglass. The volume of the anode and the cathode chamber was both 40 mL. The two chambers were separated by a proton exchange membrane (Nafion 117, available from DuPont, Wilmington, DE, USA) with an effective membrane area of 2 cm by 2 cm.
The substrate of the anolyte was CH3COONa with a concentration of 1.00 g L−1, and the nutrient solution was composed of 14.32 g L−1 Na2HPO4∙12H2O, 1.36 g L−1 KH2PO4, 0.5 g L−1 NH4Cl, 0.1 g L−1 NaCl, 0.1 g L−1 MgSO4.∙7H2O and 0.02 g L−1 CaCl2∙2H2O, which was the same as that of [14]. The catholyte was prepared with K3[Fe(CN)6] as electron acceptors and PBS buffer solution (14.32 g L−1 Na2HPO4∙12H2O, 1.36 g L−1 KH2PO4, pH = 7.0) at a concentration of 32.9 g L−1 [15]. The strains of anaerobic sludge were from the Gaobeidian Wastewater Treatment Plant. Under the anaerobic room temperature conditions, the strains were domesticated and cultured for more than half a year in the anolyte (the concentration of the substrate CH3COONa was 2.0 g L−1), and the anolyte was changed every seven days. Finally, the dominant species suitable for survival in the MFC anolyte environment were domesticated, and the useless strains were eliminated.
When the MFC reactors were started, 20 mL of the acclimated microbial suspension was inoculated into the anode chamber, and 20 mL of the anode nutrient solution (the concentration of the substrate CH3COONa was 1.0 g L−1) was also added. At the same time, 40 mL of catholyte was added into the cathode chamber. The anodes were the above pre-prepared N-CNS-CC, N-UA-CNS-CC and CC electrodes, respectively, and the cathodes were the pretreated carbon felts. The anode and cathode were connected to the external circuit by a titanium wire, and the external circuit was connected to a 1000 Ω resistor.
The MFC reactors were placed in an incubator at 35 °C ± 0.5 °C, and the output voltage was automatically recorded to a computer using a data acquisition instrument (34970A, Agilent, Santa Clara, CA, USA). Data was collected every 5 min. When the output voltage was less than 50 mV, the anode nutrient solution and catholyte was replaced.

3.4. Material and Electrochemical Characterization

The surface morphology of the modified electrode was observed using a scanning electron microscope (SEM, Hitachi S-3400N, Tokyo, Japan). The phase composition of the carbon material was examined by X-ray diffraction (XRD, Bruker D8 Advance, Karlsruhe, Germany) with Cu Kα radiation in a 2θ range of 10° to 70°. Brunauer–Emmett–Teller (BET) surface areas were obtained using an automatic gas adsorption apparatus (ASAP 2020HD88, Micromeritics, Altanta, GA, USA).
In order to compare the electrochemical performances of the modified and the unmodified electrode as the working electrodes, a three-electrode system was constructed. In the three-electrode system, the working electrodes were the modified carbon clothes and the blank carbon clothes, the auxiliary counter electrode was a platinum mesh electrode and the reference electrode was the standard Ag/AgCl. The electrolyte was PBS buffer solution with a pH value of 7.0. Electrochemical impedance spectroscopy (EIS) was tested using an electrochemical workstation (AUTOLAB, Metrohm, Herisau, Switzerland) at a frequency from 1 Hz to 100 kHz with a potential amplitude of 10 mV. The results were fitted by the Zview software(version 3.1, Solartron Metrology, Bognor Regis, West Sussex, the UK).
After the MFC reactors entered stable operation stage, steady-state discharge tests were performed while the output voltage was at its peak value. The external resistance was changed from 9999 Ω to 10 Ω in these tests, the voltages over various external resistances were recorded and the corresponding current densities and power densities were calculated.

4. Conclusions

In this paper, high-nitrogen-containing dandelion seeds were carbonized and activated by KOH to prepare self-nitrogen-doped porous carbon nanosheet. The N-CNS modified carbon cloth anode (N-CNS-CC) and the resulting MFCs’ performance was studied. The porous carbon prepared by dandelion seeds carbonization without KOH activation modified carbon cloth (N-UA-CNS-CC) and blank carbon cloth were used as controls.
The experiments results ensured the modification effectiveness. Demonstrating that the KOH activation process could improve the BET surface area and change the porosity conditions of the materials. The electrochemical tests of the three electrodes indicated that N-CNS had the lowest ohmic resistance and activation internal resistance. The measured energy performance of the MFCs assembled with CC, N-CNS-CC and N-UA-CNS-CC as anode demonstrated that the N-CNS modification showed significant improvement in start-up time, output stability and maximum output voltage. The polarization and power density curves showed that the maximum power density of N-CNS-CC-anode MFC was 1122.41 mW∙m−2, which was 1.3 times of that of N-UA-CNS-CC-anode MFC and 1.6 times of that of CC-anode MFC.
Since the experimental results proved that N-CNS modification exhibits good performance, self-doped nitrogen biomass carbon was cheap, easy to obtain and of good biocompatibility and high specific surface area, therefore N-CNS was a very good potential material for MFC anode modification.

Author Contributions

Conceptualization and methodology, X.X. and Z.L.; validation, Z.L. and Q.L.; investigation and experiments, X.X. and Z.L.; Data curation, W.C., X.L. and Y.L.; methodology, X.X., Y.L. and Q.L.; writing—original draft preparation, X.X.; writing—review and editing, Z.L.; supervision, Z.L.; project administration, Z.L. and Y.L.; funding acquisition, Z.L. All authors have read and agreed to the published version of the manuscript.

Funding

This research was funded by the Chinese National Natural Science Foundation, grant number 51676004.

Acknowledgments

This work is supported by the Chinese National Natural Science Foundation Project (No. 51676004).

Conflicts of Interest

The authors declare no conflict of interest. The funders had no role in the design of the study; in the collection, analyses, or interpretation of data; in the writing of the manuscript, or in the decision to publish the results.

References

  1. Logan, B.E. Microbial Fuel Cells, (Chinese version); Chemical Industry Press: Beijing, China, 2009. [Google Scholar]
  2. Logan, B.E.; Rebaey, K. Conversion of wastes into bioelectricity and chemicals using microbial electrochemical technologies. Science 2012, 337, 686–690. [Google Scholar] [CrossRef] [PubMed] [Green Version]
  3. Du, Z.W.; Li, H.R.; Gu, T.Y. A state of the art review on microbial fuel cells: A promising technology for wastewater treatment and bioenergy. Biotechnol. Adv. 2007, 25, 464–482. [Google Scholar] [CrossRef] [PubMed]
  4. Cheng, S.A.; Logan, B.E. Ammonia treatment of carbon cloth anodes to enhance power generation of microbial fuel cells. Electrochem. Commun. 2007, 9, 492–496. [Google Scholar] [CrossRef]
  5. Liu, H.; Ramnarayanan, R.; Logan, B.E. Production of electricity during wastewater treatment using a single chamber microbial fuel cell. Environ. Sci. Technol. 2004, 38, 2281–2285. [Google Scholar] [CrossRef]
  6. Logan, B.E.; Cheng, S.A.; Watson, V.; Estadt, G. Graphite fiber brush anodes for increased power production in air-cathode microbial fuel cells. Environ. Sci. Technol. 2007, 41, 3341–3346. [Google Scholar] [CrossRef]
  7. Chen, X.F.; Cui, D.; Wang, X.J.; Wang, X.S.; Li, W.S. Porous carbon with defined pore size as anode of microbial fuel cell. Biosens. Bioelectron. 2015, 69, 135–141. [Google Scholar] [CrossRef]
  8. Hou, J.X.; Liu, Z.L.; Zhang, P.Y. A new method for fabrication of graphene/polyaniline nanocomplex modified microbial fuel cell anodes. J. Power Sources 2013, 224, 139–144. [Google Scholar] [CrossRef]
  9. Nguyen, M.T.; Mecheri, B.; D’Epifanio, A.; Sciarria, T.P.; Adani, F.; Licoccia, S. Iron chelates as low-cost and effective electrocatalyst for oxygen reduction reaction in microbial fuel cells. Int. J. Hydrogen Energy 2014, 39, 6462–6469. [Google Scholar] [CrossRef]
  10. Rahmawati, I.; Ivandini, T.A.; Saepudin, E. The potency of electrical energy production from urine by microbial fuel cell using boron-doped diamond electrode. IOP Conf. Ser. Mater. Sci. Eng. 2017, 188, 12001. [Google Scholar] [CrossRef] [Green Version]
  11. Khare, P.; Ranmkumar, J.; Verma, N. Carbon nanofiber-skinned three-dimensional Ni/Carbon micropillars: High performance electrodes of a microbial fuel cell. Electrochim. Acta 2016, 219, 88–98. [Google Scholar] [CrossRef]
  12. Guo, D.; Song, R.B.; Shao, H.H.; Zhang, J.R.; Zhu, J.J. Visible-light-enhanced power generation in microbial fuel cells coupling with 3D nitrogen-doped graphene. Chem. Commun. 2017, 53, 9949–10080. [Google Scholar]
  13. Wan, G.; Fu, Y.; Guo, J.N.; Xiang, Z.H. Photoelectronic porous covalent organic materials: Research progress and perspective. Acta Chim. Sin. 2015, 73, 557–578. [Google Scholar] [CrossRef] [Green Version]
  14. Ci, S.Q.; Wen, Z.H.; Chen, J.H.; He, Z. Decorating anode with bamboo-like nitrogen-doped carbon nanotubes for microbial fuel cells. Elecrtochem. Commun. 2012, 14, 71–74. [Google Scholar] [CrossRef]
  15. Tian, X.Y.; Zhou, M.H.; Tan, C.L.; Li, M.; Liang, L.; Li, K.R.; Su, P. KOH activated N-doped novel carbon aerogel as efficient metal-free oxygen reduction catalyst for microbial fuel cells. Chem. Eng. J. 2018, 348, 775–785. [Google Scholar] [CrossRef]
  16. Yong, Y.; Zhou, S.G.; Liu, Y.; Tang, J.H. Nanostructured macroporous bioanode based on polyaniline-modified natural loofah sponge for high-performance microbial fuel cells. Environ. Sci. Technol. 2013, 47, 14525–14532. [Google Scholar]
  17. Pan, F.P.; Cao, Z.Y.; Zhao, Q.P.; Liang, H.Y.; Zhang, J.Y. Nitrogen-doped porous carbon nanosheets made from biomass as highly active electrocatalyst for oxygen reduction reaction. J. Power Sources 2014, 272, 8–15. [Google Scholar] [CrossRef]
  18. Zhao, J.; Gong, J.W.; Li, Y.J.; Cheng, K.; Ye, K.; Zhu, K.; Yan, J.; Cao, D.X.; Wang, G.L. Self N-doped porous interconnected carbon nanosheets materials for supercapacitors. Acta Chim. Sin. 2018, 76, 107–112. [Google Scholar] [CrossRef]
  19. Tay, T.; Ucar, S.; Karagoz, S. Preparation and characterization of activated carbon from waste biomass. J. Hazard. Mater. 2009, 165, 481–485. [Google Scholar] [CrossRef]
  20. Deng, H.; Li, G.X.; Yang, H.B.; Tang, J.P.; Tang, J.Y. Preparation of activated carbons from cotton stalk by microwave assisted KOH and K2CO3 activation. Chem. Eng. J. 2010, 163, 373–381. [Google Scholar] [CrossRef]
  21. Zhang, T.; Zeng, Y.L.; Chen, S.L.; Ai, X.P.; Yang, H.X. Improved performances of E. coli-catalyzed microbial fuel cells with composite graphite/PTFE anodes. Electrochem. Commun. 2007, 9, 349–353. [Google Scholar] [CrossRef]
  22. Sing, K.S.W.; Everett, D.H.; Haul, R.A.W.; Moscou, L.; Pierotti, R.A.; Rouquerol, J.; Siemieniewska, T. Reporting physisorption data for gas/solid systems with special reference to the determination of surface area and porosity. Pure Appl. Chem. 1985, 57, 603–619. [Google Scholar] [CrossRef]
  23. Liu, Y.; Li, K.X.; Ge, B.C.; Pu, L.T.; Liu, Z.Q. Influence of micropore and mesoporous in activated carbon air-cathode catalysts on oxygen reduction reaction in microbial fuel fells. Electrochim. Acta 2016, 214, 110–118. [Google Scholar] [CrossRef]
  24. Wang, J.Q.; Han, Z.D. The combustion behavior of polyacrylate ester/graphite oxide composites. Polym. Adv. Technol. 2006, 17, 335–340. [Google Scholar] [CrossRef]
  25. He, Z.; Mansfeld, F. Exploring the use of electrochemical impedance spectroscopy (EIS) in microbial fuel cell studies. Energy Environ. Sci. 2009, 2, 215–219. [Google Scholar] [CrossRef]
  26. Santoro, C.; Arbizzani, C.; Erable, B.; Leropoulos, I. Microbial fuel cells: From fundamentals to applications. J. Power Sources 2017, 356, 225–244. [Google Scholar] [CrossRef]
  27. Zhou, Y.; Liu, Z.L.; Hou, J.X.; Chen, W.W.; Lou, X.G.; Li, Y.X. Study of urine-powered microbial fuel cell anode modified by graphene-type novel materials. CIESC J. 2018, 69, 2790–2796. (In Chinese) [Google Scholar]
  28. Wang, Y.Q.; Li, B.; Dan Cui, D.; Xiang, X.D.; Li, W.S. Nano-molybdenum carbide/carbon nanotubes composite as bifunctional anode catalyst for high-performance Escherichia coli-based microbial fuel cell. Biosens. Bioelectron. 2014, 51, 349–355. [Google Scholar] [CrossRef]
  29. Karthikeyan, R.; Wang, B.; Xuan, J.; Wong, J.W.; Lee, P.K.; Leung, M.K. Interfacial electron transfer and bioelectrocatalysis of carbonized plant material as effective anode of microbial fuel cell. Electrochim. Acta 2015, 157, 314–323. [Google Scholar] [CrossRef]
  30. Chen, W.W.; Liu, Z.L.; Hou, J.X.; Zhou, Y.; Lou, X.G.; Li, Y.X. Supercapacitor materials anodes for enhancing urine-powered microbial fuel cell performance. J. Eng. Thermophys. (Gongcheng Rewuli Xuebao) 2018, 39, 1818–1823. (In Chinese) [Google Scholar]
Figure 1. SEM images of (a) the carbon cloth (CC), (b, c and d) the self-doped-nitrogen porous carbon nanosheets (N-CNS)-CC and (e, f) the unactivated self-doped-nitrogen porous carbon nanosheets (N-UA-CNS)-CC.
Catalysts 10 00381 g001
Figure 2. Nitrogen adsorption-desorption isotherms of the self-doped-nitrogen porous carbon nanosheets (N-CNS) and the unactivated self-doped-nitrogen porous carbon nanosheets(N-UA-CNS).
Catalysts 10 00381 g002
Figure 3. XRD spectra of the self-doped-nitrogen porous carbon nanosheets(N-CNS) and the unactivated self-doped-nitrogen porous carbon nanosheets(N-UA-CNS).
Catalysts 10 00381 g003
Figure 4. Nyquist plots of CC, the self-doped-nitrogen porous carbon nanosheets(N-CNS)-CC and the unactivated self-doped-nitrogen porous carbon nanosheets(N-UA-CNS)-CC anode, the inset is the equivalent circuit.
Catalysts 10 00381 g004
Figure 5. Voltage output of microbial fuel cells (MFCs) with CC, the self-doped-nitrogen porous carbon nanosheets(N-CNS)-CC and the unactivated self-doped-nitrogen porous carbon nanosheets(N-UA-CNS)-CC as anode.
Catalysts 10 00381 g005
Figure 6. Polarization and power density of CC, the self-doped-nitrogen porous carbon nanosheets(N-CNS-CC) and the unactivated self-doped-nitrogen porous carbon nanosheets(N-UA-CNS-CC) anode MFC.
Catalysts 10 00381 g006

