Article

Exploiting Direct Current Plasma Electrolytic Oxidation to Boost Photoelectrocatalysis

Politecnico di Milano, Department of Chemistry, Materials and Chemical Engineering “G. Natta”, Via Luigi Mancinelli, 7, 20131 Milano, Italy
*
Author to whom correspondence should be addressed.
Catalysts 2020, 10(3), 325; https://doi.org/10.3390/catal10030325
Submission received: 21 February 2020 / Revised: 10 March 2020 / Accepted: 11 March 2020 / Published: 14 March 2020
(This article belongs to the Special Issue Nanomaterials in Photo(Electro)catalysis)

Abstract

:
In this study, we report an investigation of the photoelectrochemical activity of TiO2 films formed by DC plasma electrolytic oxidation (PEO) at a variable potential in a sulfuric acid electrolyte at 0 and 25 °C. The surface morphology was mainly determined by the oxide-forming potential. X-Ray Diffraction and Raman analyses showed that the relative amount of the anatase and rutile phases varied from 100% anatase at low potential (110–130 V) to 100% rutile at high potential (180–200 V), while mixed-phase oxide films formed at intermediate potential. Correspondingly, the band gap of the TiO2 films decreased from about 3.20 eV (pure anatase) to 2.94 eV (pure rutile) and was red-shifted about 0.1 eV by reducing the electrolyte temperature from 25 °C to 0 °C. Glow-Discharge Optical Emission Spectroscopy (GD-OES) and X-ray Photoelectron Spectroscopy (XPS) analyses evidenced S-containing species located preferentially close to the TiO2/Ti interface. The photoelectrochemical activity was assessed by measuring the incident photon-to-current efficiency (IPCE) under Ultraviolet C (UV-C) irradiation, which showed a non-gaussian normal trend as a function of the PEO cell potential, with maximum values exceeding 80%. Photoelectrocatalytic activity was assessed by decolorization of model solutions containing methylene blue. Photoanodes having higher IPCE values showed faster decolorization kinetics.

Graphical Abstract

1. Introduction

Since the beginning of the 21st century, the application of photoelectrocatalysis (PEC) to water treatment has attracted increasing attention [1]. Compared to photocatalysis, in PEC the application of an anodic bias to the photoanode prevents electron-hole recombination, thereby greatly enhancing the quantum efficiency for the production of OH (hydroxyl) radicals. Additionally, PEC shows the typical advantages of photocatalytic processes, such as non-toxicity, no use of chemicals, potentially no secondary pollution and complete mineralization. Despite the promising features of PEC processes, they are still limited at the laboratory scale. Most of the studies available in literature use synthetic wastewater prepared by the addition of pollutants (either dyes, chemicals or pharmaceuticals) to ultrapure water [2,3]. Recently, some of the present authors have described the degradation of pharmaceuticals in real waste-water matrices, showing that PEC is more rapid, more efficient and less energy demanding compared to photolysis [4,5]. They also reported a remarkable increase of the biodegradability of real pharmaceutical wastewaters by an H2O2-assisted PEC process, compared to photolysis, photocatalysis and chemical oxidation with hydrogen peroxide [6].
However, in addition to the validation tests using several classes of pollutants and matrices, the scaling-up of PEC processes will also depend on the possibility of using relatively inexpensive electrodes. Although numerous semiconductor oxides may be used for environmental remediation purposes (TiO2, ZnO, MgO, WO3, etc.), titanium dioxide (TiO2) is the most investigated photocatalyst due to good availability, non-toxicity and low-cost [1]. PEC processes require supported catalysts in order to allow electrical biasing. A wide range of techniques have been used to obtain photoactive TiO2-based films, including sol-gel, chemical vapor deposition, radiofrequency magnetron sputtering, plasma spray, electron beam evaporation and electrochemical oxidation [7]. By assuring a good electrical contact between the support and the catalyst layer, electrochemical oxidation is undoubtedly a promising approach to guarantee an effective polarization of the catalyst. With regard to electrochemical oxidation, extensive research has been focused on the preparation of oxide nanotube (NT) arrays [8,9]. However, the synthesis of NT arrays requires several steps: (i) thermal treatment of the Ti substrate to release internal stresses (≈1–2 h); (ii) anodic oxidation to obtain an array of TiO2 NT having amorphous phase structure (≈8–12 h); (iii) thermal treatment to crystallize the amorphous phase into a mixture of anatase and rutile (≈2 h). The complete procedure is time and energy consuming, and then not easy to implement at the industrial level.
An alternative technique belonging to the class of electrochemical oxidation methods is plasma electrolytic oxidation (PEO). Although PEO is performed in a similar configuration as conventional anodizing, the physico-chemical conditions established during the process are profoundly different [10]. The high operating potential applied during PEO induces a local breakdown of the dielectric oxide with spark discharges usually associated with visible light emission and gas evolution. Therefore, the two-phase electrode/electrolyte interface associated with conventional anodic oxidation changes into a three-phase electrode/gas (plasma)/electrolyte interface. The high pressure and temperature locally induced by sparking significantly affect the oxide morphology, crystal structure and composition, promoting oxide crystallization and the incorporation of chemical species from the electrolyte [11,12,13,14,15,16]. Compared to traditional anodizing for TiO2 NT arrays [8,9], the PEO process works at higher currents and potentials, and requires a shorter processing time (less than 10 min). PEO shows some other technological advantages over the synthesis of NT arrays, in addition to the short processing time; namely: a high growth rate (roughly 1 µm min−1), the crystalline structure of the oxide [17,18] and the incorporation of chemical species from the electrolyte [10,17,18]. Some of the present authors reported that TiO2 films obtained by PEO can outperform TiO2 nanotube arrays, showing quantum yields higher than 90% in photon-to-electron conversion [17]. They also demonstrated that TiO2 films obtained by PEO are effective in water decontamination [3,4,6]. Additionally, the PEO process has been known since decades as an industrial technology to synthesize protective layers on aluminum and magnesium alloys [10], and titanium alloys, mostly Ti-6Al-4 V for biomedical implants [19]; therefore, no big issues are foreseen for the development of PEO processes to produce TiO2 photoanodes at the industrial scale.
Compared to NT arrays, studies of the photocatalytic behavior of nanoporous oxide films obtained by PEO are relatively scarce [20,21,22,23,24,25]. In fact, PEO TiO2 films are not even mentioned in several recent review papers on the environmental applications of photoelectrocatalysis (PEC) [1,26,27]. In fact, as already mentioned, PEO of titanium and its alloys, has been mostly applied for biomedical applications [28,29,30]. Conversely, in the area of photocatalysis, the research has been concerned particularly with two specific aspects related to solar assisted hydrogen production: first, the correlation between oxide structure and its photocatalytic behavior [18,31]; secondly, the shift of the adsorption band of PEO TiO2 films, either by oxide doping—with S [32], B, N [33], Ni [34], Zn [35], Cr [36], V [25] or Eu [37]—or by formation of composite coatings; i.e., WO3-TiO2 [20].
Surprisingly, most of the studies available in literature do not report the photoelectrochemical activity (PEA) of PEO photoanodes. PEA can be measured by electrochemical photo-voltammetry under either polychromatic or monochromatic irradiation and potentially enables a straightforward comparative evaluation of different photoelectrodes. There are also virtually no data for the band gap values of TiO2 films obtained by PEO. Finally, most of the PEO catalysts described in the literature, obtained in alternating current (AC)/pulsed mode, are traditionally applied to obtain thick and compact protective layers on Al and Mg alloys [10]. On the contrary, photoactive oxide coatings should have high surface areas and thicknesses close to the penetration depth of the incident light [38]; therefore, direct current (DC) mode would probably be more appropriate. Lukiyanchuk et al. recently showed that DC PEO is a very promising operation mode with which to obtain high surface area porous morphologies [23]; however, they did not show evidence of the advantage given by DC mode for the synthesis of undoped TiO2 photoanodes. DC mode operation was also applied by Stojadinovich [37], Bayati [21] and Wan [39], focusing on doping, but no results were shown on the photoelectrochemical activity of the semiconductors, which in this paper is presented as a tool to foresee the photocatalytic activity of the catalysts in water treatment.
The present paper focuses on DC plasma electrolytic oxidation with the aim of contributing to the validation of PEO as a viable route to produce TiO2 photoanodes and as a step forward in the technological development of photoelectrocatalysis in water treatment. PEO TiO2 photoanodes are characterized not only in terms of morphology, crystal structure, composition and photocatalytic activity in the decolorization of a commercial dye, but also considering band-gap and incident photon-to-current efficiency (IPCE), trying to correlate IPCE and photocatalytic activity. We recently described the effect of electrolyte temperature during DC PEO of Ti in 0.5 M H2SO4, showing that tuning this parameter can be an effective way to optimize the phase proportion of anatase and rutile, and the resulting electrochemical photoactivity [17,40]. As a further step in this direction, the present paper explores the combined effect of applied potential and electrolyte temperature on the physical properties of the coatings with the aim of supporting a deeper understanding not only of the photocatalytic activity but also, and more in general, of the photoelectrochemical activity of PEO TiO2 photoanodes.

2. Results and Discussion

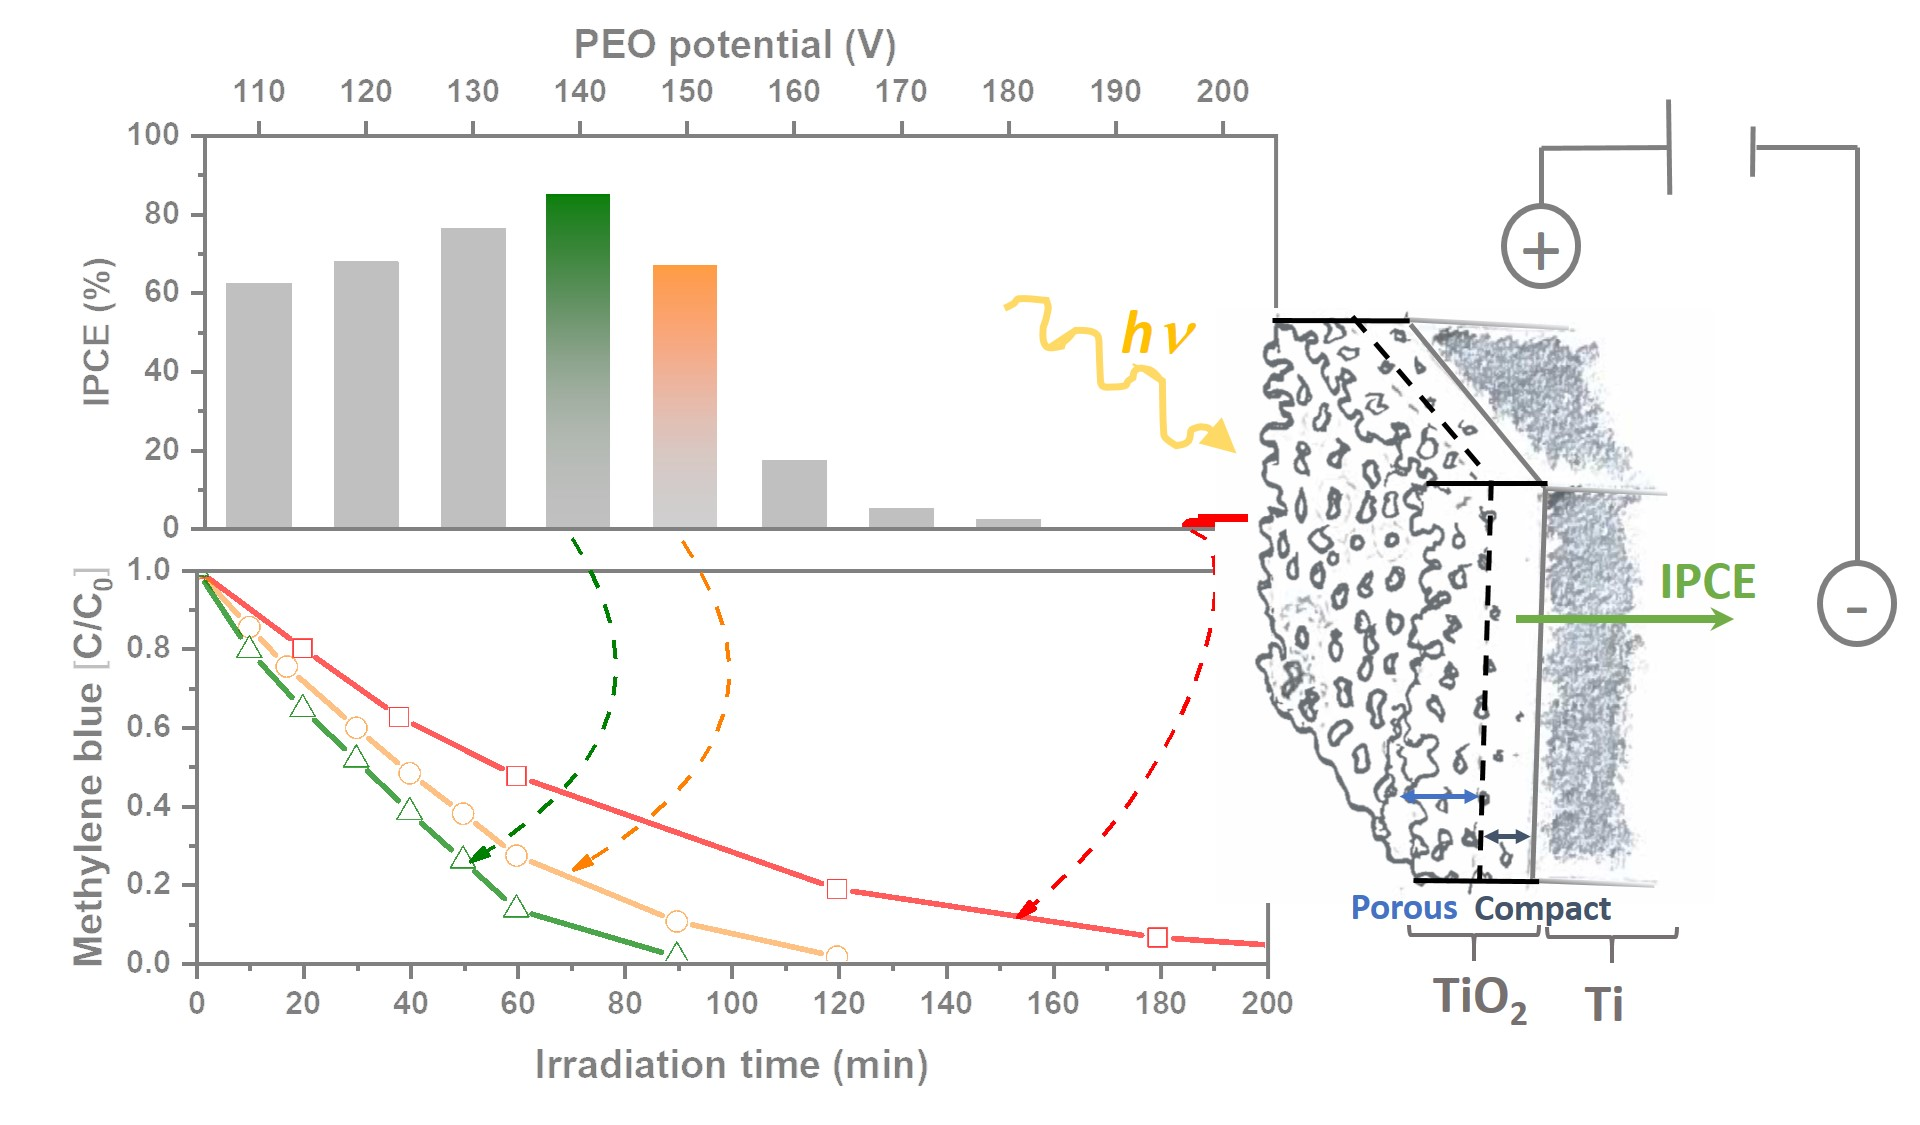
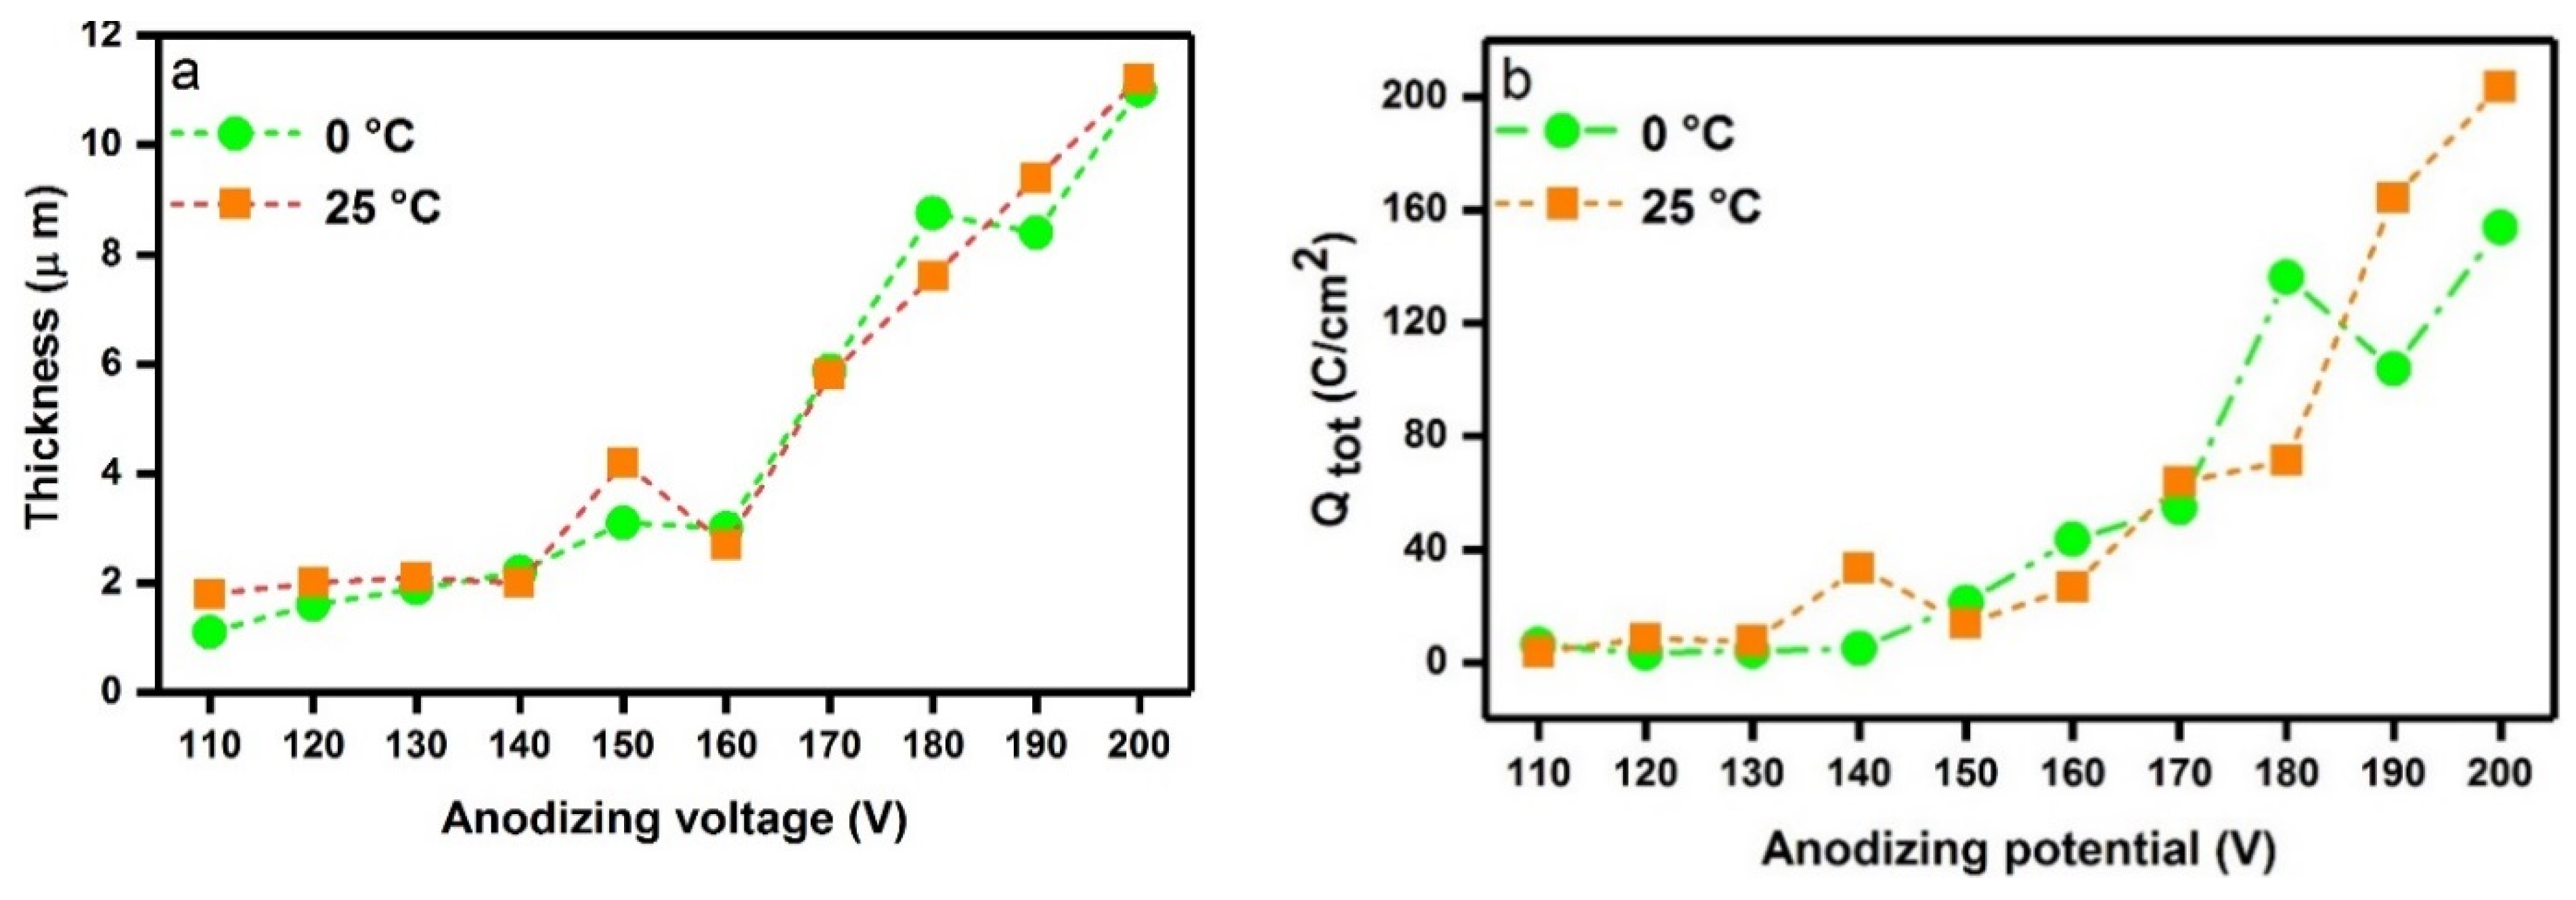
2.1. Oxide Thickness and Surface Morphology

PEO anodizing conditions were established over the whole range of cell potential used in this work, irrespective of the electrolyte temperature, as revealed by micro-discharge development at the anode and by the coating morphology, as shown further on. The relationship between the thickness of PEO-TiO2 films derived from GD-OES measurements and the anodizing potential at electrolyte temperatures of 0 °C and 25 °C is shown in Figure 1a. Apparently, the anodizing potential is the main factor controlling the oxide thickness, whereas the electrolyte temperature has an overall negligible effect. At first, in the range of low potential up to about 140 V, the thickness increased slightly from about 1 to 2 µm; then, the increase was much steeper for potential in excess of the latter value. Notably, the increasing trend of thickness and its values with increasing potential agree with the results reported in [41] for oxide coatings formed in a mixed H2SO4-H3PO4 electrolyte. Expectedly, the charge passed during film growth (Figure 1b)—derived from the integration of the current vs. time profile at varying potential—shows a similar trend to that of the thickness vs. potential, pointing to two different kinetic regimes of oxide growth, at low and high potentials, which were ostensibly associated with relatively lower and higher micro-discharge rates and lifetimes, respectively.
As shown in the SEM and AFM micrographs (Figure 2), and also in Figures S2 and S3, respectively, in the Supplementary Material, the morphology of the TiO2 samples is characterized by the typical features of oxides obtained by PEO. Indeed, the oxide layers are obviously porous, with pore diameter increasing with the oxide formation potential, and that being slightly larger on samples anodized at 0 °C compared to 25 °C. Correspondingly, the average surface porosity increased with potential from about 2–3% to 13%, at 25 °C, and to 24%, at 0 °C. Remarkably, SEM images revealed a distinct change in the film morphology at a potential of 140 V or higher, apparently because of spreading and interconnecting porosity; namely, a transition from the porous layer type morphology observed at lower potentials to the sponge-like morphology obtained at a potential of 140 V or higher. Since porosity is mainly due to the occurrence of micro-discharges, along with the extrusion of entrapped gas bubbles through the softened material during the PEO process [42], this morphological transition is the material evidence of the space-time intensification of micro-discharges with increasing potential.

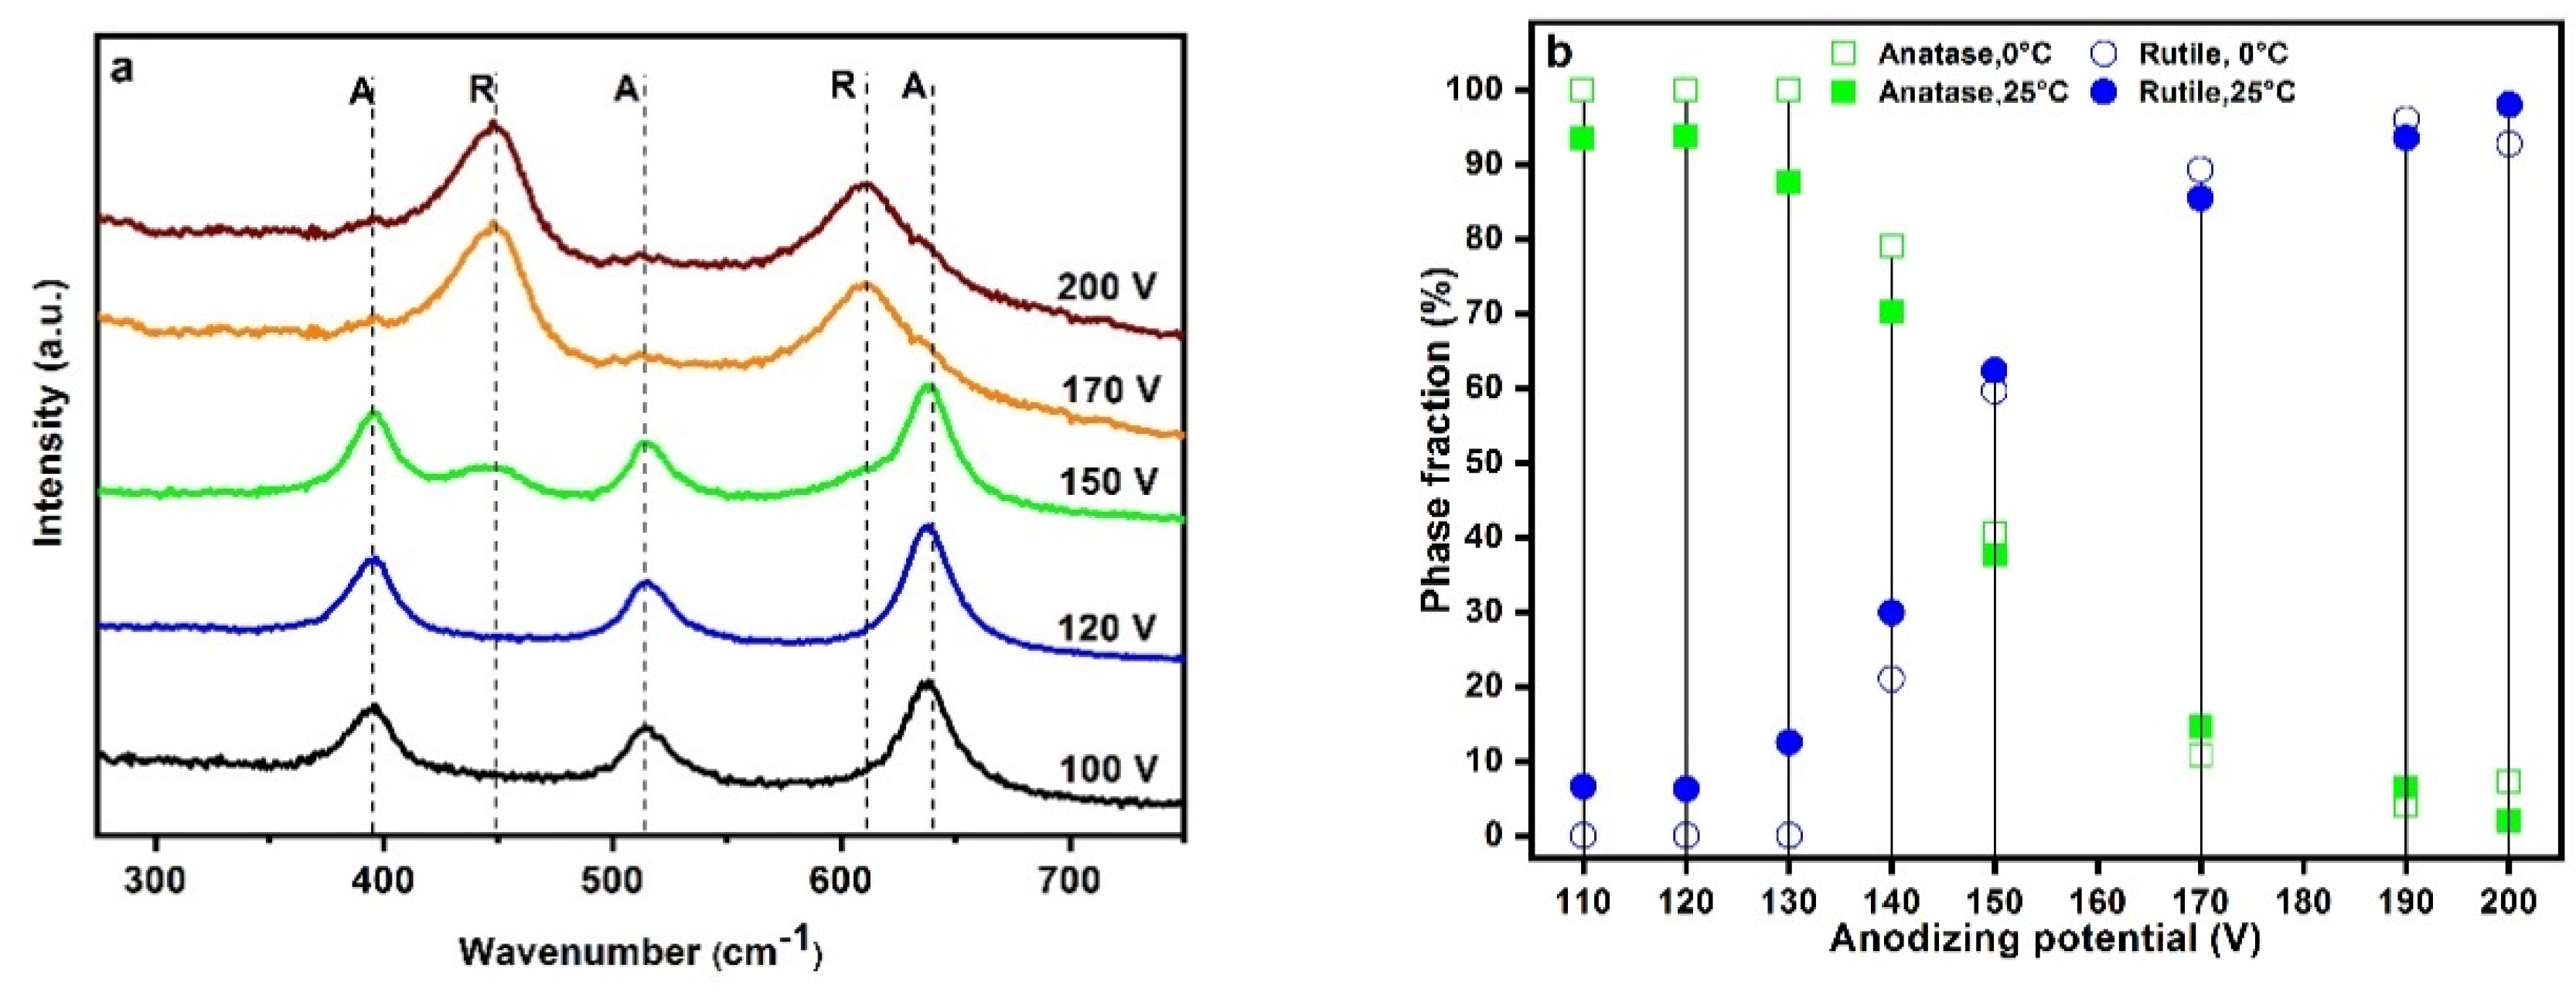
2.2. Crystal Structure

Raman spectra of the TiO2 films demonstrated that the TiO2 films are crystalline and consist of pure anatase and rutile phases or mixtures of the same phases depending on the PEO voltage (Figure 3a). This was further confirmed by XRD patterns of oxide films formed at 0 °C or 25 °C at varying potentials, as shown in Figure S4 in the Supplementary Material. Apparently, as-prepared TiO2 films were mostly crystalline in structure with varying relative amounts of the anatase and rutile phases depending on the applied potential. However, the presence of a minor amorphous component in the structure cannot be ruled out completely, based on conventional XRD evidence, possibly also because of its distributed nature, as recently suggested in literature [43]. Based on the XRD patterns and the Spurr equation (Equation (1)), the mass fractions of the anatase and rutile phases, as functions of the potential for oxide films prepared at 0 °C or 25 °C, were calculated (Figure 3b). The overall trend emerging from these data is that oxide films grown at a potential below 140 V are uniquely or predominantly of the anatase phase, at low and high electrolyte temperatures, respectively, whereas higher PEO potentials entail the formation of oxide coatings with a predominance of the rutile phase. With potential exceeding 130 V, the rutile mass fraction increases rapidly, such that in the high potential range (170 V or higher), almost pure rutile is formed. The reducing trend of the anatase mass fraction with increasing PEO potential, and then with increasing thickness, is in agreement with the literature [18], and can be explained as a result of stronger local heating of the oxide film induced by more intense discharge phenomena. Correspondingly, the effect of the bath temperature on oxide phase structure—namely, a relatively higher fraction of anatase in oxide films grown at 0 °C compared to 25 °C—is limited to the low range of potential (<150 V), in agreement with our previous work [17].
In Figure S5 in the Supplementary Material, the lattice parameters a and c and the c/a ratios for the anatase and rutile phases in TiO2 films are shown. The arrows indicate the corresponding values given by the relevant powder diffraction files. The lattice parameters of the anatase phase reveal a significant distortion of the structure. In particular, the a parameter of the tetragonal cell is significantly smaller compared to the reference value, whereas the c parameter is either higher than (at low potential) or in agreement with the reference value. Correspondingly, in the low potential region, the c/a ratio of the anatase decreased from about 2.60 to 2.52. Conversely, the lattice parameters of the rutile phase are in overall good agreement with the reference values (mind the narrow scale range in the plot of Figure S5 for the lattice parameters of the rutile phase), the largest percentage difference of the c/a ratio with respect to the reference value being about 0.27% (at 150 V and 25 °C). Therefore, the unit cell of the anatase phase is significantly stretched along the c axis direction; namely, for oxide formed at a low temperature and low potential.

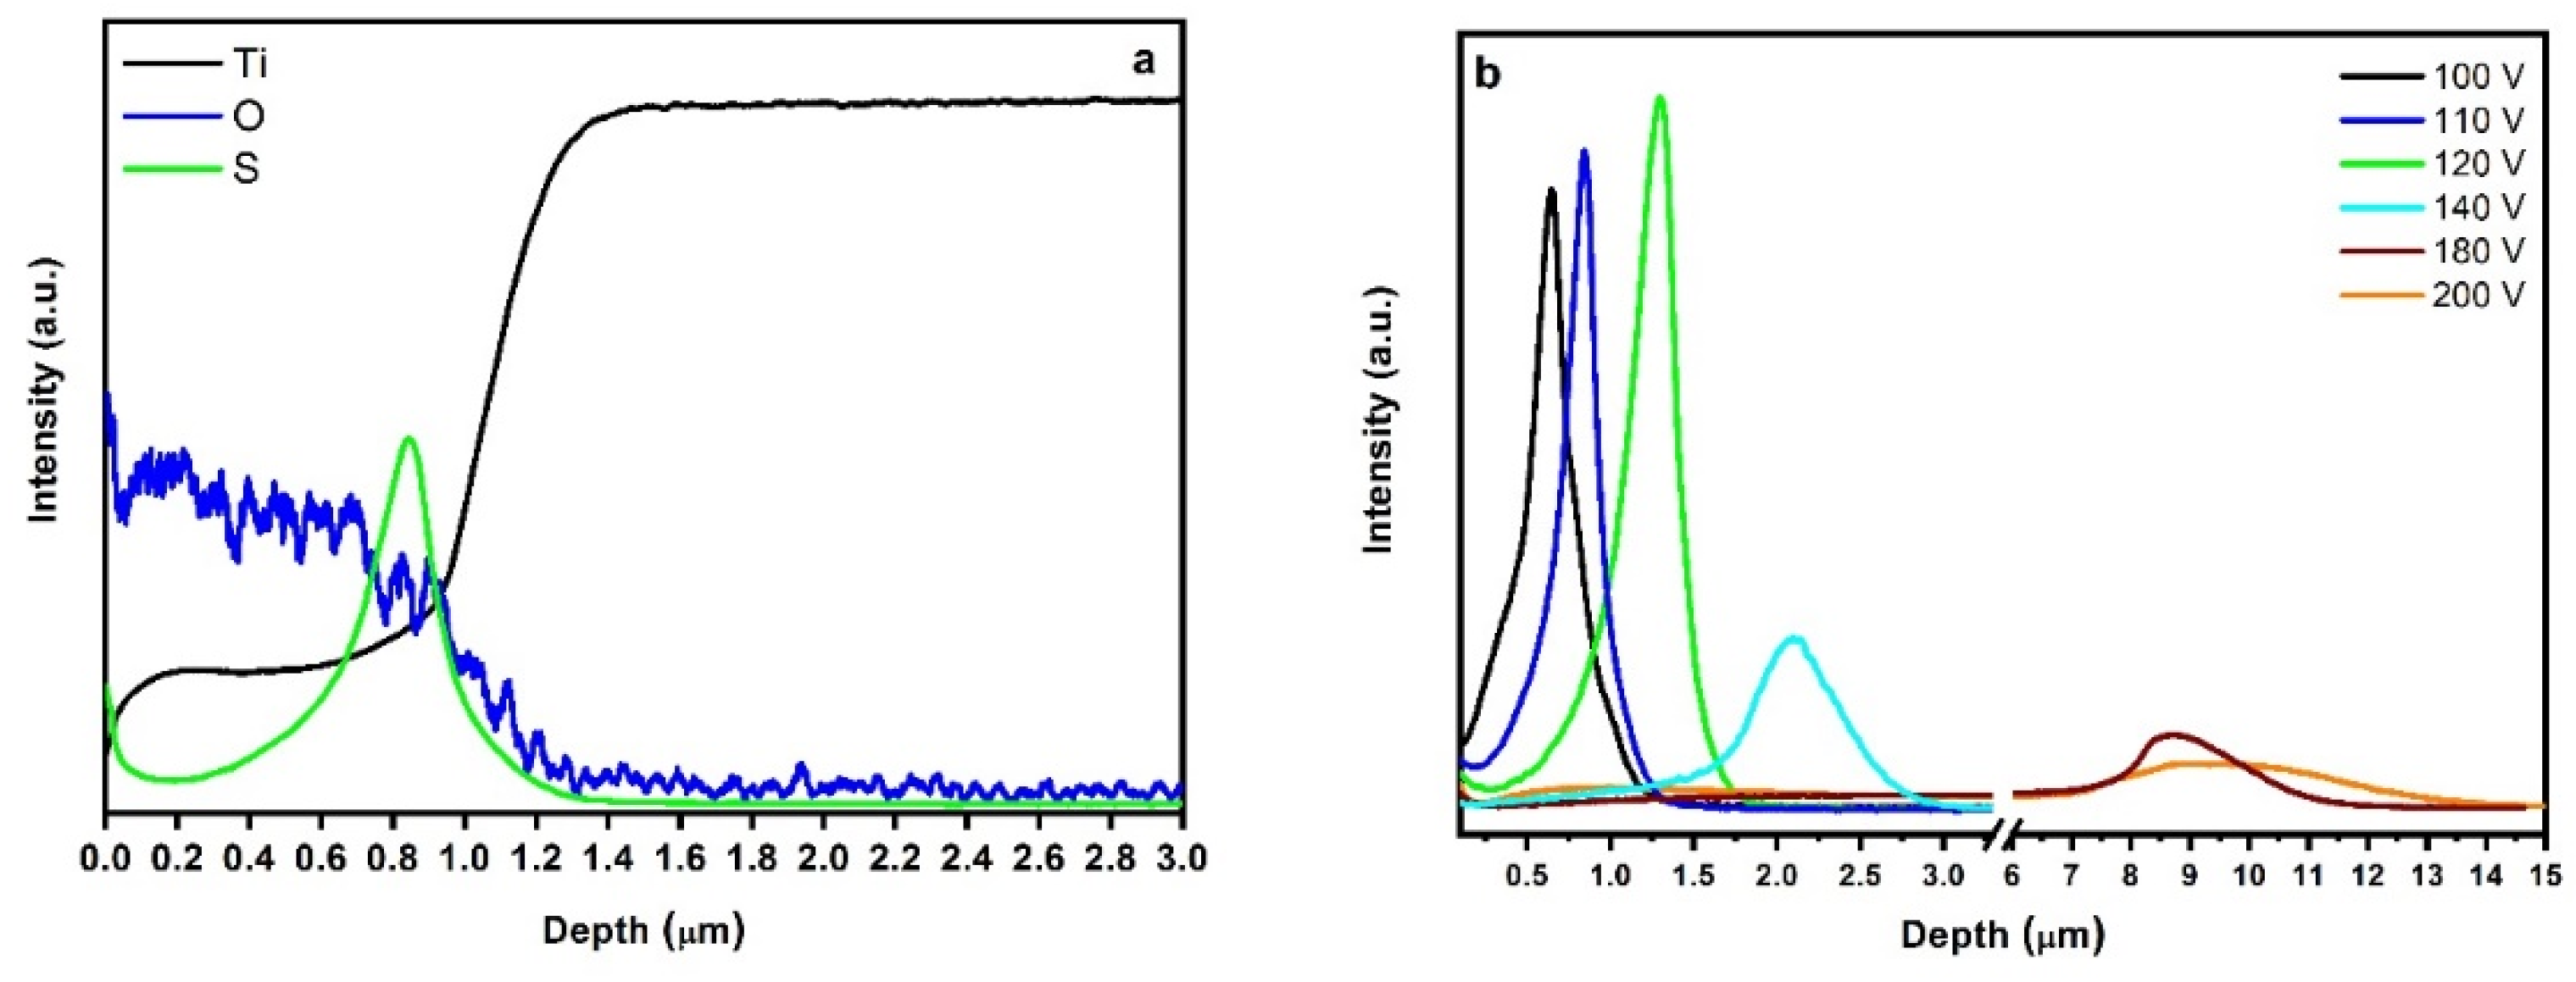
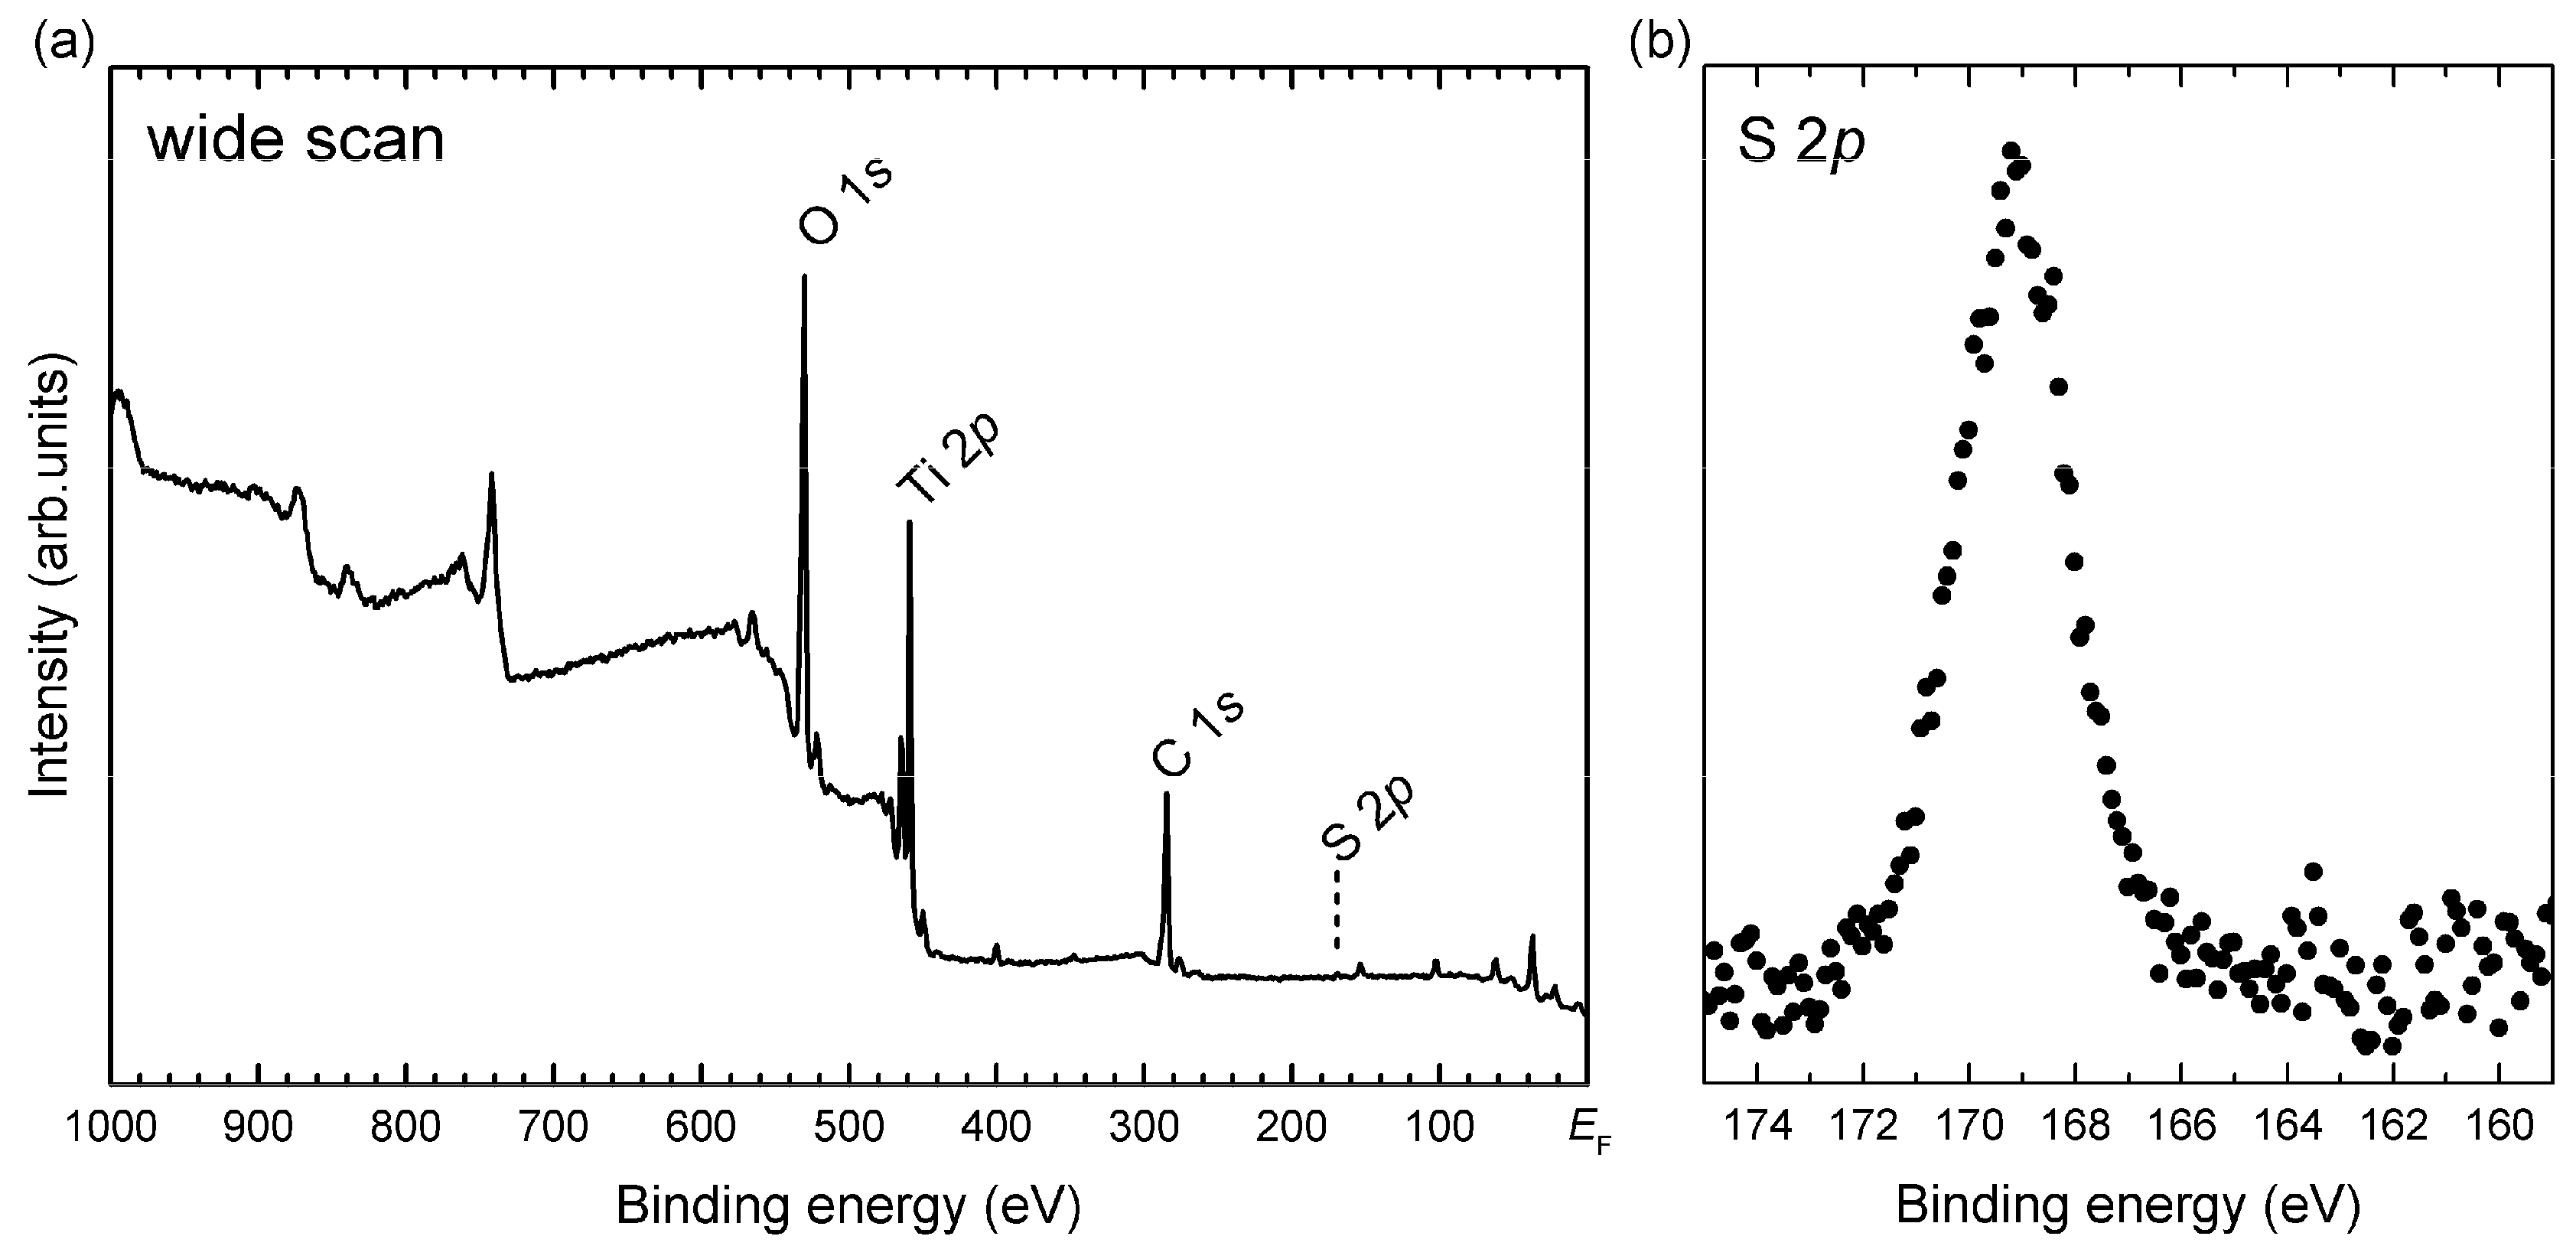
2.3. In-Depth Composition Profile

In-depth GD-OES analysis of TiO2 films for some selected samples at different potentials are shown in Figure 4. In addition to the expected signals for oxygen and titanium atoms, a peak corresponding to sulfur in the proximity of the TiO2/Ti interface is evident. The sulfur signal showed a wide tail towards the film surface, which is more pronounced at higher anodizing potentials. It can be argued that at the first stage of the anodizing process, a higher amount of sulfur is included in the film, as S O 4 2 -containing species impregnating the pores, S-containing species included in the TiO2 or both [44]. At higher anodization potentials, the sulfur-containing species increasingly spread across the whole thickness. This might be attributable to more intense and dense sparking; in fact, in these conditions, the melted material repeatedly remix and sulfur-containing species can more easily migrate towards the surface of the film.
The nature of the S-containing species was further investigated by XPS analysis. Figure 5 shows a wide scan where the position of the main features observed with XPS (photoemission signals from O, Ti and C) are marked with labels. The position of the S 2p feature is highlighted with a vertical dashed line. Panel (b) shows a close-up of the S 2p binding energy (BE) region, characterized by the presence of a feature at a BE of about 169.2 eV. The energy position of this peak is compatible with the superposition of the photoemission features from S4+ and S6+ species (at a BE of 168.8 and 169.5 eV, respectively), in agreement with the literature [45]. Therefore, it can be argued that S could be included both as adsorbed SO42− and doping element.

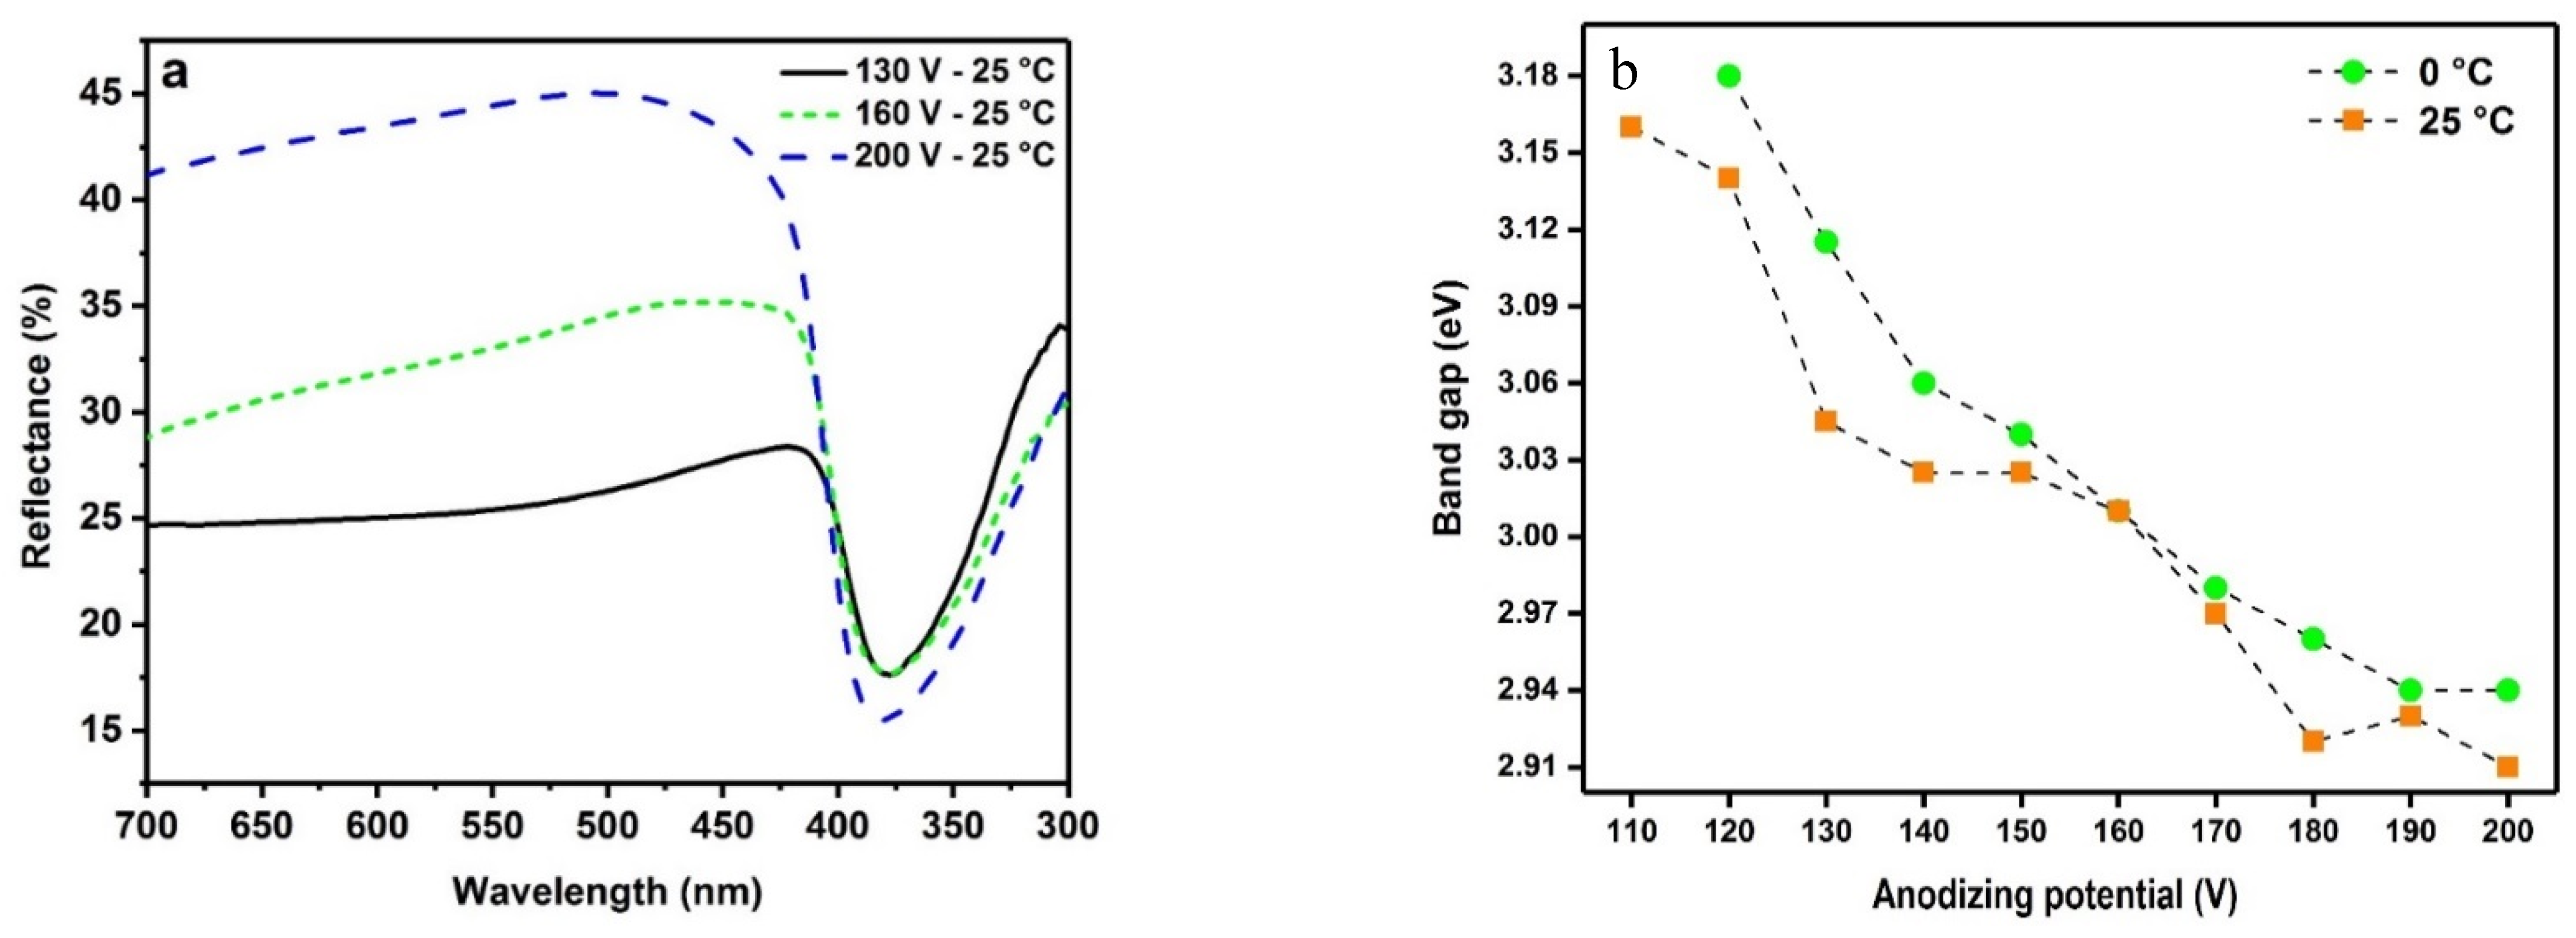
2.4. Optical Properties

The UV–Vis spectra of some representative samples are shown in Figure 6a. The band gap was calculated based on the reflectance UV–Vis spectra after Kubelka–Munk conversion using the Tauc plot method [46], as shown in Figure S6 in the Supplementary Material for some selected processing potential and electrolyte temperature. However, in some cases the band gap could not be reliably derived from Tauc plots due to interference fringe perturbation. The calculated band gap is plotted in Figure 6b as a function of processing potential. Increasing the applied potential, the band gap decreases gradually from values close to 3.2 eV to values close to 2.94 eV, following the modification of the phase structure from pure anatase to rutile phase as shown in Figure 3b.

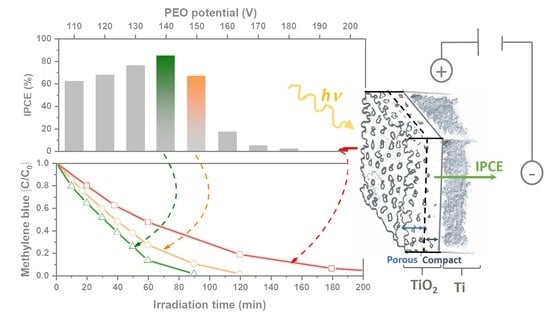
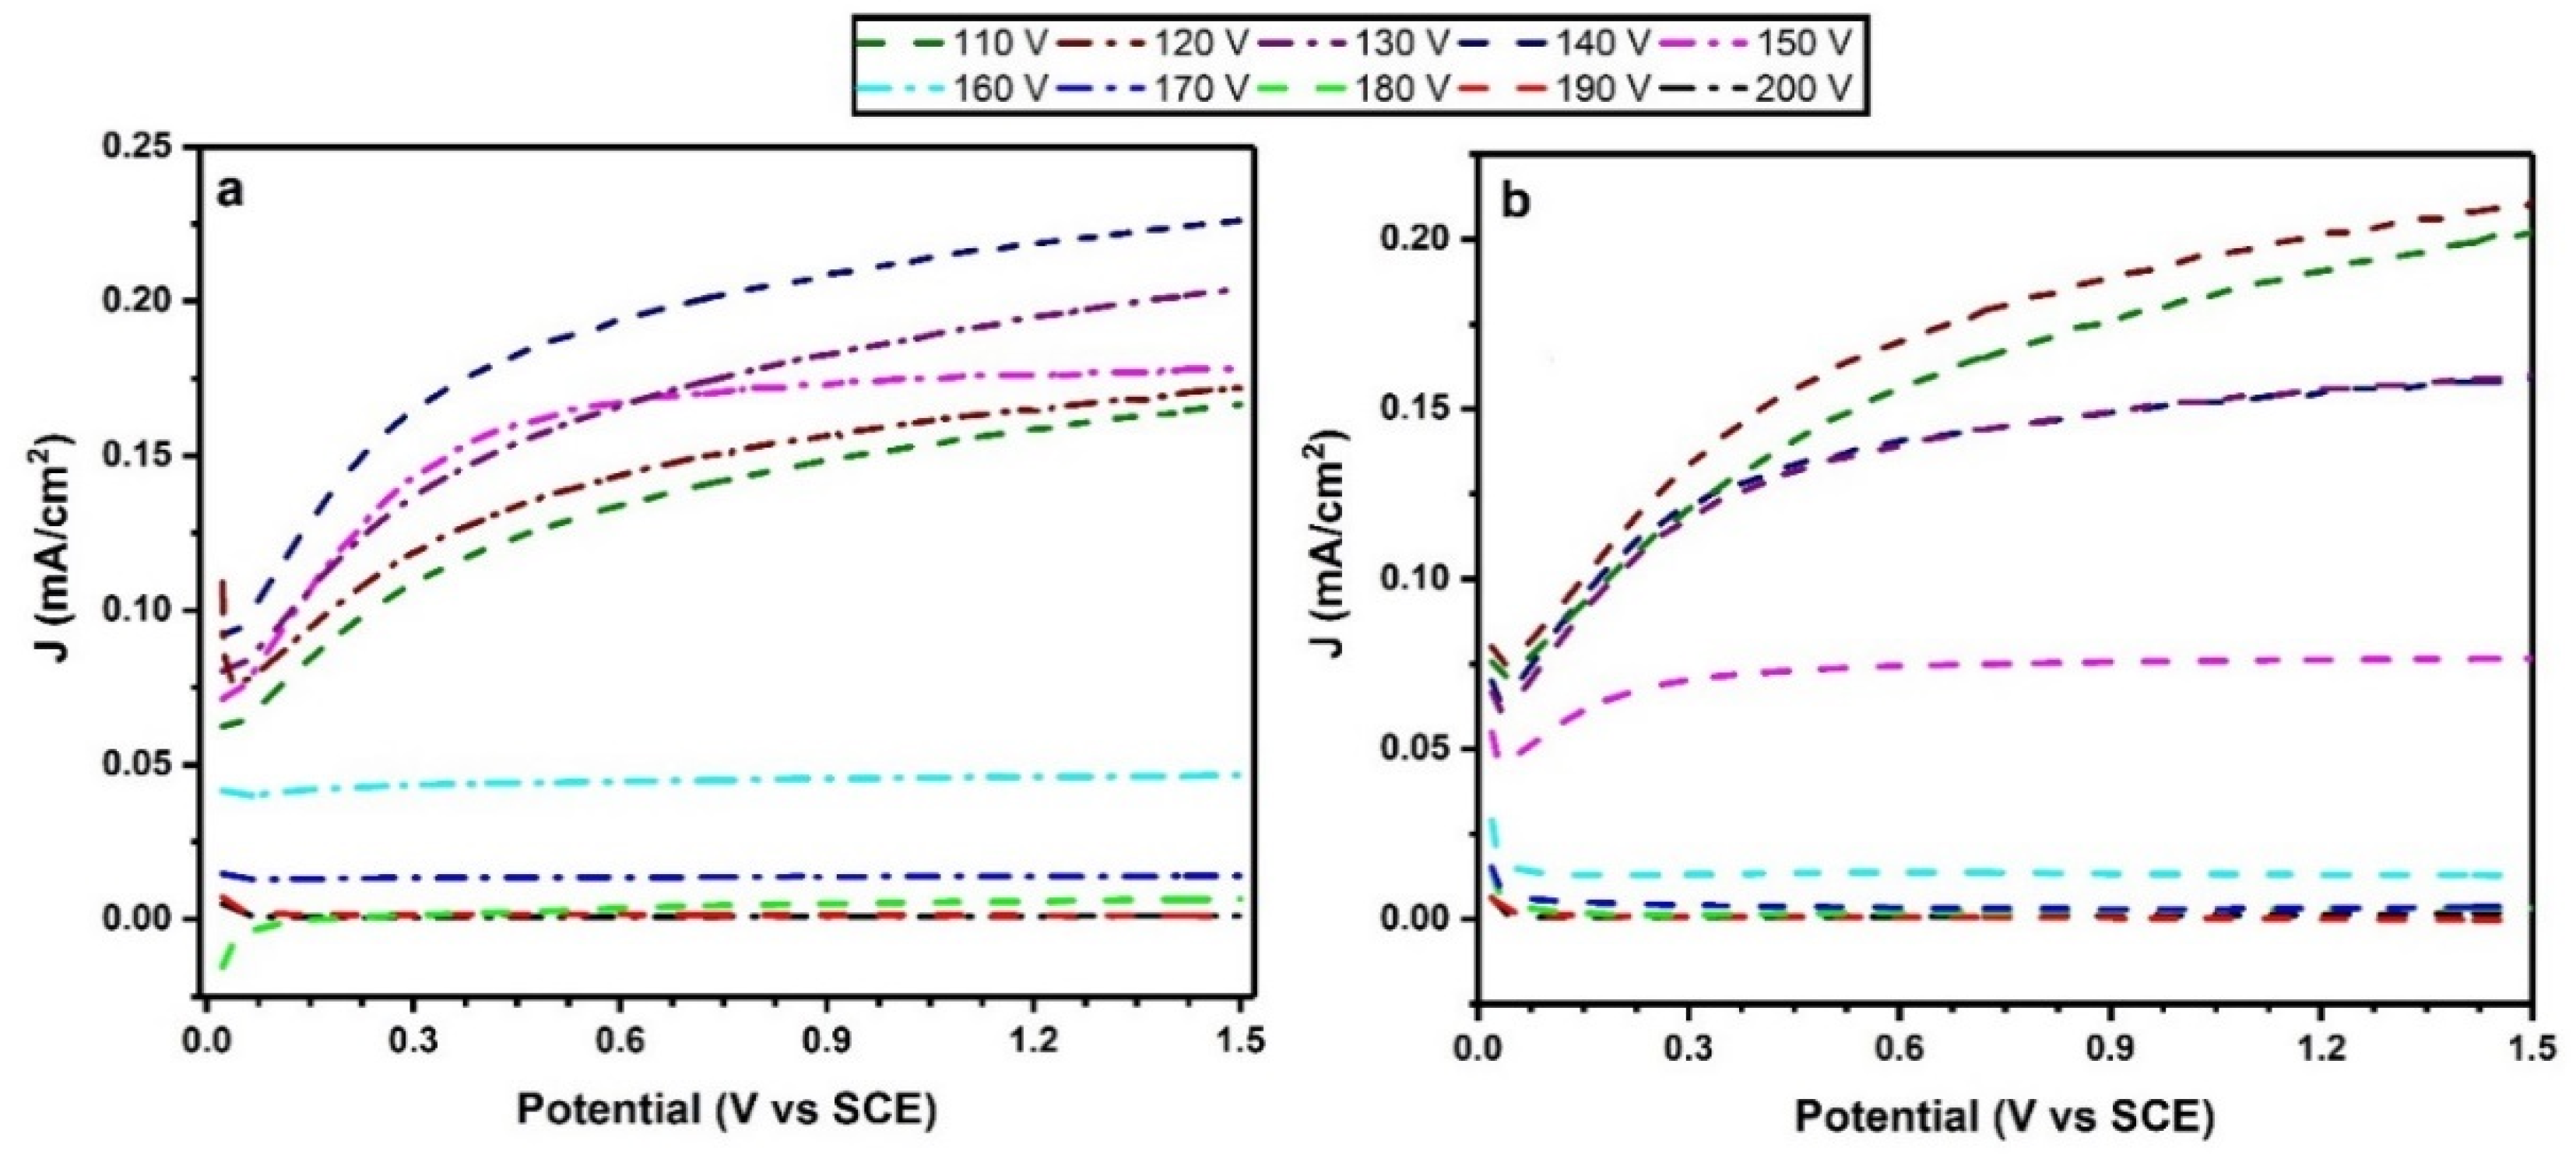
2.5. Photoelectrochemical Activity

The PEA of TiO2 films was assessed by measuring the photocurrent response of the films under electrical bias, i.e., by linear voltammetry in the dark, and under UV-C irradiation from 0 V to 1.5 V vs. Standard Calomel Electrode (SCE). Figure 7a,b shows the photocurrent-potential characteristics of TiO2 coatings obtained at PEO potentials in the range of 110–200 V and electrolyte temperatures of 0 °C and 25 °C, respectively. Overall, the changes in the shapes of the photocurrent curves can be related to the PEO potential and the phase structure of the oxide. For PEO potentials in the range of 110–140 V and at electrolyte temperature of 0 °C, where anatase phase structure is largely predominant (80% or higher mass fraction), the photocurrent density showed an initially steep increase followed by a continuous but much slower raising trend. Similarly, for oxides grown at potentials in the range 110–140 V at 25 °C, the photocurrent density increases continuously with the potential, though at a receding rate; in particular, for oxides formed at 130 and 140 V. In contrast, oxides grown at 160 V or above, having a predominant rutile phase structure and higher thickness, showed a plateau-like region, and poor photo-electrochemical activity, regardless of the electrolyte temperature. In particular, for oxides grown at 150 V, as the phase composition of the oxide changed from a dominant fraction of anatase to a dominant fraction of rutile phase, a well-developed plateau of photocurrent density appeared. As a final remark, it can be noticed that the oxides formed at 140 V (electrolyte at 0 °C) and at 120 V (electrolyte at 25 °C) showed the maximum of the photocurrent density.
For a straightforward comparison and a summary of the photoelectrochemical activity, Figure 8 shows the IPCEs of the different oxides at the potentials of 0.6 V (a) and 1.5 V (b) vs. SCE. Oxide films formed at potentials in the range of 110–150 V showed IPCE values close to or higher than 60%, reaching maxima of 82% and 88% at 110 V (25 °C) and 140 V (0 °C), respectively. The IPCE then decreased abruptly to values lower than 20% for the oxides having a large fraction of the rutile phase and thickness in excess of about 3 µm (Figure 1a). Therefore, the PEA of the TiO2 films can be tuned by controlling either electrolyte temperature or PEO potential. In agreement with previous findings [17], oxide films formed at low temperature show an overall improved performance in terms of both photocurrent response and corresponding IPCE.
Summarizing, it was observed that in addition to the effect of the oxide phase structure, namely, the anatase/rutile fraction, the photocurrent response of the PEO-TiO2 films appears to be affected by the film thickness. However, as reported in literature, for a more exhaustive explanation of the PEA of TiO2 coatings, other properties, such as refractive index, scattering coefficient, surface roughness and absorption coefficient, should also be considered [47].

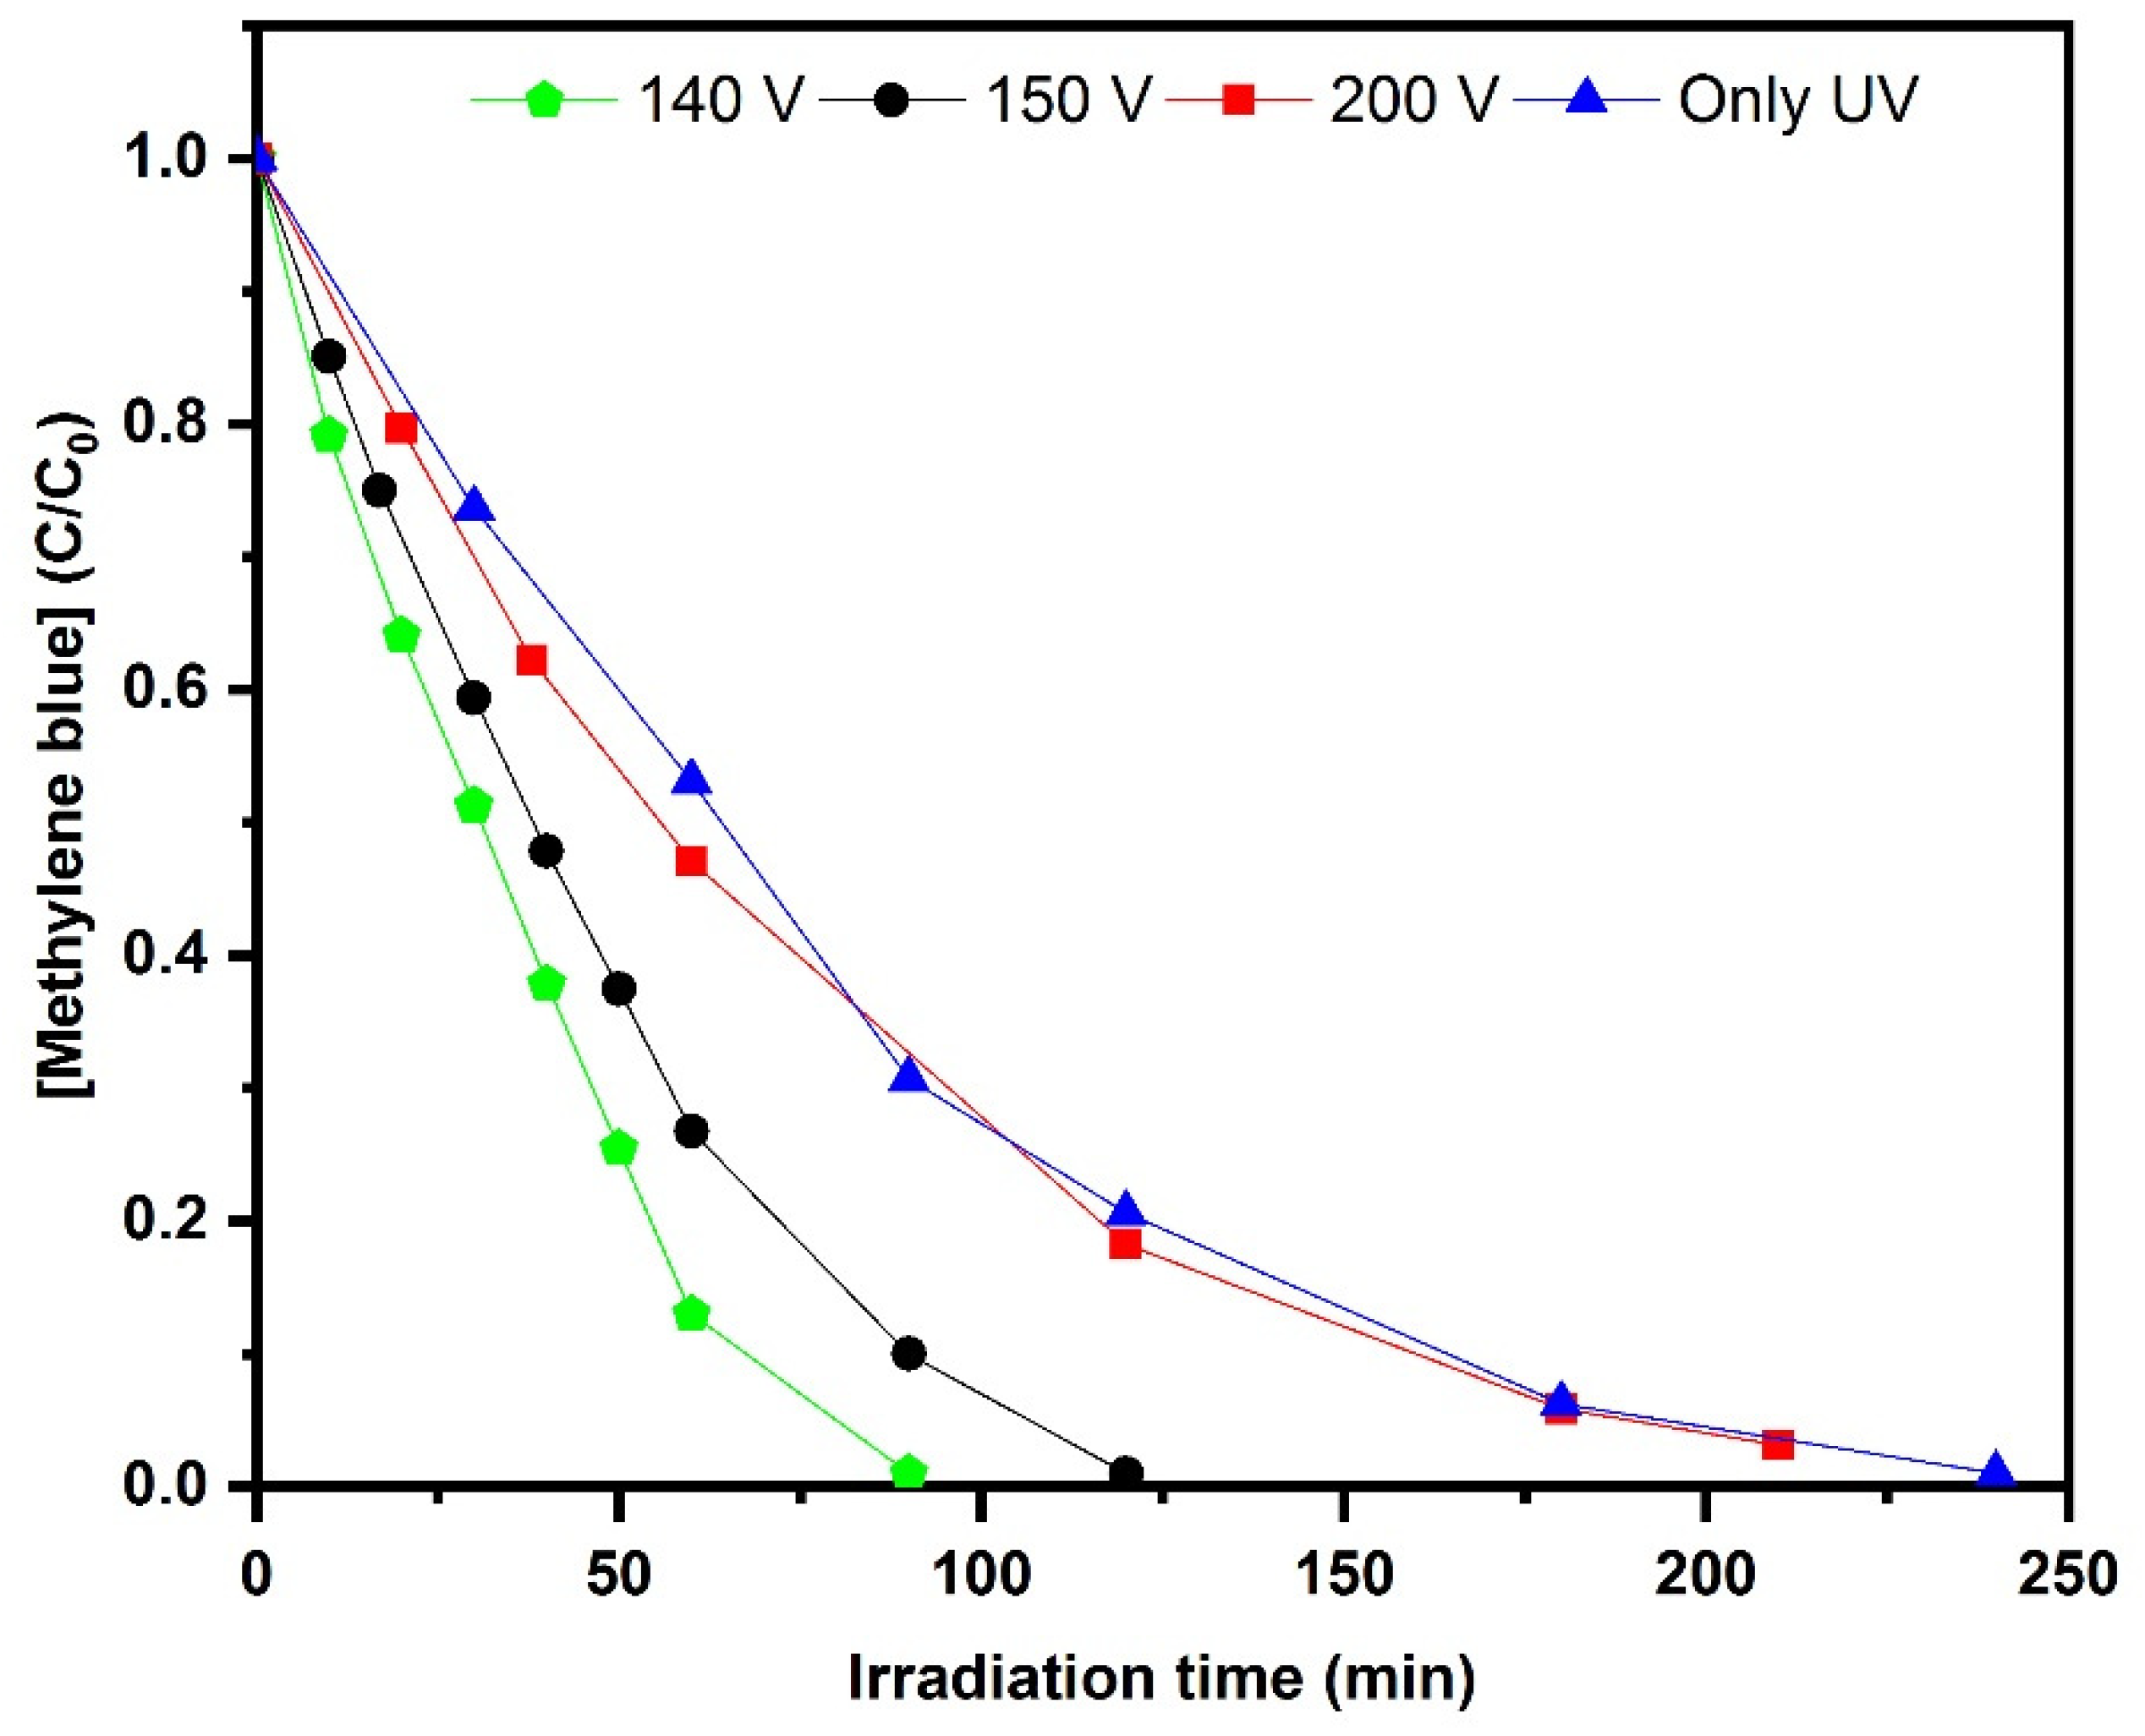
2.6. Photoelectrocatalytic Decolorization of Methylene blue

Degradation of Methylene Blue was carried out to verify the photoelectrocatalytic activity of the PEO TiO2 anodes with respect to the corresponding IPCEs. The initial concentration of Methylene Blue was 5 µM and the measurement was conducted in a 150 mL quartz beaker using a three-electrode cell configuration where TiO2 (exposed area of 1.5 cm2), a saturated calomel electrode and a platinum foil were used as working, reference and counter electrodes, respectively. The irradiation source was the same UV light used for photocurrent measurement. The reaction kinetic constant was calculated following the Langmuir–Hinshelwood model.
In Figure 9, the relative residual concentration of methylene blue (C/C0) is represented as a function of the irradiation time. Decolorization was carried out by photoelectrocatalysis using some selected TiO2 anodes and by photolysis for comparison. The selected TiO2 anodes were prepared at 0 °C and 140, 150 and 200 V, respectively. As previously mentioned, the TiO2 photoanode prepared at 200 V consisted mostly of the rutile phase, and the IPCE under UV-C irradiation was below 1%. Correspondingly, under irradiation and electrical bias, this photoanode showed the lowest decolorization rate (k = 0.015), not exceeding the kinetic rate obtained by photolysis (only UV, no photoanode), so a complete decolorization was obtained after 240 min. By reducing the PEO cell potential to 150 V, the TiO2 film consisted of a mixture of anatase and rutile, and its IPCE was around 75%. Compared to the anode prepared at 200 V, this anode showed a faster decolorization rate (k = 0.021), and complete decolorization was achieved after 120 min. In agreement with the IPCE values reported in Figure 8, the fastest decolorization kinetics were observed by the TiO2 photoanode synthesized at 140 V (k = 0.030), with complete decolorization after 90 min. The highest kinetic rate constant measured by photoelectrocatalysis was twice as high as photolysis. This is a reasonable result, considering that Methylene Blue is relatively sensitive to UV irradiation and that the catalysts employed in the decolorization test had a limited exposed area (only 1.5 cm2). Some of the authors recently demonstrated that photoelectrocatalysis can outperform photolysis when recalcitrant compounds are targeted and/or when the nature and the concentration of transformation products are considered [3,4,5,6]. In the present investigation, the decolorization of Methylene Blue was meant to demonstrate a correlation between the photoelectrocatalytic performances and the IPCEs of the PEO TiO2 films. In fact, it was observed that higher IPCE values corresponded to higher kinetic rate constant values, though the correlation between the two parameters is not linear. This lack of linearity might be tentatively explained considering that, in addition to the degree of photoactivation of the catalysts, mass transport into the porous structure can affect the overall degradation kinetics. However, for the selected photoanodes and the targeted pollutant, substantial agreement was observed between the IPCE values and the photoelectrocatalytic activity, confirming that PEO is a viable technique to produce photoactive TiO2 electrodes and also that measuring the photoelectrochemical activity of the electrodes by linear-sweep photovoltammetry is a promising approach to evaluate and possibly to monitor the photoelectrocatalytic activity of the electrodes.

3. Materials and Methods

3.1. Synthesis of TiO2 Films

TiO2 coatings were obtained by plasma anodizing of grade I titanium sheets (4 cm2 area) in 1.5 M H2SO4 (14.7 wt. %), at varying constant potentials in the range of 110–200 V for 5 min. Visually, all the samples had a light gray and uniform appearance. The electrolyte temperature was controlled at about 0 °C or 25 °C by means of a cryostat (HAAKE D10, Thermo Electron Corp., Karlsruhe, DE). The shift of the temperature from the set-point of 0 °C or 25 °C was at most 5 °C, when operating at high values of the cell potential; namely, when the latter was in excess of 180 or 170 V, respectively. Following PEO, the samples were first rinsed with water, and then dried in a stream of air. All PEO samples were prepared in duplicate.

3.2. Morphologies and Crystal Structures of TiO2 Films

The surface morphology was observed using a scanning electron microscopy (SEM, EVO 50, Carl Zeiss Jena GmbH, Jena, DE) instrument. The phase structure and texture of each TiO2 film was assessed by X-ray diffraction (XRD) and Raman spectroscopy. XRD was carried out using a PW1830 instrument (Malvern Panalytical Ltd, Malvern, U.K. and Almelo, NL) operating in Bragg–Brentano geometry at a potential of 40 kV with a filament current of 40 mA. Spectra were acquired with Cu Kα1 radiation in the 2θ range 20°–90° at the scanning rate of 2.5° per minute. The XRD patterns were indexed according to the powder diffraction files released by the International Center for Diffraction Data (U.S.A.) for titanium (PDF 44-1294), anatase (PDF 21-1272) and rutile phases (PDF 21-1276).
To calculate the lattice parameters a and c, a least mean square method was applied using the interplanar spacing of (101), (103) and (200) reflections for the anatase phase, and the (110), (200) and (210) reflections for the rutile phase.
The weight fraction of anatase was calculated according to Equation (1) [48], where IR is the intensity of the strongest rutile reflection, (110), and IA is the intensity of the strongest anatase reflection, (101),
f A = 1 ( 1 + 1.26 ( I R ) ( I A ) ) %
Micro-Raman spectra were acquired using a LABRAM HR800 spectrometer from HORIBA, Ltd. (Kyoto, JPN) equipped with a Peltier cooled CCD detector. The λ = 514 nm excitation line was provided by an argon ion laser (Stabilite 2017, Spectra Physics, Santa Clara, U.S.A.). The laser radiation was filtered by an interference filter and focused on the sample through a 50× objective with a 0.75 numerical aperture. The Rayleigh radiation was rejected using an edge filter for the 514 nm laser line.
Surface porosity was evaluated by analyzing several SEM surface micrographs taken at 20,000x magnification using ImageJ analysis software, an open-source image processing program released by the National Institutes of Health, U.S.. Film thickness and in-depth composition profile were assessed by Glow-Discharge Optical Emission Spectroscopy (GD-OES) using a Spectruma GDA750 analyzer (SPECTRO Analytical instruments Inc., Kleve, DE) operating at 700 V in an argon atmosphere at 230 Pa. GDOES analysis was carried on sample areas of ≈2.5 mm diameter. The monitored light emission wavelengths during the analysis were 130 nm and 362 nm for oxygen and titanium, respectively. XPS data were acquired with a Phoibos 150 hemispherical analyzer (SPECS GmbH, Berlin, DE) by exciting the electrons with a Mg-Kα source (hν = 1253.6 eV). The spectrometer is housed in a home-built vacuum system described elsewhere [49] and kept in ultra-high vacuum conditions (base pressure in the low 10−8 Pa). We accounted for possible charging effects by setting the peak from adventitious carbon to 285 eV [45].

3.3. Photoelectrochemical Properties of TiO2 Films

The photocurrent was measured by linear sweep photo-voltammetry (LSPhV) in a 4.2 mM KCl aqueous solution with and without irradiation. LSPhV was conducted at a scan rate of 5 mV/s at room temperature using a potentiostat/galvanostat (Solartron Analytical ModuLab ECS, Ametek Inc., Berwyn, U.S.). A saturated calomel electrode (SCE) was used as a reference and the counter electrode was a Pt foil.
The irradiation was achieved by means of a 30 W low-pressure Hg vapor lamp (HGL, Helios Italquartz, Cambiago, IT) emitting at λ = 254 nm. The emission spectrum of the light source is shown in Figure S1 in the Supplementary Material. The irradiance on the TiO2 film at 254 nm was 1.3 W/m2 as measured by quantum-photo-radiometer (PM200,Thorlabs Inc., Newton, U.S.). The exposed area during PEO and LSPhV was 4 cm2. The photocurrent measurements were repeated three times. The incident photon-to-current efficiency (IPCE), which is defined as the number of electrons generated by light in the external circuit divided by the number of incident photons in the middle ultraviolet (λ = 254 nm), was calculated using the following equation:
I P C E ( % ) = h c e     I P λ
where h is the Plank constant [m2 Kg/s], c is the speed of light [m/s], e is the electron charge [C], I is the steady-state photocurrent density [A/m2], P is the light intensity [W/m2] and λ is the incident wavelength. The IPCE values were taken under polarization at 0.6 V and 1.5 V vs. SCE.
The band-gaps were measured by UV–Vis reflectance spectra using the integrating sphere accessory of a V570 spectrometer (JASCO Corp., Tokyo, JP). No electrical bias was applied to the TiO2 samples during spectra acquisition.

4. Conclusions

The results described in this study confirmed that DC PEO can be a viable and industry-friendly route to produce photoactive TiO2 for water treatment. TiO2 films were synthesized at a potential ranging from 110 to 200 V and electrolyte temperature of 0 and 5 °C. The total charge supplied during the experiment increased with the processing potential, resulting in higher TiO2 film thicknesses of up to 11 µm. SEM images showed a homogeneous morphology with sub-micrometric pores. X-ray diffraction revealed that the relative amounts of rutile and anatase phases were mainly affected by the PEO potential; and pure anatase, pure rutile and a mixture of anatase and rutile were obtained at lower potentials, higher potentials and intermediate potentials, respectively. In agreement with the phase structure modification, the band gap also changed from 3.2 eV to 2.94 eV. GD-OES and XPS analyses revealed that S-containing species were preferentially located at the TiO2/Ti interface and might consist of both SO42− adsorbed groups and S6+ doping species. The PEC activity of the films was assessed by photocurrent measurements under polychromatic UV–Vis irradiation and by decolorization tests of model solutions of methylene blue. IPCE reached a maximum value of 88% for the TiO2 photoanode synthesized at 140 V. Correspondingly, the fastest decolorization kinetics were observed.

Supplementary Materials

The following are available online at https://www.mdpi.com/2073-4344/10/3/325/s1. Figure S1: Emission spectrum of the light source employed during photoelectrochemical characterization. Figure S2: SEM micrographs of PEO-TiO2 coatings grown at varying potential, as indicated, during 5 min anodizing time, at 0 and 25 °C. Figure S3: AFM images of TiO2 films obtained by PEO in potential range of 100–160 V at 0 °C and 25 °C. Figure S4: XRD patterns of TiO2 films obtained at 0 °C (a) and 25 °C (b). Figure S5: Lattice parameters a, c and c/a ratio for anatase and rutile as a function of potential. Filled and empty symbols refer to 0 °C and 25 °C, respectively. Arrows indicate the reference values of lattice parameters a and c and c/a ratio for anatase and rutile phases. Figure S6: UV–Vis Diffuse Reflectance plot of selected TiO2 synthesized at 25 °C (a as inset), and corresponding Tauc plot after Kubelka-munk conversion (b).

Author Contributions

S.F. wrote the original draft and supervised the overall activities; H.A. contributed to the writing of the draft and data analysis; A.L. and C.C. carried out Raman and UV–Vis measurements and contributed to draft editing; A.V. contributed to draft editing and data analysis, F.M. carried out the decolorization tests, M.B. co-supervised the overall activities. All authors have read and agreed to the published version of the manuscript.

Funding

This research received no external funding.

Acknowledgments

The authors are grateful to A. Calloni and G. Bussetti (VESI lab of the Department of Physics, Politecnico di Milano) for the XPS analysis of the samples.

Conflicts of Interest

The authors declare no conflict of interest.

References

  1. Garcia-Segura, S.; Brillas, E. Applied photoelectrocatalysis on the degradation of organic pollutants in wastewaters. J. Photochem. Photobiol. C Photochem. Rev. 2017, 31, 1–35. [Google Scholar] [CrossRef]
  2. Turolla, A.; Fumagalli, M.; Bestetti, M.; Antonelli, M. Electrophotocatalytic decolorization of an azo dye on TiO2 self-organized nanotubes in a laboratory scale reactor. Desalination 2012, 285, 377–382. [Google Scholar] [CrossRef]
  3. Franz, S.; Perego, D.; Marchese, O.; Bestetti, M. Photoelectrochemical advanced oxidation processes on nanostructured TiO2 catalysts: Decolorization of a textile azo-dye. J. Water Chem. Technol. 2015, 37, 108–115. [Google Scholar] [CrossRef] [Green Version]
  4. Murgolo, S.; Franz, S.; Arab, H.; Bestetti, M.; Falletta, E.; Mascolo, G. Degradation of emerging organic pollutants in wastewater effluents by electrochemical photocatalysis on nanostructured TiO2 meshes. Water Res. 2019, 164, 114920. [Google Scholar] [CrossRef]
  5. Franz, S.; Falletta, E.; Arab, H.; Murgolo, S.; Bestetti, M.; Mascolo, G. Degradation of carbamazepine by photo(electro)catalysis on nanostructured TiO2 meshes: Transformation products and reaction pathways. Catalysts 2020, 10, 169. [Google Scholar] [CrossRef] [Green Version]
  6. Collivignarelli, M.C.; Abbà, A.; Carnevale Miino, M.; Arab, H.; Bestetti, M.; Franz, S. Decolorization and biodegradability of a real pharmaceutical wastewater treated by H2O2-assisted photoelectrocatalysis on TiO2 meshes. J. Hazard. Mater. 2020, 387, 121668. [Google Scholar] [CrossRef]
  7. Chen, X.; Mao, S.S. Titanium dioxide nanomaterials: Synthesis, properties, modifications and applications. Chem. Rev. 2007, 107, 2891–2959. [Google Scholar] [CrossRef]
  8. Bestetti, M.; Franz, S.; Cuzzolin, M.; Arosio, P.; Cavallotti, P.L. Structure of nanotubular titanium oxide templates prepared by electrochemical anodization in H2SO4/HF solutions. Thin Solid Films 2007, 515, 5253–5258. [Google Scholar] [CrossRef]
  9. Eskandarloo, H.; Hashempour, M.; Vicenzo, A.; Franz, S.; Badiei, A.; Behnajady, M.A.; Bestetti, M. High-temperature stable anatase-type TiO2 nanotube arrays: A study of the structure-activity relationship. Appl. Catal. B Environ. 2016, 185, 119–132. [Google Scholar] [CrossRef]
  10. Yerokhin, A.L.; Nie, X.; Leyland, A.; Matthews, A.; Dowey, S.J. Plasma electrolysis for surface engineering. Surf. Coat. Technol. 1999, 122, 73–93. [Google Scholar] [CrossRef]
  11. Sundararajan, G.; Rama Krishna, L. Mechanisms underlying the formation of thick alumina coatings through the MAO coating technology. Surf. Coat. Technol. 2003, 167, 269–277. [Google Scholar] [CrossRef]
  12. Bayati, M.R.; Moshfegh, A.Z.; Golestani-Fard, F. In situ growth of vanadia-titania nano/micro-porous layers with enhanced photocatalytic performance by micro-arc oxidation. Electrochim. Acta 2010, 55, 3093–3102. [Google Scholar] [CrossRef]
  13. He, J.; Cai, Q.Z.; Ji, Y.G.; Luo, H.H.; Li, D.J.; Yu, B. Influence of fluorine on the structure and photocatalytic activity of TiO2 film prepared in tungstate-electrolyte via micro-arc oxidation. J. Alloys Compd. 2009, 482, 476–481. [Google Scholar] [CrossRef]
  14. Li, J.F.; Wan, L.; Feng, J.Y. Study on the preparation of titania films for photocatalytic application by micro-arc oxidation. Sol. Energy Mater. Sol. Cells 2006, 90, 2449–2455. [Google Scholar] [CrossRef]
  15. Wu, X.; Ding, X.; Qin, W.; He, W.; Jiang, Z. Enhanced photo-catalytic activity of TiO2 films with doped La prepared by micro-plasma oxidation method. J. Hazard. Mater. 2006, 137, 192–197. [Google Scholar] [CrossRef]
  16. Wu, X.; Wei, Q.; Zhaohua, J. Influence of Fe3+ ions on the photocatalytic activity of TiO2 films prepared by micro-plasma oxidation method. Thin Solid Films 2006, 496, 288–292. [Google Scholar] [CrossRef]
  17. Franz, S.; Perego, D.; Marchese, O.; Lucotti, A.; Bestetti, M. Photoactive TiO2 coatings obtained by Plasma Electrolytic Oxidation in refrigerated electrolytes. Appl. Surf. Sci. 2016, 385, 498–505. [Google Scholar] [CrossRef]
  18. Mirelman, L.K.; Curran, J.A.; Clyne, T.W. The production of anatase-rich photoactive coatings by plasma electrolytic oxidation. Surf. Coat. Technol. 2012, 207, 66–71. [Google Scholar] [CrossRef]
  19. Yerokhin, A.L.; Nie, X.; Leyland, A.; Matthews, A. Characterisation of oxide films produced by plasma electrolytic oxidation of a Ti-6Al-4V alloy. Surf. Coat. Technol. 2000, 130, 195–206. [Google Scholar] [CrossRef]
  20. Bayati, M.R.; Golestani-Fard, F.; Moshfegh, A.Z. Visible photodecomposition of methylene blue over micro arc oxidized WO3-loaded TiO2 nano-porous layers. Appl. Catal. A Gen. 2010, 382, 322–331. [Google Scholar] [CrossRef]
  21. Bayati, M.R.; Moshfegh, A.Z.; Golestani-Fard, F. On the photocatalytic activity of the sulfur doped titania nano-porous films derived via micro-arc oxidation. Appl. Catal. A Gen. 2010, 389, 60–67. [Google Scholar] [CrossRef]
  22. He, J.; Luo, Q.; Cai, Q.Z.; Li, X.W.; Zhang, D.Q. Microstructure and photocatalytic properties of WO3/TiO2 composite films by plasma electrolytic oxidation. Mater. Chem. Phys. 2011, 129, 242–248. [Google Scholar] [CrossRef]
  23. Lukiyanchuk, I.V.; Rudnev, V.S.; Tyrina, L.M. Plasma electrolytic oxide layers as promising systems for catalysis. Surf. Coat. Technol. 2016, 307, 1183–1193. [Google Scholar] [CrossRef]
  24. Vasilyeva, M.S.; Rudnev, V.S.; Sergeev, A.A.; Sergeeva, K.A.; Nepomnyaschiy, A.V.; Ustinov, A.Y.; Zvereva, A.A.; Kilin, K.N.; Voznesenskiy, S.S. Composition, structure, and photocatalytic properties of Fe-containing oxide layers on titanium. Prot. Met. Phys. Chem. Surfaces 2017, 53, 879–888. [Google Scholar] [CrossRef]
  25. Vasilić, R.; Stojadinović, S.; Radić, N.; Stefanov, P.; Dohčević-Mitrović, Z.; Grbić, B. One-step preparation and photocatalytic performance of vanadium doped TiO2 coatings. Mater. Chem. Phys. 2015, 151, 337–344. [Google Scholar] [CrossRef]
  26. Bessegato, G.G.; Guaraldo, T.T.; de Brito, J.F.; Brugnera, M.F.; Zanoni, M.V.B. Achievements and Trends in Photoelectrocatalysis: From Environmental to Energy Applications. Electrocatalysis 2015, 6, 415–441. [Google Scholar] [CrossRef] [Green Version]
  27. Augugliaro, V.; Camera-Roda, G.; Loddo, V.; Palmisano, G.; Palmisano, L.; Soria, J.; Yurdakal, S. Heterogeneous Photocatalysis and Photoelectrocatalysis: From Unselective Abatement of Noxious Species to Selective Production of High-Value Chemicals. J. Phys. Chem. Lett. 2015, 6, 1968–1981. [Google Scholar] [CrossRef]
  28. Liu, X.; Chu, P.K.; Ding, C. Surface modification of titanium, titanium alloys, and related materials for biomedical applications. Mater. Sci. Eng. R Reports 2004, 47, 49–121. [Google Scholar] [CrossRef] [Green Version]
  29. Lugovskoy, A.; Lugovskoy, S. Production of hydroxyapatite layers on the plasma electrolytically oxidized surface of titanium alloys. Mater. Sci. Eng. C 2014, 43, 527–532. [Google Scholar] [CrossRef]
  30. Rafieerad, A.R.; Ashra, M.R.; Mahmoodian, R.; Bushroa, A.R. Surface characterization and corrosion behavior of calcium phosphate-base composite layer on titanium and its alloys via plasma electrolytic oxidation: A review paper. Mater. Sci. Eng. C 2015, 57, 397–413. [Google Scholar] [CrossRef]
  31. Akatsu, T.; Yamada, Y.; Hoshikawa, Y.; Onoki, T.; Shinoda, Y.; Wakai, F. Multifunctional porous titanium oxide coating with apatite forming ability and photocatalytic activity on a titanium substrate formed by plasma electrolytic oxidation. Mater. Sci. Eng. C 2013, 33, 4871–4875. [Google Scholar] [CrossRef] [PubMed]
  32. Umebayashi, T.; Yamaki, T.; Yamamoto, S.; Miyashita, A.; Tanaka, S.; Sumita, T.; Asai, K. Sulfur-doping of rutile-titanium dioxide by ion implantation: Photocurrent spectroscopy and first-principles band calculation studies. J. Appl. Phys. 2003, 93, 5156–5160. [Google Scholar] [CrossRef]
  33. Lee, J.H.; Youn-Il, J.; Kim, Y.J.; Kim, I.K.; Jang, K.W.; Oh, H.J. Photocatalytic characteristics of boron and nitrogen doped titania film synthesized by micro-arc oxidation. Ceram. Int. 2015, 41, 11899–11907. [Google Scholar] [CrossRef]
  34. Yao, Z.; Jia, F.; Tian, S.; Li, C.; Jiang, Z.; Bai, X. Microporous Ni-Doped TiO2 film photocatalyst by plasma electrolytic oxidation. ACS Appl. Mater. Interfaces 2010, 2, 2617–2622. [Google Scholar] [CrossRef]
  35. Yao, Z.; Jia, F.; Jiang, Y.; Li, C.; Jiang, Z.; Bai, X. Photocatalytic reduction of potassium chromate by Zn-doped TiO2/Ti film catalyst. Appl. Surf. Sci. 2010, 256, 1793–1797. [Google Scholar] [CrossRef]
  36. Wan, L.; Li, J.; Feng, J.; Sun, W. Photocatalysts of Cr doped TiO2 film prepared by micro arc oxidation. Chin. J. Chem. Phys. 2008, 21, 487. [Google Scholar] [CrossRef]
  37. Stojadinović, S.; Radić, N.; Grbić, B.; Maletić, S.; Stefanov, P.; Pačevski, A.; Vasilić, R. Structural, photoluminescent and photocatalytic properties of TiO2:Eu3+ coatings formed by plasma electrolytic oxidation. Appl. Surf. Sci. 2016, 370, 218–228. [Google Scholar] [CrossRef]
  38. Chiarello, G.L.; Zuliani, A.; Ceresoli, D.; Martinazzo, R.; Selli, E. Exploiting the Photonic crystal properties of TiO2 nanotube arrays to enhance photocatalytic hydrogen production. ACS Catal. 2016, 6, 1345–1353. [Google Scholar] [CrossRef]
  39. Wan, L.; Li, J.F.; Feng, J.Y.; Sun, W.; Mao, Z.Q. Anatase TiO2 films with 2.2 eV band gap prepared by micro-arc oxidation. Mater. Sci. Eng. B Solid State Mater. Adv. Technol. 2007, 139, 216–220. [Google Scholar] [CrossRef]
  40. Franz, D.S.; Perego, O.; Marchese, M.B. Photoelectrochemical AOPs Based on Nanotubular Titanium Diox-Ide, Ecotechnologies for Wastewater Treatment; ECOSTP: Karnataka, India, 2014. [Google Scholar]
  41. Quintero, D.; Galvis, O.; Calderón, J.A.; Castaño, J.G.; Echeverría, F. Effect of electrochemical parameters on the formation of anodic films on commercially pure titanium by plasma electrolytic oxidation. Surf. Coat. Technol. 2014, 258, 1223–1231. [Google Scholar] [CrossRef]
  42. Matykina, E.; Berkani, A.; Skeldon, P.; Thompson, G.E. Real-time imaging of coating growth during plasma electrolytic oxidation of titanium. Electrochim. Acta 2007, 53, 1987–1994. [Google Scholar] [CrossRef]
  43. Friedemann, A.E.R.; Thiel, K.; Haßlinger, U.; Ritter, M.; Gesing, T.M.; Plagemann, P. Investigations into the structure of PEO-layers for understanding of layer formation. Appl. Surf. Sci. 2018, 443, 467–474. [Google Scholar] [CrossRef]
  44. Hussein, R.O.; Nie, X.; Northwood, D.O.; Yerokhin, A.; Matthews, A. Spectroscopic study of electrolytic plasma and discharging behaviour during the plasma electrolytic oxidation (PEO) process. J. Phys. D Appl. Phys. 2010, 43, 105203. [Google Scholar] [CrossRef]
  45. Topalian, Z.; Niklasson, G.A.; Granqvist, C.G.; Österlund, L. Spectroscopic study of the photofixation of SO2 on anatase TiO2 thin films and their oleophobic properties. ACS Appl. Mater. Interfaces 2012, 4, 672–679. [Google Scholar] [CrossRef] [PubMed]
  46. Ebraheem, S.; El-Saied, A. Band Gap Determination from Diffuse Reflectance Measurements of Irradiated Lead Borate Glass System Doped with TiO2 by Using Diffuse Reflectance Technique. Mater. Sci. Appl. 2013, 4, 324–329. [Google Scholar]
  47. Murphy, A.B. Band-gap determination from diffuse reflectance measurements of semiconductor films, and application to photoelectrochemical water-splitting. Sol. Energy Mater. Sol. Cells 2007, 91, 1326–1337. [Google Scholar] [CrossRef]
  48. Spurr, R.A.; Myers, H. Quantitative Analysis of Anatase-Rutile Mixtures with an X-Ray Diffractometer. Anal. Chem. 1957, 29, 760–762. [Google Scholar] [CrossRef]
  49. Berti, G.; Calloni, A.; Brambilla, A.; Bussetti, G.; Duò, L.; Ciccacci, F. Direct observation of spin-resolved full and empty electron states in ferromagnetic surfaces. Rev. Sci. Instrum 2014, 85, 73901. [Google Scholar] [CrossRef]
Figure 1. Thicknesses of TiO2 films (a) and total charge passed during film growth (b) as a function of PEO potential at 0 and 25 °C.
Catalysts 10 00325 g001
Figure 2. SEM micrograph (left) and AFM image (right) of a typical TiO2 film obtained at 140 V at 0 °C.
Catalysts 10 00325 g002
Figure 3. Raman spectra of TiO2 films formed at varying potentials at 0 °C (a). A and R stand for anatase and rutile, respectively); anatase and rutile phase fractions calculated on the basis of the XRD patterns as functions of PEO potential at 0 and 25 °C (b).
Catalysts 10 00325 g003
Figure 4. GD-OES in-depth profile of TiO2 film (a) and sulfur peak as a function of film depth (b).
Catalysts 10 00325 g004
Figure 5. (a) XPS wide scan from the sample. The main features of the sample are highlighted in the image. The S peak (not visible on this spectrum) is marked with a dashed line. (b) S 2p peak showing a binding energy (BE) of 169.2 eV (see the text for more details).
Catalysts 10 00325 g005
Figure 6. UV–Vis spectra of PEO TiO2 obtained at 25 °C and 130, 160 and 200 V (a); band gap energy as a function of processing potential at 0 °C and 25 °C (b).
Catalysts 10 00325 g006
Figure 7. Photocurrent density of TiO2 films obtained at 0 °C (a) and 25 °C (b).
Catalysts 10 00325 g007
Figure 8. Incident photon-to-current efficiency (IPCE) as a function of the PEO potential—values calculated under polarization at 0.6 V vs. Standard Calomel Electrode (SCE) (a) and at 1.5 V vs. SCE (b).
Catalysts 10 00325 g008
Figure 9. Degradation of methylene blue (C/C0) as a function of irradiation time.
Catalysts 10 00325 g009

