1. Introduction
Recently, hydrogen has been recognized as an alternative energy carrier that can solve some of the problems caused by fossil fuels in the environment [
1]. Hydrogen can be produced through water splitting using different processes [
2]. Some methods of hydrogen production are photochemical processes (photoelectrochemical, photocatalytic, etc.) [
3,
4,
5,
6]. Among various technologies proposed for the generation of hydrogen, photocatalysis has a great potential since through the use of semiconductors and solar energy, it is possible to carry out both the production of hydrogen and the degradation of pollutants [
7,
8].
Honda and Fujishima [
9] were the pioneers of research related to the use of semiconductors as photocatalysts for hydrogen production. However, for some time, photocatalysis research has focused on the degradation of pollutants. The most studied semiconductor, both for the degradation of pollutants and for the production of hydrogen, is titanium dioxide (TiO
2) mainly in its anatase phase [
10]. This photocatalyst presents adequate redox potentials in its conduction (−0.2 eV) and valence (3.0 eV) bands, since the main requirements for water splitting using a photocatalyst are: the semiconductor must have a band gap value of at least 1.23 eV (derived from H
2O dissociation reaction ΔG), although overpotentials due to slow reactions and resistance in the system make the required band gap value to be closer to 1.7 or 1.8 eV; the conduction band (CB) potential of the photocatalyst must be more negative than the hydrogen evolution potential (0 V vs. NHE at pH 0); and the valence band (VB) potential of the photocatalyst must be more positive than the oxygen evolution potential (+1.23 V vs. NHE at pH 0 [
11]. However, TiO
2 bandwidth is 3.2 eV and its activation occurs under ultraviolet light irradiation [
12]. For over five decades, TiO
2 has been considered as a reference material and this has been modified with precious metals such as platinum, gold, and silver forming the Pt/TiO
2 [
13,
14], Au/TiO
2 [
13,
14] and Ag/TiO
2 [
15] type photocatalysts among other metals [
13,
14,
16] aimed to decrease its forbidden band value. Since 40 years ago, Kawai and Sakata [
17] performed a study for hydrogen production using TiO
2 and different noble metals in a 1:1 methanol–water solution, which was irradiated using a 500 W Xe lamp for 10 h. They reported hydrogen productions of 5.2 mmol H
2 using RuO
2-TiO
2-Pt and 4.6 mmol H
2 for Pt/TiO
2 photocatalysts. However, the high cost of these precious metals makes their scaling application not viable. To take advantage of the solar energy to produce hydrogen, it is necessary that semiconductors have a band gap energy of less than 3 eV, this is because sunlight electromagnetic spectrum is composed of approximately 5% ultraviolet light, 46% corresponds to the visible region (400 to 700 nm wavelength), and the remaining 49% lays with the infrared spectrum [
18]. That is why most recent research in photocatalysis is centered in materials active under visible-light irradiations, as well as of low cost and environmentally friendly.
Zinc titanates (ZTO) present band gap values within limits between the ultraviolet and visible light spectrum to be activated, and their conduction band position is more negative with respect to the normal hydrogen electrode (NHE), ≈−0.2 eV. ZTO exhibit several crystalline phases, the most commonly reported are ZnTiO
3 (cubic o hexagonal perovskite), Zn
2TiO
4 (inverse spinel) and Zn
2Ti
3O
8 (cubic defect spinel), as reported by Yang and Swisher [
19]. ZTO in their perovskite and spinel phases have been the subject of studies involving synthesis, characterization, and photocatalytic evaluation for the production of hydrogen [
20]. There are several ZTO semiconductor synthesis techniques [
21], such as hydrothermal [
22], sol-gel [
23], solid-state [
24], and self-combustion route [
25]. ZTO most studied synthesis method is the solid-state using ZnO and TiO
2 as precursors resulting in a material exhibiting several crystalline phases. Chang et al. [
24] synthesized ZTO by the solid-state method at relatively high temperatures that ranged between 700 to 1000 °C, obtaining the perovskite-type ZnTiO
3 at 700 °C. Carrasco-Jaim et al. [
26] conducted a comparative study of the photoelectrochemical properties of MTiO
3 perovskite-type titanates (M = Zn, Cd and Pb) synthesized by the solid-state reaction through calcination at 800 °C for 24 h. Wang et al. [
27] prepared ZnO-TiO
2 materials by hydrothermal synthesis and calcined at 600 °C, obtaining mainly Zn
2Ti
3O
8 crystalline phase with traces of ZnO and TiO
2 anatase. In addition, they reported that when the materials were calcined at 900 °C, XRD analysis showed the presence of ZnO, Zn
2TiO
4, TiO
2 rutile, and ZnTiO
3. Tahay et al. [
28] synthetized the perovskite by the sol-gel technique and calcined from 400 to 600 °C obtaining a mixture of cubic and hexagonal perovskite phases (c-h-ZnTiO
3). Budigi et al. [
29] prepared ZTO through precipitation and calcination at 700–900 °C resulting in mixed c-h-ZnTiO
3 phases, while at 1000 °C the Zn
2TiO
4 phase appeared.
So far, in the literature there is scarce research being reported concerning the synthesis, characterization, and photocatalytic evaluation of Zn2Ti3O8 and its comparison with the most often reported ZnTiO3 phases. Furthermore, the few Zn2Ti3O8 synthesis studies have not reported the use of the modified Pechini (MP) method.
Moreover, sacrificial agents play a key role when evaluating the photocatalytic activity materials towards hydrogen production. Kumaravel et al. [
30] studied a wide range of sacrificial agents (glycerol, ethanol, lactic acid, glucose, etc.) for the hydrogen production and their role within the photocatalytic processes. Furthermore, Wang et al. [
31] reported that methanol (MeOH) and triethanolamine (TEOA) were the most efficient sacrificial agents towards the production of hydrogen when TiO
2 and g-C
3N
4 were used as photocatalysts [
30]. In addition, sacrificial agent properties such as polarity, electron donating ability, and chemical affinity towards the photocatalyst surface strongly influence over the efficiency of the photocatalytic process [
30]. Perhaps, one aspect that has been frequently overlooked is related with the adsorption and desorption phenomena of these sacrificial agents on the photocatalyst surface.
The present work is focused to prepare Zn2Ti3O8 (cds-ZTO) and ZnTiO3 (p-ZTO) crystalline phases employing the modified Pechini method (MP), characterize and compare their photocatalytic properties for hydrogen production under visible-light irradiation, and employ MeOH and TEOA as sacrificial agents. Furthermore, this study aims to evaluate the adsorption–desorption capacity of the sacrificial agents and H2O molecules over the surface of the synthesized materials and elucidate its influence on their photocatalytic activity.
2. Results and Discussion
2.1. TG Analysis
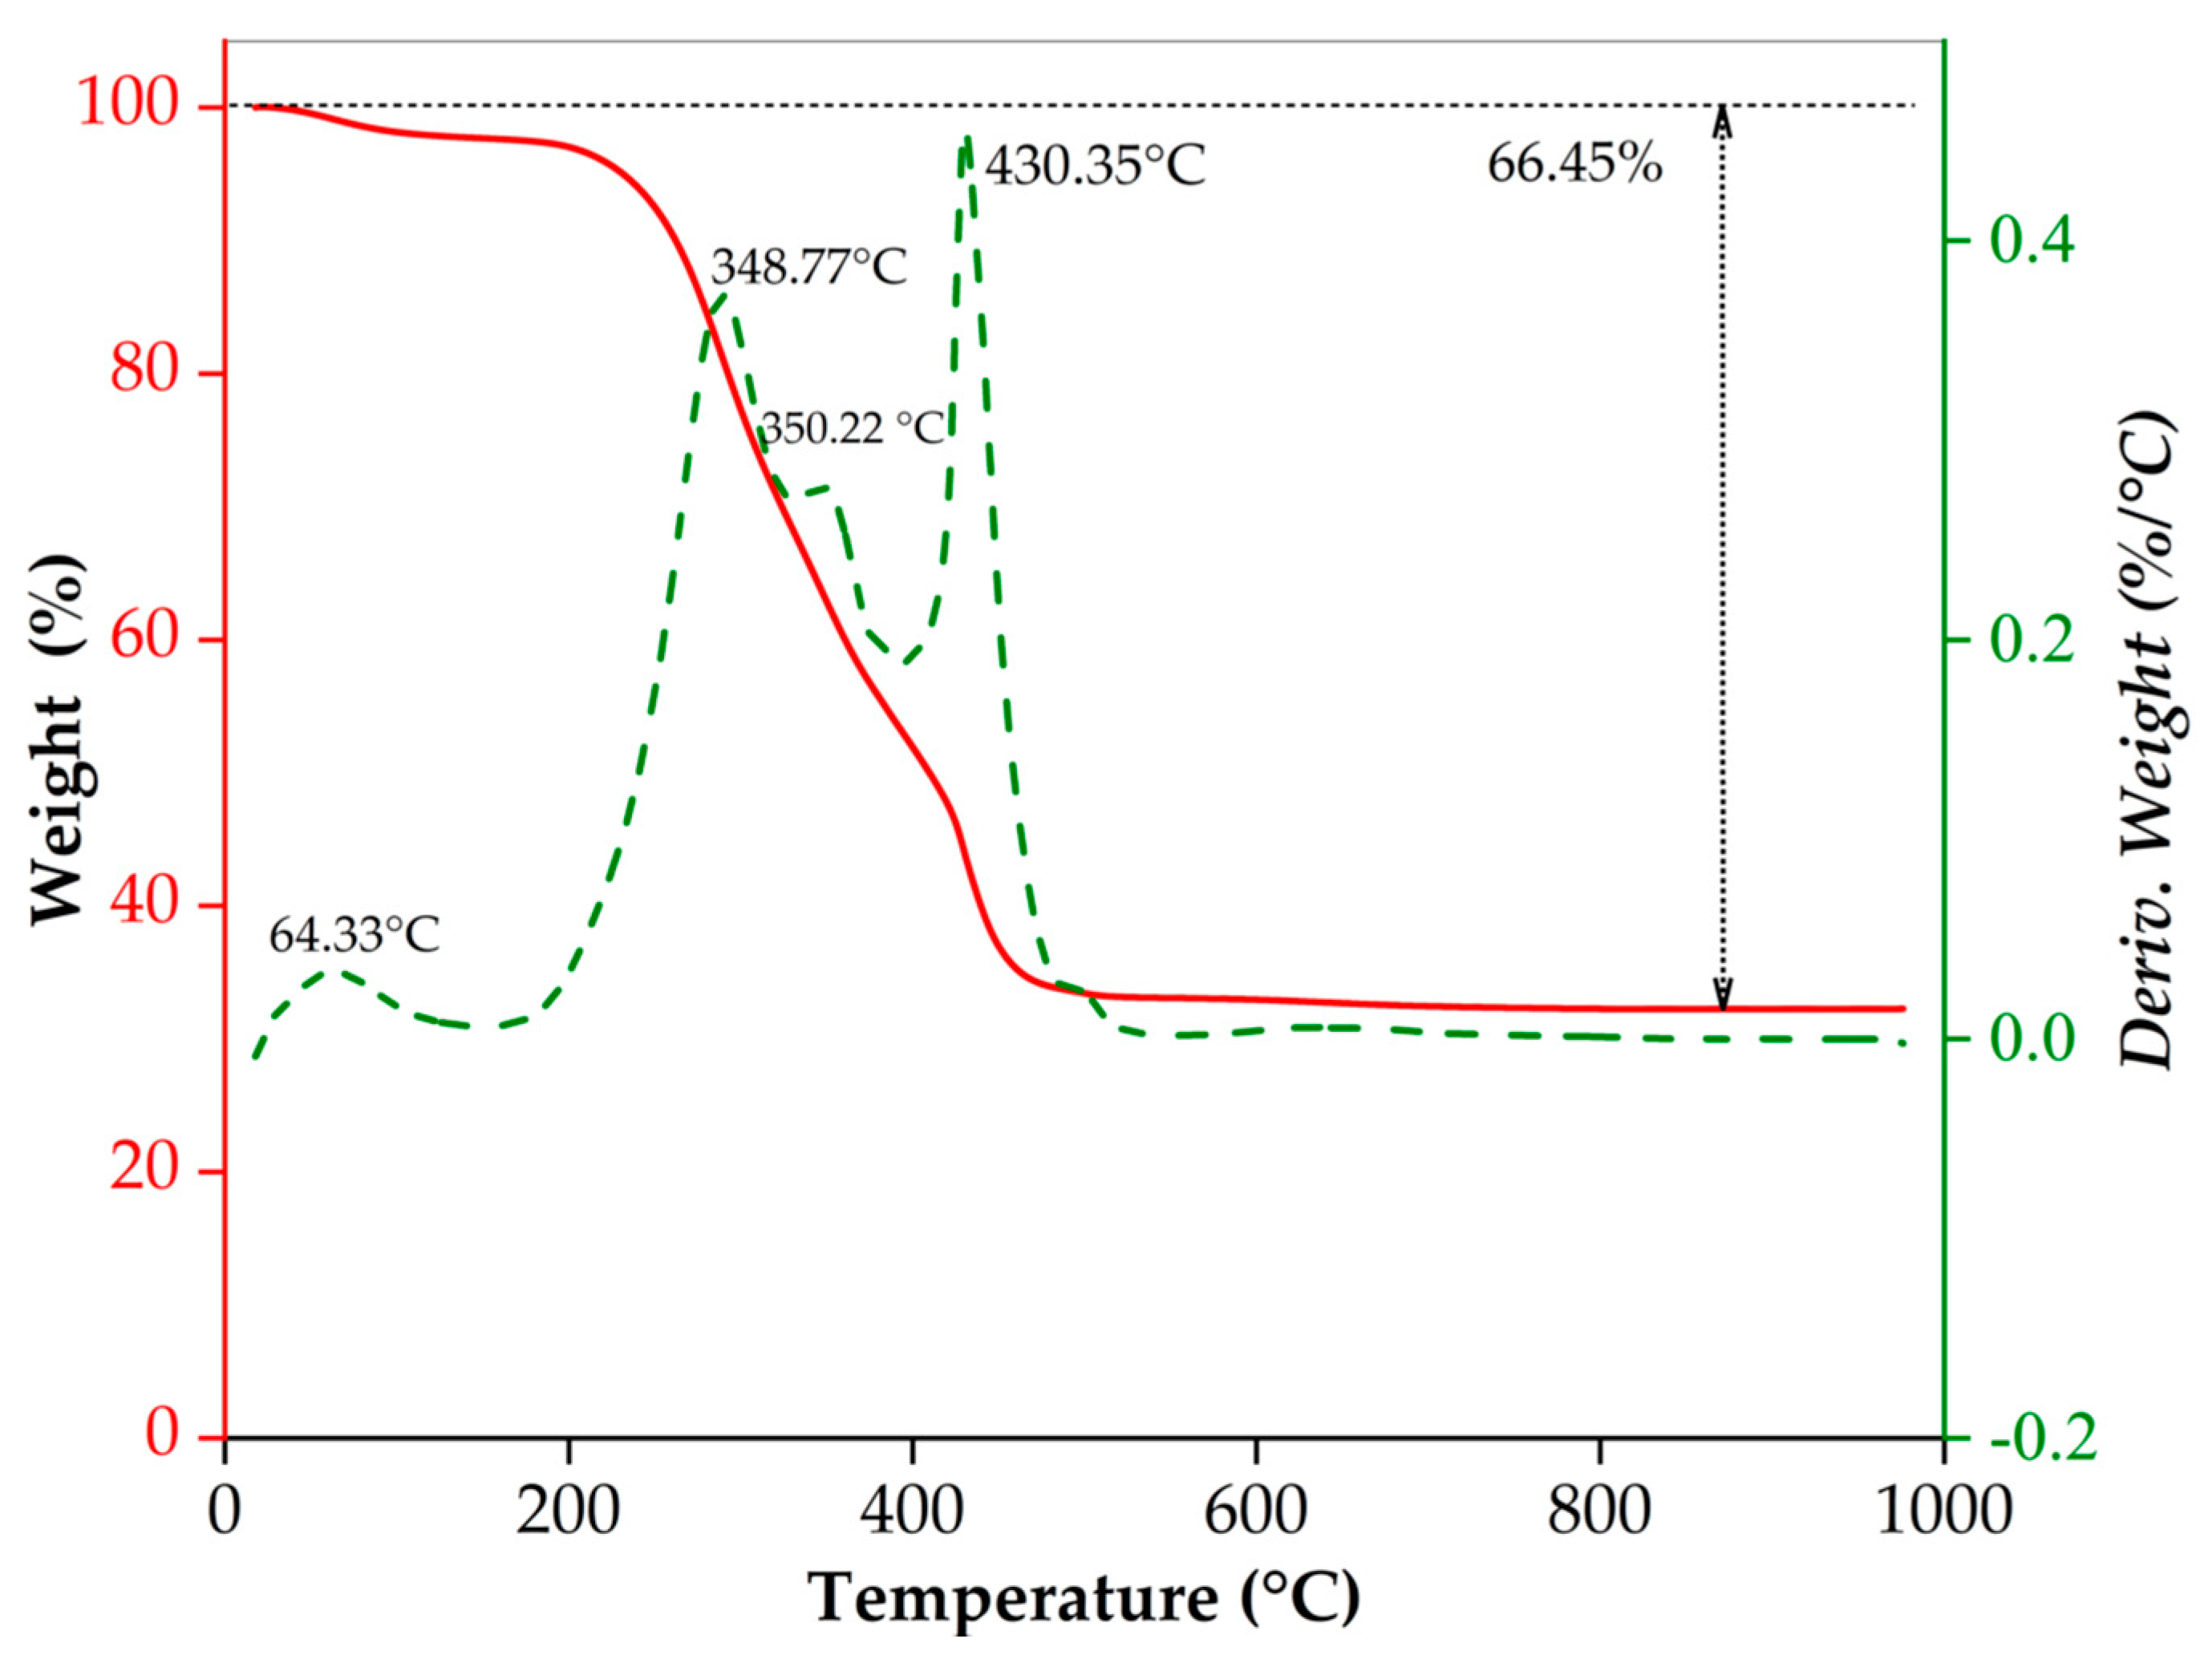
Figure 1 shows results from the thermogravimetric analysis performed on the fresh prepared samples obtained from the MP synthesis, where this Figure presents the thermal behavior of complexed and polymerized precursors. Towards the end of the analysis, samples showed a weight loss of 66 W%. This weight loss can be attributed to the decomposition of organic compounds present in the fresh samples because the synthesis process employs a polymerizing agent (ethylene glycol) and a complexing agent (citric acid). This behavior can be inferred from each individual thermal decomposition of ethylene glycol and citric acid, and the mixture of them. TGA of each of these compounds and their combination are shown in
Figure S1a–c.
Analyzing
Figure 1, it can be seen that the first weight loss from approximately 65 °C up to near 200 °C was around 3% for fresh samples, which is attributed to the elimination of moisture in the sample [
32], to the release of water molecules, to the decomposition of ethylene glycol, and to the start of citric acid decomposition as well as to the release of adsorbed nitrate ions on the surface of the precursor [
33]. The second abrupt weight loss (63%) that occurred at approximately between 210 °C and ~430 °C is due to citrate complexes continuous decomposition and to the ion nucleation within the metal oxide. In the thermogram a steep slope of weight loss is observed between 430 and 500 °C is attributed to citrate complexes final decomposition and the starting formation of the ZTO phases [
33]. By analyzing thermograms of
Figure S1a–c, it is evident that individual decomposition temperatures are shifted to higher temperatures for the mixture. This behavior is consistent with that reported by Selyunina et al. [
34].
Finally, crystallization temperature for Zn
2Ti
3O
8 (cds-ZTO) and ZnTiO
3 (p-ZTO) samples were established at 550 and 700 °C, according a Budigi et al. [
29] as well as
Figure 1 TGA result. However, to avoid particle growth in ZTO samples, the powders were exposed to a heat treatment using two calcination temperatures. The cds-ZTO sample was calcined at 450 °C for 2 h and followed by an additional hour at 550 °C, while the p-ZTO sample was exposed at 450 °C for 2 h and next at 700 °C for one hour. As mentioned earlier, these higher temperatures were used to reach a crystalline phase of each material and ensure the full decomposition of the citric complexes.
2.2. XRD Analysis
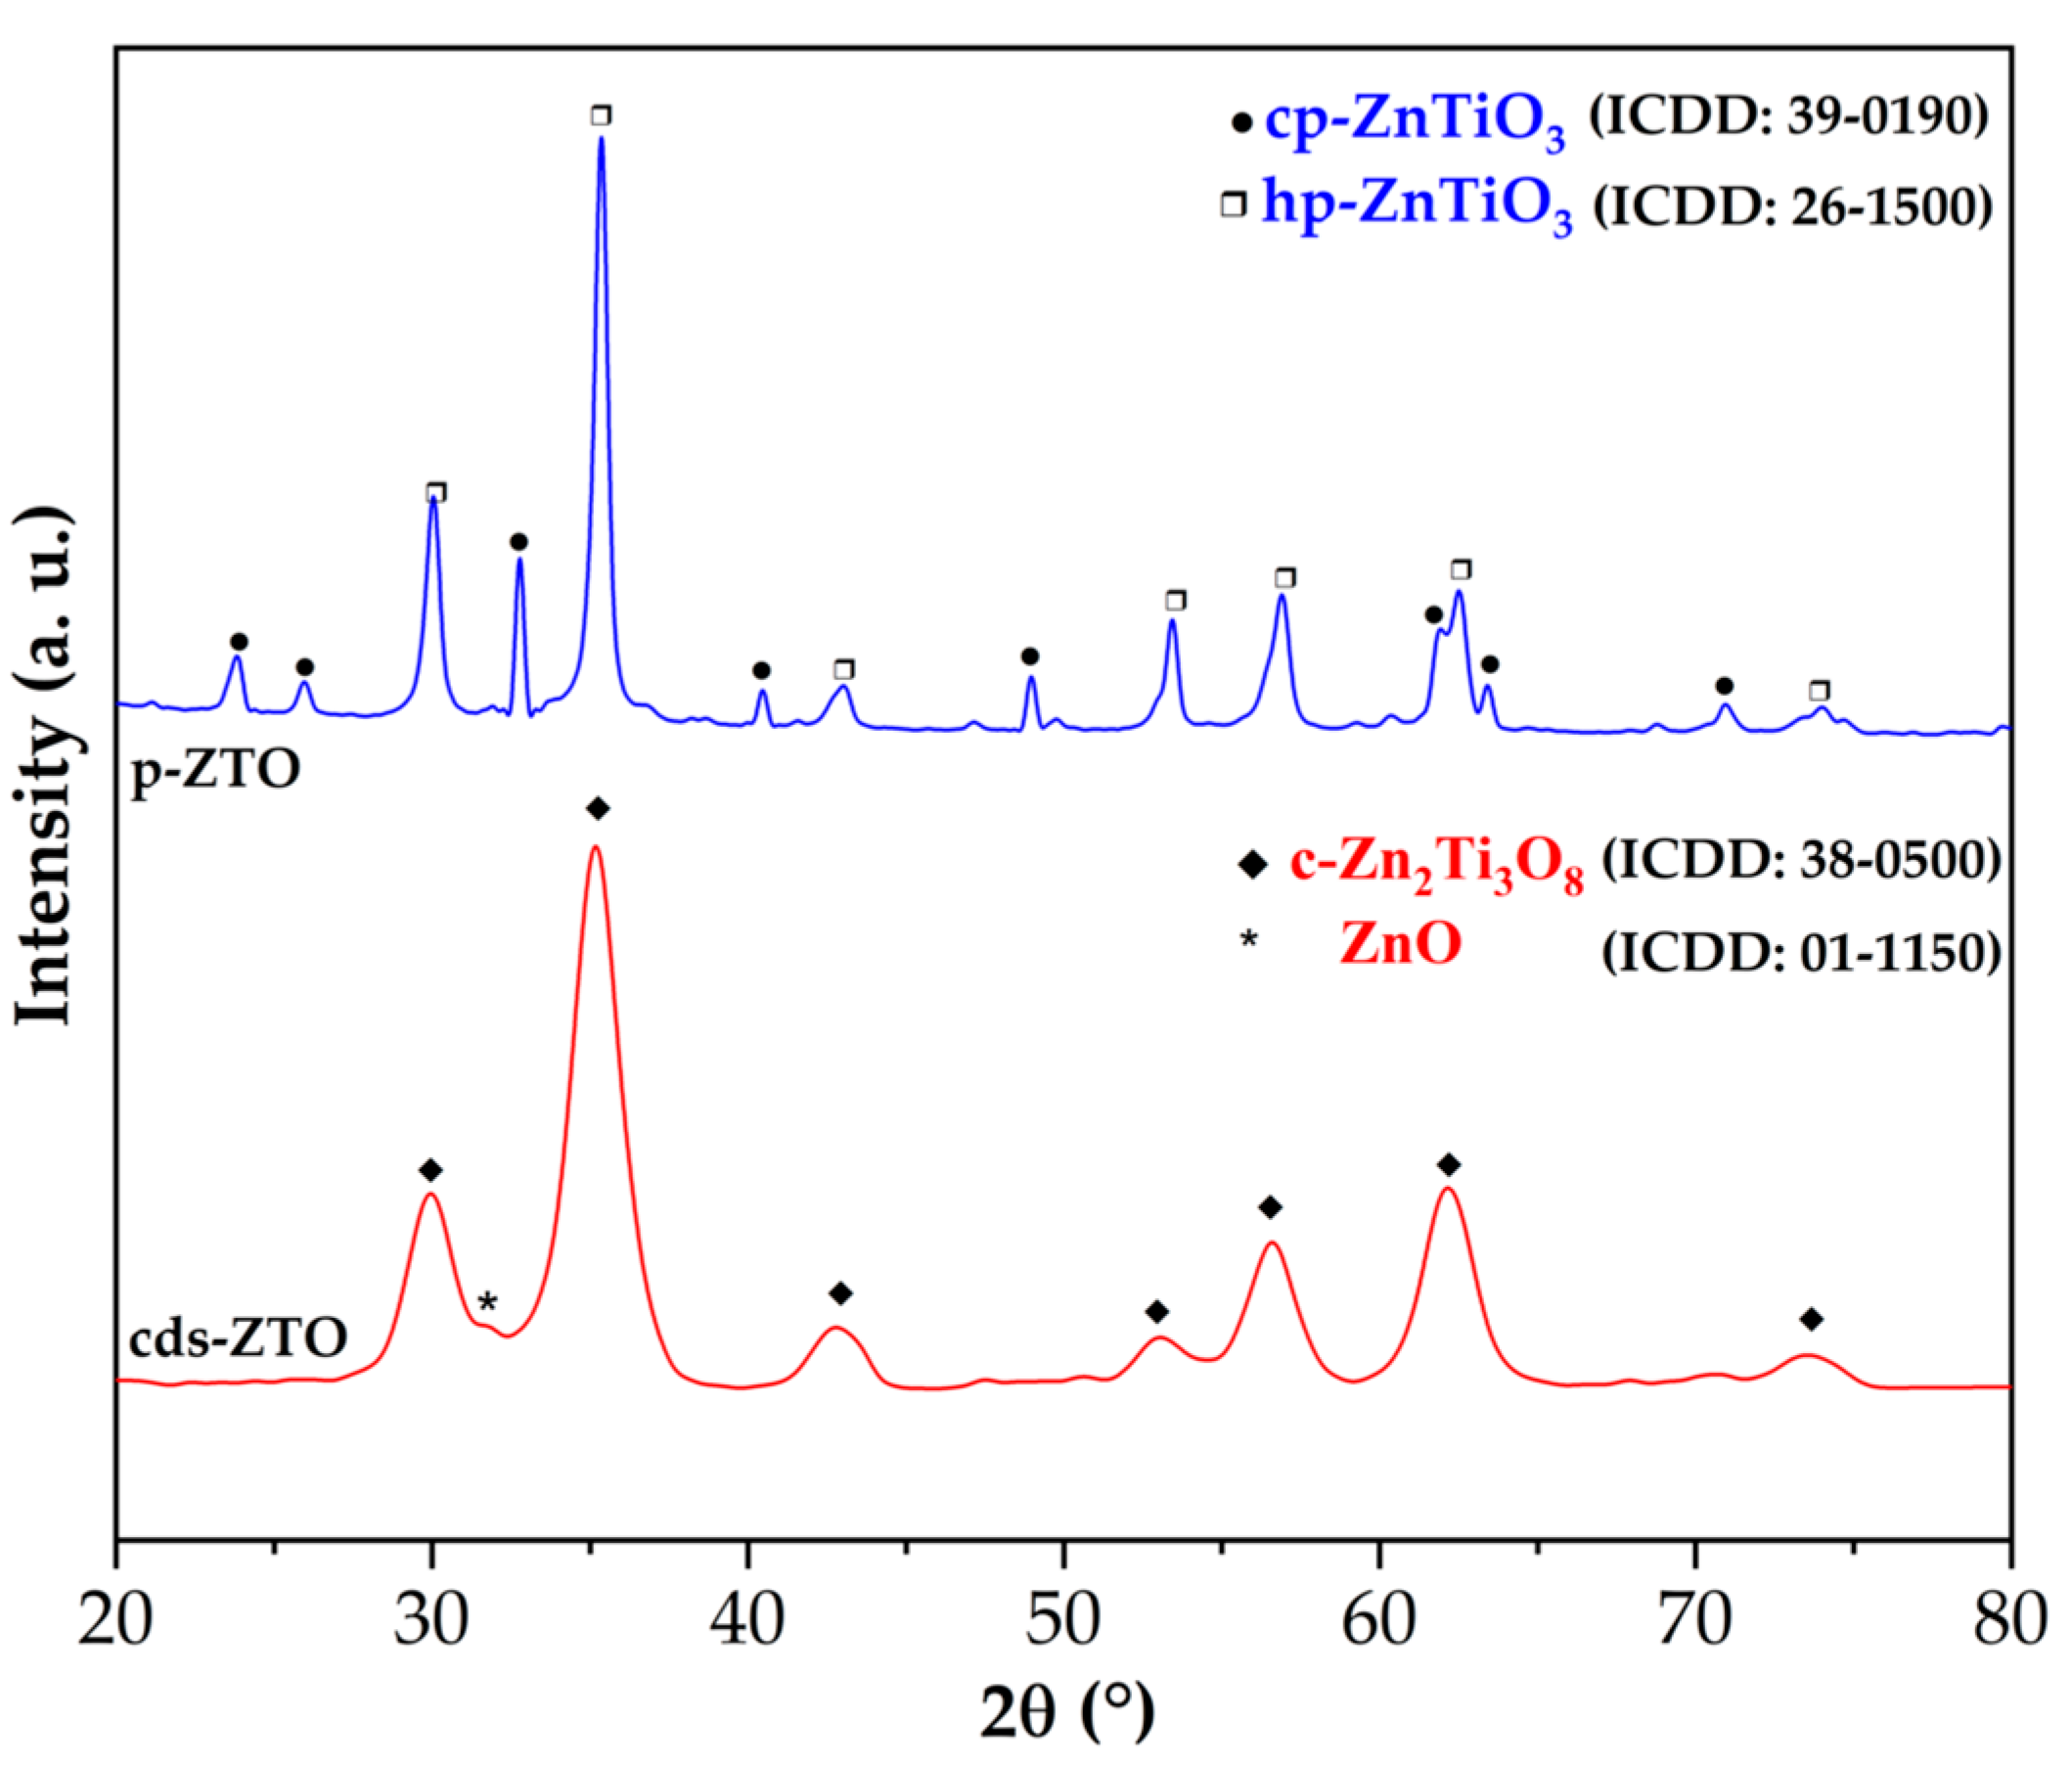
In
Figure 2, XRD patterns of synthesized samples are shown. In this Figure, X-ray diffractogram at the bottom corresponding to cds-ZTO sample, where its peaks match to the characteristic peaks of cubic Zn
2Ti
3O
8 (ICDD: 38-0500) at 29.9°, 35.3°, 42.6°, 56.7°, and 62.2° corresponding to planes at (022), (113), (224), (115), and (044). In this same diffractogram can be seen a very small peak at 31.6° that is associated to the presence of ZnO phase traces (ICDD: 01-1150). These results agree with findings from Budigi et al. at the same temperature conditions [
29]. X-ray diffractogram at the top of
Figure 2 corresponds to p-ZTO sample. The analysis of diffraction peaks indicates that this sample is composed by a mixture of cubic and hexagonal ZnTiO
3 structures (ICDD: 39-0190 and ICDD: 26-1500, respectively). This result coincides with data reported by Budigi et al. [
29], who indicate that on increasing the calcination temperature to 700 °C (
Figure 2 top), cubic Zn
2Ti
3O
8 is transformed into ZnTiO
3, which is manifested by the increased crystallinity of cubic phase ZnTiO
3 (cp-ZTO) through the increased intensities of the (220) peak at 30.39° and the (311) peak at 35.03°. At the same time, the (104) peak appeared at 2
θ of 32.82° indicating the formation of hexagonal ilmenite phase ZnTiO
3 (hp-ZTO) [
29].
In the last decade, it has been experimentally documented that nanocrystalline materials exhibit strong light absorption ability and enhanced photocatalytic performance. Therefore, the estimation of crystallite size is one of the main features to considerate in photocatalytic applications [
35].
Estimation of crystallite size from X-ray diffraction data patterns using the Scherrer equation is the most generalized calculation approach. Although this procedure presents certain limitations in the calculation, it is based on principles similar to those of the geometrical theory of X-ray diffraction. Furthermore, the results obtained under this principle keep a suitable trend and because it is a generalize procedure, results can be compared with data reported in the literature, as long as these have been obtained from equivalent diffractometers and under the same operating conditions.
Crystallite size estimated from the Scherrer equation for cds-ZTO and p-ZTO are 7.2 and 26.8 nm, respectively. This increase in crystal size was expected since higher temperature will promote a sintering process in the material and consequently larger crystal sizes. In addition, these results are consistent with those reported by Yang et al. [
36] for these materials calcined at the same temperatures. They determined crystal sizes of 6.9 and 26.4 nm using a similar diffractometer and equivalent operating conditions as this work.
2.3. TEM, EDS, and EELS Analysis
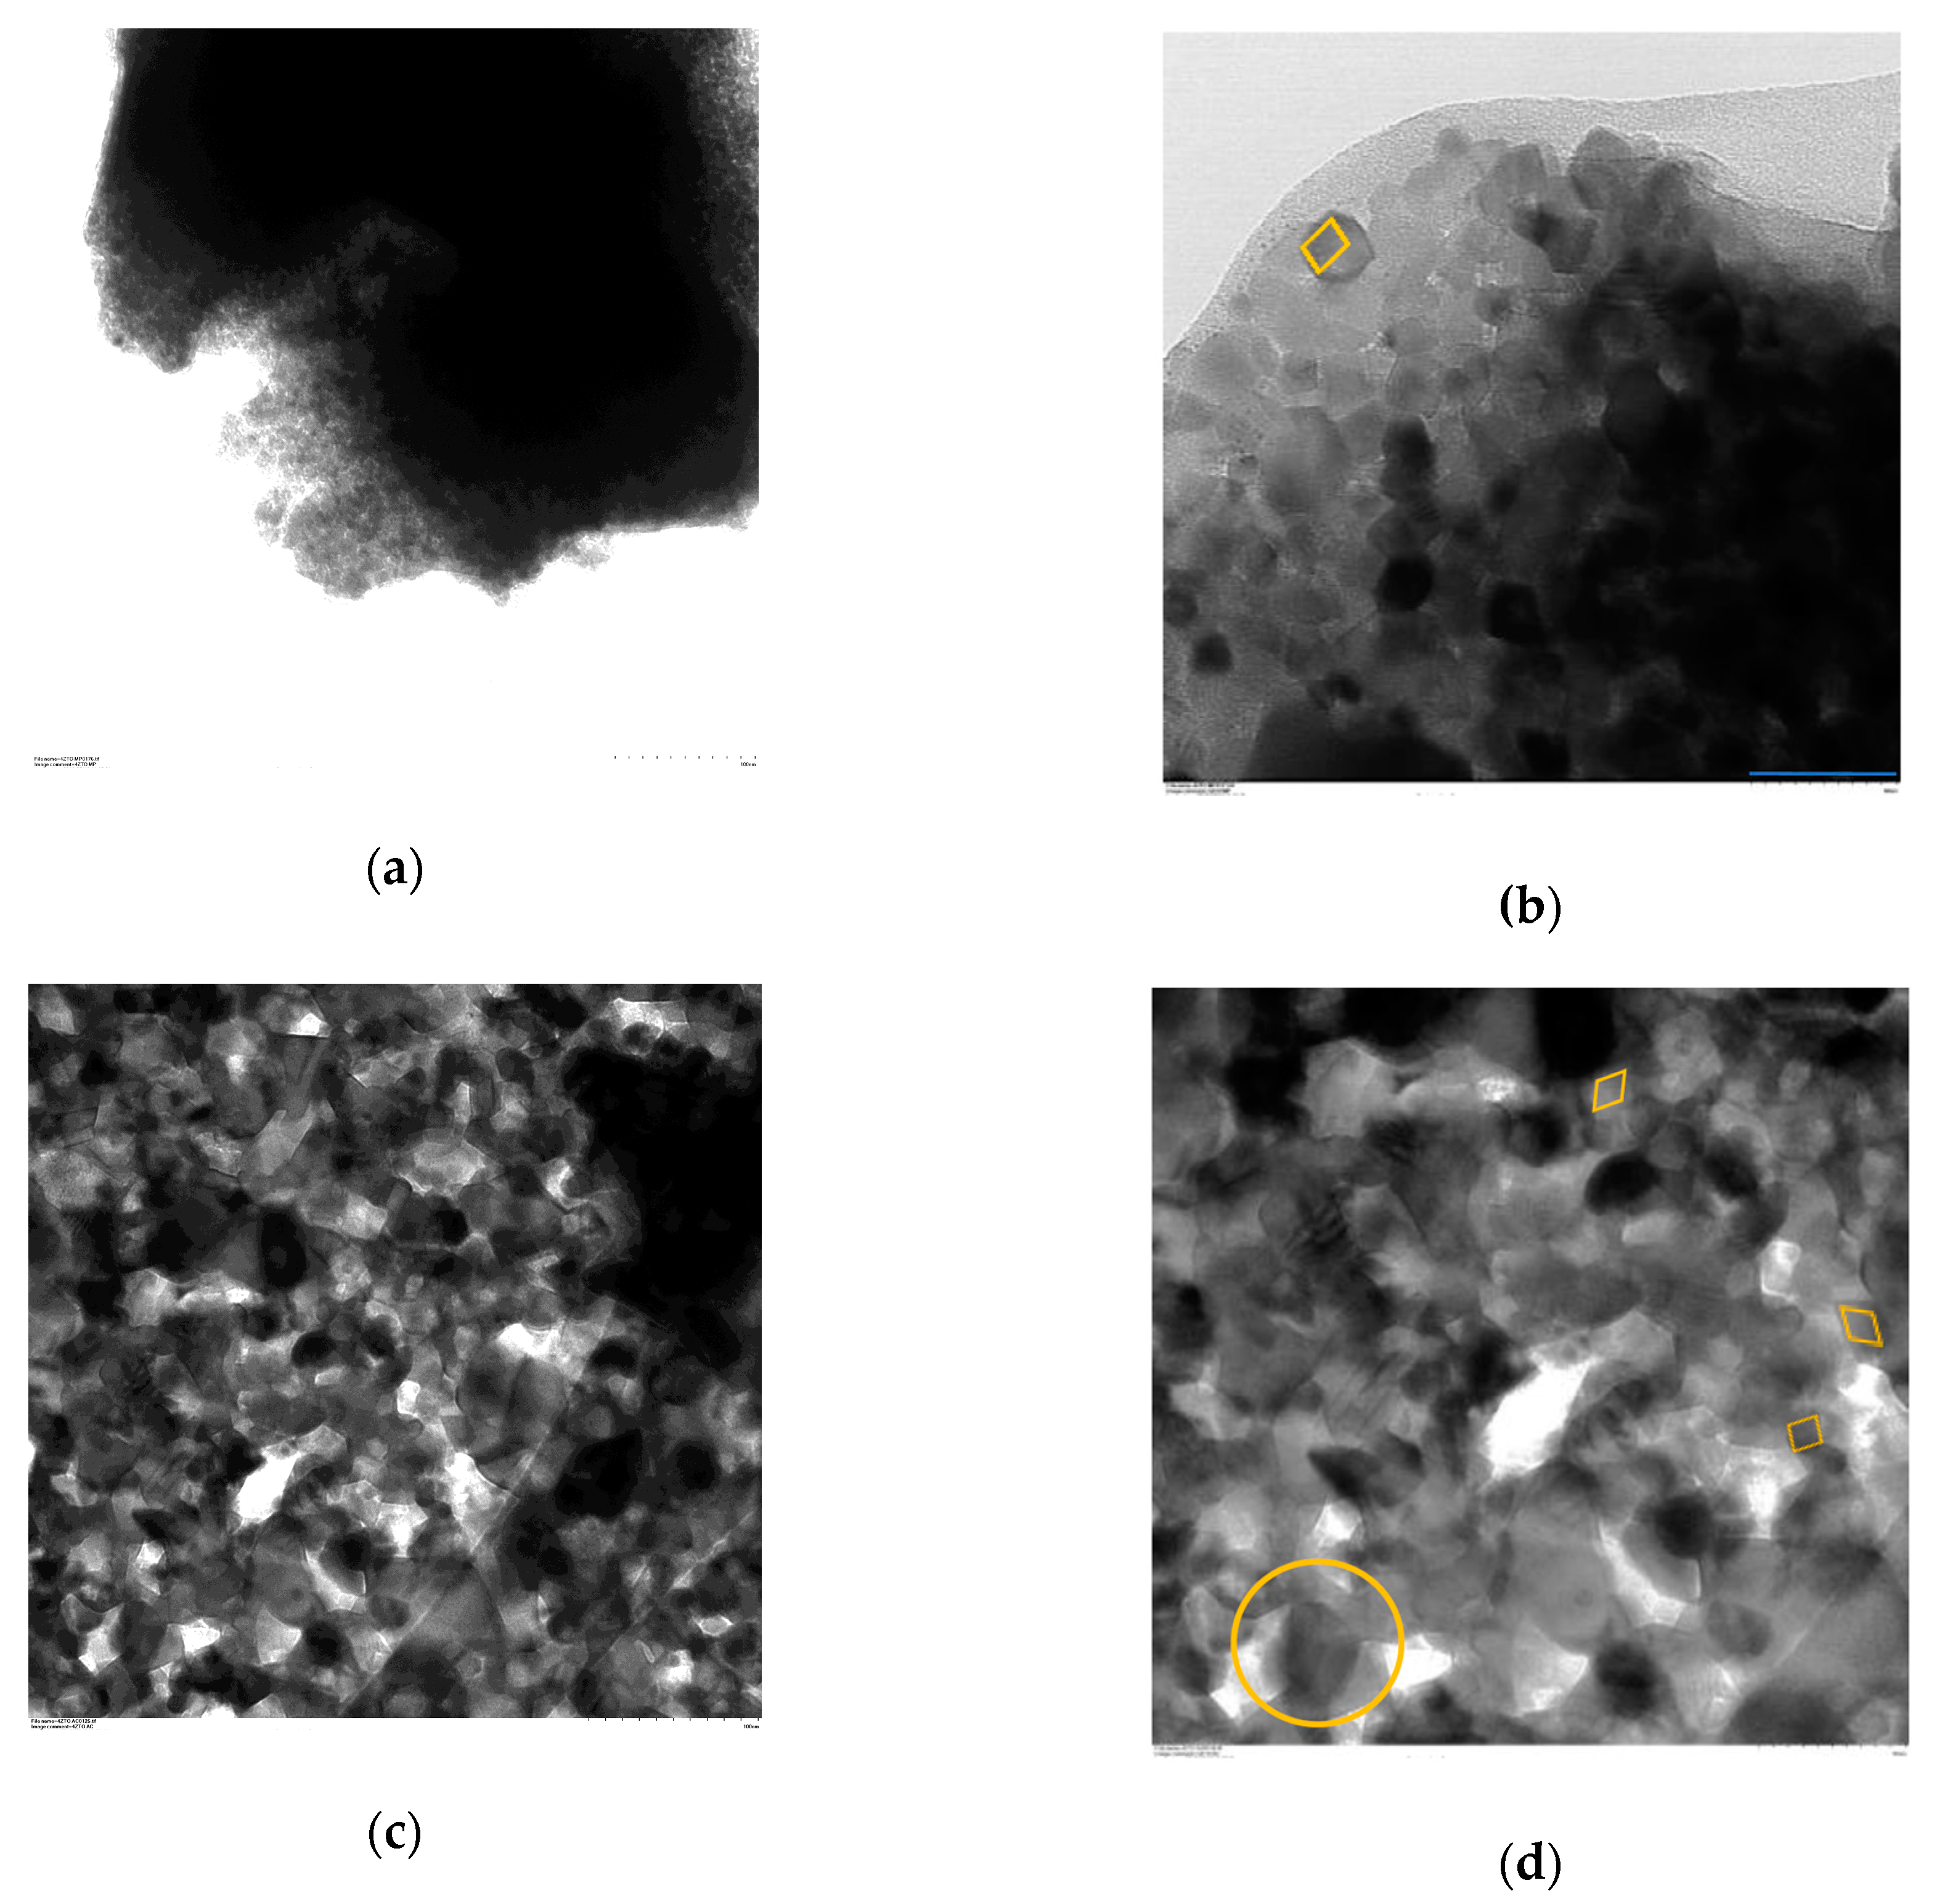
Figure 3 shows bright-field emission TEM images at two different magnifications (50 y 100 KX) for each of the synthesized samples.
Figure 3a,b show TEM images of particles from sample cds-ZTO. The analysis of these images, particles with a cubic morphology with a size distribution centered between 10 to 20 nm, were found.
Moreover,
Figure 3c,d show TEM images of p-ZTO powders. Particles of these powders exhibit cubic and rhombohedral morphologies with a size distribution between 30 to 40 nm. In addition, a clear evidence of particle agglomerates can be seen. This larger particle size and the evidence of agglomeration is mainly attributed to the high temperature that this material was exposed to during the calcination process.
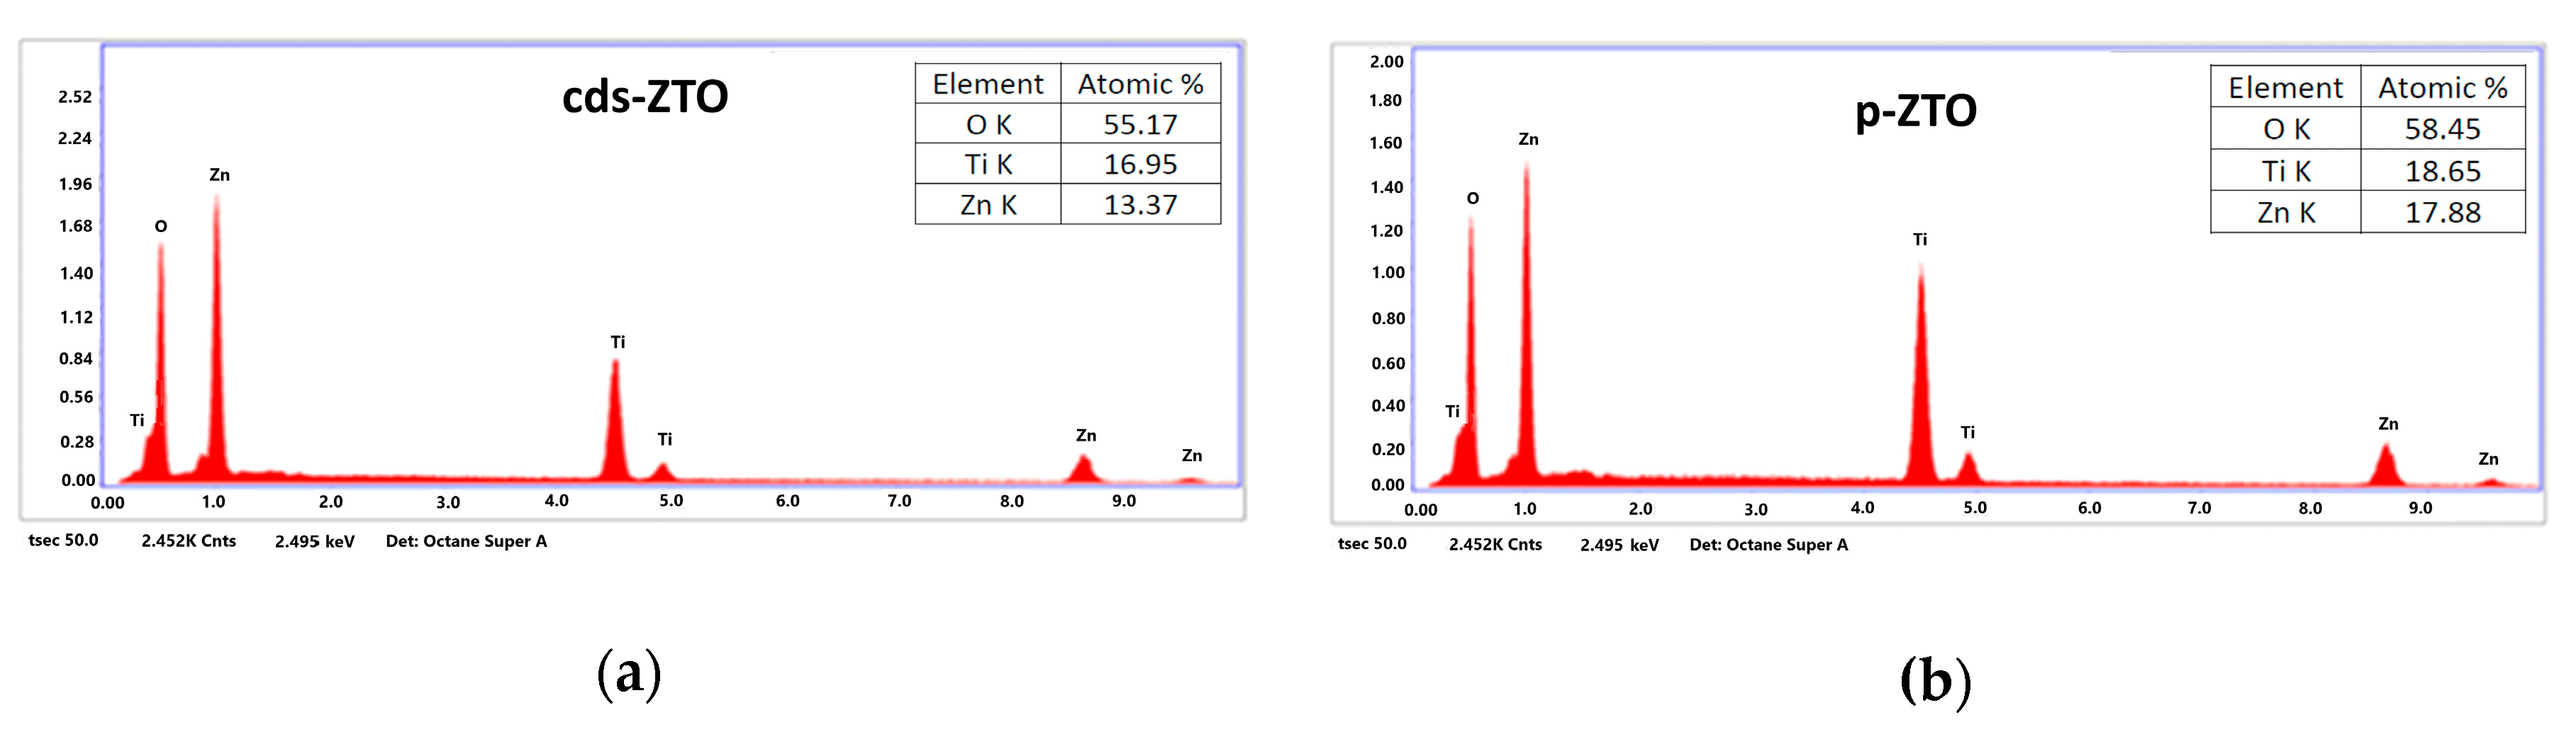
Figure 4a,b present results of the X-ray dispersive energy spectroscopy counts (EDS) of cds-ZTO and p-ZTO samples.
Elemental content in atomic percentages was obtained from the EDS analysis of the cds-ZTO and p-ZTO samples, which is considered as a semiquantitative analysis. Results exhibited only the presence of oxygen, titanium, and zinc elements, thus presenting a ratio of Zn/Ti = 0.78 for cds-ZTO and 0.96 for p-ZTO. On one hand, for the cds-ZTO sample, Zn/Ti ratio should be 0.66; however, this difference can be explained in terms of the formation mechanism of zinc titanates for the temperature range of 450 to 550 °C, a mixture of Zn
2Ti
3O
8 and ZnO is obtained [
29], so that the Zn/Ti ratio should be higher than 0.66. On the other hand, Zn/Ti ratio for p-ZTO is very close to the stoichiometric atomic ratio used to prepare ZnTiO
3 (Zn/Ti = 1).
Figure 5 shows cds-ZTO and p-ZTO electron energy loss spectra (EELS) for Ti-L
2,
3-edges peaks, which both present similar width, intensity, and position. L
3 and L
2 edges are subdivided in A
1-A
2 and B
1-B
2, respectively, thus confirming the crystalline field separation due to the oxygen atoms.
Table 1 shows values and positions of the L
3 edge, as well as the L
3-L
2 edge separation for each material. Results are comparable to those reported by Calvert et al. [
37] and Lee et al. [
38] for Ti-L
2,3-edges obtained for TiO
2 and Ti
2O
3 binary oxides as well as in CaCu
3Ti
4O
12, CaTiO
3, and BaTiO
3 ternary oxides; where reported edges correspond to Ti
3+ for standard Ti
2O
3 and Ti
4+ for the other materials. The difference between positions of the ZTO with respect to TiO
2 can be mainly attributed to the octahedrally coordinated Ti atoms within the structure forming O-Ti-O bonds [
37]. In this research, edge positions are being consistent with ZTO structures. However, some differences between intensities for peaks A
1 and B
1 were found with a trend in their positions similar to that reported for Ti
3+ [
37]. Therefore, it can be claimed that within Zn
2Ti
3O
8 and ZnTiO
3, Ti
4+ and possibly some amount of Ti
3+ is present, predominantly in cds-ZTO.
2.4. BET Analysis
Nitrogen physisorption tests were performed using the BET technique to determine the specific surface area of the synthetized materials.
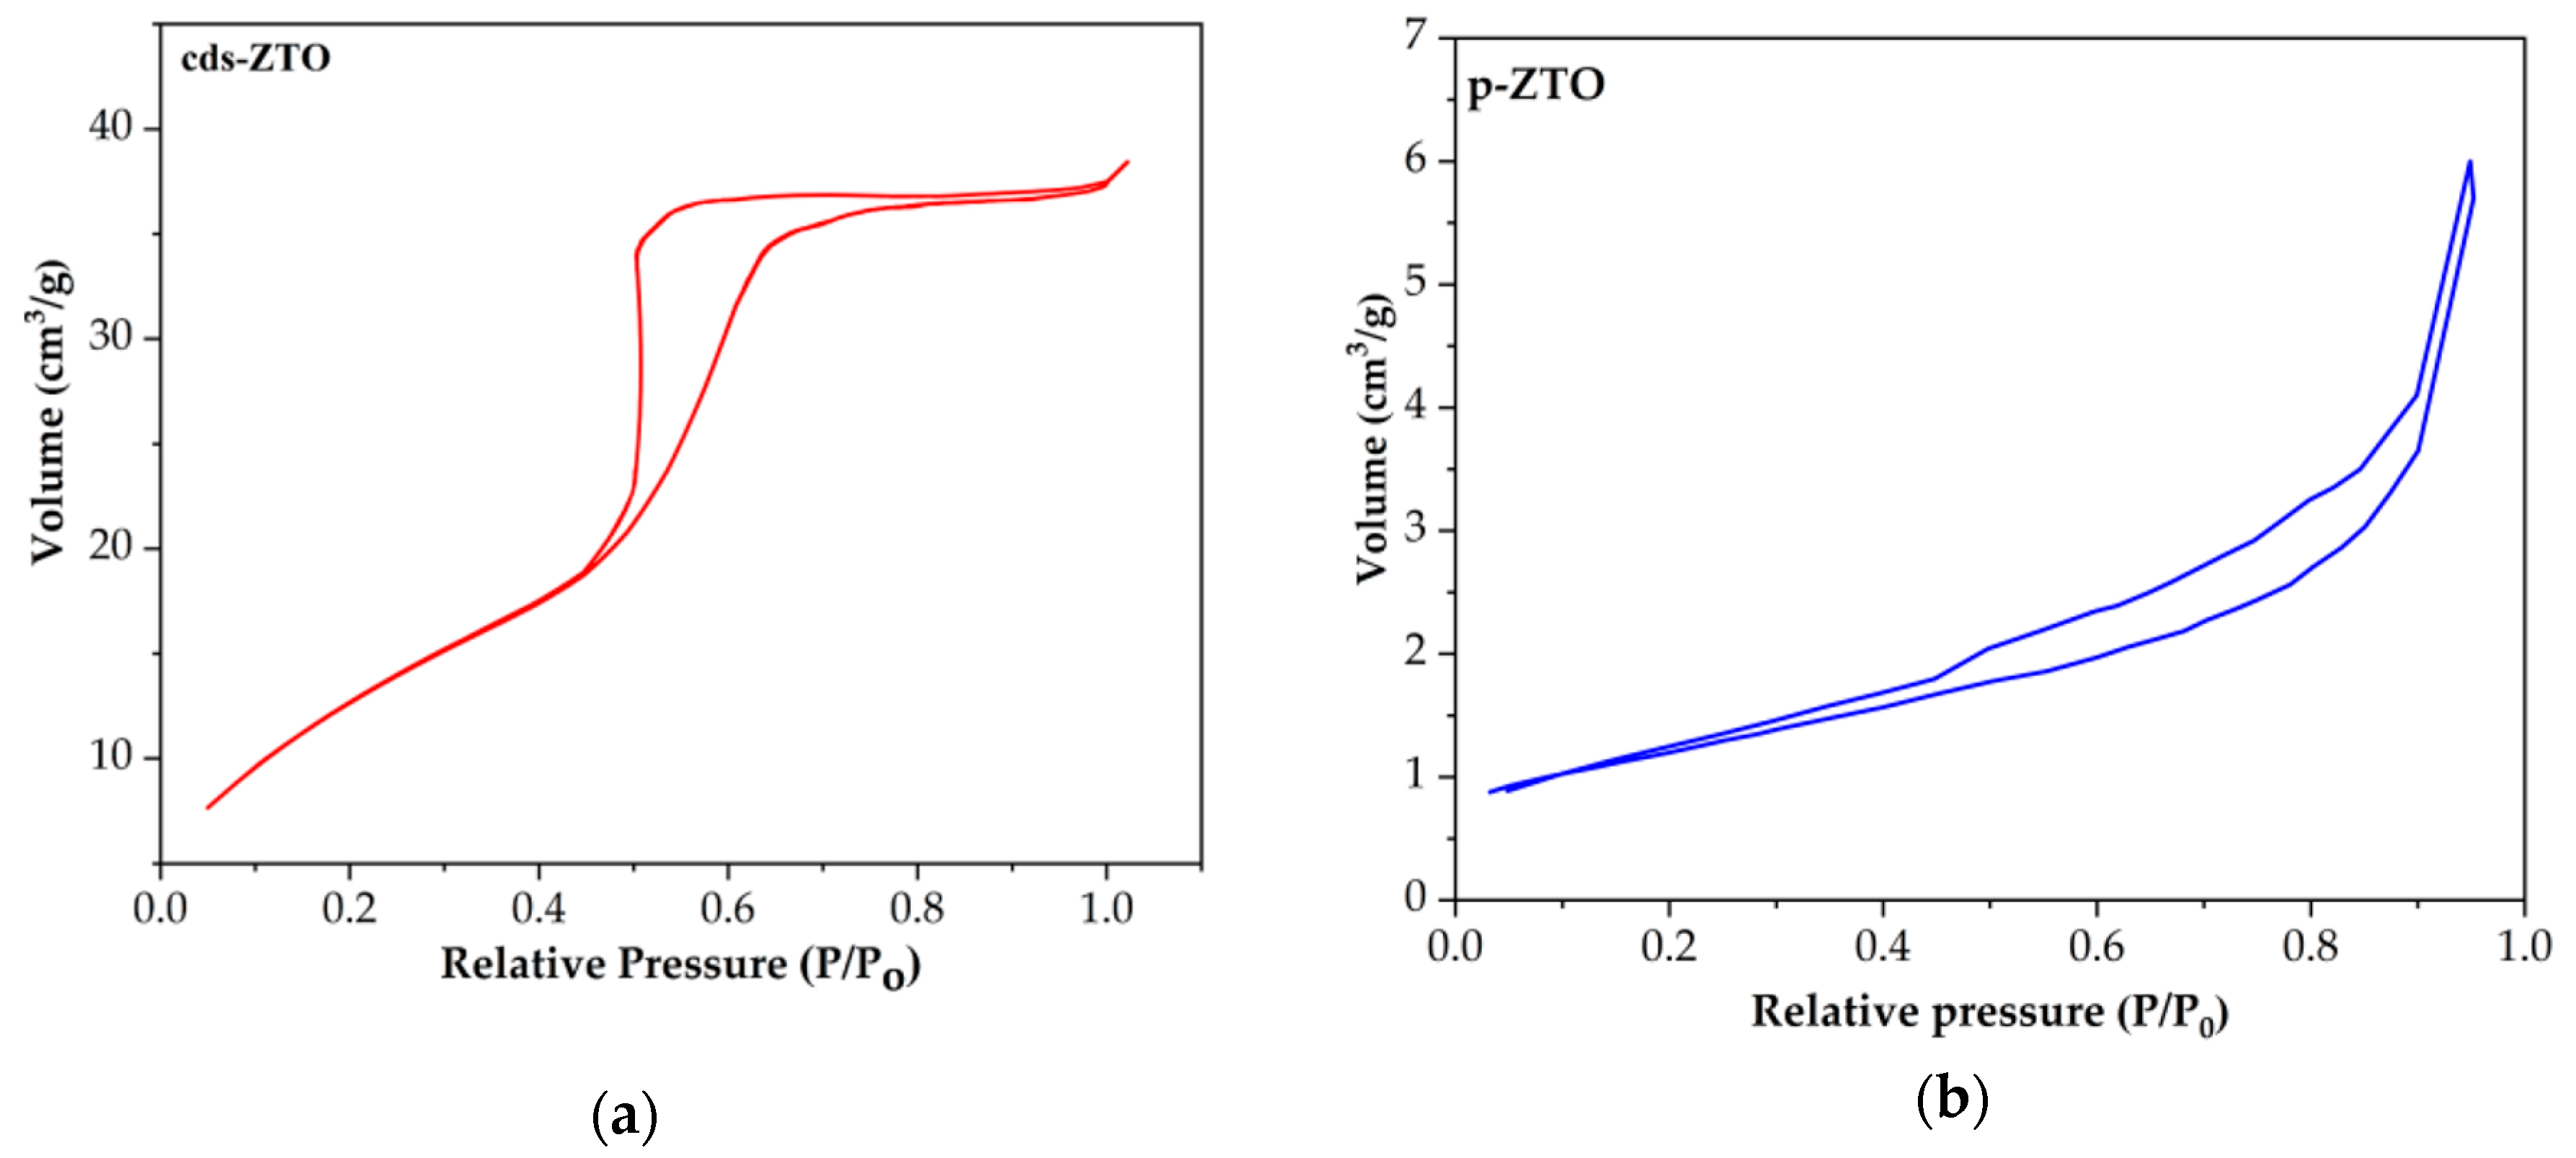
Figure 6a,b presents the nitrogen adsorption–desorption isotherms for cds-ZTO and p-ZTO samples.
Analyzing these figures and according to the IUPAC classification, cds-ZTO exhibits an H3-type isotherm with a characteristic hysteresis of a material with parallel-wall pores. Isotherms for p-ZTO present a IV-type isotherm with a narrow hysteresis loop characteristic of a material that contains interparticle void spaces, which are associated to the different morphology of the particles of this sample (cubic and rhombohedral-hexagonal) and to the different agglomerate sizes.
The estimated surface area for sample cds-ZTO was 88 m
2/g, while for sample p-ZTO it was 13 m
2/g. The large magnitude differences in surface area and in textural properties are due to the porosity of the cds-ZTO sample and the smaller size of its particles, porosity that can be attributed to the calcination temperature, CO
2 generation and elimination during the decomposition of the metallic chelate, and polymerizing agent during the calcination stage. Furthermore, these results are consistent with findings reported by Liao et al. [
39], who obtained this material through a solvothermal method showing particle morphologies and specific surface area (86 m
2/g) similar to those generated in this investigation. Surface area values found in this research are compared with those reported in the literature and shown in
Table 2. Otherwise, the thermal transformation in crystalline structures from cubic defect spinel (cds-ZTO) to a mixture of cubic and hexagonal perovskite structure (p-ZTO), provokes almost the elimination of intraparticle porosity and the increase in its particle size are together presumably responsible for the marked decrease in surface area value.
2.5. FT-IR Analysis
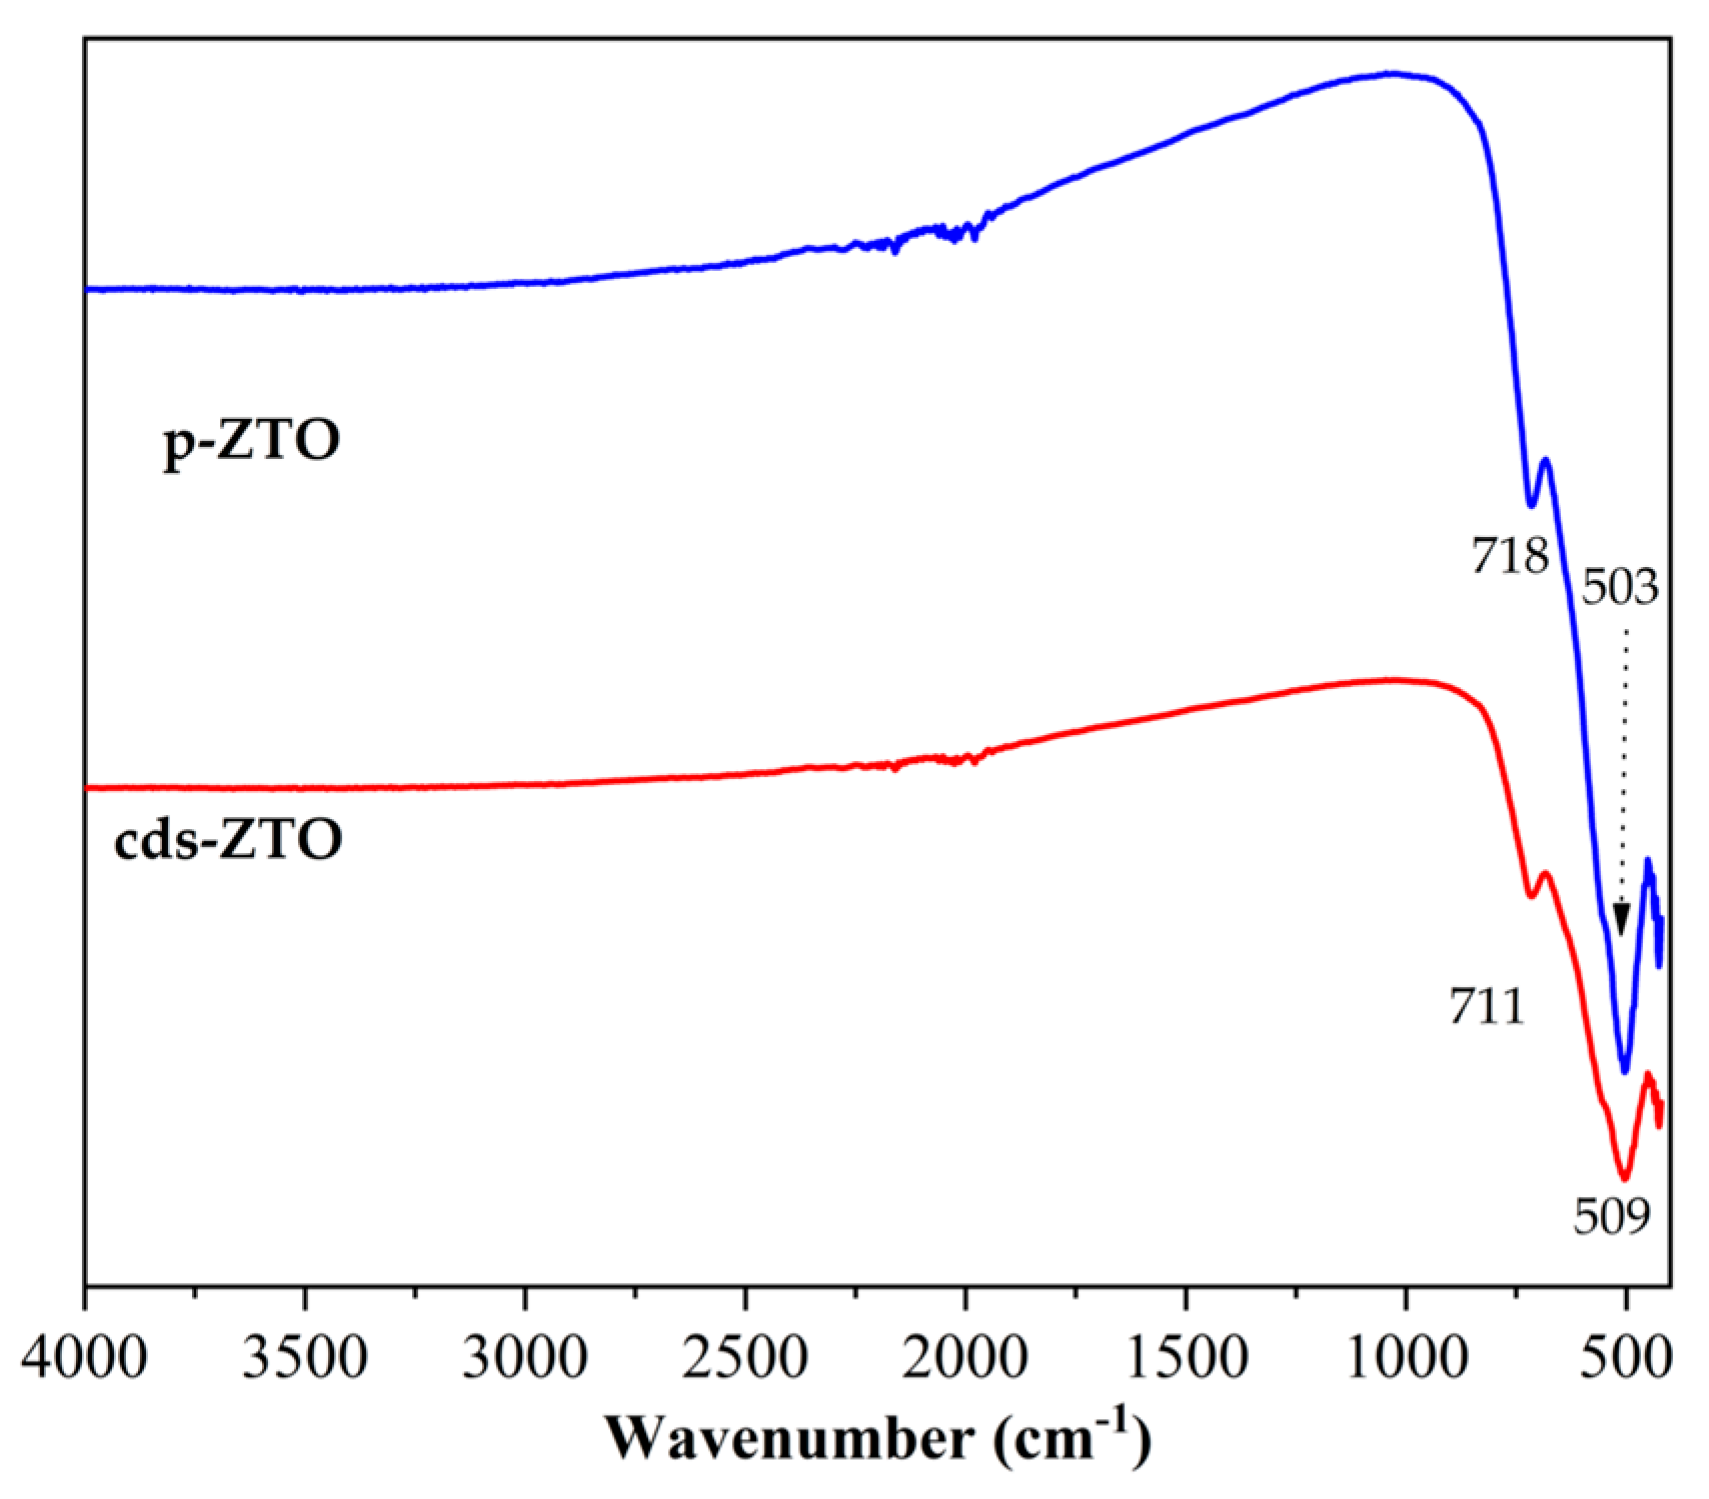
Fourier transform infrared spectra (FT-IR) in the region of 4000–400 cm
−1, are shown in
Figure 7, for the cds-Zn
2Ti
3O
8 (bottom) and p-ZnTiO
3 (top). As observed in these figures, the marked bands that appear in the region from 1000–400 cm
−1 are attributed to the metal-oxygen bonds [
42,
43,
44]. In
Figure 7 (bottom), corresponding to cds-ZTO, two bands are observed within the region of 750–400 cm
−1 wavenumbers (711 and 509 cm
−1), in which the 711 cm
−1 band corresponds to the Zn-O polyhedra [
42], while the 509 cm
−1 band can be attributed to Ti-O vibrations of the rutile TiO
2 phase mode [
44]. These same bands are present in the p-ZTO sample, where absorption bands show up at 718 and 503 cm
−1 [
43].
2.6. UV–Vis Analysis
Figure 8 presents UV–Vis diffuse reflectance spectra (DRS) and Tauc plots obtained from samples to determine their absorption spectra, optical properties, and estimate bandgap energy values of each sample (cds-ZTO and p-ZTO).
Figure 8a shows the absorption spectra of samples under study, where the maximum absorption wavelength of cds-ZTO and p-ZTO was determined, where the maximum absorption wavelength value for cds-ZTO was λ
max = 426 nm, while for p-ZTO it was λ
max = 432 nm.
Figure 8b presents indirect transition bandgap energy values of cds-ZTO and p-ZTO estimated using the Kubelka–Munk method and Tauc plots. In this Figure, the linear portion of the curve with the greater slope was extrapolated up to the
x-axis to estimate the value of the band gap in eV units [
45]. The estimated indirect band gap value for cds-ZTO was 2.91 eV, while the corresponding value for p-ZnTiO
3 was 2.87 eV. The estimated band gap value of wide band semiconductors strongly depends on their crystalline phase, crystallinity degree, particle size, among other features. For this reason, in the literature for these materials there exists a varied number of reported values; however, the p-ZTO band gap value found in this work is consistent with those reported by Jain et al. [
45] for ZnTiO
3 lays in between 2.88 and 2.91 eV. The estimated Zn
2Ti
3O
8 band gap value is very close to that reported by Spanhel et al. [
46].
2.7. Adsorption–Desorption of Sacrificial Agents on cds-ZTO and p-ZTO
Adsorption and desorption phenomena, and the related concepts of surface sites or surface arrangements, play an important role in heterogeneous photocatalysis, since they are included in the photocatalytic reaction mechanism, which leads from gaseous and/or liquid reactants to gaseous and/or liquid products over solids [
47].
For the hydrogen evolution through photocatalysis, the adsorption–desorption capacity between the semiconductor and OH groups as well as the sacrificial agent in solution are key parameters that influence photocatalytic reactions.
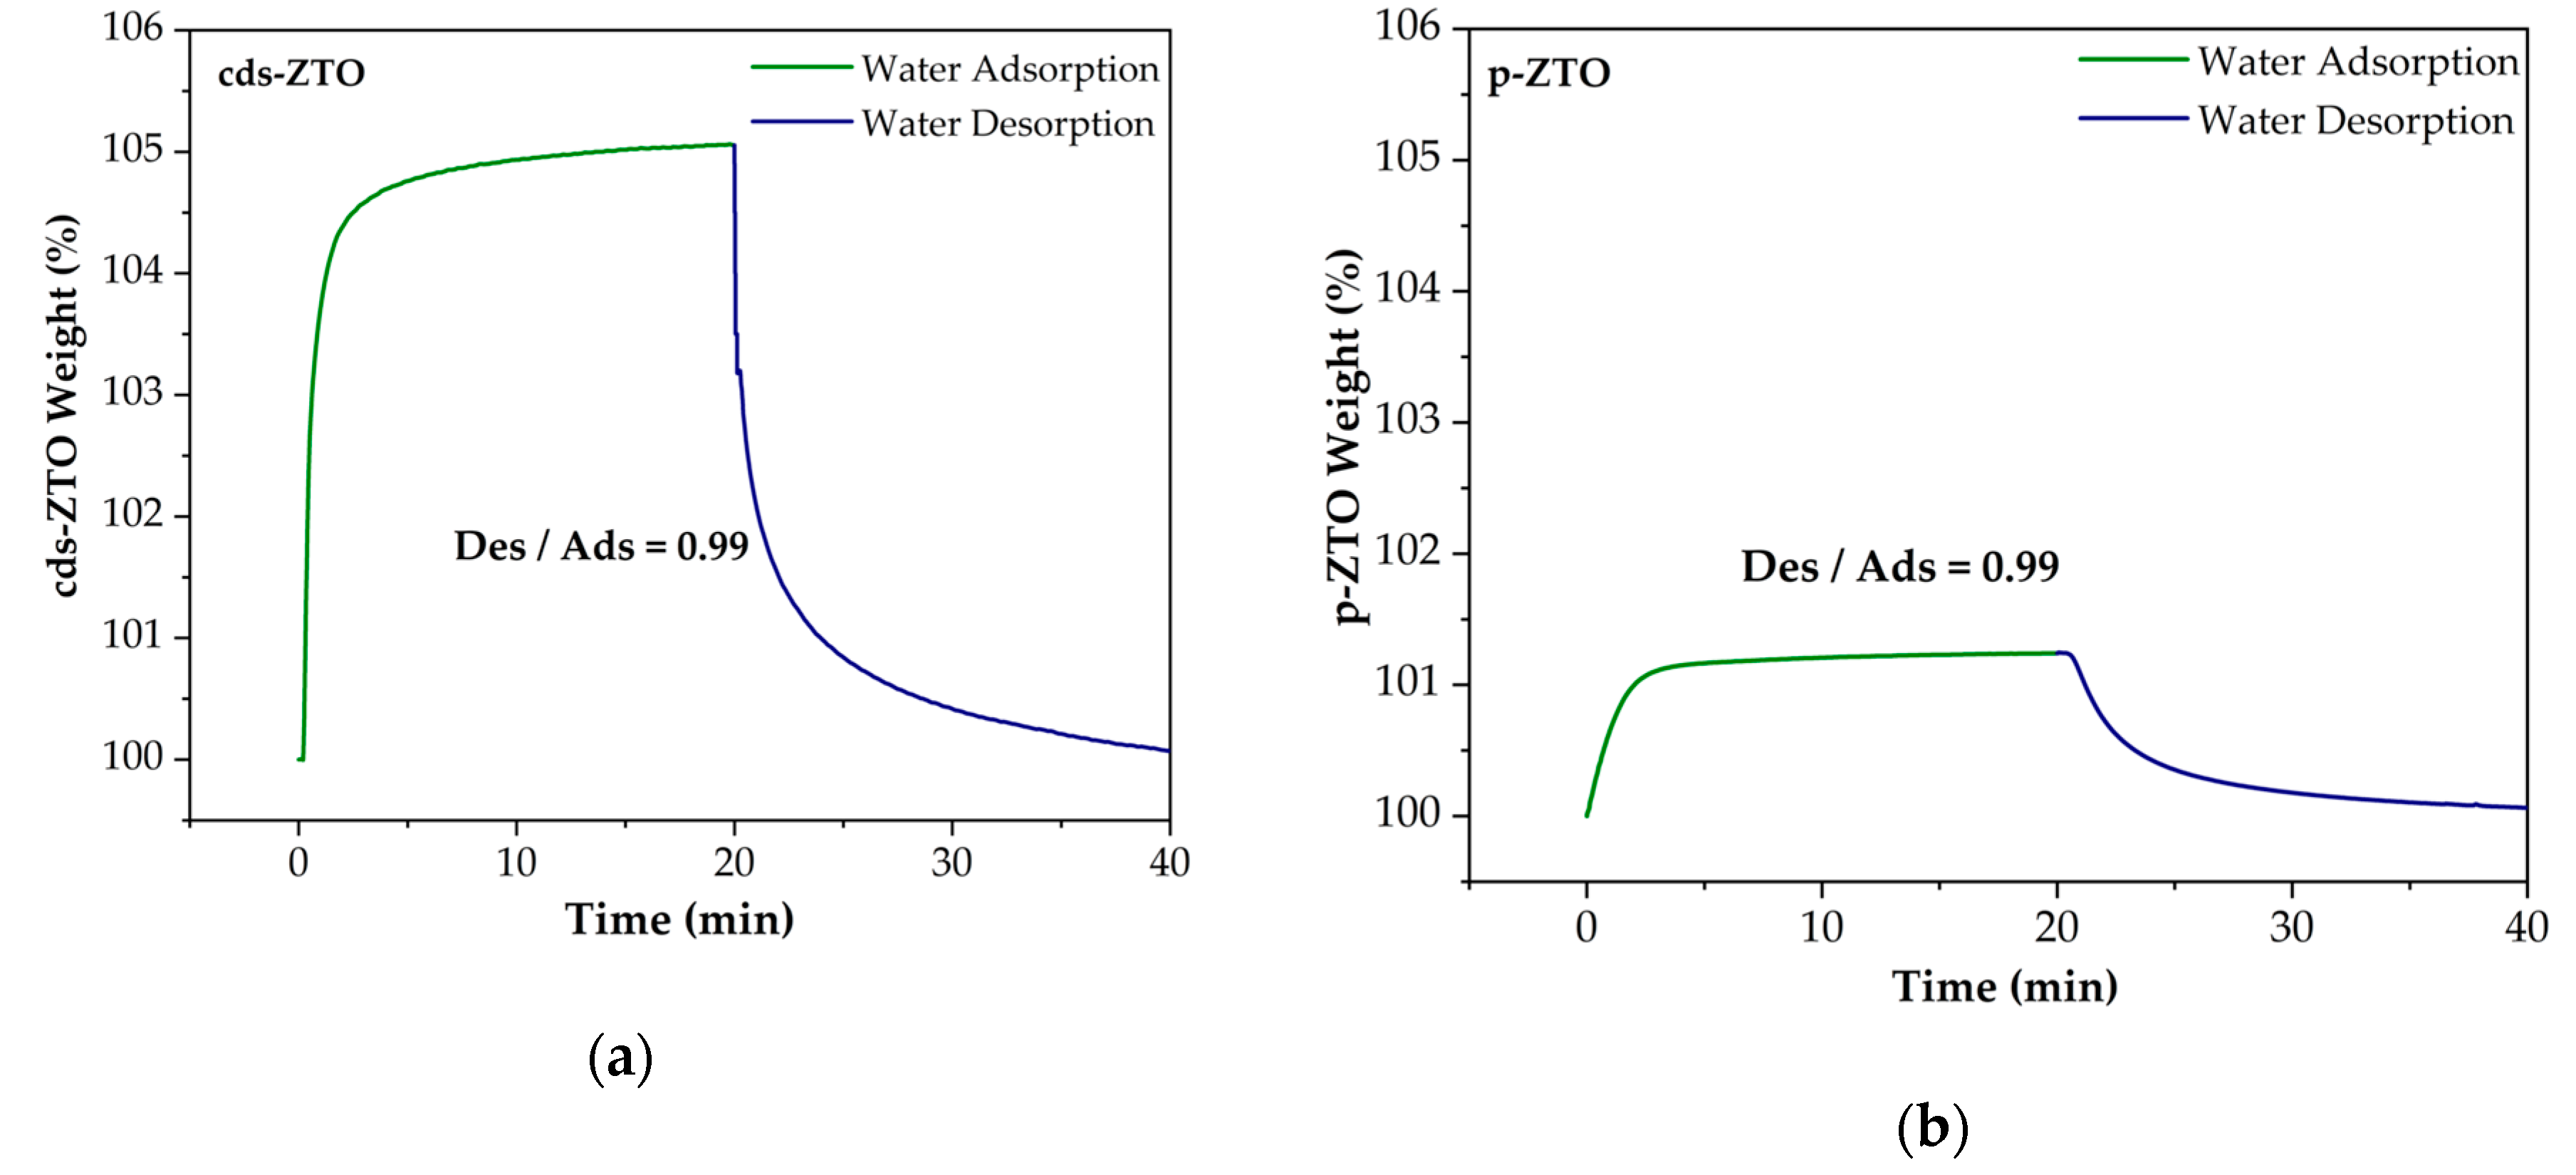
Figure 9 presents H
2O (as OH
− groups) adsorption–desorption isotherms on the surface of cds-ZTO (
Figure 9a) and p-ZTO (
Figure 9b) samples. This property is important in photocatalysts with application to hydrogen generation as well as organic compound degradation, since H
+ and OH
− are key species that participate in the photocatalytic reactions. Results indicate that for both samples their water adsorption/desorption capacity is close to one; therefore, it can be assumed that these species will always be available for the photocatalytic reaction to take place.
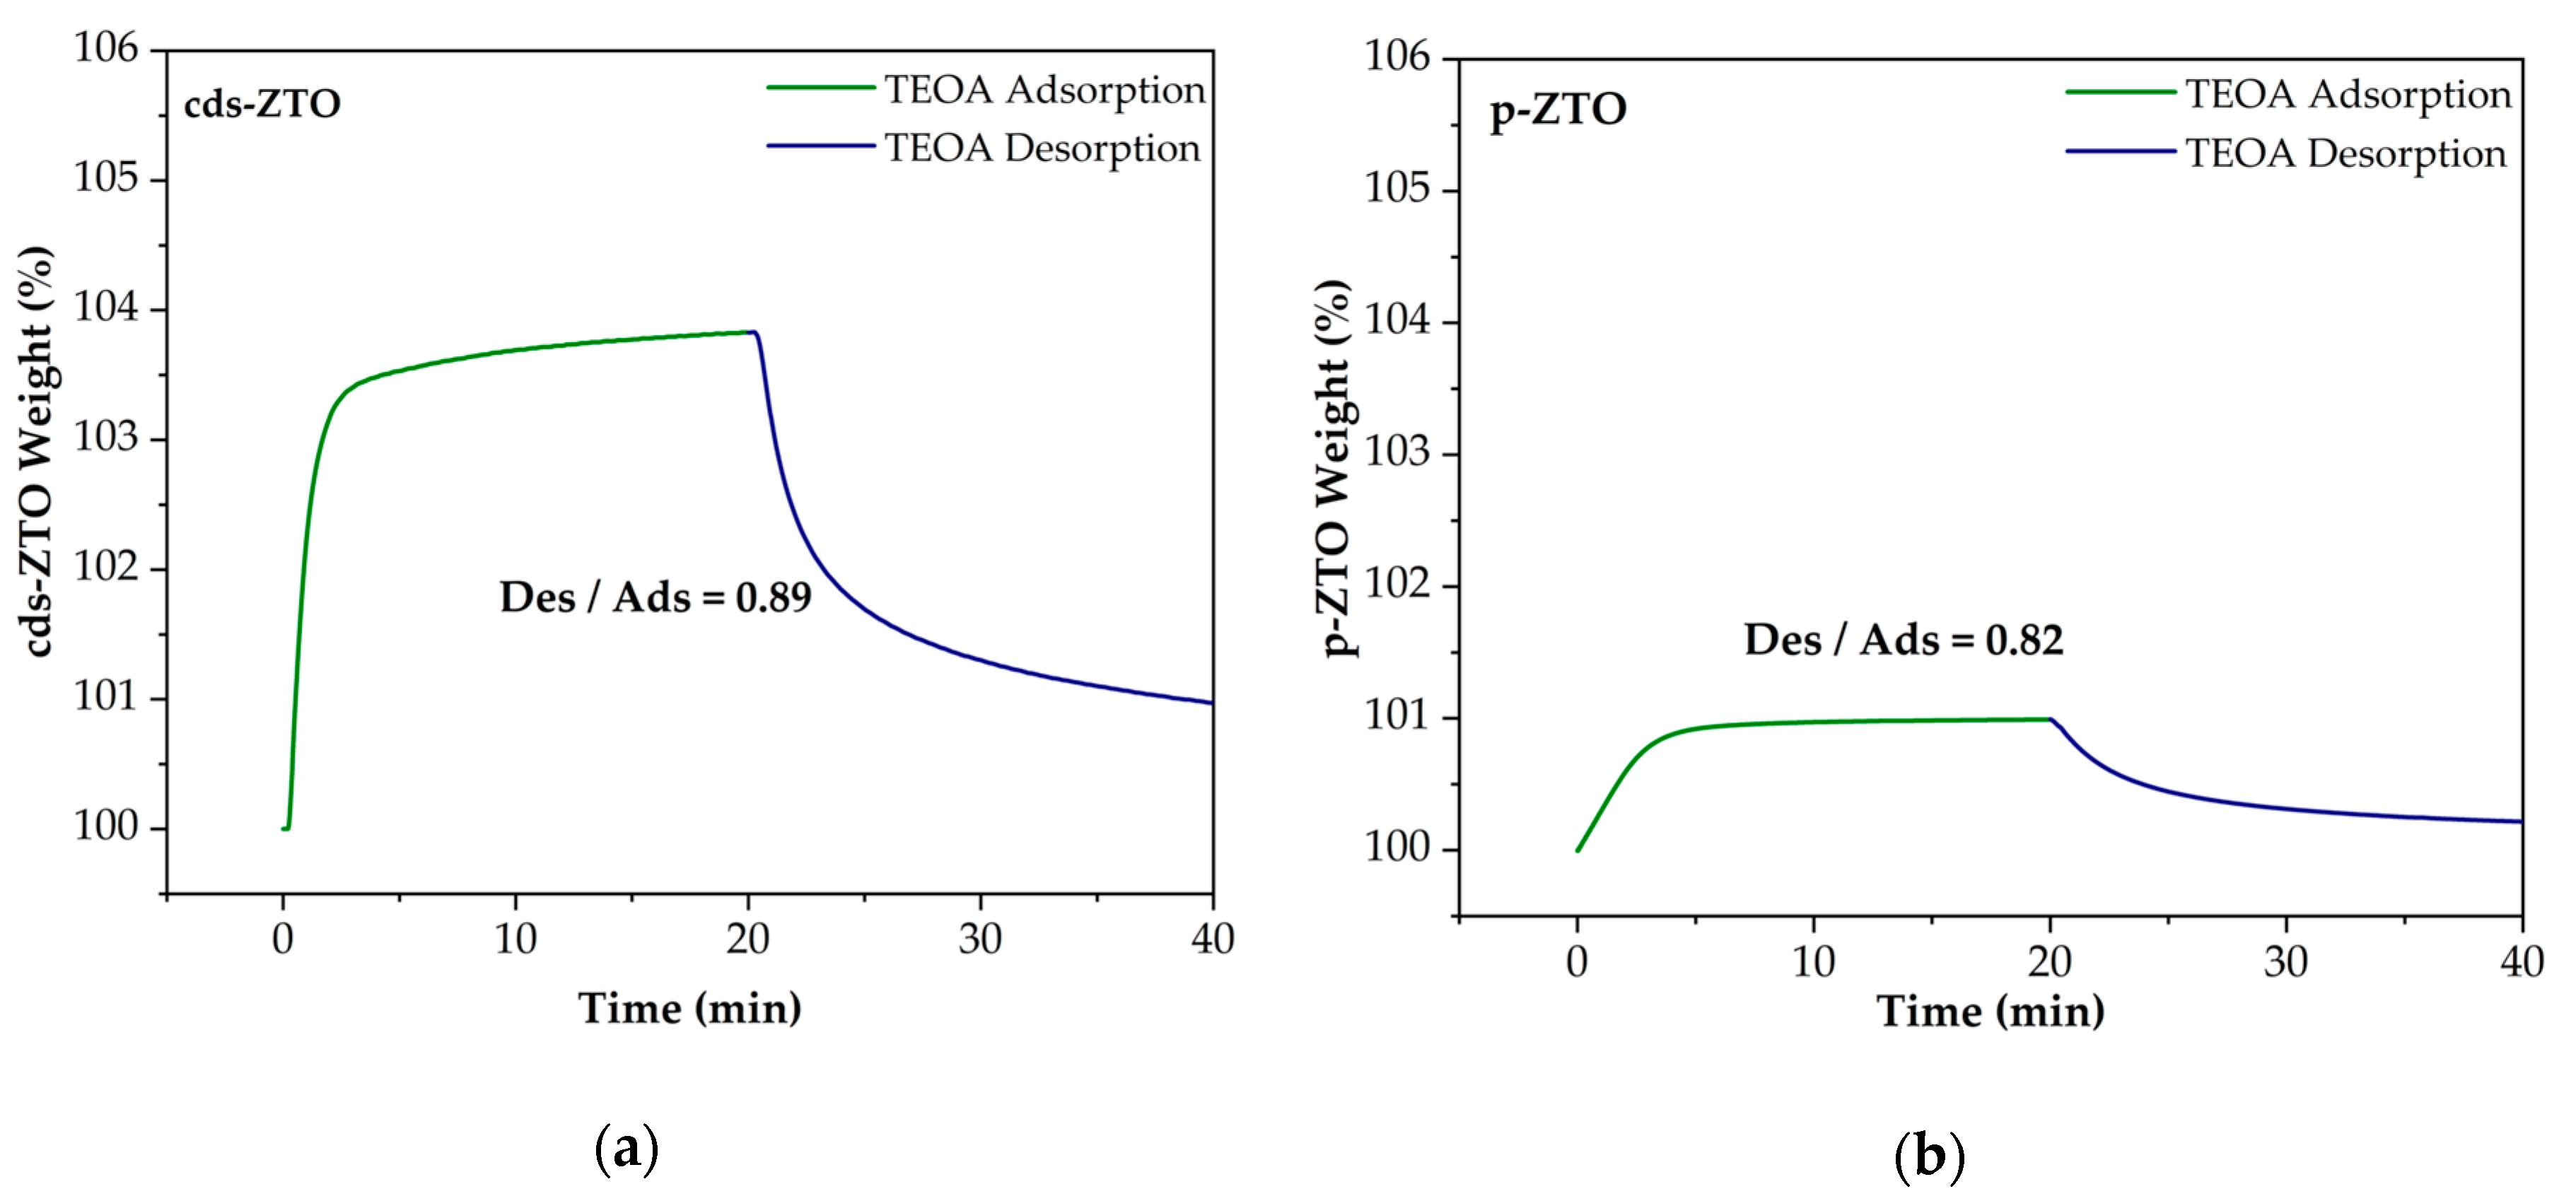
Figure 10 shows TEOA adsorption–desorption isotherms on the surface of cds-ZTO (
Figure 10a) and p-ZTO (
Figure 10b). As can be seen, adsorption–desorption capacity for both cds-ZTO and p-ZTO for TEOA is slightly lower than that for H
2O. The difference in H
2O and TEOA adsorption capacities between cds-ZTO and p-ZTO samples can be attributed to their different surface areas (88 and 13 m
2/g) due to the fact that the adsorption capacity is included within surface phenomena. As in the case of the H
2O adsorption, it can be considered that TEOA will always be present over the ZTO surface as the sacrificial agent and electron donor for the photocatalytic hydrogen evolution reaction.
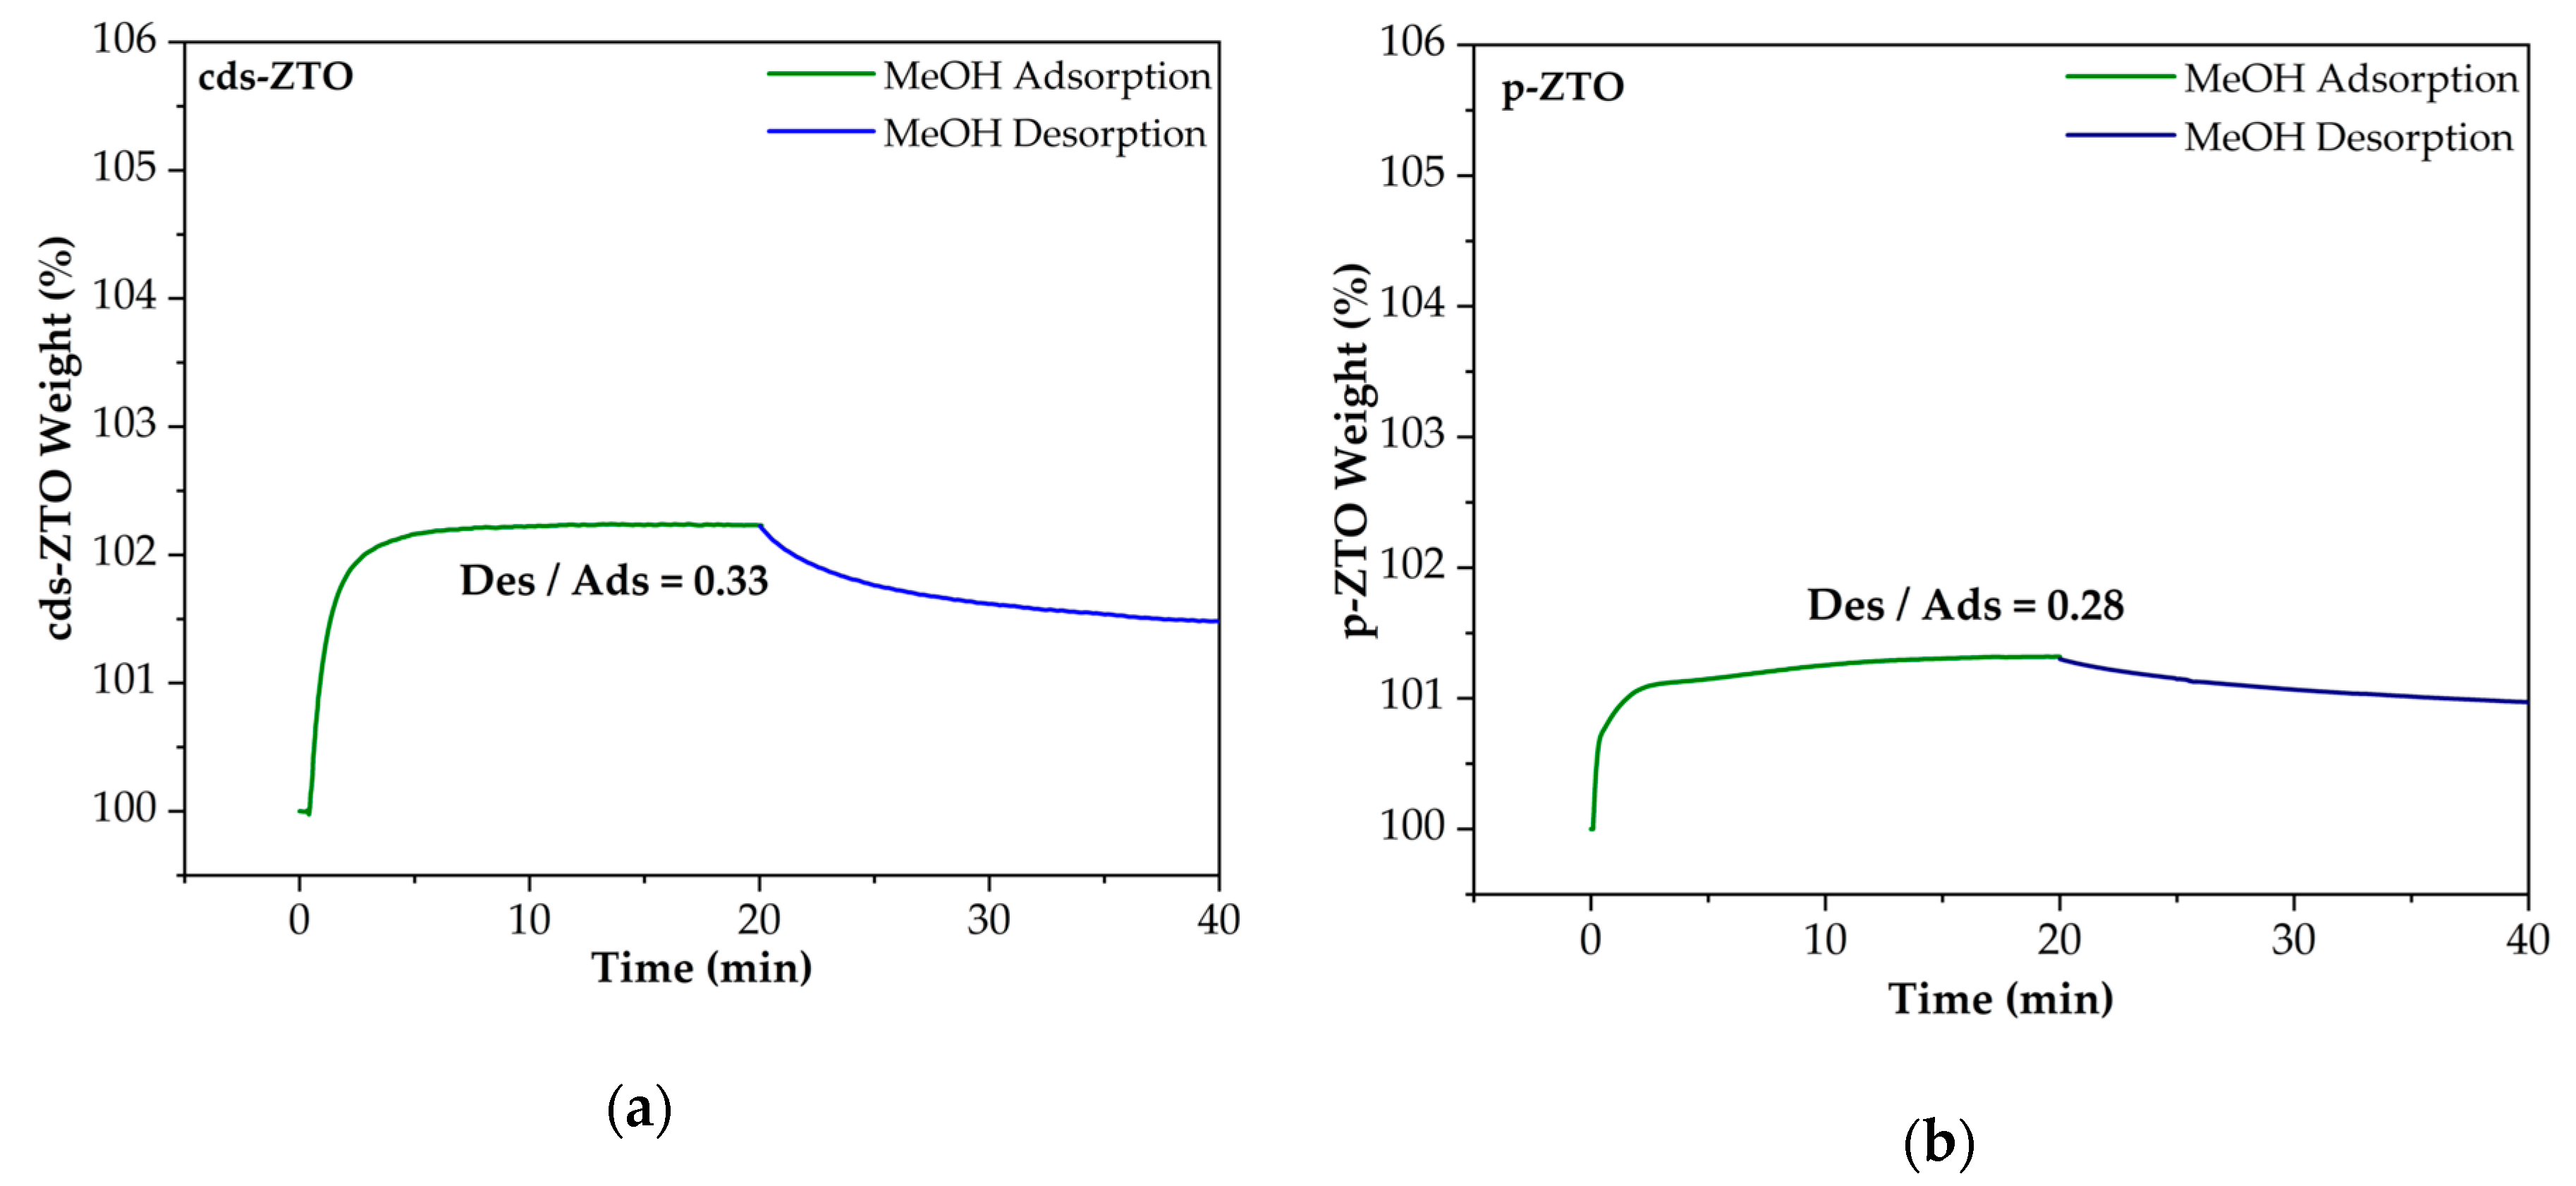
Figure 11 shows MeOH adsorption–desorption isotherms on the surface of cds-ZTO (
Figure 11a) and p-ZTO (
Figure 11b). As can be seen, adsorption–desorption capacity for both cds-ZTO and p-ZTO for MeOH is significantly lower than those for H
2O and TEOA. Then, it can be considered that TEOA will always be present over the ZTO surface as the sacrificial agent and electron donor for the photocatalytic hydrogen evolution reaction.
By comparing all the previous
Figure 9,
Figure 10 and
Figure 11, it can be established that the adsorption–desorption capacity of materials exhibits the following order from higher to lower: H
2O/cds-ZTO (0.99) > H
2O/p-ZTO (0.99) > TEOA/cds-ZTO (0.89) > TEOA/p-ZTO (0.82) > MeOH/cds-ZTO (0.33) > MeOh/p-ZTO (0.28). This behavior can be attributed to the surface chemical affinity of each material towards H
2O, TEOA, and MeOH, which defines their adsorption/desorption capacities. This capacity is influenced by the material surface defects such as vacancies and its textural properties, besides the permittivity of the substance to be adsorb.
Considering this last and discarding the defects due to surface vacancies in the materials, since EELS results indicate that both materials present proportional Ti
3+ species, results of adsorption–desorption can be explained as a function of MeOH and TEOA permittivities (31.2 and 29.3 F/m, respectively) and to the individual specific surface area of each material. Even though the permittivities of the sacrificial agents used in this work might be considered similar, this small difference can be significant in terms of polarization, since permittivity indicates how easily a substance or material can become polarized. Therefore, the intermolecular forces that MeOH could generate will presumably be greater than those produced by TEOA. Comparing Polarity, Indexes Reichardt, E
T/kcal mol
−1 for MeOH and TEOA are 55.5 [
48,
49] and 53.6 [
50], correspondingly, while dipole moments are 1.94 ± 1.08 D and 0.95 ± 1.08 D [
51]. Hence, when comparing MeOH and TEOA adsorption and desorption processes over the materials, it can be deduced that MeOH adsorption over the ZTO is more selective and stronger, which will presumably cause the desorption process to require a larger amount of energy for this to take place. Furthermore, this issue within the desorption process is more relevant for the oxidation products because it determines how fast the active sites become available again for new electron donors.
FT-IR Spectra of Sacrificial Agents Adsorbed on cds-ZTO and p-ZTO
During the photocatalytic hydrogen production, the sacrifice agents in solution with water act effectively as electron donors consuming the holes, in turn, preventing the recombination of the photoinduced electron–hole pair allowing them to reach the photocatalyst surface [
31,
52]. As mentioned by Wang et al. [
31], methanol and triethanolamine are the best alcohol and amine, respectively, as sacrificial agents mainly due to their oxidation potentials.
Photocatalytic reactions are easier carried out when sacrificial agents are adsorbed on the semiconductor material. FT-IR spectra of sacrificial agents adsorbed on ZTO surfaces were obtained according to studies reported by Yue et al. [
53].
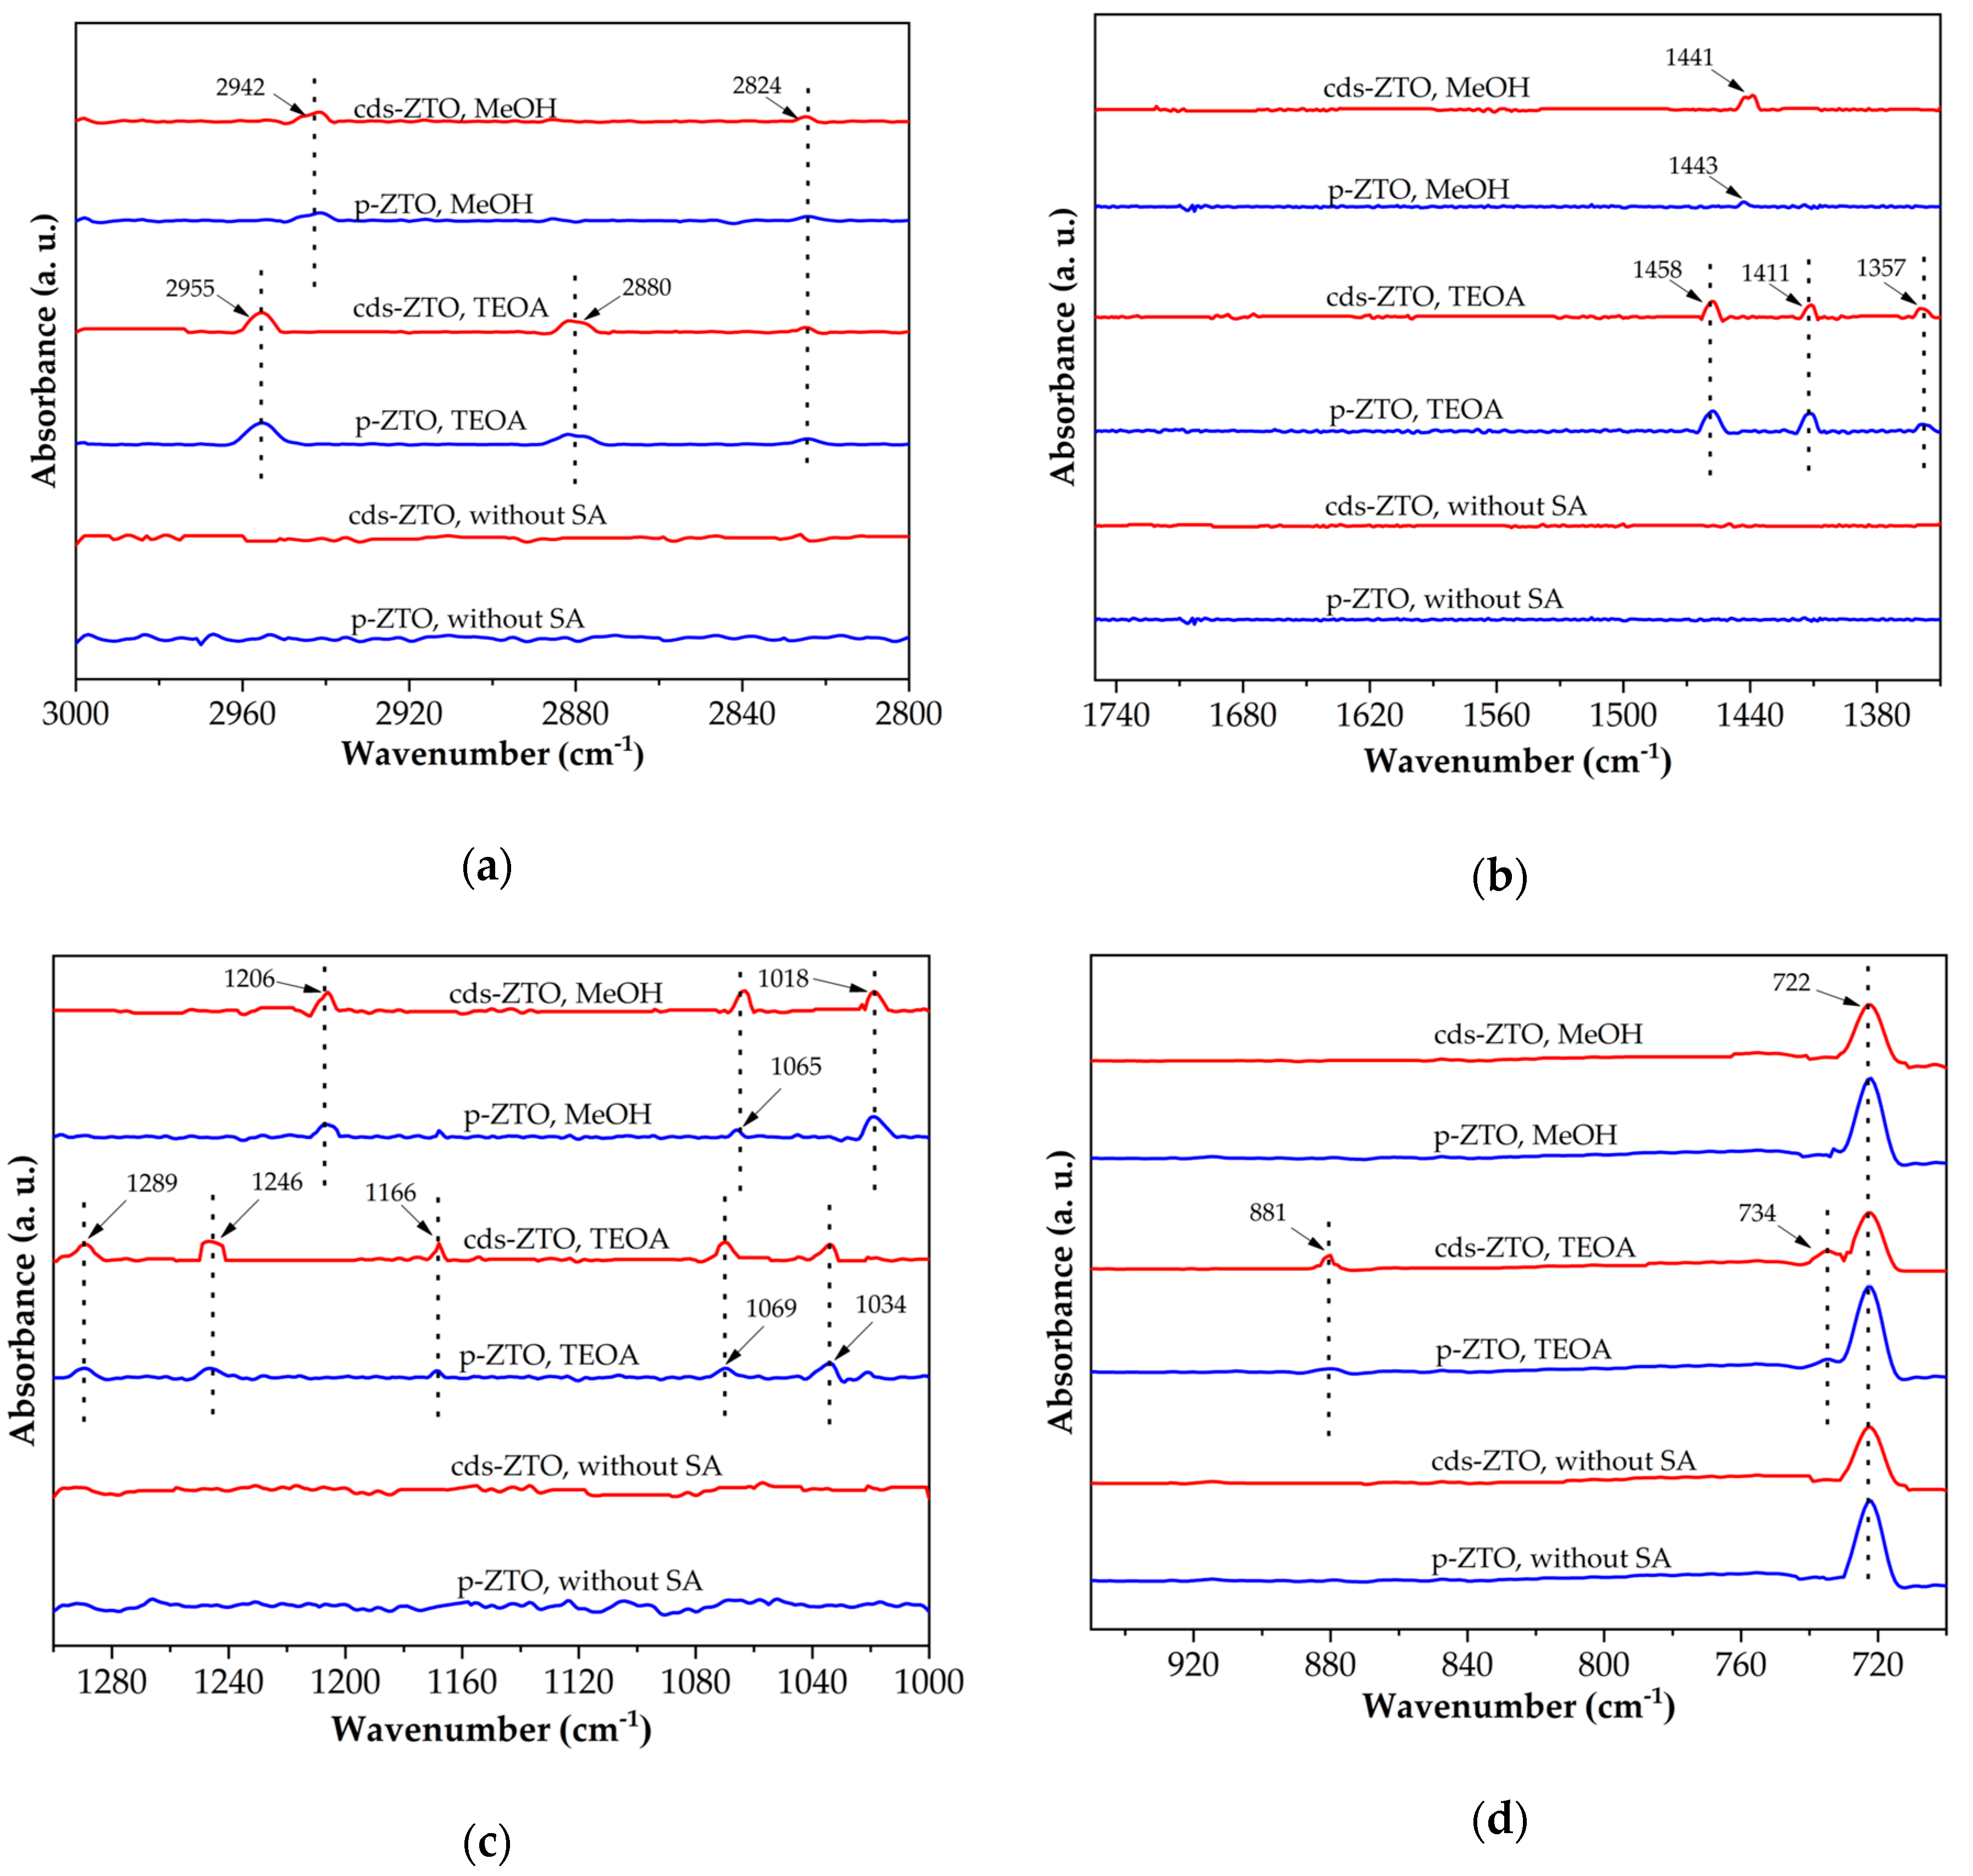
Figure 12 shows the FT-IR spectra in the ranges of 3000–2800 cm
−1 (
Figure 12a), 1750–1350 cm
−1 (
Figure 12b), 1300–1000 cm
−1 (
Figure 12c), and 950–700 cm
−1 (
Figure 12d) before and after the adsorption of methanol and triethanolamine on the surfaces of each ZTO. Absorption bands at 2942 and 2824 cm
−1 (
Figure 12a) of the FT-IR spectra of methanol adsorbed on Zn
2Ti
3O
8 and ZnTiO
3 are assigned to the characteristic symmetric and antisymmetric CH
3 stretching frequencies of CH
3OH
(a) and CH
3O
(a) species, respectively. The band at 1441 cm
−1 (
Figure 12b) corresponds to CH
3 bending vibrations. While bands at 1018 cm
−1 (
Figure 12c) indicate C-O stretching vibrations of CH
3OH
(a) and CH
3O
(a) species. The characteristic bands of metal oxides (<750 cm
−1), as already mentioned in
Section 2.5, correspond to the metal-oxygen and oxygen-metal-oxygen bonds, so the absorption band at 722 cm
−1 shown in all the FT-IR spectra of
Figure 12d are assigned to the O-Ti, O-Zn, O-Ti-O, O-Zn-O, and O-Ti-O related to Zn
2Ti
3O
8 and ZnTiO
3 species.
Although the most common reaction mechanism that is reported in the literature for photocatalytic hydrogen production employs methanol (as sacrificial agent) and TiO
2 [
31,
54], there are a number of other research studies where triethanolamine [
55] and glycerol [
42] are used.
The FT-IR spectra of
Figure 12a–d show the absorption bands of triethanolamine bonds after physisorption on the surfaces of cds-ZTO and p-ZTO. The bands of
Figure 12a at 2955, 2880, and 2824 cm
−1, at 1458, 1411, and 1357 cm
−1 of
Figure 12b, as well as at 1289 and 1246 cm
−1 of
Figure 12c are assigned to stretching, scissoring, and wagging CH
2-type vibrations. While bands in 1166, 1069, and 1034 cm
−1 are attributed to vibrations of the C-N, C-C, and C-O bonds, respectively.
These adsorbed species on the surface of the materials confirm the previous adsorption results from the former section.
2.8. Photocatalytic Hydrogen Production
For the activation of materials during the photocatalytic evaluation tests of cds-ZTO and p-ZTO towards hydrogen production, a 250W metal halide Philips lamp was employed.
Figure S2 shows the characteristic emission spectrum of this lamp after placing a cuttoff filter that only allows radiation of λ ≥ 420 nm, which is found in the region of the visible spectrum, where band gap values of cds-ZTO and p-ZTO fall.
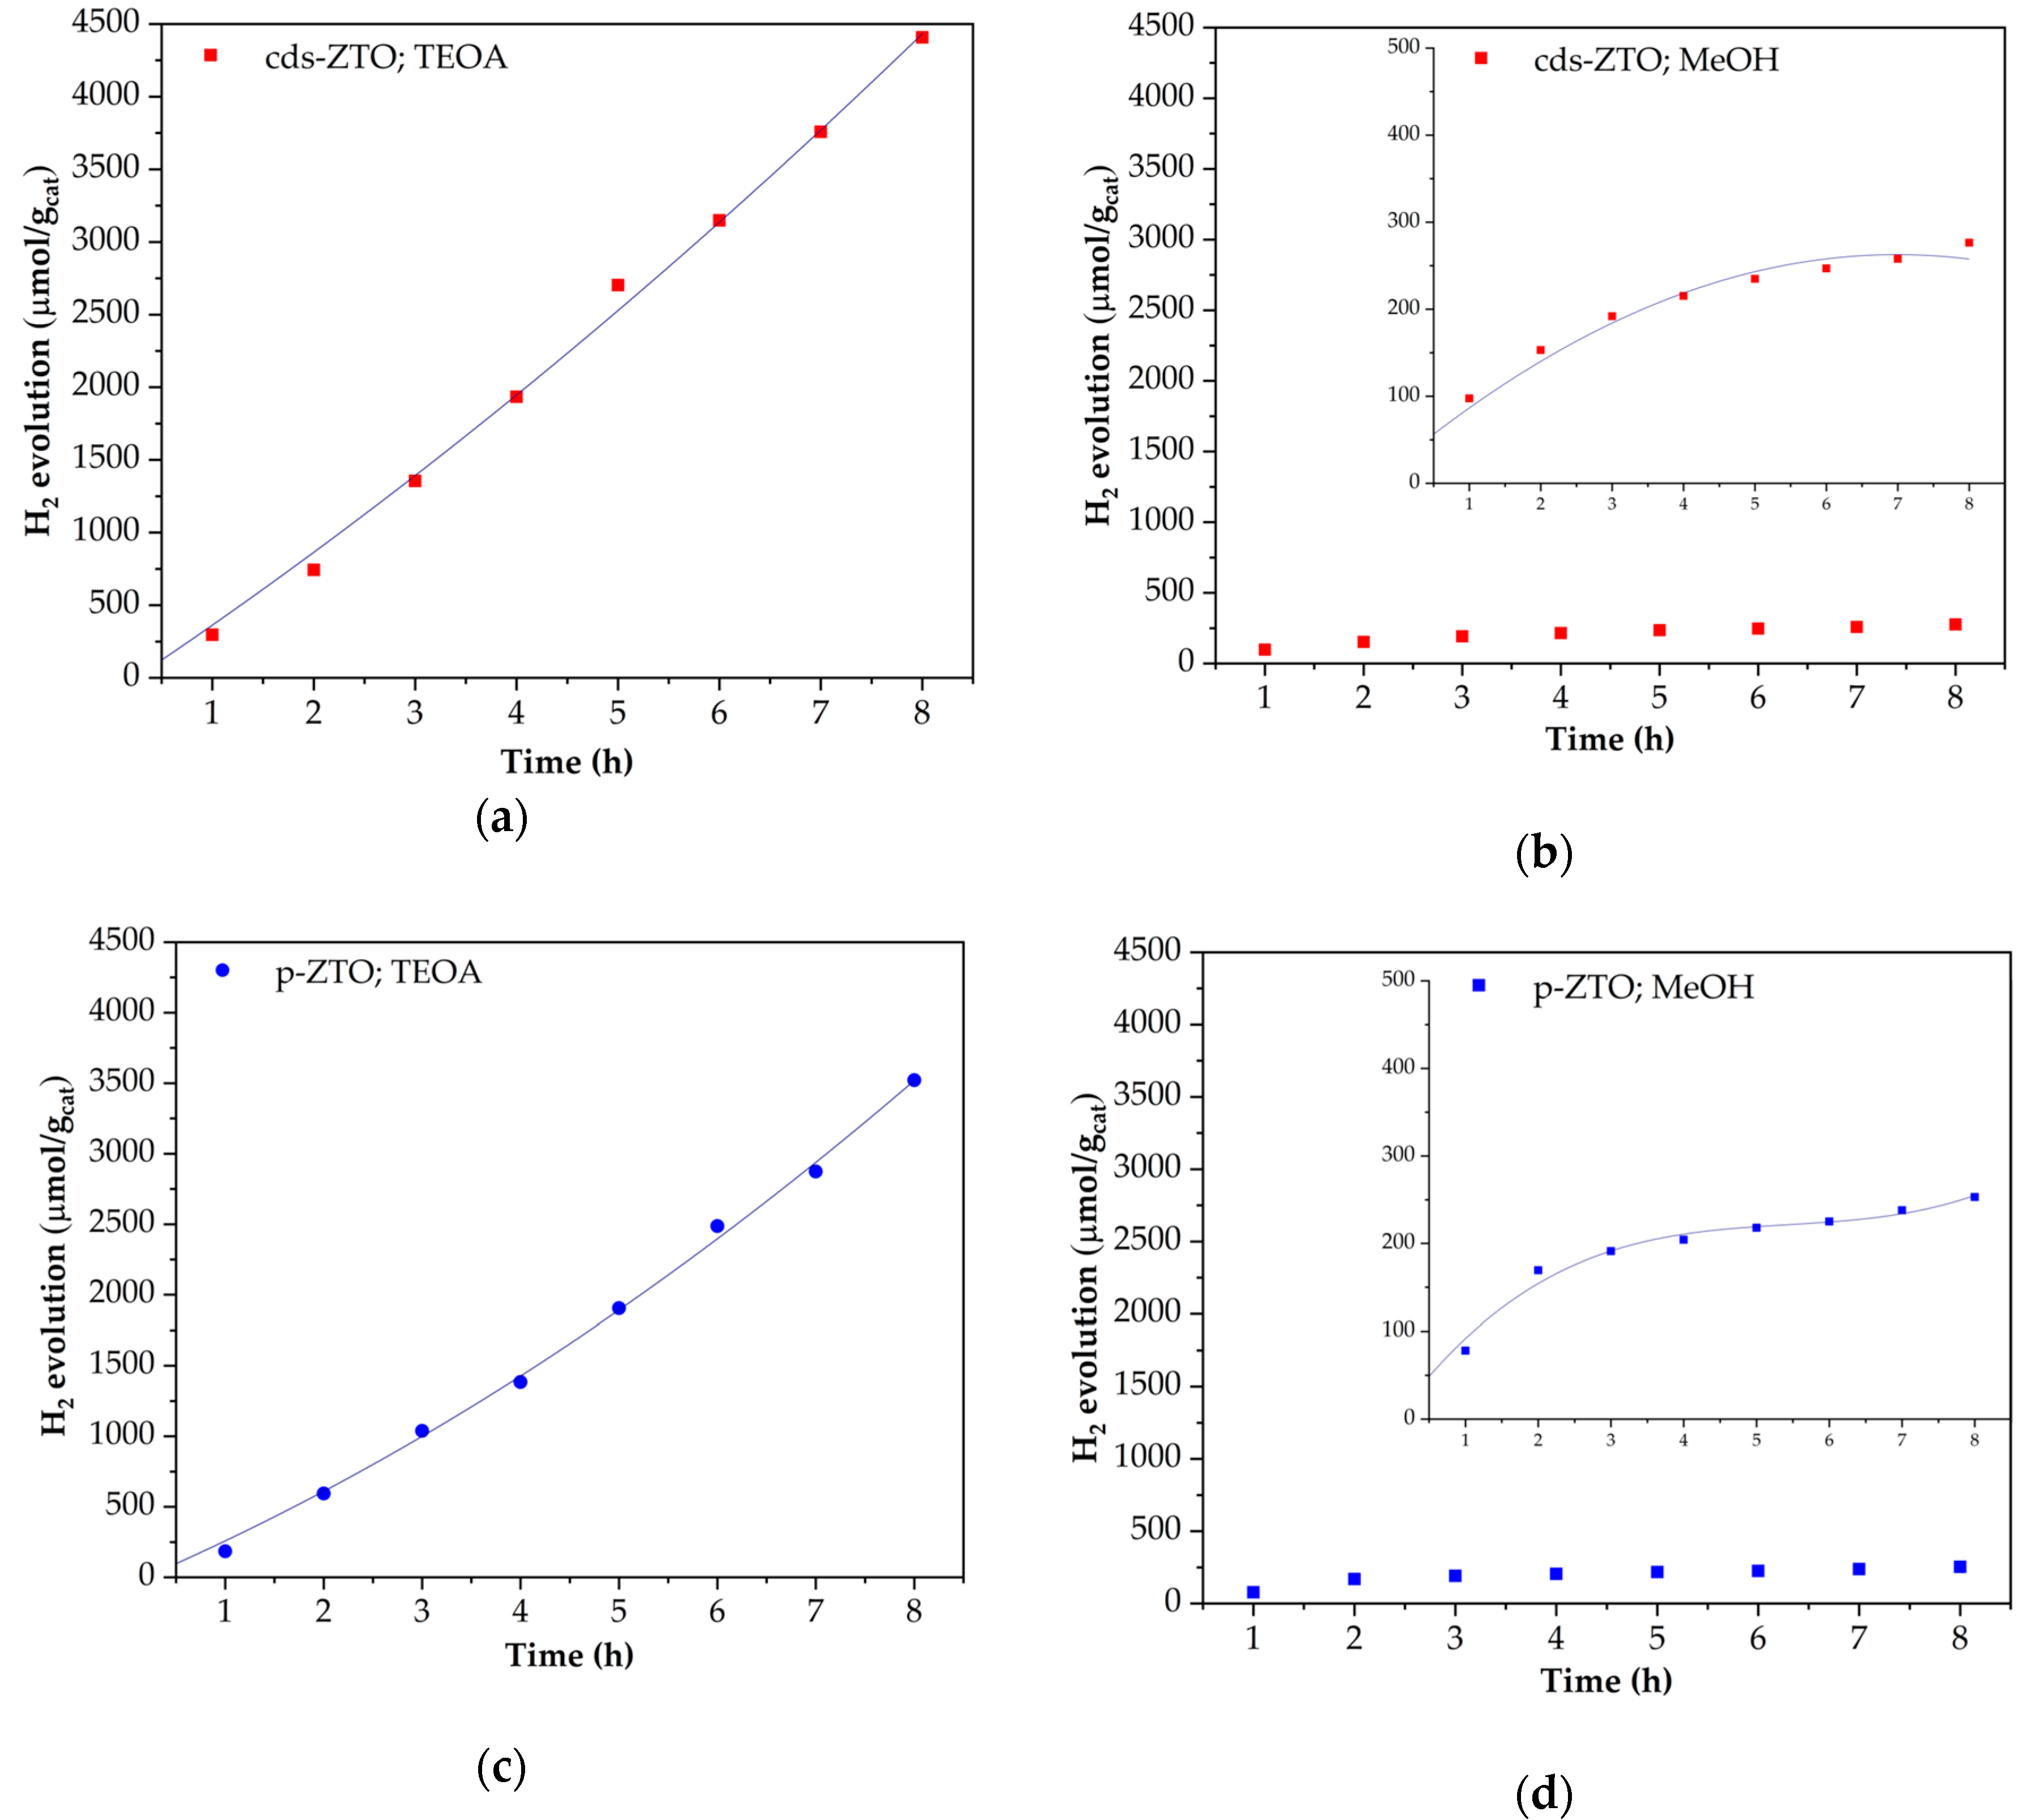
Figure 13 shows the monitoring of the photocatalytic hydrogen production using ZTO as photocatalysts.
Figure 13 a,bpresents results of cds-ZTO sample for the hydrogen production using a 10% volume of TEOA or MeOH. Whereas,
Figure 13c,d present the performance of p-ZTO towards hydrogen production using a 10% volume of TEOA or MeOH as sacrificial agents. According to
Figure 13a,c, after 8 h of irradiation, 4408 and 3531 μmol H
2/g
cat for cds-ZTO and p-ZTO were produced.
Figure 13b,d show that after 8 h of irradiation, cds-ZTO and p-ZTO reached a hydrogen production of 276 and 253 μmol H
2/g
cat.
Figure 14 presents hydrogen evolution rates for cds-ZTO and p-ZTO photocatalysts using triethanolamine and methanol as sacrificial agents. According to the results obtained for the hydrogen production after 8 h of irradiation, when TEOA is used as the sacrificial agent, the hydrogen evolution is higher, regardless of the photocatalyst employed, since both materials possess band gap values and VB and CB potentials suitable to be activated and be able to generate hydrogen.
Furthermore, cds-ZTO in both tests is the photocatalyst that produces greater amounts of hydrogen. This behavior can be attributed to the fact that this material has a greater surface area than that of p-ZTO (~88 vs. 13 m2/g) and consequently, more active sites to carry out the reaction.
Moreover, when comparing the hydrogen production of the ZTO under different sacrificial agents, the hydrogen production increases between 14 and 16 times when triethanolamine is used as the sacrificial agent. This behavior can be explained by the findings of Wang et al. [
31] who claim that hydrogen production increases when the sacrificial agent has a greater permittivity and less oxidation potential. However, for the present case, only the oxidation potential can be considered, since the permittivity of methanol and that of triethanolamine are very similar, 31.2 and 29.3 F/m; but their oxidation potentials vary considerably being 1.05 for methanol and 0.56 eV for triethanolamine. The difference between the oxidation potentials of the sacrificial agents can be translated in terms of the sacrificial substance with the lowest oxidation potential more easily oxidized, as long as the potential of the valence band of the photocatalyst is greater than the potential of oxidation of the substance.
This could be completely true if the potential of the valence band of the ZTO under study were very close to the value of methanol oxidation potential (1.05 eV). However, valence band potential values of cds-ZTO and p-ZTO are 2.83 and 2.20 eV [
56,
57], which could easily oxidize methanol.
On the other hand, the general photocatalysis mechanism is mainly composed by photonic activation, adsorption, reaction, and desorption. Of these processes, the first three were found to be carried out in the materials under both sacrificial agents. However, the desorption process when methanol is used is compromised by the intermolecular interaction forces on the surface of both photocatalysts, causing methanol not to be desorbed and consequently the separation of the water molecule cannot be carried out efficiently. The desorption step of the photocatalysis mechanism, when TEOA is used, is relatively unaffected, carrying out its function as the sacrificial agent for the hydrogen evolution from the water molecule. Therefore, the methanol and triethanolamine effect as sacrificial agents is reflected in the ability of the ZTO materials to desorb them.
Presumably, the lower MeOH desorption capacity by ZTO generated a poorer production of hydrogen because the ZTO surface was obstructed by certain functional groups that remained adsorbed to the surface, thus decreasing the active sites to carry out the photocatalytic reactions. It is possible that the greatest photocatalytic activity towards hydrogen production happened by the combined effect between TEOA features like its relatively low permittivity and less oxidation potential and cds-ZTO photocatalytic properties such as its high surface area, adsorption–desorption capacity, and available active sites for the photocatalytic reaction.
3. Materials and Methods
3.1. Materials
For the synthesis of ZTO, zinc nitrate hexahydrate Zn(NO3)2·6H2O (99% pure) and titanium isopropoxide (97% pure) were used as precursors acquired from Sigma-Aldrich (St. Louis, MO, USA). Citric acid (99% pure, Sigma-Aldrich, St. Louis, MO, USA) and ethylene glycol (99.5% pure, Fluka, St. Louis, MO, USA) were employed as chelating and polymerizing agents. While methanol (99.8% pure, J.T. Baker, Port of Spain, Trinidad and Tobago) and triethanolamine (99% pure, Sigma-Aldrich, St. Louis, MO, USA) were used as sacrificial agents for the hydrogen production evaluation of the synthesized materials. In addition, distilled water was employed as a medium (J.T. Baker, Ecatepec, Mexico).
3.2. Synthesis of cds-ZTO and p-ZTO
Sol-gel was used for the synthesis of ZTO, employing the modified Pechini method [
4,
5]. In
Figure S3, a synthesis diagram of the ZTO is shown.
For the synthesis of ZTO, the modified Pechini method was carried out using Zn and Ti precursors in a 1:1 molar ratio to obtain 1 g of a ZTO. The amount of citric acid as fuel was in a 1:2 and 1:4 molar ratio with respect to Zn
2+ and Ti
4+ in order to provide enough carboxyl groups and thus facilitate the formation of the polymeric network. Ethylene glycol was added in a 1:1 molar ratio with respect to citric acid because the size of the Zn and Ti atoms are similar. Citric acid and ethylene glycol were diluted in a separated way in distilled water, then they were mixed and kept under constant stirring at 70 °C for 30 min until reaching a transparent gel, which was allowed to cool down to ambient temperature. Zinc nitrate was diluted in distilled water and then mixed with the transparent gel of citric acid-ethylene glycol. Finally, the titanium isopropoxide was added drop by drop to the mixture of zinc nitrate and the transparent gel, which was kept under constant stirring at a speed of 300 rpm at 80 °C until obtaining a white gel and next a polymeric powder resin. To obtain cds-ZTO, this resulting powder was calcined at 450 °C for two hours followed by 550 °C for 1 h. To get p-ZTO, the resulting powder was calcined at 450 °C for 2 h and subsequently at 700 °C for 1 h. These calcination temperatures employed to obtain the corresponding crystalline phases were established from thermograms performed in an air atmosphere using a thermogravimetric analyzer (TGA) TA Q500 (New Castle, DE, USA) and from data reported by Budigi et al. [
29].
3.3. Characterization
X-ray diffractograms of the calcined powders were obtained in a 20–80° 2θ-range to determine the crystalline structure of the ZTO samples in a Panalytical XpertPRO diffractometer (Malvern, UK), equipped with KCu
α radiation (λ = 0.15405 nm). The crystal size was estimated using the Scherrer equation:
where DC is the crystal size, K ≈ 0.94 is the Scherrer constant, λ is the wavelength of the X-rays (0.154178 nm), β is the width of the diffraction peak with the highest intensity, and θ is the diffraction angle. It was decided to use the Scherrer Equation (1), because it is based on principles like those of the geometrical theory of X-ray diffraction. This means, after the entering radiation is scattered by an atom, it will not interact with other atoms. Nevertheless, the derivation of the Scherrer equation includes several simplifications, for example, it disregards the type or scattering power of the atoms and crystal symmetry or reflection used, it can provide acceptable results when compared with other techniques such as high-resolution transmission electron microscopy or small-angle X-ray scattering. These acceptable results are restricted to sizes up to a few hundreds of nanometers (~10–200 nm) [
58]. Morphology, elemental analyses, and electron energy loss spectroscopy (EELS) studies were examined using a JEOL JEM 2200FS+CS (Peabody, MA, USA) transmission electron microscope (TEM).
Optical properties of the materials were determined using a Perkin Elmer (Waltham, MA, USA) model Lambda 35 UV–Vis spectrophotometer equipped with integration sphere. The absorption spectra were generated by diffuse reflectance to determine the band gap values using the Kubelka–Munk technique and the Tauc plots, employing:
where f(R) is the Kubelka–Munk function and R is the diffuse reflectance of the materials. Subsequently, Tauc plots were constructed, placing x =
hv on the ordinates axis and y = (f (R)
hv)n on the abscissas axis, where hv is the photon energy in eV, h is the Planck’s constant, v is the frequency, and n represents the nature of the transition: n = 2 direct and n = 1/2 indirect.
Surface areas were estimated by nitrogen physisorption using a Quantachrome model NOVA1000 equipment (Boynton Beach, FL, USA). Fourier transform infrared (FT-IR) spectra were obtained at wavenumbers from 4000 to 400 cm−1, using a Perkin-Elmer Spectrum Frontier model equipment (Waltham, MA, USA).
ZTO adsorption–desorption tests were performed employing water, methanol, and triethanolamine (sacrificial agents) as adsorbates at 30 °C employing a thermogravimetric analysis TA Discovery model TGA550 (New Castle, DE, USA). These tests aimed to provide relevant information on adsorbate’s affinity toward the ZTO surface and the ability of materials to carry out the desorption of sacrificial agents. The amount of water or sacrificial agents adsorbed/desorbed on the surface of the ZTO samples was measured by weight change recorded in the thermogravimetric analyzer (TGA). Samples were previously surface-cleaned using a thermal treatment consisting in heating up to 70 °C under a 100% N2 atmosphere. Cleaned samples were then cooled down to 30 °C for the adsorption/desorption tests, which were performed using a 100 sccm N2-adsorbate saturated stream until constant weight was achieved. The desorption/adsorption ratio of each adsorbate (H2O, TEOA or MeOH) was calculated by dividing the amount desorbed over that adsorbed, determined by each TGA test. Subsequently, FT-IR spectra were obtained for each ZTO after the adsorption of each sacrificial agent, to identify the functional groups of methanol and triethanolamine that influenced the photocatalytic reactions towards the production of hydrogen.
3.4. Photocatalytic Activity
Photocatalytic activity tests consisted of placing 50 mg of a photocatalyst powder sample with 100 mL of a sacrifice agent-water solution (H
2O:TEOA or MeOH, 90:10 Vol). Each sample was suspended in deionized water and placed together with the sacrificial agent solution in a cylindrical quartz reactor. The reactor containing the water-sacrificial agent solution and the photocatalyst was sealed and placed on a magnetic stirrer at 500 RPM and irradiated for 8 h under artificial visible light emitted by a 250 W metal-halide Philips lamp MH/U model (Ningbo Fenghua Noerka Lighting & Fixture Co., Ltd. Zhejiang, China) equipped with a wavelength cutoff filter (from 400 nm and beyond) to shield UV light. Photocatalytic hydrogen evolution reaction was monitored using a Gas Chromatograph (GC), PerkinElmer Clarus 580 (Waltham, MA, USA) equipped with a thermal conductivity detector (TCD). In
Figure S4, the experimental setup for the photocatalytic evaluation tests is shown. Gas samples were taken and injected to the hour for a total of 8 h, the amount of hydrogen production was quantified and reported in μmol H
2/h g
cat.

 ,
, 


