Abstract
We use an agent-based model to investigate the interdependent dynamics between individual agency and emergent socioeconomic structure, leading to institutional change in a generic way. Our model simulates the emergence and exit of institutional units, understood as generic governed social structures. We show how endogenized trust and exogenously given leader authority influences institutional change, i.e., diversity in institutional life-cycles. It turns out that these governed institutions (de)structure in cyclical patterns dependent on the overall evolution of trust in the artificial society, while at the same time, influencing this evolution by supporting social learning. Simulation results indicate three scenarios of institutional life-cycles. Institutions may, (1) build up very fast and freeze the artificial society in a stable but fearful pattern (ordered system); (2) exist only for a short time, leading to a very trusty society (highly fluctuating system); and (3) structure in cyclical patterns over time and support social learning due to cumulative causation of societal trust (complex system).
1. Introduction
The central research question of this paper deals with the emergent effects originating from dynamic interdependencies of individual strategies and social structures—see [1] for the latter. The theory of games originally established by von Neumann and Morgenstern is perfectly suited to approach such a problem, since it provides a formal mathematical body to model social interaction and basic communication structures. Thus far, game theory was used to model a multitude of socioeconomic problems, assigning relevance to strategy formation as a major influence on economic behavior, see [2] for a recent overview on the integration of game theory and the behavioral sciences. However, with the rise of evolutionary game theory the notion of learning became a central issue of investigation, in particular within population dynamics, see [3] for one of the first elaborations. In this context population dynamics have become central in phylogenetic terms, where evolutionary stable strategies (ESS) enhanced the fitness of a group compared to others within a population. The evolutionary turn has revealed a very important finding, namely that certain strategies of conditional cooperation may lead to an ESS, thereby outplaying the strict dominance of the defective strategy, thus, transforming non-cooperative games into cooperative games, see [4,5]. Obviously this strand of research has also influenced findings about our own origin and heritage as a human species, see [6]. Although we have gathered tremendous knowledge on our social preferences and the strategic sources for cooperation in non-kin large-scale societies, we have not properly connected these findings yet with the emergence, life and exit of institutions in economy and society, i.e., institutional change. This research topic opens up a multitude of interesting research questions, first attempts to cope with them are given in [7]. Furthermore Ostrom [8] has clarified that institutions coordinate individual strategies concerning collective action problems. They represent more than just constraints on behavior [9], but may even lead to the emergence of new forms of behavior. Institutions evolve along strategies and rules, in consequence, they evolve in diverse forms from social interaction and reconstitute economic behavior. Seemingly, it stands to reason, that institutions are meta-stabilized sets of established and culturally transmitted [10] rules forming the cornerstones of political economy and its evolution. In this perspective, the theory of games can play a decisive role in explaining the political economic causes of endogenous crisis [11] via the accumulation of historically established strategies, habits, and their potential lock-in resulting in unequal patterns of social stratification, see [12] for Bourdieu’s sociological analysis of the problem at hand. A similar socioeconomic approach got established almost 100 years earlier by Thorstein Veblen [13]. Veblen has looked into the cumulative causation of habits of thought resulting in institutional change. This first socio-cybernetic approach was interpreted by him as an evolutionary contribution to economics [14], because evolving institutions depend on the variation, selection and retention of habits of thought and social norms, such as conspicuous consumption for instance. Thereby, institutions are understood as social structures, which, again, feed-back to the establishment of new habits and norms. These spiral dynamics are crucial for what has been called the old institutional economics. The old approach to institutionalism stands in contrast to the new institutional economics research program where attention is turned to the transaction costs of socioeconomic activities, compare [15] for the demarcation problem between old and new institutional economics. Obviously, it is the notion of contingent path-dependent evolution, which makes the former approach richer in scope but more difficult to model. However, today we have the analytical tools to compete with such a challenge, as the original attempt by [16] has recently shown.
In order to fully integrate the theory of games into an evolutionary approach of institutional change as the central sub-field of evolutionary political economy, [11] suggests considering a computational and algorithmic methodology of agent-based modeling (ABM) and socioeconomic simulation. Recently this attempt has received increasing attention within a certain part of evolutionary economics, concerned with institutional evolution, see [17] for a computational multi-agent approach to meso-economics and critical platform size. The ABM approach suits the problem at hand well, because it is able to mimic the complex non-equilibrium dynamics of an evolving economy. The analyzed emergent properties are revealed on a meso-economic level, between micro and macro [18], acknowledged recently by Arthur [19]. Institutions play a central role in this process as social structures of rule correspondence, however, in the history of economic thought, heuristics were always explained differently, compare [20]. The advantage of the agent-based methodology over evolutionary game theory is given by the possibility to model institutions as accumulating social structures, once certain rules are introduced about governance and regulation. From a static analytical perspective, Aoki [21] has provided the first theoretical framework to analyze institutional complementarities via one-shot games as strategic systems of shared beliefs. Still, in this realm of research, dynamic models of interdependent agency-structure relations causing institutional change are rare and need further attention.
2. Model
We propose a framework to model the emergence, life and exit of institutions (institutional life cycles) in an artificial political economy based on the interactions of individuals on a micro level. In the model we treat institutions as social accumulating structures instead of mere sets of agents with common properties, where the frequency and coordination of strategies and behavioral motivations plays the superior role (i.e., an artificial society without social structure). The former anticipation is essential for a game theoretical approach of institutional change as understood in old Veblenian institutional economics, i.e., basically a co-evolutionary process between agency and structure leading to differentiation in the population of agents. Particularly, we model institutions as governed social structures with clearly codified entry and exit conditions for agents as members (compare Hodgson ([22], p. 18) for this particular aspect of institutions). To this extent they represent generic regulatory mechanisms that make societies stable on a large scale. Thereby, it is important to note that institutions are neither conceived as general-purpose vehicles, nor just as spontaneously emerging and exiting, but underlie individual life-cycles. Respectively, they evolve within a contingent path-dependent process that is dependent on the general level of societal trust. This aspect of accumulation makes agents endogenously heterogeneous and institutions diverse evolving aggregate structures, see [23] for a differentiation between heterogeneity and diversity.
In our model, agents populate an abstract topological space and interact with each other locally on a regular grid with linked edges (a torus) to avoid edge cell problems. The interaction is based on a prisoner’s dilemma logic, i.e., in every time step agents play the prisoner’s dilemma game with their von-Neumann neighbors. According to the logic of the ordinary 2 × 2 prisoner’s dilemma, agents can either cooperate or defect. In our model, agents are endowed with cognitive capabilities (a memory of events in the recent past, and a decision mechanism using this memory), which feed their individual decisions. In the course of the simulation, different agents accumulate different memories due to individual spatial interaction, and thus naturally evolve into a heterogeneous set of individual decision makers1. Repeated cooperation between agents builds up trust, which in turn influences the emergence and exit of institutions as exclusive governed structures. It is important to distinguish between “institution-building proper”, which by itself just constitutes part of the “rules of the game” [24], of the simulation, and its materialization as some special form of governance. Thereby, some members of this institution enforce compliance to the rule set. The special form, the realization of an institution, needs to be modeled explicitly by some agents taking over the role of enforcers, the role of executive power. As history teaches, executive power is needed for two distinct tasks: (1) It guarantees internal stability (compliance to the institutional rules); and (2) it warrants security from external threats (others trying to invade from outside). The institutional apparatus necessary to exert executive power is always financed by tribute payments of its members to their ruling executive. With a similar (and consistent) logic the model also takes care of the possibility of the break-up of institutions.
In this respect, we follow Hooper et al. [25], who highlight that leadership may get accepted in cooperative groups, if it crowds out free-riding or coordination errors. Moreover, the authors specify in their model that members may prefer to pay for the supervision instead of staying in an unsupervised group. Thereby, agents accept a hierarchical organization of social complexity, which is in line with our approach. Still, we do not implement public good games, as in [25], where mutual monitors punish defectors, but institutions with hegemonic leaders enforcing cooperation within clearly structural bounds, instead of more loose groups of agents sharing common properties. To this extent, our approach wants to emphasize the explicit character of a governed institution in comparison to more implicit group selection dynamics. However, our model shares some basic characteristics with [25], e.g., enforcement of cooperation becomes more costly with increasing group size, as we will outline in more detail. Where [25] investigates just one emerging group and the dynamics within group members and agents outside the group, we are able to investigate a whole number of institutions in a common spatial environment. This constraint is given by the methodology of dynamic evolutionary games in continuous time, building upon [26]. In the agent-based framework, time is mostly considered discrete and various interaction topologies can be implemented. Elsewhere, Smaldino and Lubell [27] show that a multi-agent approach may indeed help to investigate a diversity of solutions to social dilemmas. The authors investigate an “ecology of games”, where each game is analyzed with two different institutional mechanisms, capacity constraints and observation of behavior. The model we put forward implements the former institutional mechanism building upon a capacity constraint, i.e., in our case a diminishing leader influence based on distance (“leadership distance decrement”) since we work with an interaction topology (2D space with finite, small neighborhoods) that clearly contrasts our approach from the aforementioned ones.
Our model is based on Sanchez-Pages and Straub [28], who analytically investigate the emergence of institutions in a multi-stage one-shot game where homogeneous agents are pairwise matched to play a game of prisoner’s dilemma. Each of the two agents participating in the prisoner’s dilemma (PD) has the choice between the two actions of cooperation (C) and defection (D). Since the game is played simultaneously and communication is prohibited, a priori the two players are not aware of their respective opponent’s choice of action, therefore, starting in a Hobbesian state of nature. If both players cooperate, they both achieve a payoff of R (reward), if they both choose to defect, they both end up with a payoff of P (punishment). Finally, if one agent cooperates and the other defects, then the cooperator gets a payoff of S (sucker’s payoff) and the defector receives T (temptation). Payoffs therefore satisfy T > R > P > S and 2R > T + S. Which strategy is chosen depends on the exogenously given level of trust within the society in the model of Sanchez-Pages and Straub [28]. As agents have the same level of trust, they always choose the same strategy, thus, only the two symmetrical outcomes of mutual cooperation (C,C) and mutual defection (D,D) are can be realized. Every agent in our model on the other hand has an individual trust level, which evolves over time as a result of her past experiences, thus, all four possible outcomes are considered. However, in their static model agents have the option to establish an institution that enforces cooperation between its members. To this end, they must choose a leader whom they can delegate the work of enforcing cooperation. The leader may not participate in the PD game but it may set a fee that all agents willing to join the institution have to pay to at least cover his opportunity costs. Games between members of the institution always reach the cooperative outcome. Games between a member of the institution and an outsider, however, are not under institutional supervision and are treated like games in the state of nature. For convenience, Sanchez-Pages and Straub [28] label the former case (enforced cooperation) as “formal games” (i.e., game partners comply with the formalities/rules of the institution) and the latter, as well as games between two institution-less agents, as “informal games”. With this basic setup, the authors of [28] go on to analyze equilibrium solutions on the number of agents within the institution, optimal fees and threats of secession. While their approach is instructive with respect to a number of issues, it considers only the case of one institution versus no institution in a one-shot static game. We argue in favor of a dynamic approach to catch the subtleties of the emergence, life, and exit of such coalitions between individual agents. Furthermore, we are able to study the evolution of a whole society of agents and institutions over time and to analyze these societies using a kind of institutional demography. These are all aspects that are impossible to derive from the static game described above.
Since an analytical model of such a dynamic complex adaptive version would hardly be tractable mathematically, we resort to the method of ABM. In the model, the artificial world is represented by a two-dimensional grid on which the agents can move around freely. Borders are wrapped around so that the matrix topographically corresponds to a torus. If an agent happens to meet other agents within her von-Neumann-neighborhood she plays a game of PD with each of them. If a cluster of at least three agents exists, these agents may decide to become sedentary, choose a leader and build an institution. Members of institutions are able to leave the institution each time step and the leader of an institution is allowed to set a new fee in each period. In what follows, all steps are presented in detail.
2.1. Initialization
At the start of a simulation run, nA agents are distributed randomly across the grid. The random numbers are drawn from a pseudo-random number generator following a uniform distribution. Each agent is endowed with a memory of size κ. In this memory the agent cognitively stores the opponents’ choices of the last κ informal games. We define informal games as games played between (1) two agents who are not members of an institution; (2) an agent who is member of an institution and an agent who isn’t; or (3) two agents who are members of different institutions. In short, informal games are those games that are not supervised by the same leader. On the other hand, games played by two agents, who are members of the same institution, i.e., those games where the cooperative outcome is enforced, are labeled formal games.
We further define the share of cooperative actions stored in an agent’s memory as her personal value for α, in this respect it is not comparable to the institutional mechanism of reputation suggested by [27], since we do not track the reputation of n: n encounters. In contrast, we model the agent’s memory as personal perception of trust in the society based on past encounters independent from intersubjective reputation. If we assume, for instance, each agent to have a memory of the last ten informal encounters, i.e., κ = 10, then α = 0.6 is equivalent to the case that in any six out of the last ten informal encounters the agent’s opponents cooperated. The size of memory thus represents an assumption on the flexibility of an agent to adjust to new experiences. In this way, we endogenize the evolution of trust α according to those new experiences of an agent. If, for instance, an agent meets a lot of other agents who cooperate, her personal α, i.e., her trust in society, will rise and the agent will be more likely to cooperate in the future. Since we state that only informal games are memorized, we assume that enforced cooperation within an institution does not influence an agent’s personal level of trust in cooperation between strangers. Obviously, at the initialization of a simulation run, no games have been played and therefore no actions would be stored in the agents’ memories. We start with all agents having the same initial value of alpha at the start, which is a simulation parameter. With this starting value, we construct a random history of encounters for each agent, i.e., a hypothetical history of events that corresponds to the given value of her personal α0 at initialization. The histories are a list of encountered strategies, i.e., the strategies that opponents played during the last κ informal encounters and are stored as a string with length κ, where each character represents a past encounter (with “C” representing an encounter with a cooperating agent and “D” having faced a defecting agent). Each agent has only one such list for all informal encounters, which contains no information to identify former opponents. Though the two extreme exemplary histories “CCCCCCDDDD” and “DDDDCCCCCC” both represent the same α0 = 0.6 (60% remembered cooperative informal encounters), they still represent heterogeneous histories. In the first example another cooperative encounter would push out the oldest remembered encounter (i.e., the oldest memory would be forgotten) and change agent i’s memory to “CCCCCCCDDD” (αi = 0.7), whereas, in the latter case, it would change to “CDDDDCCCCC” (αi = 0.6). Note that, although these encounters are stored in the proper historical order, the agents do not have any information as to how much simulation time has passed since the individual encounter happened, i.e., the agents have an event based memory.
In contrast to the perfectly homogeneous agents in [28], the agents in our model are heterogeneous with regards to their location, their personal history and trust level within the simulated world. Though simulation time progresses in discrete intervals in our simulation, we employ full asynchronous updating with random ordering for our agents, which means that every agent performs all her actions in one go, before the next agent is activated. The consequences of all actions are effective immediately, e.g., informal games have an influence on the memory, and, thus, α, of encountered agents, whether they have already been active in this round or not. This is a much more realistic assumption than synchronous updating, which introduces game phases for specific agent’s actions during each round. The latter method was shown to be very problematic with some simulations by [29], who showed that some simulation outcomes could only be reached because the agents were activated in a specific static non-random order and were updated synchronously.
At the beginning of each time step, the activation order of every agent is shuffled randomly. Then, every agent is activated and takes all her actions before the next agent is activated. The following subsections describe the actions, which every agent may take during her round.
2.2. Movement
An agent who is currently not member of an institution, looks for an unoccupied site within her immediate von-Neumann-neighborhood (with a sight of one), randomly selects one of these and moves to its location if at least one such file exists. Thus, the agent can only move to a free location directly above, below, right, or left of his current location or not at all if all cells are currently occupied.
2.3. Playing the PD
Leaving institutions aside for a while, the next step lets the agent play a game of PD against each of her von-Neumann-neighbors in random order, i.e., up to a maximum of four games per round. In informal games, each agent plays a mixed strategy of cooperating with probability α and defecting with probability (1 − α). As stated above, the parameter α evolves endogenously for each agent. This setup stands in contrast to [28], who consider only cases of mutual cooperation or mutual defection, whereas our model allows for the cases of (D,C) and (C,D) as well.
Please note that, in contrast to [28], in our model, leaders are allowed to play PD games. The reason is that leaders can also have informal encounters and, thus, changes in their trust level (αi) during their time as leaders of an institution. It would be counterintuitive that only the leaders are isolated from this societal evolutionary learning process.
2.4. Building an Institution
A cluster of at least three agents connected through their von-Neumann-neighborhoods may decide whether to build an institution. This cluster is formed by all agents directly or indirectly connected to each other, who currently are not members of an existing institution, i.e., there is a path (unbroken chain) that traverses only members of the cluster, each of who is a von-Neumann neighbor of the former. An example for such a small cluster can be seen in Figure 1, which shows properly positioned neighbors (i.e., members of the cluster) in green and unreachable neighbors in red.
An institution warrants enforced cooperation between its members at the cost of a membership fee. The process of institution formation proceeds in four steps. (1) Each agent within the cluster calculates if it pays to participate in the future institution; (2) Each agent willing to join the institution proposes a fee she would collect from the members of the institution, in case that the agent would become leader; (3) The agent proposing the lowest fee is appointed as leader; (4) Each agent aside from the leader decides whether to effectively participate in the institution under the designated leader and her proposed fee. If after these four steps, a connected set of two members and the leader remains, i.e., at least three agents, then this connected set becomes a formal institution.
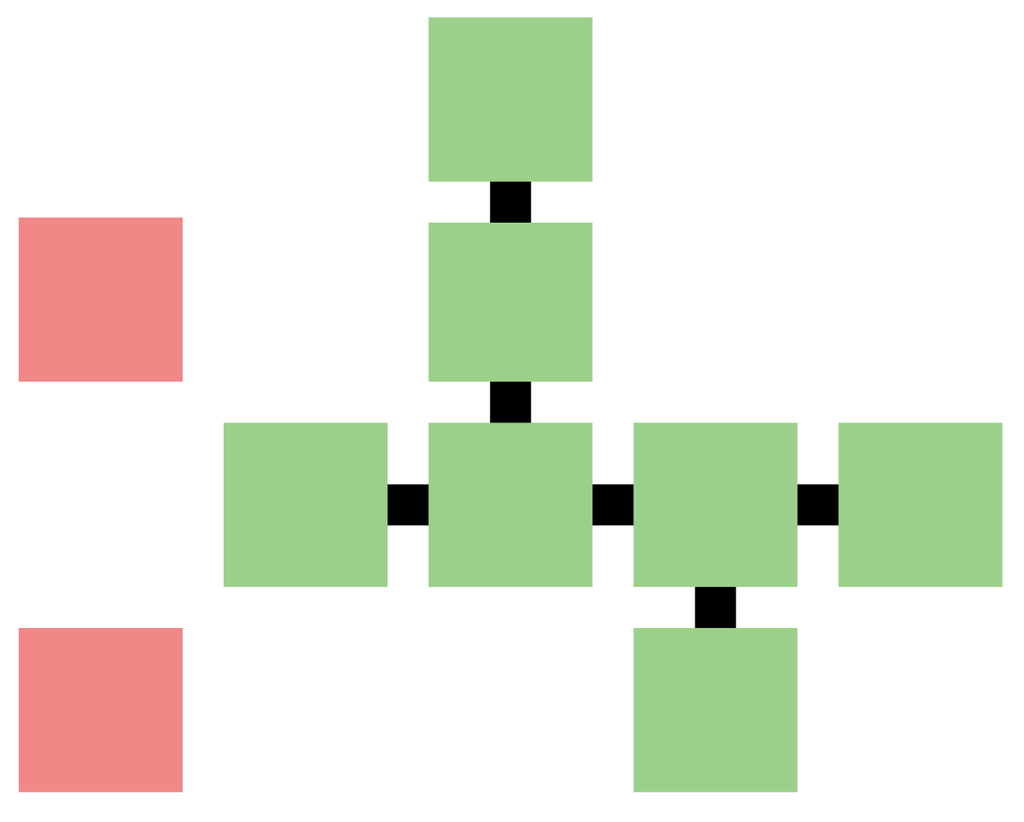
Figure 1.
Example of a small cluster of von-Neumann-neighbors.
2.4.1. Step 1: Decision of Participation
At first each of the agents in the cluster calculates if it pays to participate in the future institution by comparing her potential informal payoff with her potential formal payoff as a member of the institution. The agent assumes that her further encounters will be similar to previous ones, i.e., she expects to encounter the same mixed strategy that she herself currently employs. Thus the agent expects that she will encounter a cooperating agent with probability α and a defecting agent with probability (1 − α). She then sums up the four possible payoffs weighted by their expected probability to occur. This results in an expected potential profit of a single informal encounter of agent i with another agent as given in Equation (1).


With R, S, T and P being the individual payoffs of the prisoners dilemma game for the respective situations. Superscript I stands for informal profit expectation as compared to superscript F for formal profit (within an institution).
With regards to formal games, we assume the quality of enforcement of cooperation to decrease with agent i’s distance δi,L to the leader L. The distance to the leader is measured as the shortest path between the agent and the leader that traverses only members of the institution, each of who is a von-Neumann neighbor of the former. The payoff for a formal game is then given in Equation (2).


The parameter λ ϵ [0,1] is exogenously given and serves as a weight for the loss in quality of enforcement, i.e., a decrease of leadership effectivity with increasing distance (leadership distance decrement). Thus, a value of λ = 1/3 means that agents with a distance of at least three fields do not receive any payoff from formal games anymore, though, in the model at hand, it is only relevant at which distance the expected payoff of institutional cooperation drops below the expected payoff of informal games. Nevertheless, if only taking this decrease of effectivity into account, the above case would lead to a maximum von-Neumann distance of two fields from the leader, and a maximum institution size of 12 members and one leader. This can be seen on left hand side of Figure 2, which shows the von-Neumann distances from the leader in the center. It follows that smaller values of λ enable the emergence of much larger institutions. However, it is highly unlikely that institution size will ever come near to the theoretical maximum for that λ value as indicated before since the expected formal payoff is very low further away from the leader. Thus, the value of λ is more relevant for the question how much of the reward payoff remains on the cells near the leader, e.g., with a high value of λ even agents directly adjacent to the leader would gain very little or even too little payoff from formal games. The remaining share of the reward payoff, with respect to the distance from the leader (1 − λδi,L)—again for the example of λ = 1/3—can be seen on the right hand side of Figure 2 (2R/3 if 1 field away, R/3 if two fields away, 0 if three fields away, with 0 not being displayed).
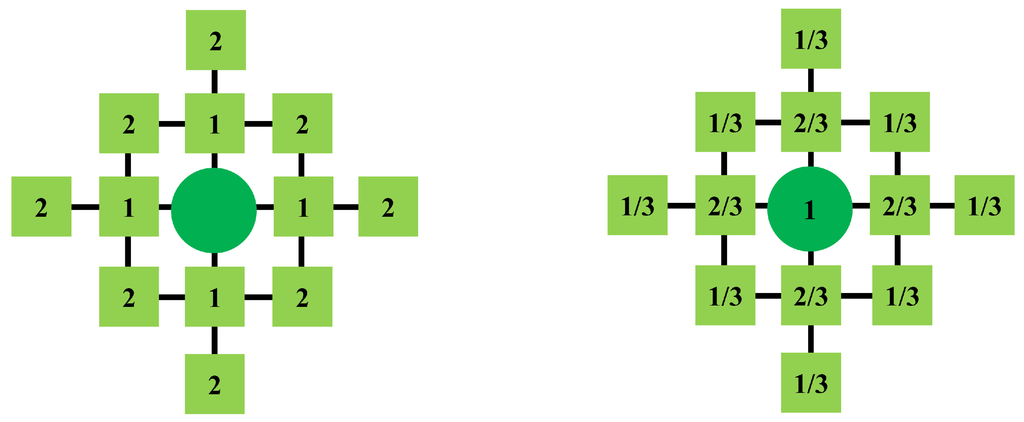
Figure 2.
Exemplary von-Neumann distances and remaining payoff in the case of λ = 1/3.
Since the agent might have multiple encounters per round, she tries to anticipate the number of formal and informal games she will play actively and passively2 in the next round. We assume that the agent takes all available local information into account when calculating her expected payoff. The expectation for the overall payoff in non-member state is then formulated in Equation (3).


With n representing the number of local neighbors, i.e., the current number of agents occupying adjacent fields.
The expectation for overall payoff in the member state on the other hand is then given in Equation (4)


With φ being the fee that will be charged by the leader to-be and m representing the number of those local neighbors that will almost definitely lead to informal games—against agents that currently are in another, already existing institution. Thus, (n − m) is the optimistically expected number of future co-members of the institution to-be, i.e., the current number of non-members in their von-Neumann neighborhood.
Since the institution has not come into existence yet, and no leader has been chosen, the distance to the leader is not yet defined. Thus, for the first estimates of  and
and  each agent assumes that
  = 0, i.e., that she might be appointed leader. This estimate will be corrected and decisions will be reevaluated as soon as a potential leader was selected, before the institution is formed, i.e., wrong estimates will not have a huge effect.
 and
and  each agent assumes that
  = 0, i.e., that she might be appointed leader. This estimate will be corrected and decisions will be reevaluated as soon as a potential leader was selected, before the institution is formed, i.e., wrong estimates will not have a huge effect.
The initial fee φ for this first evaluation of  is again based on the assumption that the agent herself might be leader, and will also be proposed to the other agents in a later Step (2.4.2). We assume that an agent estimates her fee proposal according to the sum of collected fees equaling the cost of being the leader, i.e., we assume that leaders do not factor in a profit margin. The cost of enforcing cooperation is then given in Equation (5).

 is again based on the assumption that the agent herself might be leader, and will also be proposed to the other agents in a later Step (2.4.2). We assume that an agent estimates her fee proposal according to the sum of collected fees equaling the cost of being the leader, i.e., we assume that leaders do not factor in a profit margin. The cost of enforcing cooperation is then given in Equation (5).

Equation (5), thus, denotes the cost accruing to the leader from enforcing cooperation and s is the size of the institution, i.e., the number of members including the leader. Furthermore, δ represents the average distance of the leader (i.e., herself) to all members of the institution. Obviously, the chosen cost function is just one of many possible alternatives, but it serves as a first reasonable and parsimonious approach. Future research may well investigate the effects of different cost functions.
The initial fee φ for this first evaluation of  is then given in Equation (6).

 is then given in Equation (6).

We assume that the leader agent herself does not need to pay the fee, thus, the costs are divided by the number of members without the leader (s − 1). Since, at this moment, it is not yet clear to the agents how large the institution will, in fact, be (since potential members-to-be will be allowed not to join, once the potential leader is known), they use the size of the cluster they are part of as an estimate.
Each agent in the cluster evaluates the benefits of participating in the institution now and compares her expected non-member state payoff  with her expected member-state payoff
  . Only if the latter exceeds or equals the former, the agent is willing to participate in the institution. If all agents in the cluster come to the conclusion that they will be better off as members of the institution the formation of the institution proceeds to the next evaluation steps—else the institution will not be evaluated any further. Due to the completely asynchronous nature of the simulation, another agent might again start the evaluation of the same—or a slightly changed—cluster within the same time step.
 with her expected member-state payoff
  . Only if the latter exceeds or equals the former, the agent is willing to participate in the institution. If all agents in the cluster come to the conclusion that they will be better off as members of the institution the formation of the institution proceeds to the next evaluation steps—else the institution will not be evaluated any further. Due to the completely asynchronous nature of the simulation, another agent might again start the evaluation of the same—or a slightly changed—cluster within the same time step.
2.4.2. Step 2: Proposing a Fee
During Step 2, each agent willing to participate in the institution proposes the fee that she would collect from members, which has already been calculated in the evaluation Step of 2.4.1., as given in Equation (6).
2.4.3. Step 3: Appointing a Leader
Next, the agent proposing the lowest fee is appointed as the leader of the potential institution to-be. If more than one leader proposes the lowest fee, one of them is appointed randomly.
2.4.4. Step 4: Final Evaluation
Finally, each agent in the cluster recalculates the distance to the leader to-be and reevaluates her expected payoffs. If the situation changed and her expected member-state payoff is no longer higher or equal to her expected non-member state payoff, she chooses not to join the potential institution. This procedure serves as a preliminary proxy for future implementations with more complex evaluation procedures, such as voting. Any agent that is disconnected/isolated from the cluster, due to other agents leaving the cluster, will also not be part of the institution to keep institutional territory contiguous. Only if after this final evaluation a connected set of at least three agents (including the leader) remains, an institution emerges. All agents participating in an institution become sedentary and remain so until they eventually leave the institution or the latter breaks apart. Every agent may only leave, join, or found an institution once per round, which is evaluated in the given order.
2.5. Joining an Already Existing Institution
If an agent is located in the von-Neumann neighborhood of a member of an institution after moving, the former may choose to join the institution as well. Again, this agent compares her non-member-state payoff with her hypothetical payoff from joining the institution, based on actual distance to the leader and future size of the institution. If the member-state payoff is higher than or equal to the non-member-state payoff, the agent joins the institution.
2.6. Leaving an Institution (Re-Evaluating Membership)
In each time step, every member of an institution re-evaluates her gains from participation in the institution. If due to changed circumstances (e.g., changed neighborhood or individual trust), her member-state payoff no longer exceeds or at least equals her non-member-state payoff, the agent chooses to leave the institution. All members not connected to the leader anymore are forced to leave the institution as well. If the size of an institution falls beneath three, it ceases to exist.
2.7. Re-Evaluating the Fee
In every period, each leader of an institution re-evaluates the fee she collects from the members of the institution. If the sum of fees collected in the previous period is smaller than the cost accrued to it for enforcing cooperation, the leader would suffer a loss. In this case, she raises the fee such that the collected fees would equal the cost in the current period.
Since we employ strict asynchronous updating, each agent may actively initiate one attempt to found a new institution during his turn. If such an attempt results in the foundation of an institution during one agent’s turn, it is founded effective immediately for all agents that finally participated. Agents who are activated after they passively participated in the founding of an institution can only play the PD during his turn, because agents may only participate in one institutional activity per time step, i.e., founding, joining, leaving—evaluation alone is not considered an institutional activity for this purpose.
3. Simulation Experiments, Data Analysis and Results
In this section we illustrate the data analysis of simulation experiments and show the main results of the model. Simulations were performed with a payoff matrix for the pairwise prisoner dilemma that is in line with the non-degeneracy condition according to [1] 3. The initial parameters for our experiments comprise settings given in Table 1. The memory size of agents (their cognitive endowment) smoothes the level of societal trust within simulation runs and works as a behavioral inertia therefore. Particularly a higher memory size leads to fewer fluctuations in societal trust, since agents play in a more consistent way. In this respect more agents are committed to a common average societal trust. Adjustments in low memory sizes have a strong effect, whereas adjustments in high memory sizes have weaker effects; e.g., changing the memory size from 80 to 100 encounters does have a weaker effect than changing it from 10 to 20 (especially since very low numbers of remembered encounters could theoretically even result in a completely new set of memories within a single simulation step). This result is quite intuitive, for that reason the memory size is not used as an additional variable for permutations in the following analysis.

Table 1.
Initial parameters for simulation experiments.
| World and Population | Prisoner Dilemma | ||
|---|---|---|---|
| Worldsize (cells) | 50 × 50 | PD “punishment | 2 |
| Population density | 25% | PD “sucker’s payoff” | 0 |
| Agents | 625 | PD “reward” | 4 |
| Agent memory | 20 | PD “temptation” | 5 |
The motivation of the analysis put forward is to get a deeper understanding of the generic logic of institution demography, the interdependent effects of individual strategic action, societal trust and institutional accumulation. The following two initial parameters are crucial for this investigation: the initial level of societal trust (α0) and leadership distance decrement (λ). Correspondingly, we kept parameters given in Table 1 constant and computed simulation runs around couples of initial α0 and λ with varying permutations, see Table 2.
As elaborated in Section 2, the initial level of alpha (α0) fixes the starting distribution of individual cooperation and defection of agents. Otherwise the leadership distance decrement (λ) constrains the size of institutions during simulation runs. The two parameters serve as proxies for the dynamics of institutional life-cycles in the model. Experiments have indicated that the simulation may eventually reach a final state, either with static institutions (i.e., complete cessation of institutional change) or without any institutions (only informal encounters). In order to analyze the dynamics in between these two states with more detail we could limit the parameter space due to experiences with former experiments and induce permutations of initial societal trust with a lower level of α0 = 0.2 for more stable institutional settings. These simulations, experiments 1–3 (Table 2), are varied with λ = 0.15; λ = 0.2 and λ = 0.25. Low leadership distance decrements result into a gain of power in the periphery of an institution (i.e., a higher remaining profit in the periphery) and therefore lead to larger institutions. In such settings the simulation almost instantaneously tends to converge to a static institutional scenario. Higher λ leads to smaller institutions which are not stable over time, simply because the maintenance costs do not pay off anymore. This lead us to the expectation that simulation experiments 4–6 would deliver the most exciting results in terms of a complex evolution (between order and chaos). The simulation experiments 7–9 have been initialized with α0 = 0.4 (that means a very high initial level of trust), where participation in an institution is not tempting.

Table 2.
Simulation experiments with permutations of α0 and λ.
| Simulation Experiment | Initial Alpha (α0) | Leadership Distance Decrement (λ) |
|---|---|---|
| 1 | 0.2 | 0.15 |
| 2 | 0.2 | 0.20 |
| 3 | 0.2 | 0.25 |
| 4 | 0.3 | 0.15 |
| 5 | 0.3 | 0.20 |
| 6 | 0.3 | 0.25 |
| 7 | 0.4 | 0.15 |
| 8 | 0.4 | 0.20 |
| 9 | 0.4 | 0.25 |
We have looked into the evolution of some crucial variables with 20 replications (with randomly generated seeds) for each simulation experiment running over 10,000 rounds/periods, resulting in 9 × 20 datasets. Preliminary experimentation has shown that the institutional landscape may stabilize after approximately 5000 simulation periods, to this end we decided to gather an overview for the long run and have doubled this crucial time horizon. For every dataset we have created aggregated measures for the evolution of the following variables: mean societal trust, mean share of non-members in the population, mean number of institutions, mean age of institutions, and heterogeneity within the age structure of institutions. At first we are interested in the evolution of societal trust.
3.1. Societal Trust
Societal trust (the average share of cooperative actions within the whole population) may theoretically converge towards α = 1 (full cooperation). Otherwise α = 0 (full defection) never occurs, because agents will always take refuge in institutions once the amount of defectors increases in the population. The evolution of societal trust depends on the initial values of trust (α0) and leadership distance decrement (λ). In general, the higher α0 the higher is the level of societal trust during a run, since the initial memory of cooperation has a strong path-dependent effect and agents are not likely to build institutions respectively. Figure 3 shows the evolution of societal trust (α) for all nine simulation experiments, where (a) summarizes the permutations of λ for α0 = 0.2, (b) the permutations for α0 = 0.3 and finally (c) for α0 = 0.4. On the left hand side of Figure 3 we see graphs showing the evolution of the means over 20 replications and on the right hand side we see the standard deviations for these means accordingly. The data confirms that a higher initial value of societal trust leads also to higher values during the simulation when we compare Figure 3a–c. In a very similar manner a higher initial level of societal trust makes the evolution of trust more robust, as a comparison of the standard deviations in Figure 3a–c shows. However, the cause of this effect lies in the instability of institutions. Institutions are instable only if cooperation is high within the population, because they are not tempting enough for agents to join (expected payoffs of non-member state exceed expected payoff of member state, as given, e.g., in the simulation experiments in Figure 3c. A high level of societal trust with a given memory size of κ = 20 encounters indicates a stable and robust process. Otherwise, Figure 3a shows, that if agents defect, more due to a low initial level of societal trust, they take refuge in institutions (enforcing them to cooperate) in early phases of the simulation.
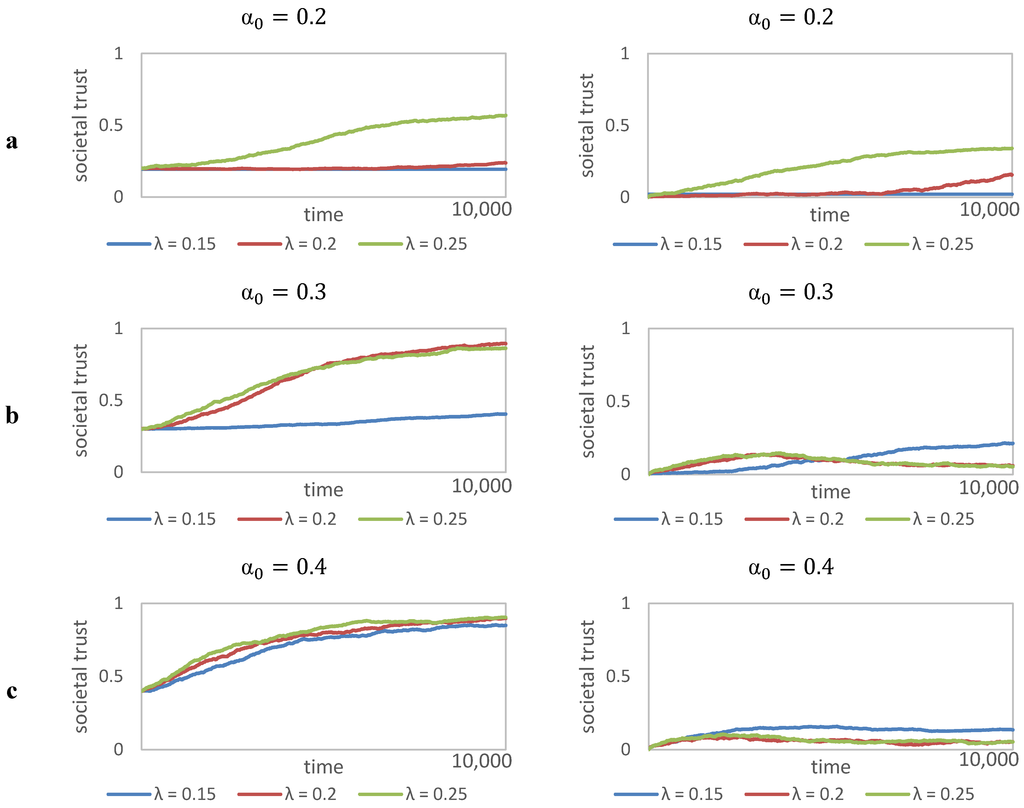
Figure 3.
Evolution of societal trust (α).
Taking a closer look lets us follow that a lower λ leads in general to lower levels of societal trust within the simulation experiments. In Figure 3a,b the lowest level of societal trust is given in the cases of λ = 0.15, wherelse λ = 0.25 leads to the highest levels of societal trust in all permutations. Of course this relation corresponds with the basic model setup as indicated in Section 3.2: lower λ results in larger institutions (smaller loss of power dependent on the distance between member and leader). Due to the spatial interaction topology (i.e., locality effects), it is more likely that agents become members thereafter. In the very long run, high α0 leads to processes where societal trust tends to converge to full cooperation.
3.2. Evolution of the Population Structure
The next variable we investigate concerns the evolution of population structure, with regards to membership in institutions. Figure 4 shows the average share of non-members in the population across the conducted simulation experiments. It indicates that the population structure is quite stable over time, as the standard deviations show in Figure 4a–c. If leaders have greater influence in the periphery of institutions (low λ) then the amount of non-members playing with randomly encountered agents settles on a low level correspondingly.
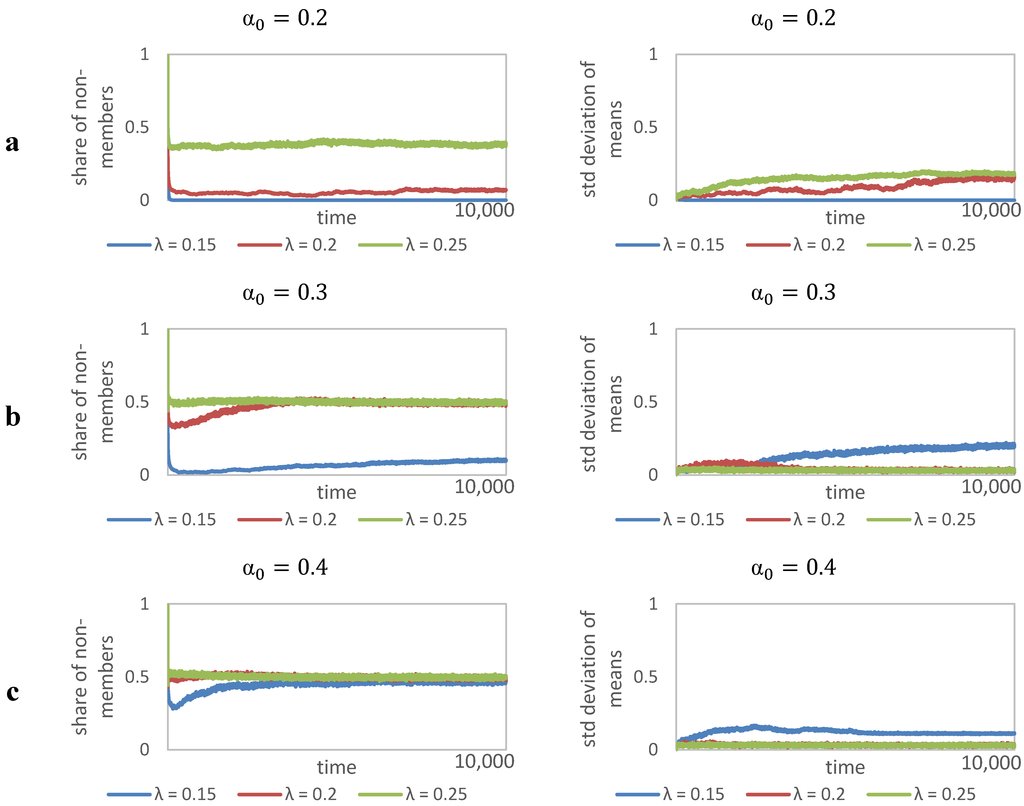
Figure 4.
Share of non-members in the population.
Furthermore, we have checked for the robustness of this result by looking into the average number of institutions respectively, as illustrated in Figure 5. Since the number of institutions further stabilizes after an adaptation phase of 2000–3000 periods (also visible in Figure 4) we can conclude that there is a direct relationship between leadership distance decrement (λ) and the amount of institutions indeed as expected. Figure 5a–c show that permutations with λ = 0.25 result into 80 institutions, although this number deviates between 0–30 dependent on α0. Otherwise lower λ is more sensitive to the initial level of societal trust (α0). This analysis further indicates that interesting cases of permutations are appearing around α0 = 0.3 and λ = 0.2. These cases have to get investigated in more detail by looking into the mean age of institutions.
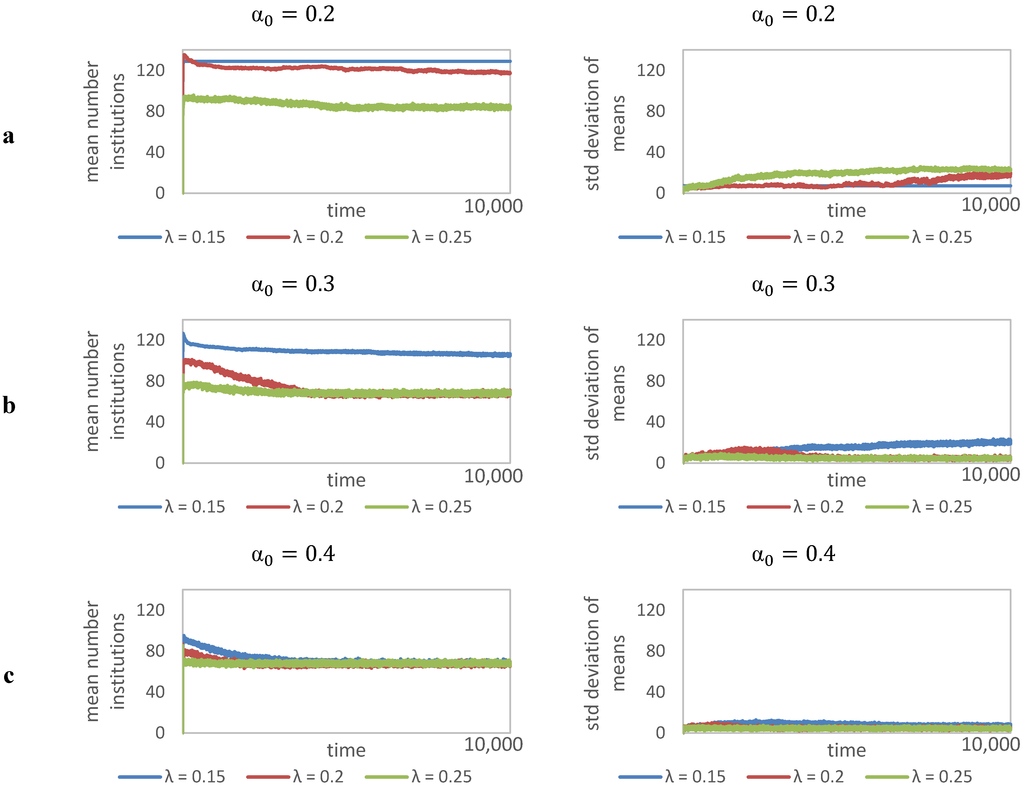
Figure 5.
Number of institutions.
3.3. Institutional Life-Cycles
Since the population structure is rather stable, we have anticipated that the dynamics are more volatile in the evolution of institutions, dealing with entry, (in)stability and exit of institutions. Figure 6 shows the spectrum of institutional life cycles in a grand comparison of all computed permutations in simulation experiments 1–9. Accordingly, we have derived a deeper analysis on the mean age of institutions, in particular the accumulation process dependent on individual action and social structure. This full picture illustrates that our model produces two main results concerning the demography of institutions. On the one hand, institutions accumulate quickly from start due to a high number of free-riders in the initial population. Thereby, agents take refuge in governed institutional structures under leader supervision preventing exploitation in non-member state. Simulation experiments 1 and 2 result into this finite state of the simulation, where institutions do not fall apart anymore, i.e., their life-time is infinite. We call this result a static and ordered scenario of institutional change. On the other hand, simulation experiments 8 and 9 indicate that institutions cannot stabilize, because their leaders are not able to influence the periphery of their institutions effectively, thereby, the sum of collected membership fees remains too small for long maintenance of larger institutions, or ultimately any institution at all. In this case institutions have a very short life-time, they “pop up” very frequently in pulses. This final state of institutional change delivers the second main result in the “in silico” analysis of the model. We call this result a dynamic but highly fluctuating scenario of institutional change.
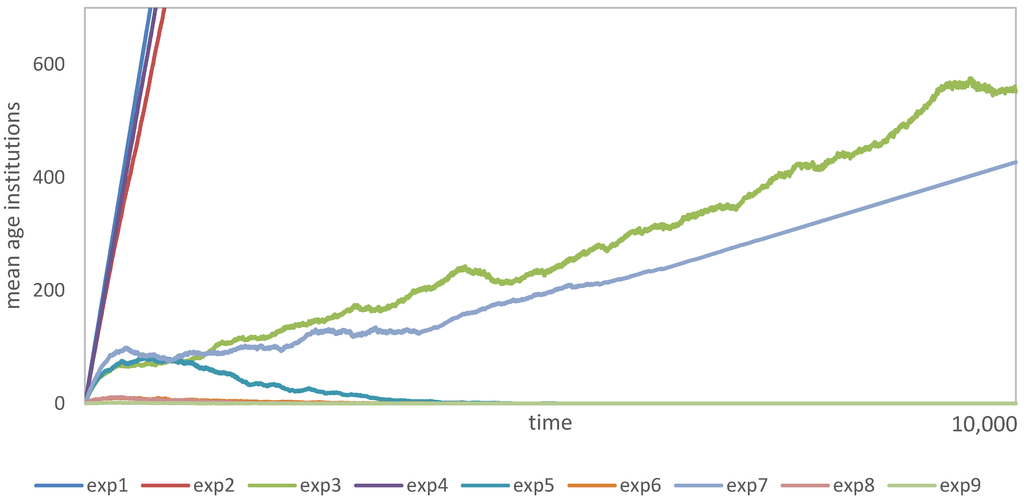
Figure 6.
Mean age of institutions—Full picture long run.
However, we further identify a third result characterized by a more complex behavior. This result is best illustrated via the system behavior of simulation experiments 3, 5, 6, and 7. We call this result a dynamic and complex scenario of institutional change. Here, institutions cycle over a long period of time where it is undecidable to which state they may converge. Simulation experiments 5 and 7 converge to the highly fluctuating (almost chaotic) state of institutional change. We dub this process institutional learning, since the early advancing life-time of institutions experiences a turning point, where societal trust reaches significant levels that agents are tempted to get rid of social structures and switch to non-member status. Institutions in this model support social learning, which will be described in more detail at the end of this section. Otherwise, experiments 3 and 5 tend to develop towards the static and ordered scenario of institutional change, although with continuous fluctuations in the mean age of institutions. In order to confirm these results we provide an exploded view of this picture in Figure 7 and discuss some more details. Figure 7a–c highlight these results by showing just the medium run where the diversity within the mean institutional age becomes better visible.
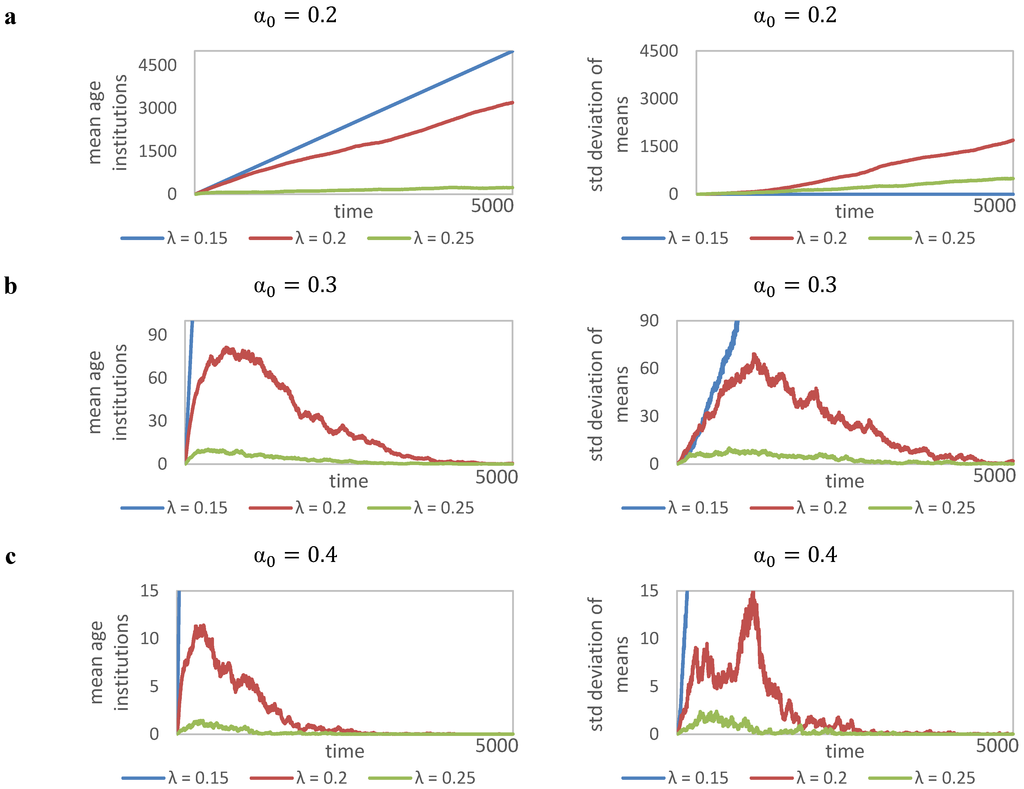
Figure 7.
Mean age of institutions—Exploded view medium run.
The most interesting cases of institutional learning are given in Figure 7b,c with λ = 0.2. The standard deviations indicate that these processes are not as deterministic as it seems in comparison to those with lower or higher leadership distance decrement. In this generic model of institutional change institutions may act as learning vehicles even with higher values of initial societal trust. The diversity within the age structure of institutions is high in these cases fluctuating between 10 and 100 periods. A closer view on the heterogeneity of institutional life-cycles among institutions within each time step (Figure 8) confirms this finding.
We observe that the higher the initial level of societal trust, the lower the heterogeneity within the age structure. Thus different values of λ may lead to phase-transitions towards another scenario. To conclude we want to turn the attention to the similarity in the trend of the aforementioned processes, which is not recognizable from the aggregated measures shown previously. Figure 9 gives the overall trend of replications within simulation experiment 5. It shows that institutions change indeed in cyclical processes, what we have dubbed institutional learning. The accumulation of these generic governed structures follows a similar trend, the cyclical behavior is of course leveled out in the aggregated views we have shown previously.
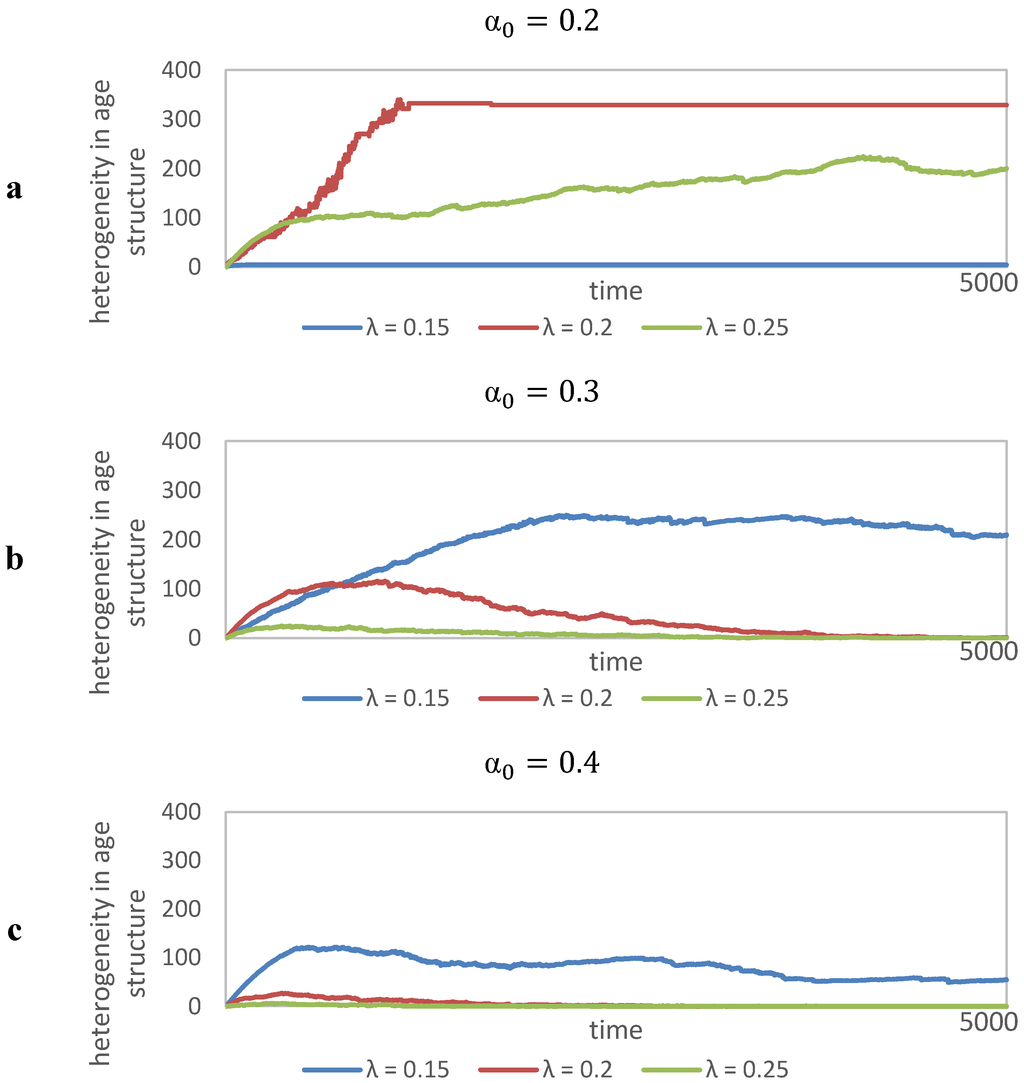
Figure 8.
Mean age of institutions—Heterogeneity within the age structure of institutions.

Figure 9.
Similarity in trend for α0 = 0.3 and λ = 0.2 over replications.
The diversity within institutional change that our model produces is a distinct feature that becomes evident only in a heterogeneous multi-agent configuration. The two main results indicate the deterministic corner solutions that can also be derived from a closed form equation-based game-theoretical model in continuous time, but an analysis of the complexity between these deterministic solutions is out of range in this type of models. In this respect the discovery of institutional learning makes our study distinct in this realm of game-theoretical inspired evolutionary institutional economics and political economy. Again it is the interdependent interplay between agency and structure in space and time, which delivers such insights. The complex adaptive system dynamics in our model open a spectrum of potential institutional life-cycles over time. A crucial feature given by the model concerns the cognitive capabilities of agents, their potential to learn adaptively from the past and reevaluate their membership status in particular. Learning is, here, considered not just as a temporal processes, as mostly conceived in population games, but is severely dependent on the dynamically changing spatial distribution of agents, because institutions emerge and exit on certain places in the artificial political economy. Their bounded rationality in terms of [30] develops due to spatiotemporal adaptation (a mesoeconomic process), thereby depending on the complex evolution of the system as a whole but also on their institutional subsystems [31]. This finding is still in line with the socio-cybernetic theory of institutional change by Veblen, advanced by the means of evolutionary and complexity theory. Such a transdisciplinary approach to political economy may further stimulate novel modes of teaching in economics, see [32]. However it’s these properties that are responsible for the likely volatile system dynamics, but they are also the major contributors to more noise and more complicated data analysis. Since the analysis of contingent path-dependent processes and emerging structures lies at the heart of evolutionary institutional economics and political economy, people are aware that results and moreover interpretations are never unambiguous.
However, we are able to conclude some major dependencies and dynamics in our model of institutional change. The evolution of societal trust is the major driving force behind the building up of institutions. If trust runs high on average, the need for institutions as we designed them decreases, because agents don’t need executive protection. Consequently, this logic also works in the opposite direction, if trust runs low, agents demand institutions, and the absolute number of them will increase. Although this observation seems trivial it has some crucial ramifications dealing with the frequency of emergence and exit, i.e., institutional change in cyclical patterns. These dynamics are majorly dependent on the initial values of exogenous variables, like the initial level of trust and the leadership distance decrement. As our experiments have shown, this parameter space determines the different paths and processes of institutional change. According to them we can identify three scenarios of institutional change generated by the computational simulation of our artificial political economy. Interestingly, our three scenarios share some generic characteristics of the results given by the complex system analysis in [33]. Stuart Kauffman has shown that in ordered regimes the elements freeze very fast and form a bigger cluster, which spans across the system. In the chaotic regime there is no frozen component; instead, a connected cluster of unfrozen elements appears. Small changes in the initial parameters may lead to strong reactions of the whole system. Transitions from the ordered to the chaotic state are possible through phase transitions, where the transition region is called a complex regime. In this regime frozen and unfrozen elements are percolating simultaneously with very sensitive conditions on the complex edge between chaos and order. The three scenarios found in our experiments are correspondingly called:
- static and ordered scenario of institutional change
- ➔
- a non-cooperative world indicated by simulation experiments 1 and 2
- dynamic but highly fluctuating scenario of institutional change
- ➔
- a cooperative world indicated by simulation experiments 8 and 9
- dynamic and complex scenario of institutional change
- ➔
- complex institutional learning indicated by simulation experiments 3, 5, 6, and 7
To give a more vivid and intuitive understanding of the different cases compare Figure 10, Figure 11, Figure 12 and Figure 13, which visualize the artificial landscape of exemplary runs of experiments 1, 3, and 9. The subfigures show snapshots of the landscape of agents and institution in different points of time—please note that there are different timespans between subfigures in Figure 10, Figure 11, Figure 12 and Figure 13, since the different classes have gravely varying convergence speeds. The subfigures show non-member agents, who have not yet been member of any institution depicted as blue squares and non-member agents who have already been in an institution before depicted as red squares. Furthermore, green circles depict leaders and green squares depict members of institutions, with black connections between members of the same institution. The darkness of institutional leaders and members indicates the age of the institution—i.e., light green reflects a young institution, where dark green depicts a relatively old institution. Figure 11 and Figure 13 additionally show pink (light red) squares and circles, which indicate agents in attempted institutions, i.e., institutions that only existed for one evaluation period (technically these have an institution age of 0). These come into existence when the overall level of α is very high and no stable institutions exist anymore and are disbanded immediately. When taking a look at the following figures, please keep in mind that we interpret the grid as a torus; it might look like there are one or two-person institutions at the edges of the landscape, but in truth they continue on the opposing edge of the landscape.
Figure 10, now, is an the visualization of the landscape of an exemplary run of experiment 1 (λ = 0.15, α0 = 0.2, other parameters as given in Table 1) and shows what we called a static and ordered scenario of institutional change. The first subpicture on the left hand side shows that after a very short time (at t = 10) most agents already are members of institutions, with a number of agents still wandering around. The next subpictures show that very quickly (at t = 50) most of the agents are now members of institutions, that most institutions are already relatively old and stable, with only very few agents still wandering around. Shortly after (at t = 250) all agents are members of institutions, which are completely stable (old). The society is now ordered, in the sense that there is only cooperation enforced in institutions and static since there are no elements of change anymore, i.e., the landscape is identical for all following time steps. Since this lock-in happened so fast, there was almost no change in the societal trust level—a graph of the development of societal trust over time would show a flat line.
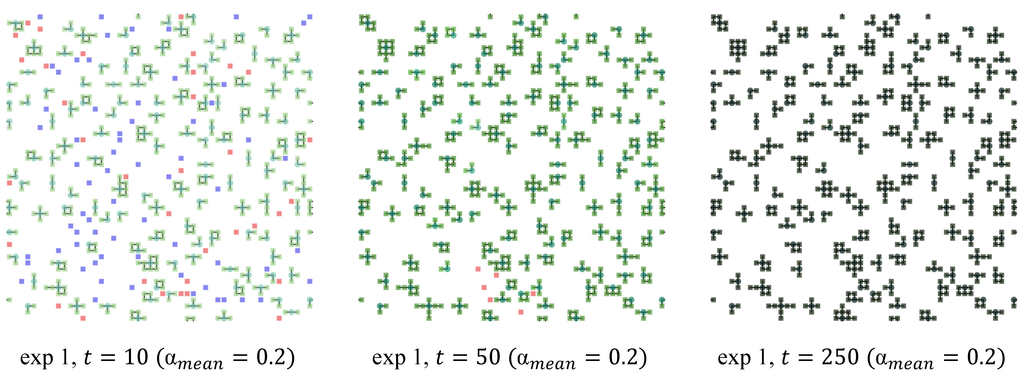
Figure 10.
Institutional landscape of an exemplary simulation run (λ = 0.15, α0 = 0.2).
Figure 11 now shows the visualization of the landscape of an exemplary run of experiment 9 (λ = 0.25, α0 = 0.4, other parameters as given in Table 1) and shows what we called a dynamic but highly fluctuating scenario of institutional change. The first subpicture on the left hand side shows that after a very short time (at t = 10) most agents have already been members in very shortly lived institutions, with only a very small number of institutions (in this example only 1), because the initial level of societal trust was very high to begin with. The next subpicture shows that in the short run a small number of institutions emerged (t = 250). This was the result of an already highly heterogeneous distribution of α, which lead to agents with lower α to still seek shelter in institutions—during this process, societal trust even went down a little. Nevertheless, the system quickly returns to converge against full cooperation, while institutions have not needed anymore for a long time due to the already high level of trust.
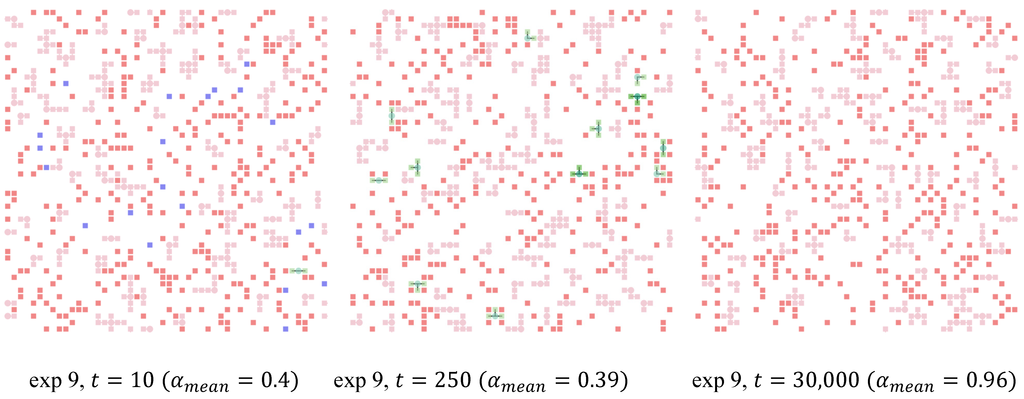
Figure 11.
Institutional landscape of an exemplary simulation run (λ = 0.25, α0 = 0.4).
Figure 12 shows the development of societal trust over time of the same exemplary simulation run, which was depicted in Figure 11. As can be seen, societal trust rises rather quickly, while the process of reaching full cooperation can take quite long in singular runs. There is almost no difference between member and non-member agents in terms of average trust, since there are only few, short-lived institutions early on, i.e., agents are non-members almost all of the time.
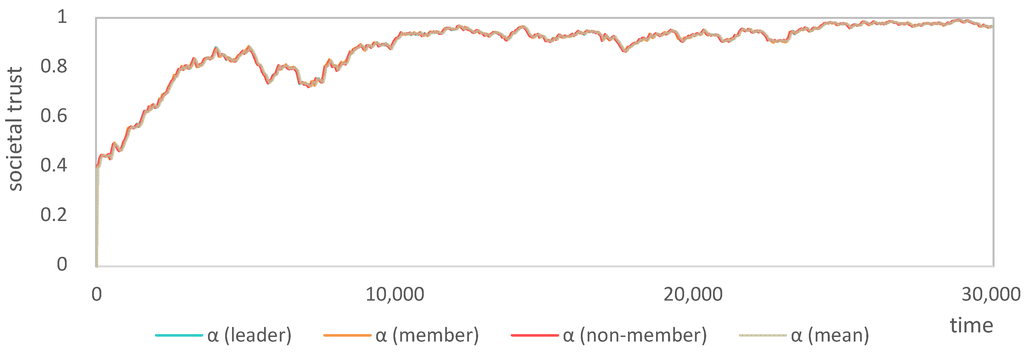
Figure 12.
Societal trust timeline of an exemplary simulation run (λ = 0.25, α0 = 0.4).
Figure 13 now shows the visualization of the landscape of an exemplary run of experiment 3 (λ = 0.25, α0 = 0.2, other parameters as given in Table 1) and shows what we called a dynamic and complex scenario of institutional change. The first subpicture on the left hand side shows that after a very short time (at t = 10) a number or institutions already exist, with the majority of agents not being members of institutions. The next subpicture (t = 250) shows that a number of institutions have existed for some time, while there also are some quite young institutions, as well as a number of non-member agents. The following subpictures show that the number of institutions rose, since in this particular simulation run societal trust went down to quite low levels (at t = 2500). Nevertheless, in the medium run, as depicted in the following subpictures (t = 10,000 to t = 15,000), overall trust rose again, thus requiring less institutions and in the long run (at t = 35,000) the artificial society arrived at full cooperation again.
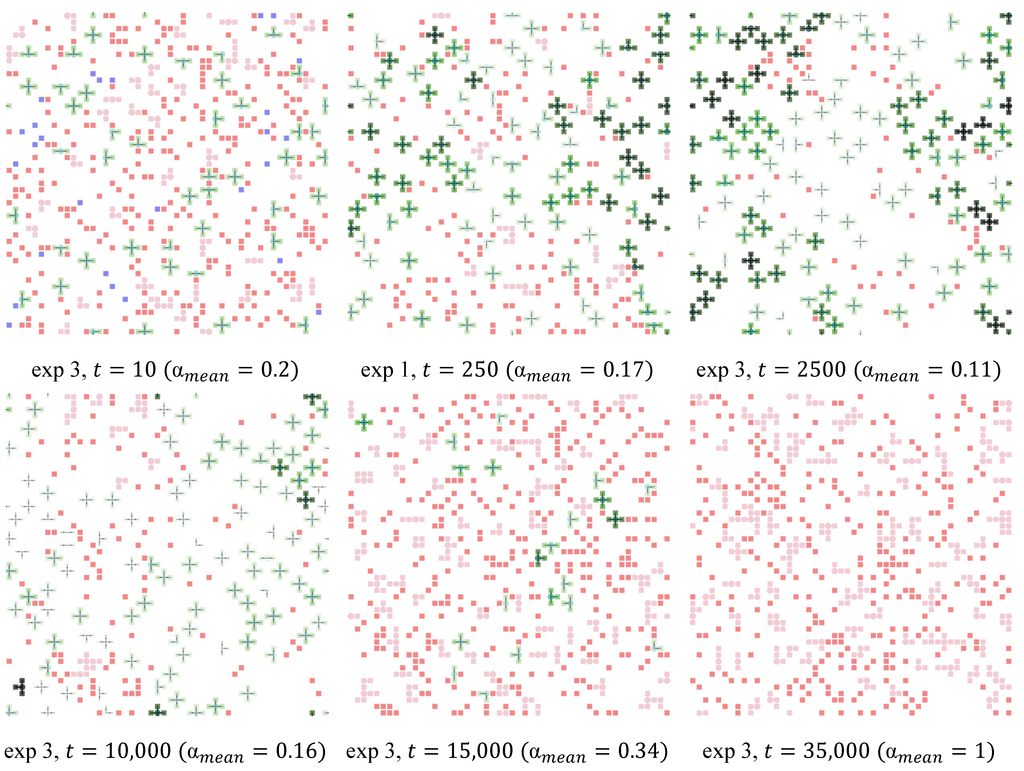
Figure 13.
Institutional landscape of an exemplary simulation run (λ = 0.25, α0 = 0.2).
Figure 14 now shows the development of societal trust over time of the same exemplary simulation run, as depicted in Figure 13. As can clearly be seen initially α increases and decreases again, which is then followed by a kick-in of the self-reinforcing process. In the long run, societal trust rises until full cooperation is reached.
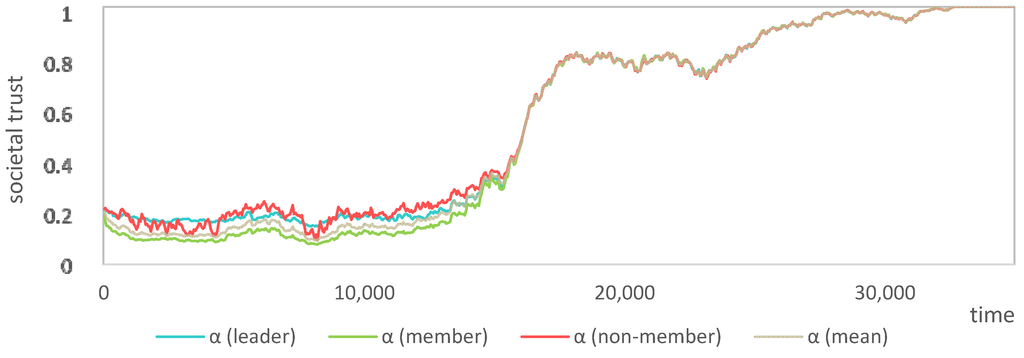
Figure 14.
Societal trust timeline of the exemplary simulation run (λ = 0.25, α0 = 0.2).
In summary institutions in our model indirectly support social learning. Those agents with a low α are more likely to join institutions and thus become sedentary—compare Figure 14, where it can be seen that the average α of non-member is consistently higher than that of members (in the timeframe in which institutions are needed). In case of larger institutions a number of these low α agents are even out of reach of non-members or members of other institutions, as the former are embedded deep within the institution’s realm. Thus, these agents on average play fewer or even no informal games at all, during their membership in the institution. Non-member agents with a higher α stay mobile and then have a higher chance to encounter other agents, which also have a higher α. Thus they learn to cooperate even more over time, eventually increasing overall trust over time. These agents then function as “emissaries” of cooperation, slowly increasing the trust of agents situated on the outskirts of institutions (“teaching” them to cooperate). Since these are further away from their leader, their expected formal payoff can be quite low—depending on the λ parameter, which leads to larger institutions, but lower formal payoff. Thus, they can be quite sensitive to changes in cooperative behavior shown by informal games with wandering non-member agents and start to leave institutions quickly.
This notion seems to be quite intuitive since in the early phases agents tend to take refuge in institutions, because trust is very low, then trust rises and then the system experiences a crucial transition, because life outside of the institution promises higher short-term payoffs on average and agents start to cooperate even more, but without institutions. Since a personal α > 0.5 means that the agent will cooperate more often than defect, and thus rather cause “positive” than “negative” memories in other agents. “Positive” memories lead to more cooperative behavior in other agents, which reinforces itself and, in the very long run, defection is crowded out and the society arrives at full cooperation, which is then stable.
On the other hand this scenario may also converge to a static state of frozen institutions quite quickly. This is the case when cooperation without institutions takes too high costs in the long run, or when defection is still beneficial. It is also likely to occur when setting the memory parameter (κ) to a small value, with the result that the wandering agents (what we called “emissaries” before) learn non-cooperative behavior through playing with members of institutions, while the level of α is still low. This can also lower the emissary’s α to such a degree that he himself wishes to join the institution, because he now feels “safer” as a member of the institution. Consequently societal trust may converge to a constant level, once all agents have founded or attached to an institution. However the dynamic attractors for a transition in the one or the other direction are sensitively depending on certain permutations of initial societal trust and leader influence in the periphery.
4. Conclusions
In our paper we have presented an agent-based model connecting the theory of games with institutional economics via socioeconomic computational simulations, thereby providing new insights for evolutionary institutional economics and political economy. We follow the core concept of the old institutional economics, where institutions are conceived as real social structures. The Veblenian idea of institutional change via cumulative causation of habits of thought serves as the dominant proxy for this emerging field of socioeconomic research. Obviously a synthetic translation of this concept into a concrete model and its subsequent simulation rigorously cuts components of its original semantic narrative. However, our findings indicate that even an approximate, at best sufficient, simulation of this kind of institutional economics demands a transdisciplinary approach by a formal combination of evolutionary game theory and complex systems theory. Such an endeavor can be realized via the use of computational methods and simulations of heterogeneous multi-agent systems in discrete time. A modern conception of complexity as composed by Wimsatt [34] may serve as a theoretical blueprint respectively, because he advances the Simonian [31] notion of reductionist heuristics as means to more holistic theories, in contrast to linear additive methods of total aggregation he refers to decomposition. This basic argument favors a theory of practice approach, which is again in line with the old institutional economics that builds to a great extent on the philosophy of American pragmatism.
Institutions appear as diverse stabilized social structures dependent on the individual evaluation of heterogeneous agents to enter or exit them. Then the iterated PD builds the formal proxy for sequential social conflict. Traditionally it is assumed that cooperation may crowd out defection in the long run under certain conditions, such as group selection or the existence of certain beneficial topologies. Still, from a political economy perspective it is very likely that continuous defection gets never crowded out under moral assumptions such as altruistic punishment [35] or indirect reciprocity [36]. On the contrary it is more likely that individual agents will build institutions (conceived as meta-stabilized structures of culturally transmitted rules) capable of supporting social learning, especially for large scale; i.e., political economy. If such a structure is established once, it is highly realistic that there are costs associated to the maintenance of it. We regard this trade-off as essential for the dynamics of institutional change since agents continuously need to evaluate their participation in stable social structures for reasons of conservation or even progress (inertia vs. change as discussed extensively in [16]). To this extent our third scenario represents a very realistic case of institutional change, where institutions emerge and exit over long periods in a cyclical movement. These institutions support social learning, where in times of defection agents can take refuge in protected social structures and leave them in time of cooperation. Thereby, the role of a leader executing, such a policy via institutional structures may become more and more redundant once free-riders have “learned” the benefits of cooperation. Still, it is not said that even in such a scenario the system switches again towards a protective regime eventually. Nevertheless, we have to consider that this long run decline of institutional significance would very likely not hold in a model with agent mortality and procreation, where offspring would not be exact copies of their parents.
Due to the continuous spatiotemporal contact of individual agents with institutional structures, agents share and anticipate the current societal level of trust and learn from it, thus influencing their future behavior. Of course this is only possible if the agents are equipped with a simple cognitive apparatus and a crude memory of past events, at least. The framework presented and the simulations carried out clearly encourage further research in the envisaged direction. Most of the issues explicitly studied so far are just one example of what could be seen as essential features of emergence and exit of institutions in human societies. In our framework we use very basic concepts of power and exploitation regarding the institutional leader. Even in such an environment, where coercive power relations between agents are highly stylized—centralized and monopolized by a given ruling political entity—it is possible to observe a wide variety of forms of emergence and exit of institutions, i.e., diversity in institutional life-cycles. Those basic political economy elements point out the potential of such an evolutionary institutional economic approach for further models of power and exploitation. The rules for the fee paid to the agent leading an institution as well as the rule for choosing this leader are just typical economic concepts to keep dynamics still simple for useful exploration. Extending our approach by replacing them with ideas reflecting pre-existing power relations securing exploitation would certainly enable our example to be a more adequate image of the historical emergence of institutions—where there has been a historical primacy of coercive power and exploitation compared to voluntary interactions on markets, thereby hinting at the potential scope of the approach. Extensions of this kind clearly suggest opening up new dimensions of heterogeneity of agents leading to a richer diversity of institutions.
Acknowledgments
The authors would like to highlight that initial research and previous versions of this paper were produced during a research project granted by the Oesterreichische Nationalbank (OeNB—the central bank of the Republic of Austria) within the “Jubiläumsfonds” project 13350. Furthermore we want to thank participants and organizers of the research area sessions of RA-C “Institutional Change” at the annual conferences of the European Association for Evolutionary Political Economy (EAEPE) during the years 2009–2012; as well as at the participants and organizers of the annual conference of the Association of Heterodox Economics 2009 for fruitful and productive comments. We further want to acknowledge the highly constructive critique of three anonymous referees.
Finally the authors are very grateful and acknowledge the efforts of Hardy Hanappi inspiring this research.
Author Contributions
The author’s contribution is equal in all aspects of the reported research and writing of the paper.
Conflicts of Interest
The authors declare no conflict of interest.
References
- Young, H.P. Individual Strategy and Social Structure; Princeton University Press: Princeton, NJ, USA, 1998. [Google Scholar]
- Gintis, H. The Bounds of Reason. Game Theory and the Unification of the Behavioral Sciences; Princeton University Press: Princeton, NJ, USA, 2009. [Google Scholar]
- Maynard-Smith, J. Evolution and the Theory of Games; Cambridge University Press: New York, NY, USA, 1982. [Google Scholar]
- Axelrod, R.M. The Evolution of Cooperation; Basic Books: New York, NY, USA, 1984. [Google Scholar]
- Nowak, M.A. Evolutionary Dynamics. Exploring the Equations of Life; The Belknap Press of Harvard University Press: Cambridge, MA, USA, 2006. [Google Scholar]
- Bowles, S.; Gintis, H. A Cooperative Species. Human Reciprocity and Its Evolution; Princeton University Press: Princeton, NJ, USA, 2011. [Google Scholar]
- Richerson, P.; Henrich, J. Tribal social instincts and the cultural evolution of institutions to solve collective action problems. Cliodynamics 2012, 3, 38–80. [Google Scholar]
- Ostrom, E. Understanding Institutional Diversity; Princeton University Press: Princeton, NJ, USA, 2005. [Google Scholar]
- Hodgson, G.M. What is the essence of institutional economics? J. Econ. Issues 2000, 34, 317–329. [Google Scholar]
- Dopfer, K.; Potts, J. The General Theory of Economic Evolution; Routledge: Abingdon, UK, 2008. [Google Scholar]
- Hanappi, H. The neumann-morgenstern project—Game theory as a formal language for the social sciences. In Game Theory Relaunched; Hanappi, H., Ed.; InTech: New York, NY, USA, 2013; pp. 3–26. [Google Scholar]
- Bourdieu, P. Praktische Vernunft: Zur Theorie des Handelns; Suhrkamp: Frankfurt, Germany, 1982. [Google Scholar]
- Veblen, T. The Theory of the Leisure Class; MacMillan: New York, NY, USA, 1899. [Google Scholar]
- Veblen, T. Why is economics not an evolutionary science? Q. J. Econ. 1898, 12, 373–397. [Google Scholar]
- Dequech, D. The Demarcation between the “Old” and the “New” institutional economics: Recent complications. J. Econ. Issues 2002, 36, 565–572. [Google Scholar]
- Heinrich, T.; Schwardt, H. Institutional inertia and institutional change in an expanding normal-form game. Games 2013, 4, 398–425. [Google Scholar] [CrossRef]
- Elsner, W.; Heinrich, T. A simple theory of meso: Co-evolution of institutions and platform size. J. Soc-Econ. 2009, 38, 843–858. [Google Scholar]
- Dopfer, K.; Foster, J.; Potts, J. Micro-Meso-Macro. J. Evolut. Econ. 2004, 14, 263–279. [Google Scholar] [CrossRef]
- Arthur, W.B. Complexity economics: A new framework for economic thought. In Complexity Economics; Arthur, W.B., Ed.; Oxford University Press: Oxford, UK, 2014. [Google Scholar]
- Wäckerle, M. The Foundations of Evolutionary Institutional Economics. Generic Institutionalism; Routledge: Abingdon, UK, 2014. [Google Scholar]
- Aoki, M. Toward a Comparative Institutional Analysis; MIT Press: Cambridge, MA, USA, 2001. [Google Scholar]
- Hodgson, G.M. What are institutions? J. Econ. Issues 2006, 40, 1–25. [Google Scholar]
- D’Ippoliti, C. Economics and Diversity; Routledge: London, UK, 2011. [Google Scholar]
- North, D.C. Institutions, Institutional Change and Economic Performance; Cambridge University Press: Cambridge, MA, USA, 1990. [Google Scholar]
- Hooper, P.L.; Kaplan, H.S.; Boone, J.L. A theory of leadership in human cooperative groups. J. Theor. Biol. 2010, 265, 633–646. [Google Scholar] [CrossRef] [PubMed]
- McElreath, R.; Boyd, R. Mathematical Models of Social Evolution: A Guide for the Perplexed; University of Chicago Press: Chicago, IL, USA, 2007. [Google Scholar]
- Smaldino, P.E.; Lubell, M. Institutions and cooperation in an ecology of games. Artif. Life 2014, 20, 207–221. [Google Scholar] [CrossRef] [PubMed]
- Sanchez-Pages, S.; Straub, S. The Emergence of Institutions. B.E. J. Econ. Anal. Policy 2010, 10, 1–36. [Google Scholar]
- Huberman, B.A.; Glance, N.S. Evolutionary games and computer simulations. Proc. Natl. Acad. Sci. USA 1993, 90, 7716–7718. [Google Scholar] [CrossRef] [PubMed]
- Simon, H. Bounded rationality and organizational learning. Organ. Sci. 1991, 2, 125–134. [Google Scholar] [CrossRef]
- Simon, H. The architecture of complexity. Proc. Am. Philos. Soc. 1962, 106, 467–482. [Google Scholar]
- Elsner, W.; Heinrich, T.; Schwardt, H. The Microeconomics of Complex Economies. Evolutionary, Institutional, Neoclassical, and Complexity Perspectives; Elsevier/Academic Press: Oxford, UK, 2014. [Google Scholar]
- Kauffmann, S. The Origins of Order: Self-Organization and Selection in Evolution; Oxford University Press: Oxford, UK, 1993. [Google Scholar]
- Wimsatt, W.C. Aggregate, composed, and evolved systems: Reductionist heuristics as means to more holistic theories. Biol. Philos. 2006, 21, 667–702. [Google Scholar] [CrossRef]
- Fehr, E.; Gächter, S. Altruistic punishment in humans. Nature 2002, 415, 137–140. [Google Scholar] [CrossRef] [PubMed]
- Nowak, M.A.; Sigmund, K. Evolution of indirect reciprocity. Nature 2005, 437, 1291–1298. [Google Scholar] [CrossRef] [PubMed]
- 1Heterogeneity is thus not only an exogenous assumption replacing the (mainstream economic) assumption of a set of homogeneous representative agents; it indeed is a process, which evolves as part of the overall dynamics.
- 2Passive play occurs when a game is initiated by another agent—i.e., a game that is played outside of the target agent’s turn.
- 3Basically resulting into R − S − T + P ≠ 0 and R − T − S + P ≠ 0, for details compare [1]. This condition has strong consequences for the calculation of the informal payoff of agents. If we would pick payoff values not meeting the “nondegeneracy” condition (e.g., R − S − T + P = 0) then the informal payoff function would be in linear dependence of alpha (trust), i.e., a very special and singular case.
© 2014 by the authors; licensee MDPI, Basel, Switzerland. This article is an open access article distributed under the terms and conditions of the Creative Commons Attribution license (http://creativecommons.org/licenses/by/3.0/).