Abstract
Fresh agricultural products have significant seasonality and perishability, and their cross-regional sales often face differences in market demand, price, and sales volume. In the context of government quality regulation, competition among retailers in different regions drives supply chain members to improve product quality, expand sales, and reduce losses. However, conflicts of interest under decentralized decision-making may lead to overall inefficiency. This article constructs a supply chain model consisting of a single Manufacturer and two regional Retailers to study the quality competition and coordination mechanism of cross-regional fresh food supply chains under government supervision. By comparing centralized and decentralized decision-making, it is found that although quality improvement in decentralized mode helps enhance competitiveness and sales performance, it is difficult to effectively increase profits and may even lead to a decline in profits. Therefore, this article proposes a cost-sharing contract to achieve supply chain coordination. Research has shown that this contract can effectively improve the overall profit of the supply chain and achieve Pareto improvement; under high market demand and strict regulatory penalties, the total profit of the supply chain increases, but the dominant Retailer benefits more, which can easily trigger the “Matthew effect”. The research results reveal the comprehensive impact of quality investment, contract coordination, market demand fluctuations, and regulatory intensity on supply chain performance, providing theoretical basis and management insights for improving the collaborative efficiency and policy design of cross-regional fresh food supply chains.
1. Introduction
More and more consumers are paying attention to the food grown on nearby farms and following seasonal diets based on the local food supply (Wilkins, 2002). Seasonal fresh products represent healthy and fresh food grown on nearby farms. However, seasonal fresh products, such as watermelons, grapes, cucumbers, tomatoes, etc., are only available at specific times (Hingley et al., 2008). Seasonal fresh products face problems such as insufficient supply, short sales periods, and inability to guarantee quality (Dinham, 2003; Hobbs, 2021).
Due to fresh products’ perishable and high-loss characteristics (Gokarn & Kuthambalayan, 2019; Weersink et al., 2021), Manufacturers generally produce fresh products closer to the sales area. It is wise to sell fresh products to different areas adjacent to the Manufacturer to reduce the loss of fresh products during transportation. Moreover, during the local season, consumers prefer locally grown tomatoes over tomatoes from other regions (Brumfield et al., 1993). Lynn Wilkins (1996) found that the majority of respondents reported that local fruits and vegetables were fresher (88%), looked better (60%), tasted better (62%), and they preferred locally grown agricultural products compared to fruits and vegetables imported from other regions or countries. Therefore, locally grown agricultural products will be sold in nearby areas rather than further away.
Due to the limited production of seasonal fresh products, the total number of fresh products sold by retailers in different regions is fixed, inevitably leading to competition among retailers. In order to maximize their profits, retailers strive to improve quality and increase sales volume. The quality of the fresh produce department is a key differentiation tool for retailers to gain greater market share in the increasingly competitive retail food market (Cook, 2004).
Government regulation of the supply chain is an important guarantee for ensuring the quality of fresh products (Trienekens et al., 2012; Uyttendaele et al., 2015), such as the Food Safety Law (Aruoma, 2006). When the quality of fresh products is low and poses a threat to people’s health, the government will impose penalties on Manufacturers and Retailers to ensure food safety for supply chain members (Aday & Aday, 2020; Wallace et al., 2018). Under government supervision, what impact does competition among Retailers have on the supply chain? Does it have an impact on the profits of supply chain members? Can we coordinate the supply chain to achieve optimal results? There is currently limited research and no clear explanation.
Based on this, this article studies regional fresh food supply chain competition and coordination considering government regulation. The rest of this article is organized as follows: Section 2 reviews relevant literature. Section 3 discusses explicitly the development and analysis of models. Section 4 provides numerical examples and a discussion of the results. Finally, Section 5 presents the conclusion.
2. Literature Review
This article is closely related to three research directions: the study of retailer competition under monopolistic Manufacturer channels, the study of supply chain coordination, and fresh food supply chain under government supervision.
2.1. Competition Between Two Retailers
It is common for Manufacturers to sell the same product through two competing retailers (Kostamis, 2013). For example, Wal-Mart and Best Buy have retained the Sony high-end T.V. brand in their products.
Bernstein and Federgruen (2005) studied the equilibrium behavior of decentralized supply chains and competing Retailers under demand uncertainty. Based on the random demand faced by Retailers, their distribution may only depend on their retail prices (non-competitive retailers) or their prices, as well as the prices of other Retailers (competitive retailers). It has been proven that the so-called linear “price discount sharing” scheme can achieve coordination. Yang and Zhou (2006) studied the price competition among Retailers under three supply chain structures: simultaneous, sequential, and cooperative. They found that collusion behavior among duopoly Retailers led to Retailers charging the highest selling price, while Cournot’s behavior among duopoly Retailers led to Retailers setting the lowest price. The more intense the competition in the duopoly retail market, the higher the pricing for Manufacturers and duopoly Retailers. Savaskan and Van Wassenhove (2006) studied the interaction between reverse channel selection of post-consumer goods collected by Manufacturers and strategic product pricing decisions in positive channels for Retailers in highly competitive environments. How does Retailers’ distribution of product lines affect their strategic behavior in the product market? It also discusses Manufacturers’ economic trade-offs when choosing the optimal reverse channel structure. Cai (2010) studied four different supply chains, with one supplier and two Retailers in the supply chain implementing the Pareto region optimal supply chain model for contract execution. By adding Pareto regions to channels, suppliers and Retailers benefit from adding new channels in traditional single-channel supply chains. In the implementation of the Pareto area contract, it is mutually beneficial for suppliers and Retailers to utilize the proposed contract coordination policy.
Giri and Sharma (2014) studied a two-level supply chain consisting of one Manufacturer and two competing Retailers whose advertising cost demand depends on advertising cost. The Manufacturer acts as the leader of Stackelberg, setting wholesale prices for each retailer. They have derived the optimal strategies for Retailers and Manufacturers. Jafari et al. (2016) studied the pricing and ordering decision problems in a dual-channel supply chain consisting of monopolistic Manufacturers and dual monopolistic Retailers and found that different game strategies did not affect the Manufacturer’s response. The retail price given by the collusion game is higher than that of other games. In the collusion model, the demand for retail channels is lower than in other games. In collusion games, Manufacturers and Retailers, respectively, obtain the lowest and highest profits.
Modak et al. (2016) proposed a cooperative and noncooperative model for a closed-loop supply chain consisting of Manufacturers and duopoly Retailers and compared this model with Kuno and collusion games. Under Stackelberg’s setup, Manufacturers and Retailers compete with each other in the game of Kurno and collusion, with a duopoly of Retailers.
According to the above literature, competition among Retailers can lead to a decrease in the selling prices of their products (Ziari et al., 2022), an increase in the cost of effort for Retailers to maintain profits, and achieving supply chain coordination can increase their profits.
2.2. Supply Chain Coordination Between One Manufacturer and Two Retailers
There have been numerous achievements in the research of supply chain coordination (Cachon, 2003; Fahimnia et al., 2015; Hänninen et al., 2021). There are many methods for supply chain coordination, such as wholesale prices (Bernstein et al., 2006), repurchases (Pasternack, 1985), price discounts (Bernstein & Federgruen, 2005), and revenue sharing (Cachon & Lariviere, 2005).
Jeuland and Shugan (1983) were early researchers who dealt with supply chain coordination issues. Based on a distribution supply chain, with each member having their decision-making power, this paper discusses the coordination of the supply chain with three decision variables: price, quality, and sales work, as well as the setting of a single Manufacturer and a single Retailer.
Xiao and Qi (2008) studied the supply chain coordination with one Manufacturer and two competing Retailers after a Manufacturer’s production cost interruption. Two coordination mechanisms were considered: full unit quantity discount and incremental quantity discount. The conditions for coordinating the supply chain were established for each mechanism, and how cost interruptions affect the coordination mechanism was discussed. Wang et al. (2011) considered the cooperative advertising problem between monopolistic Manufacturers and competitive duopoly Retailers, proposing a centralized decision-making model and a proposed cost-sharing contract that can achieve perfect coordination of the considered supply chain, where the utility of risk preference is used to determine the proportion of local advertising costs shared by Manufacturers. Alaei et al. (2014) studied a case of how Manufacturers coordinate a supply chain where two identical Retailers compete for local advertising investment and propose a cost-sharing contract to achieve perfect coordination of the supply chain.
Yoshihara and Matsubayashi (2021) studied that a Manufacturer can successfully coordinate their supply chain in equilibrium by selling their products to consumers through two competing Retailers. Liang and Gu (2021) studied the value of target sales rebate (TSR) contracts from the supply chain perspective. In order to improve supply chain performance, a so-called price-dependent TSR contract scheme has been developed, under which coordination can be achieved, especially when the random demand noise is relatively small compared to market size. Y.-S. Huang et al. (2023) studied a supply chain in which a single supplier collaborates with long-term and new cooperating retailers. Considering the uncertainty of supplier production capacity and competition from competing retailers, both retailers have exceeded their actual demand to avoid potential shortage losses. Adopting a strategic capability allocation mechanism with contractual agreements to prevent distortion in order quantity and ensure that retailers receive their acceptable minimum quantity, as well as adopting revenue sharing coordination, will reduce the bullwhip effect and increase the profits of the entire supply chain.
The above literature shows that supply chain coordination can maximize the profits of supply chain members composed of one Manufacturer and two Retailers. Therefore, achieving supply chain coordination is a mechanism agreed upon by supply chain members. Recently, supply chain coordination has begun to consider time factors. Adeinat et al. (2022) studied the efficiency of a multi-stage supply chain controlled by a single decision-maker. The goal is to maximize the total profit per unit time of a single product by coordinating the procurement of raw materials from external suppliers, manufacturing and transporting products between consecutive stages, and determining the selling price and final demand of products sold by multiple retailers. However, the literature mentioned above does not focus on fresh products and does not consider factors involving government quality supervision.
2.3. Fresh Food Supply Chain Under Government Supervision
The government has issued food laws to regulate the quality of fresh produce in order to ensure its quality (Trienekens & Zuurbier, 2008). A large number of scholars have paid attention to the impact of government regulation on the quality of fresh produce. Chen et al. (2014) established a theoretical model for quality control in food supply chain management under different market and regulatory environments, and then analyzed government regulatory actions using the 2008 Chinese milk adulteration incident as an example. Ma et al. (2021) considered the lack of corporate social responsibility in the organic food supply chain and found that with more government subsidies for Manufacturers’ technology and research and development, it is more advantageous for Manufacturers to overcome technical problems and achieve scale in the organic food industry, ultimately leading it towards active production of organic food. Jing et al. (2020) used game theory to study the decision-making of agricultural product supply quality in electronic supply chains, considering factors such as government regulatory intentions, consumer awareness of rights protection, and punishment for inferior agricultural products. They found that government regulation can improve the quality of agricultural products. The Kumar and Agrawal (2023) study introduces government regulation to improve the quality of agricultural products.
The above literature indicates that effective government regulation can ensure the quality of fresh products. However, the above literature did not study the coordination of the supply chain, where a Manufacturer and two Retailers form a supply chain, and did not investigate the impact of government regulation on the members of the supply chain.
Below is Table 1. listing the research content of this paper and other literature, which facilitates the presentation of the innovative points of this paper.

Table 1.
The research content of this paper and other literature.
3. Model Formulation and Analysis
3.1. Question Description and Model Formulation
This paper describes a monopolistic Manufacturer supply chain consisting of a single Manufacturer and two Retailers in different regions. The quantity of products Manufacturers produce is fixed, and there is competition between two sellers regarding sales quantity. The government regulates the quality of products sold by Retailers in the market to promote the improvement of product quality and protect consumer rights. When the quality of a Retailer’s product does not meet government requirements, the government will impose fines on the Retailer, which will be jointly paid by the Manufacturer and Retailer in a certain proportion. The difference in product quality corresponds to different government penalty costs. The following notations defined in Table 2 are used in this paper.

Table 2.
Notations for parameters and variables.
The product quality uA of retailer A is determined by the quality efforts of Manufacturer and Retailer A, while the product quality uB of Retailer B is determined by the quality efforts of Manufacturer and Retailer B, as shown in Equations (1) and (2):
The market demand of Retailer A is influenced by stable market demand a, the selling price pA of Retailer A’s product, the quality uA of retailer A’s product, the selling price pB of Retailer B’s product, and the quality uB of Retailer B’s product, as shown in Equation (3). As the selling price pA of retailer A’s product increases, market demand qA decreases, and similarly, the quality uB of retailer B’s product has the same relationship with market demand qA. As the product quality uA of retailer A and the selling price pB of retailer B increase, market demand qA increases. The production volume is fixed because the same Manufacturer produces the fresh products studied in this article. It is assumed that the quantity of products produced by the Manufacturer is the same as the sales volume in the supply chain, i.e., the sum of the market demands of Retailer A and Retailer B is equal to q (Equation (4)). At this point, there is a competitive relationship between Retailer A and Retailer B.
The profits of the Manufacturer, Retailer A, and Retailer B are as follows:
where represents the Manufacturer’s revenue, represents the Manufacturer’s quality effort cost, represents the cost shared by the Manufacturer when Retailer A is punished by the government, that is, when the government regulates the quality of Retailer A and the quality of Retailer A does not meet the requirements, the Manufacturer bears part of the punishment cost when the government punishes it. Similarly, represents the cost shared by the Manufacturer when Retailer B is penalized by the government. represents the revenue of Retailer A, represents the quality effort cost of Retailer A, and represents the penalty cost paid by Retailer A when the product quality level does not meet government regulatory requirements. represents the revenue of Retailer B, represents Retailer B’s quality effort cost, and represents the penalty cost paid by Retailer B when the product quality level does not meet government regulatory requirements.
According to the economic activity, we can get the constraints , , , and .
3.2. Boundary and Limitations of the Modeling Framework
This study assumes that two regional markets have the same basic demand scale, without considering the specific impact of transportation costs, regional economic development levels, or demographic differences on the demand function. These factors may affect the pricing power and sales performance of retailers in reality. Future research can further introduce asymmetric transportation costs or regional customized demand functions to enhance the practical applicability of the model.
3.3. Decentralized Decision-Making
In the decentralized model, we consider a three-stage Stackelberg game where the two Retailers compete hierarchically, and the Manufacturer acts as the final follower. Specifically:
Stage 1: Retailer B (the dominant retailer) announces its retail price and/or order quantity.
Stage 2: Retailer A, observing Retailer B’s decision, makes its own pricing/ordering decision.
Stage 3: The Manufacturer, knowing the decisions of both Retailers, determines the product quality level (or wholesale price).
To solve this sequential game, we apply backward induction:
First, we solve the Manufacturer’s optimization problem at Stage 3, taking Retailers A and B’s decisions as given.
Next, we derive Retailer A’s best response function at Stage 2, anticipating the Manufacturer’s reaction.
Finally, we solve Retailer B’s problem at Stage 1, incorporating the equilibrium responses of both Retailer A and the Manufacturer.
This hierarchical structure reflects real-world scenarios where one Retailer (e.g., a large supermarket chain) has greater market power and can influence the strategic behavior of smaller Retailers and suppliers.
Firstly, calculate the value when the Manufacturer’s profit is at its maximum, and take the first derivative of the Manufacturer’s profit concerning k as
Let to obtain the optimal k:
Substitute the Manufacturer’s calculation of the optimal k into the Retailer’s profit equation a to find the optimal for the Retailer.
Let to obtain the optimal :
Substitute the Manufacturer’s calculation of optimal and the Retailer’s calculation of optimal into the Retailer’s profit equation . Find the optimal for Retailer as
Let to obtain the optimal :
Bringing , , and into the profit function of the Manufacturer and two Retailers yields the optimal profit for supply chain members under decentralized decision-making:
3.4. Centralized Decision-Making
Centralized decision-making is the strategy to achieve maximum overall profit in the supply chain. The overall profit of the supply chain is the sum of the profits of the Manufacturer and two Retailers, as shown below.
To find the optimal profit for centralized decision-making, first determine whether there is an optimal solution to the centralized decision-making profit function. Find the Hessian matrix for , , and as . Therefore, there exists an optimal value for the decision profit function.
Then, take the derivative of Manufacturer , Retailer A’s , and Retailer B’s separately:
When , , and are given, the optimal values can be obtained as follows:
By inputting the optimal values , , and into the supply chain profit function (Equation (18)), the optimal profit of the supply chain under centralized decision-making is obtained as follows:
3.5. Introducing Cost-Sharing Contracts
In order to achieve supply chain coordination, a cost-sharing contract has been introduced here. The Manufacturer and two Retailers share the cost of quality effort, with related parameters set as , , and . After introducing the cost-sharing contract, the profit functions of the Manufacturer and two Retailers are as follows:
where the quality effort cost sharing of Manufacturer M is equally shared by Retailer A and Retailer B, . The quality effort cost sharing of Retailer A and Retailer B is respectively borne by Manufacturer M, , . There is no correlation between the quality effort costs of Retailer A and Retailer B.
Take the derivative of for Manufacturer’s profit, for Retailer A’s profit, and for Retailer B’s profit, respectively:
Make the optimal value of the contract introduced the same as the optimal value under centralized decision-making, i.e., , , , and calculate , , and .
By introducing , , and into the profit function, we can obtain the profits of Manufacturers and Retailers after introducing the contract, as shown below.
4. Numerical Analysis
Next, the correctness of the model would be verified by numerical analysis. Moreover, through parameter sensitivity analysis, we tried to reveal the management laws of the model and provide a scientific basis for guiding management. Some parameters in this section are as follows: l = 0.3985, lA = 0.1484, lB = 0.2143, a = 82.5474, bA = 0.3172, bB = 0.7315, pA = 51.6523, pB = 57.1707, rA = 0.0463, rB = 0.8907, w = 14.658, c = 8.8471, s = 0.0202, x = 0.0242, hA = 0.9914, hB = 1.9906, lA = 0.5353, lB = 0.5582, mA = 0.4522, mB = 0.1946, q = 140.792.
4.1. Analysis of the Contract
Table 3 shows the different values of wm, wAr, wBr, k, θA, θB, πM, πAR, πBR, and π in the three cases of decentralized decision, centralized decision, and introducing contract. The values (i.e., k, θA, θB) in a centralized decision and contract introduction are the same. It shows that the model achieved supply chain coordination after introducing revenue-sharing and cost-sharing contracts.

Table 3.
Comparison of different decision-making cases.
The k, θA, θB in the introduction contract are 14.81, 0.23, and 0.16 times that in the decentralized decision. Moreover, the πM, πAR, πBR, and π in the introduction contract are 22.96%, 30.42%, 18.24%, and 22.36% larger than in the decentralized decision, respectively. After the introduction of contracts, the profits of all supply chain members increased, and the supply chain profits were the same as those under centralized decision-making, indicating that cost-sharing contracts can achieve supply chain coordination. An interesting phenomenon is θA and θB in decentralized decision-making are smaller than in the introduction of a contract. This indicates that not all Retailers should strive to improve quality when coordinating the supply chain. When reducing the cost of quality efforts, profits will still increase, for example, πAR and πBR.
4.2. Parameters That Affect the Sales Quantity of Retailers
Based on the value of 4.1, we studied the impact of different parameter changes on the supply chain. The impact of Manufacturer M’s quality k, Retailer A’s quality θA, and Retailer B’s quality efforts θB on the sales volume q of Retailers A and B is shown in Figure 1. Figure 1a shows a linear relationship between q and k. Under decentralized or centralized decision-making, as k increases, Retailer A’s sales volume q decreases, while Retailer B’s sales volume q increases. Under decentralized decision-making, the difference between the sales volume of Retailer A and that of Retailer B is increasing. At k = 0, the sales volume q of Retailer B is 2.33 times Retailer A’s, and at k = 100, the sales volume q of Retailer B is 15.37 times that of Retailer A. Under centralized decision-making, the difference between the sales volume of Retailer A and Retailer B becomes smaller and smaller, at around k = 80, and the two are almost equal. As k increases, the difference between the two becomes more extensive, and Retailer A’s sales volume is smaller than Retailer B’s. At k = 100, the sales volume q of Retailer B is 1.21 times that of Retailer A.
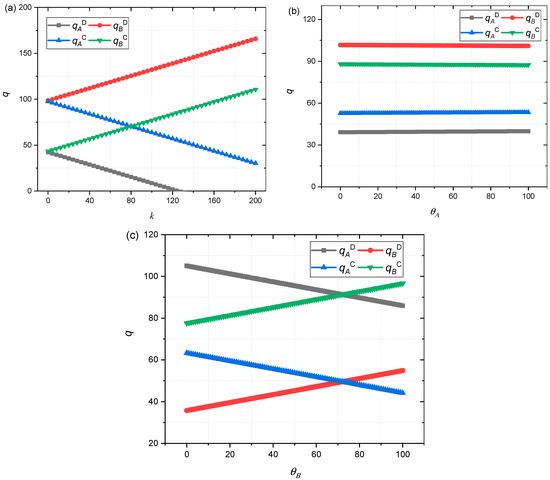
Figure 1.
(a) Impact of k on q; (b) Impact of θA on q; (c) Impact of θB on q.
Figure 1b shows the impact of the quality efforts of Retailer θA on the sales volume q of Retailers A and B. The graph shows that under decentralized or centralized decision-making, Retailer A’s quality effort θA has no impact on the sales volume q of Retailers A and B. Under centralized decision-making, the difference in sales volume q between Retailers A and B is smaller than under decentralized decision-making. Figure 1c shows the impact of the quality efforts of Retailer θB on the sales volume q of Retailers A and B. Under decentralized or centralized decision-making, the increase in θB leads to a decrease in the sales volume q of Retailer A, while the sales volume q of Retailer B increases.
4.3. Impact of Decentralized Decisions and Contracts on Supply Chain Members
Figure 2 shows the impact of the Manufacturer’s quality effort k on the Manufacturer, Retailer A, Retailer B, and supply chain profits. In Figure 2a, under decentralized decision-making, as k increases, the Manufacturer’s profit slowly decreases. After the introduction of the contract, with the increase in k, the Manufacturer’s profit slowly increased. From this, it can be seen that in the case of information asymmetry, blindly increasing the number of quality efforts by Manufacturers will decrease their profits. After the introduction of contracts, Manufacturers need to work hard to improve quality to increase their profits. Figure 2b shows that as k increases, the profit of Retailer A decreases, with a linear decrease in profit under decentralized decision-making, which is significant. Interestingly, in Figure 2c, the profit of Retailer B, who introduces the contract, is smaller than that of decentralized decision Retailer B. In other graphs, the profit of supply chain members who introduce the contract is greater than that of decentralized decision supply chain members.
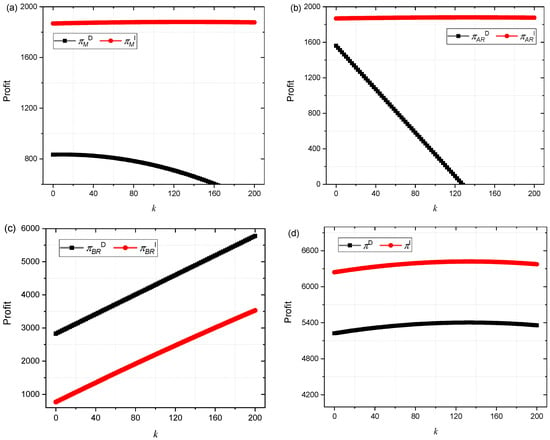
Figure 2.
(a) Impact of k on πMD, πMI; (b) Impact of k on πARD, πARI; (c) Impact of k on πBRD, πBRI; (d) Impact of k on πD, πI.
Figure 3 shows the impact of the quality efforts θA of Retailer A on Manufacturer, Retailer A, Retailer B, and supply chain profits. An increase in θA only leads to an increase in the Manufacturer’s profit under the introduction of the contract in Figure 3a, while in other cases, the profit of supply chain members shows different decreases.
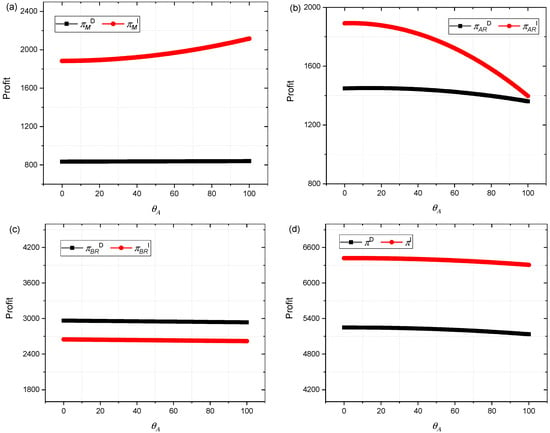
Figure 3.
(a) Impact of θA on πMD, πMI; (b) Impact of θA on πARD, πARI; (c) Impact of θA on πBRD, πBRI; (d) Impact of θA on πD, πI.
In Figure 3b, as Retailer A’s quality efforts increase and decentralized decision-making occurs, Retailer A’s profit first increases and then decreases; after the introduction of the contract, the profit of Retailer A has been consistently decreasing. As Retailer A’s quality efforts increase, Retailer B’s profit changes very little because the cost of quality efforts is mainly borne by Retailer A (Figure 3c). When θA = 0, the joint monopoly profit is 1.31 times that of decentralized decision-making. When θA = 100, the joint monopoly profit is 1.03 times that of decentralized decision-making. The profit of joint monopoly is always greater than the profit of dispersion. In Figure 3d, as Retailer A’s quality efforts increase and decentralized decision-making occurs, supply chain profits first increase and then decrease; after the introduction of contracts, supply chain profits have been consistently decreasing. It can be seen that after introducing the contract, Retailer A should not make any further efforts to improve quality in order to maintain maximum profit.
Figure 4 shows the impact of the quality efforts θB of Retailer B on Manufacturers, Retailer A, Retailer B, and supply chain profits. When the quality efforts θB of Retailer B increases, and under decentralized decision-making, the profit changes of Manufacturers and supply chains are relatively small. Under centralized decision-making, the profits of Manufacturers significantly increase. In centralized decision-making, Retailer B’s profit and quality efforts θB present a quadratic relationship with maximum profit. Interestingly, with the quality efforts θB of Retailer B, the increase results in a decrease in the profits of Retailer A under both dispersion and introduction of contracts. This indicates the increase in quality efforts θB of Retailer B will increase market share (see Figure 1c) and decrease the market share of Retailer A.
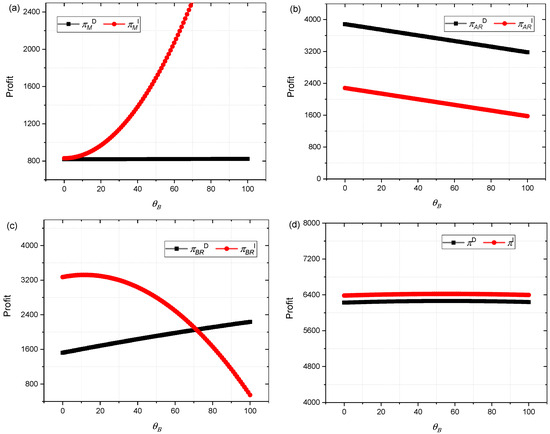
Figure 4.
(a) Impact of θB on πMD, πMI; (b) Impact of θB on πARD, πARI; (c) Impact of θB on πBRD, πBRI; (d) Impact of θB on πD, πI.
Figure 4 shows the impact of Retailer B’s quality efforts on Manufacturers, Retailer A, Retailer B, and supply chain profits. In Figure 4a, as the quality effort of Retailer B increases, the profit changes of Manufacturers and supply chains are relatively small under decentralized decision-making. After the introduction of the contract, the Manufacturer’s profit showed a secondary increase. In Figure 4b, as the quality effort of Retailer B increases, the profit of Retailer A rapidly decreases. This indicates that the increase in quality efforts of Retailer B will increase market share and decrease the market share of Retailer A. In Figure 4c, as the quality effort θB of Retailer B increases, the profit of Retailer B increases when making decentralized decisions. After introducing the contract, Retailer B’s profit first increases and then decreases. That is, when Retailer B’s profit reaches its maximum value, there exists an optimal quality effort coefficient. The quality efforts of Retailer B have no impact on the profits of the supply chain (see Figure 4d).
4.4. Impact of Parameter Changes on Member Decisions in Decentralized Decision-Making or Contract Introduction
Figure 5 shows the impact of the different quality efforts k, θA, and θB on the profits of supply chain members under decentralized decision-making. Figure 5a shows that an increase in the Manufacturer’s quality effort k can significantly improve Retailer B’s profit and reduce Retailer A’s profit. The decrease in the Manufacturer’s profit is relatively small, so the Manufacturer has no intention of increasing the quality effort k. Similarly, the quality efforts θA of Retailer A has a relatively small impact on the profits of supply chain members, so they have not changed their quality efforts θA, as shown in Figure 5b. As Retailer B’s quality efforts increase θB, the profits of Manufacturers and supply chains remain almost unchanged—Retailer B’s profits increase while Retailer A’s profits decrease (see Figure 5c).
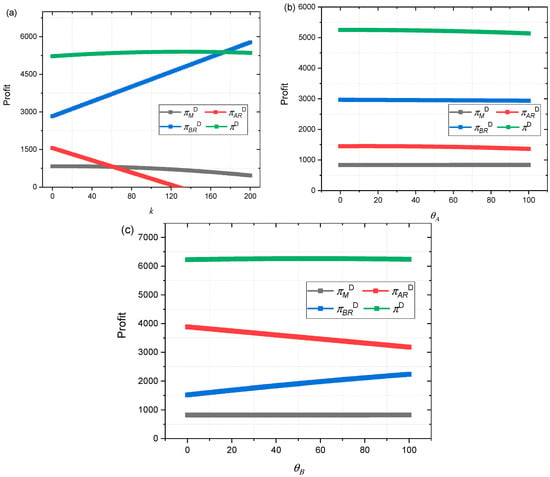
Figure 5.
(a) Impact of k on πMD, πARD, πBRD, and πD; (b) Impact of θA on πMD, πARD, πBRD, and πD; (c) Impact of θB on πMD, πARD, πBRD, and πD.
Figure 6 shows the impact of the quality efforts of Manufacturer Μ, Retailer A, and Retailer B on the profits of supply chain members who introduce contracts. From the graph, it can be seen that the quality efforts of the three parties have a relatively small impact on the profits of supply chain members after the introduction of the contract, especially in Figure 6a,b, where Retailer B and supply chain profits remain almost unchanged. In other cases, Manufacturer profits will slowly increase, and Retailer A’s theory will slowly decline. Finally, when the quality effort was about 96, the profits of the two almost overlapped. Figure 6c shows that the quality effort of Retailer B and the profit of Manufacturer M are quadratic curves. The maximum profit is reached when θB = 55. We can see from Figure 6 that the quality efforts of supply chain members have a relatively small impact on their profits after the introduction of contracts. This may be because, after the introduction of contracts, the entire supply chain achieves centralized decision-making optimization, achieves joint monopoly, and thus maximizes profits. Under the contract, the quality efforts of supply chain members can increase Manufacturers’ profits.
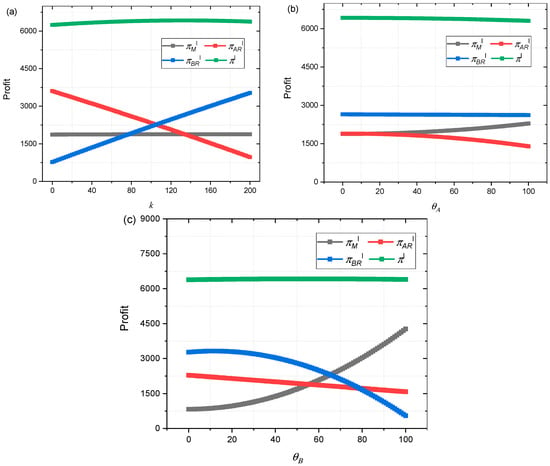
Figure 6.
(a) Impact of k on πMI, πARI, πBRI, and πI; (b) Impact of θA, on πMI, πARI, πBRI, and πI; (c) Impact of θB on πMI, πARI, πBRI, and πI.
Figure 6 shows the impact of the quality efforts of Manufacturer M, Retailer A, and Retailer B on the profits of supply chain members who introduce contracts. From the figure, it can be seen that after the introduction of the contract, the quality efforts of the three parties have a relatively small impact on the supply chain profit, especially in Figure 6a,b, where the supply chain profit remains almost unchanged. In other cases, the Manufacturer’s profit will slowly increase, and Retailer A’s theory will slowly decrease. Figure 6c shows that the quality effort of Retailer B and the profit of Manufacturer M, as well as the profit of Retailer B, are quadratic curves. From Figure 6, it can be seen that the quality efforts of supply chain members have a relatively small impact on their supply chain profits after the introduction of contracts. This may be because, after introducing contracts, the entire supply chain achieved centralized decision-making optimization, realized joint monopoly, and thus maximized profits.
4.5. Impact of Seasonality on Supply Chain
The seasonality of regional fresh produce is often positively correlated with market demand (Fjeld & Sommer, 1982; S. Huang, 2004). Figure 7a shows the profits of Manufacturer, Retailer A, Retailer B, and supply chain under changes in market demand q during discrete decision-making. With the increase in market demand q, the profits of Manufacturer M, Retailer B, and supply chain increase linearly, while the profit of Retailer A remains unchanged. Retailer B has the largest increase in profits. When q = 105, the profits of Retailer A and Retailer B are equal. Subsequently, Retailer B’s profits rapidly increased.
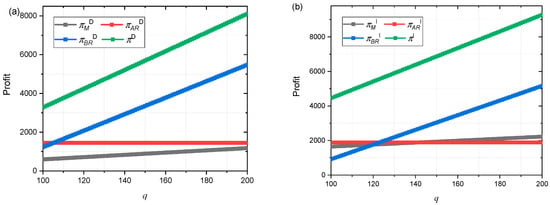
Figure 7.
(a) Impact of q on πMD, πARD, πBRD, and πD. (b) Impact of q on πMI, πARI, πBRI, and πI.
Figure 7b shows the profits of the Manufacturer, Retailer A, Retailer B, and supply chain under changes in market demand q after the introduction of contracts. With the increase in market demand q, the profits of Manufacturer M, Retailer B, and supply chain increase linearly, while the profit of Retailer A remains unchanged. Retailer B has the largest increase in profits. At around q = 120, the profits of Manufacturer M, Retailer A, and Retailer B are almost equal. Then, when q > 120, the profit of Retailer B begins to exceed that of Manufacturer M and Retailer A. The Manufacturer’s profit is slowly greater than Retailer A’s profit. Due to the dominant position of Retailer B in the supply chain, the profits generated by the increase in market demand q are all obtained by Retailer B, while the Manufacturer’s profits only increase slightly, and Retailer A’s profits remain unchanged.
4.6. Impact of Government Regulation on Supply Chain
Figure 8 shows the impact of changes in the government’s regulatory coefficient hA or hB for Retailer A on Manufacturer profits, Retailer A profits, Retailer B profits, and supply chain profits under decentralized decision-making or contract introduction. The increase in hA from Figure 8a can improve the profits of the Manufacturer, Retailer A, and the supply chain, but has no impact on the profits of Retailer B. The increase in hB from Figure 8c can improve the profits of the Manufacturer, Retailer B, and the supply chain, but has no impact on the profits of Retailer A. Figure 8b,d show that an increase in hA and hB can improve the profits of the Manufacturer, Retailer B, and the supply chain, but will reduce the profits of Retailer A. This indicates that the dominant Retailer B has higher profits as government regulation becomes stricter. The profit reduction of Retailer A, which is not dominant, may lead to a more severe Matthew effect. Moreover, government regulatory penalties can increase the profits of the supply chain.
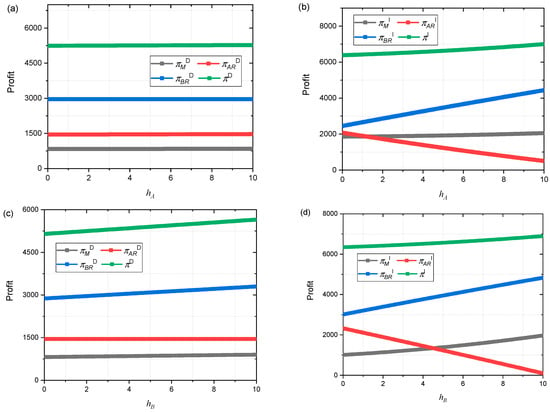
Figure 8.
(a) Impact of hA on πMD, πARD, πBRD, and πD. (b) Impact of hA on πMI, πARI, πBRI, and πI. (c) Impact of hB on πMD, πARD, πBRD, and πD. (d) Impact of hB on πMI, πARI, πBRI, and πI.
5. Conclusions
This paper studies a supply chain consisting of a Manufacturer and two Retailers, considering the impact of government regulation in different regions on the quality and profits of Retailers and Manufacturers. A cost-sharing contract was established to achieve supply chain coordination, and numerical methods were used to analyze the model. We have come to the following conclusions:
- When making decentralized decisions, due to the opacity of market information, improving the quality of supply chain members can enhance competitiveness and increase sales volume, but it cannot significantly increase profits and may even lead to a decrease in profits.
- After the introduction of contracts, the supply chain achieves a joint monopoly, and the profits of supply chain members increase. However, supply chain members’ unilateral quality improvement efforts have no impact on their profits.
- Under the contract, the quality efforts of supply chain members can increase Manufacturers’ profits, but the impact on the profits of the supply chain is relatively small.
- The seasonality of crops affects market demand. The larger the market demand, the greater the supply chain profit. However, in a supply chain consisting of one Manufacturer and two Retailers, due to the dominance of one Retailer, profits are mainly obtained by the dominant Retailer.
- Government regulatory penalties can increase the profits of the supply chain. Increasing the severity of punishment has increased the profits of dominant Retailers, while the profits of non-dominant Retailers have decreased, which will lead to the Matthew effect.
Limitations and Future Research Directions:
This study assumes that the total market demand across the two regions remains constant, abstracting from potential differences in regional market sizes, demand elasticity, and consumer characteristics. While this simplification enables us to isolate and analyze the strategic interactions between Retailers and the impact of quality competition under government regulation, it does not fully capture the complexity of real-world cross-regional markets. Factors such as income distribution, consumer preferences, urbanization levels, and regional socioeconomic development can lead to asymmetric demand responses and influence pricing and quality strategies in practice.
Future research can extend this framework in several directions, as follows: (1) by incorporating region-specific demand functions that reflect socioeconomic and demographic heterogeneity; (2) by exploring asymmetric contracts that account for imbalanced market power or cost structures; (3) by modeling dynamic regulatory policies that adapt to supply chain performance; and (4) by integrating consumer behavior dynamics—such as freshness sensitivity and brand loyalty—into the demand model. These extensions would enhance the model’s realism and provide deeper insights into the coordination and governance of cross-regional fresh food supply chains.
Author Contributions
Conceptualization, C.Z. and Y.C.; methodology, C.Z. and Y.C.; software, C.Z. and N.G.; validation, N.G. and J.S.; formal analysis, C.Z.; investigation, Y.C., N.G. and J.S.; resources, C.Z.; data curation, C.Z.; writing—original draft preparation, C.Z.; writing—review and editing, C.Z.; visualization, Y.C.; supervision, C.Z.; project administration, C.Z.; funding acquisition, C.Z. All authors have read and agreed to the published version of the manuscript.
Funding
This research was funded by the Tianjin Philosophy & Social Science Planning Project, grant number TJGLQN22-008.
Data Availability Statement
The original contributions presented in this study are included in the article. Further inquiries can be directed to the corresponding author.
Conflicts of Interest
The authors declare no conflicts of interest.
References
- Aday, S., & Aday, M. S. (2020). Impact of COVID-19 on the food supply chain. Food Quality and Safety, 4(4), 167–180. [Google Scholar] [CrossRef]
- Adeinat, H., Pazhani, S., Mendoza, A., & Ventura, J. A. (2022). Coordination of pricing and inventory replenishment decisions in a supply chain with multiple geographically dispersed retailers. International Journal of Production Economics, 248, 108461. [Google Scholar] [CrossRef]
- Alaei, S., Alaei, R., & Salimi, P. (2014). A game theoretical study of cooperative advertising in a single-manufacturer-two-retailers supply chain. The International Journal of Advanced Manufacturing Technology, 74(1), 101–111. [Google Scholar] [CrossRef]
- Aruoma, O. I. (2006). The impact of food regulation on the food supply chain. Toxicology, 221(1), 119–127. [Google Scholar] [CrossRef] [PubMed]
- Bernstein, F., Chen, F., & Federgruen, A. (2006). Coordinating supply chains with simple pricing schemes: The role of vendor-managed inventories. Management Science, 52(10), 1483–1492. [Google Scholar] [CrossRef]
- Bernstein, F., & Federgruen, A. (2005). Decentralized supply chains with competing retailers under demand uncertainty. Management Science, 51(1), 18–29. [Google Scholar] [CrossRef]
- Brumfield, R. G., Adelaja, A. O., & Lininger, K. (1993). Consumer tastes, preferences, and behavior in purchasing fresh tomatoes. Journal of the American Society for Horticultural Science, 118(3), 433–438. [Google Scholar] [CrossRef]
- Cachon, G. P. (2003). Supply chain coordination with contracts. In Handbooks in operations research and management science (Vol. 11, pp. 227–339). Elsevier. [Google Scholar] [CrossRef]
- Cachon, G. P., & Lariviere, M. A. (2005). Supply chain coordination with revenue-sharing contracts: Strengths and limitations. Management Science, 51(1), 30–44. [Google Scholar] [CrossRef]
- Cai, G. (2010). Channel selection and coordination in dual-channel supply chains. Journal of Retailing, 86(1), 22–36. [Google Scholar] [CrossRef]
- Chen, C., Zhang, J., & Delaurentis, T. (2014). Quality control in food supply chain management: An analytical model and case study of the adulterated milk incident in China. International Journal of Production Economics, 152, 188–199. [Google Scholar] [CrossRef]
- Cook, R. (2004, May 24). Supermarket challenges and opportunities for fresh fruit and vegetable producers and shippers: Lessons from the U.S. experience. Conference on Supermarkets and Agricultural Development in China-Opportunities and Challenges, Shanghai, China. Available online: http://www.agmrc.org/media/cms/supermarketchallenges_01985EE36887A.pdf (accessed on 18 September 2025).
- Dinham, B. (2003). Growing vegetables in developing countries for local urban populations and export markets: Problems confronting small-scale producers. Pest Management Science, 59(5), 575–582. [Google Scholar] [CrossRef] [PubMed]
- Fahimnia, B., Tang, C. S., Davarzani, H., & Sarkis, J. (2015). Quantitative models for managing supply chain risks: A review. European Journal of Operational Research, 247(1), 1–15. [Google Scholar] [CrossRef]
- Fjeld, C. R., & Sommer, R. (1982). Regional-seasonal patterns in produce consumption at farmers’ markets and supermarkets. Ecology of Food and Nutrition, 12(2), 109–115. [Google Scholar] [CrossRef]
- Giri, B. C., & Sharma, S. (2014). Manufacturer’s pricing strategy in a two-level supply chain with competing retailers and advertising cost dependent demand. Economic Modelling, 38, 102–111. [Google Scholar] [CrossRef]
- Gokarn, S., & Kuthambalayan, T. S. (2019). Creating sustainable fresh produce supply chains by managing uncertainties. Journal of Cleaner Production, 207, 908–919. [Google Scholar] [CrossRef]
- Hänninen, M., Kwan, S. K., & Mitronen, L. (2021). From the store to omnichannel retail: Looking back over three decades of research. The International Review of Retail, Distribution and Consumer Research, 31(1), 1–35. [Google Scholar] [CrossRef]
- Hingley, M., Sodano, V., & Lindgreen, A. (2008). Differentiation strategies in vertical channels. British Food Journal, 110(1), 42–61. [Google Scholar] [CrossRef]
- Hobbs, J. E. (2021). Food supply chain resilience and the COVID-19 pandemic: What have we learned? Canadian Journal of Agricultural Economics/Revue Canadienne D’agroeconomie, 69(2), 189–196. [Google Scholar] [CrossRef]
- Huang, S. (2004). Global trade patterns in fruits and vegetables. USDA-ERS agriculture and trade report No. WRS-04-06; USDA.
- Huang, Y.-S., Fang, C.-C., & Sun, W.-J. (2023). Capacity coordination under uncertain yield for supply chains with a single supplier and two competing retailers. International Journal of Systems Science: Operations & Logistics, 10(1), 2085341. [Google Scholar] [CrossRef]
- Jafari, H., Hejazi, S. R., & Rasti-Barzoki, M. (2016). Pricing decisions in dual-channel supply chain including monopolistic manufacturer and duopolistic retailers: A game-theoretic approach. Journal of Industry, Competition and Trade, 16(3), 323–343. [Google Scholar] [CrossRef]
- Jeuland, A. P., & Shugan, S. M. (1983). Managing channel profits. Marketing Science, 2(3), 239–272. [Google Scholar] [CrossRef]
- Jing, X., Guanxin, Y., & Panqian, D. (2020). Quality decision-making behavior of bodies participating in the agri-foods e-supply chain. Sustainability, 12(5), 1874. [Google Scholar] [CrossRef]
- Kostamis, D. (2013). A note on optimal selling to asymmetric retailers. Production and Operations Management, 22(5), 1118–1125. [Google Scholar] [CrossRef]
- Kumar, A., & Agrawal, S. (2023). Challenges and opportunities for agri-fresh food supply chain management in India. Computers and Electronics in Agriculture, 212, 108161. [Google Scholar] [CrossRef]
- Liang, G., & Gu, C. (2021). The value of target sales rebate contracts in a supply chain with downstream competition. International Journal of Production Economics, 242, 108290. [Google Scholar] [CrossRef]
- Lynn Wilkins, J. (1996). Seasonality, food origin, and food preference: A comparison between food cooperative members and nonmembers. Journal of Nutrition Education, 28(6), 329–337. [Google Scholar] [CrossRef]
- Ma, Z., Chen, J., Tian, G., Gong, Y., Guo, B., & Cheng, F. (2021). Regulations on the corporate social irresponsibility in the supply chain under the multiparty game: Taking China’s organic food supply chain as an example. Journal of Cleaner Production, 317, 128459. [Google Scholar] [CrossRef]
- Modak, N. M., Panda, S., & Sana, S. S. (2016). Two-echelon supply chain coordination among manufacturer and duopolies retailers with recycling facility. The International Journal of Advanced Manufacturing Technology, 87(5), 1531–1546. [Google Scholar] [CrossRef]
- Pasternack, B. A. (1985). Optimal pricing and return policies for perishable commodities. Marketing Science, 4(2), 166–176. [Google Scholar] [CrossRef]
- Savaskan, R. C., & Van Wassenhove, L. N. (2006). Reverse channel design: The case of competing retailers. Management Science, 52(1), 1–14. [Google Scholar] [CrossRef]
- Trienekens, J. H., Wognum, P., Beulens, A. J., & Van Der Vorst, J. G. (2012). Transparency in complex dynamic food supply chains. Advanced Engineering Informatics, 26(1), 55–65. [Google Scholar] [CrossRef]
- Trienekens, J. H., & Zuurbier, P. (2008). Quality and safety standards in the food industry, developments and challenges. International Journal of Production Economics, 113(1), 107–122. [Google Scholar] [CrossRef]
- Uyttendaele, M., Jacxsens, L., Van Boxstael, S., Kirezieva, K., & Luning, P. (2015). Food safety standards in the fresh produce supply chain: Advantages and disadvantages. In Advances in microbial food safety (pp. 379–405). Elsevier. [Google Scholar] [CrossRef]
- Wallace, C. A., Sperber, W. H., & Mortimore, S. E. (2018). Food safety for the 21st century: Managing HACCP and food safety throughout the global supply chain. John Wiley & Sons. [Google Scholar]
- Wang, S.-D., Zhou, Y.-W., Min, J., & Zhong, Y.-G. (2011). Coordination of cooperative advertising models in a one-manufacturer two-retailer supply chain system. Computers & Industrial Engineering, 61(4), 1053–1071. [Google Scholar] [CrossRef]
- Weersink, A., von Massow, M., Bannon, N., Ifft, J., Maples, J., McEwan, K., McKendree, M. G. S., Nicholson, C., Novakovic, A., Rangarajan, A., Richards, T., Rickard, B., Rude, J., Schipanski, M., Schnitkey, G., Schulz, L., Schuurman, D., Schwartzkopf-Genswein, K., Stephenson, M., … Wood, K. (2021). COVID-19 and the agri-food system in the United States and Canada. Agricultural Systems, 188, 103039. [Google Scholar] [CrossRef] [PubMed]
- Wilkins, J. L. (2002). Consumer perceptions of seasonal and local foods: A study in a U.S. community. Ecology of Food and Nutrition, 41(5), 415–439. [Google Scholar] [CrossRef]
- Xiao, T., & Qi, X. (2008). Price competition, cost and demand disruptions and coordination of a supply chain with one manufacturer and two competing retailers. Omega, 36(5), 741–753. [Google Scholar] [CrossRef]
- Yan, B., Chen, X., Cai, C., & Guan, S. (2020). Supply chain coordination of fresh agricultural products based on consumer behavior. Computers & Operations Research, 123, 105038. [Google Scholar] [CrossRef]
- Yang, S.-L., & Zhou, Y.-W. (2006). Two-echelon supply chain models: Considering duopolistic retailers’ different competitive behaviors. International Journal of Production Economics, 103(1), 104–116. [Google Scholar] [CrossRef]
- Yoshihara, R., & Matsubayashi, N. (2021). Channel coordination between manufacturers and competing retailers with fairness concerns. European Journal of Operational Research, 290(2), 546–555. [Google Scholar] [CrossRef]
- Zheng, Q., Ieromonachou, P., Fan, T., & Zhou, L. (2017). Supply chain contracting coordination for fresh products with fresh-keeping effort. Industrial Management & Data Systems, 117(3), 538–559. [Google Scholar] [CrossRef]
- Ziari, M., Ghomi-Avili, M., Pishvaee, M. S., & Jahani, H. (2022). A review on competitive pricing in supply chain management problems: Models, classification, and applications. International Transactions in Operational Research, 29(4), 2082–2115. [Google Scholar] [CrossRef]
Disclaimer/Publisher’s Note: The statements, opinions and data contained in all publications are solely those of the individual author(s) and contributor(s) and not of MDPI and/or the editor(s). MDPI and/or the editor(s) disclaim responsibility for any injury to people or property resulting from any ideas, methods, instructions or products referred to in the content. |
© 2025 by the authors. Licensee MDPI, Basel, Switzerland. This article is an open access article distributed under the terms and conditions of the Creative Commons Attribution (CC BY) license (https://creativecommons.org/licenses/by/4.0/).