Article

New Categories of Conditional Contribution Strategies in the Public Goods Game

1
Department of Plant Systematics, Ecology and Theoretical Biology, Eötvös University, H1117 Budapest, Hungary
2
Institute of Evolution, HUN-REN Centre for Ecological Research, H1121 Budapest, Hungary
3
Parmenides Center for the Conceptual Foundations of Science, Parmenides Foundation, D82343 Pöcking, Germany
*
Author to whom correspondence should be addressed.
Games 2025, 16(3), 22; https://doi.org/10.3390/g16030022
Submission received: 30 September 2024 / Revised: 31 March 2025 / Accepted: 16 April 2025 / Published: 6 May 2025
(This article belongs to the Section Behavioral and Experimental Game Theory)

Abstract

:
Human cooperation is ubiquitous and instinctive. We are among the most cooperative species on Earth. Still, research mostly focuses on why we cooperate, instead of understanding why some of us do not do so. The public goods game can be used to map human cooperation as well as to study free riding. We acquired data through an online, unincentivized questionnaire which prompted respondents to choose how much of an initial endowment to contribute to a common pool. The respondents contributed, on average, 54% of their initial endowment to the common pool. The usual categorization scheme of the elicited conditional contribution pattern discerns unconditional free riders who do not contribute irrespective of the contributions of others and calls everyone a conditional cooperator who correlates their contribution with that of the others. However, someone consistently offering less than the others should not be called a cooperator. Consequently, based on the conditional contribution patterns among our respondents, we suggest a recategorization of contribution patterns into the following categories: unconditional cooperator (1.5%), unconditional free rider (10.6%), perfect conditional cooperator (42.6%), hump-shaped contributor (0.7%), V-shaped contributor (0.4%), conditional cooperator (16.6%), conditional free rider (13.6%), conditional contributor (6.4%), negative conditional contributor (0%), and others (7.6%). We only call someone a cooperator if the respondent at least matches others’ contribution, and call everyone consistently offering less a free rider. Furthermore, we found no difference between the contributions of women and men. No correlation of contribution with age, educational attainment, and size of the residential settlement was found. Students’ contributions were not different from non-students’ contributions. We found a significant correlation of the contribution to the common pool with hypercompetitive orientation (negative correlation) and the self-assessed willingness to take risks in general (positive correlation).

1. Introduction

Cooperation is one of the defining characteristics of our species (Bowles & Gintis, 2003; Kaplan et al., 2009; Rand & Nowak, 2013). We are still puzzled by this fact and try to understand why. Much ink has been spilled on why to cooperate at all. It stems from the roots of the evolutionary theory, which emphasizes selfishness, and also from the games we model cooperation with. The public goods game (PGG), a formalization of the tragedy of the commons (Hardin, 1968), is a commonly employed framework. In this game’s theoretical situation, N individuals independently and simultaneously decide on contributing to a common pool. Contributions come from their initial endowment of, for example, 10,000 monetary units (or other quantifiable resource). Whatever they retain for themselves is theirs. The monetary units in the common pool yield a return proportional to the invested amount. The amount in the common pool is multiplied by r ( 1 < r N ), and the resulting sum is divided equally among the N individuals. A monetary unit retained is still one monetary unit at the end of the day, but a monetary unit contributed to the common pool yields r N monetary units (mean per capita return, MPCR). However, others’ contributions also yield the same for every other individual. Mutual cooperation, i.e., contribution of the whole initial endowment to the common pool, is the Pareto efficient outcome yielding the highest total payoff to the whole group. If r > N , a contribution is also the individually optimal behavior, but we focus on the case ( 1 < r N ) where there is a social dilemma. In this case, the yield is r N < 1 , and thus every individual can maximize their own payoff by not contributing, hence, no contribution (no cooperation) is the Nash equilibrium of this situation. Still, if human subjects face such a situation, they usually contribute between 40–60% of their initial endowment to the common pool (Ledyard, 1995).
A one-shot endowment offers some glimpse into why people cooperate. Some of the differences between our tendencies to cooperate have a genetic underpinning (Hiraishi et al., 2015; Mertins et al., 2011; Schroeder et al., 2013). This manifests directly or through other personality traits that influence cooperation (Guilfoos & Kurtz, 2017; Schroeder et al., 2015; Volk et al., 2012). There are also extrinsic factors influencing cooperation. Both broad culture and individual economic reality modify cooperative tendencies. One study (Lamba & Mace, 2011) argues that it is individual economic realities that determine how much people are willing to contribute to the public good: individuals experiencing economic hardship contribute less. However, culture (cultural norms) can elevate levels of cooperation even in the face of hardship (Ostrom, 1990). An individualist worldview increases the prevalence of free-riding, whereas individuals with a more communitarian worldview are more often (conditional) cooperators (Cherry et al., 2017). A larger household reduces the contribution to the public good in India (Kumar & Kant, 2016) and in Thailand (Carpenter et al., 2004), but increases it in Vietnam (Carpenter et al., 2004), Colombia, and Kenya (Cardenas et al., 2010). Culture seems to have an effect on cooperation (Gächter et al., 2010). The seminal paper by Herrmann et al. (2008) focused the spotlight on the potential of cultural differences in cooperative behavior. There are cultural comparisons that find some differences (Ahmed & Salas, 2009; Cadsby et al., 2007; Carpenter et al., 2004; Chaudhuri et al., 2006; Herrmann et al., 2008; Ishii & Kurzban, 2008; Nishi et al., 2017), and there are others that find none (Herrmann et al., 2008; Leibbrandt et al., 2015). On the other hand, there could be differences even within a country (Bigoni et al., 2016; Eckel Catherine, 2015; Kamei, 2012).
The strategy method (Selten, 1967) offers more insight into cooperative behavior. There, experimenters ask participants how much they would contribute to the public good if they knew the average contributions of the other participants. The strategy method is a good estimator of people’s behavior given their beliefs about others’ contributions (Brandts & Charness, 2011; Fischbacher et al., 2012). The behavioral types are stable over time (Gächter et al., 2022; Volk et al., 2012) (but see (Andreozzi et al., 2020)).
The contribution schedules resulting from the strategy method questions are put into categories. The commonly used ruleset for categorization (Fischbacher et al., 2001) is as follows:
  • A free rider is the one who always contributes 0, irrespective of others’ contributions.
  • A conditional cooperator is one with a positive and significant (at 1% significance level) Spearman correlation with the investments of others.
  • A hump-shaped or triangular (Fischbacher et al., 2012) contribution is the one that increases to about 50% of the others’ contributions; then, the contribution decreases.
  • If an outcome does not fall into any of the above categories, then it is considered “other”.
This categorization, however, was based on a sample of just 44 contribution schedules collected in a single study (Fischbacher et al., 2001). While the definition of free riders and conditional cooperators was exact from the beginning, the definition of hump-shaped cooperators was less clear. Fischbacher et al. (2012) made the definition more precise by also requiring the Spearman correlation to be significant for both the upward trend and the downward trend.
Many patterns that have surfaced over the years in other studies cannot be found among those original categories. For example, while hump-shaped cooperators were included, the opposite—someone contributing much in the beginning, reducing their contribution for a while, and then increasing it again (a V-shaped contribution profile)—has not been considered. Such a pattern was reported by (Muller et al., 2008) (1 instance) and (Grandjean et al., 2022) (1 instance).
Another new category is that of negative cooperators (Burton-Chellew et al., 2016) or counter-conditional cooperators (Bergantino et al., 2023) who, similarly to conditional cooperators, change their contribution based on the contributions of others, but for whom the correlation is negative, i.e., they contribute much when others do not, and then decrease their contribution. They found 6 (out of 36) (Bergantino et al., 2023) and 2 (out of 72) (Burton-Chellew et al., 2016) subjects exhibiting such patterns. Other experiments have also found examples of such contribution patterns: 2 instances in (Muller et al., 2008), 1 instance in (Kamei, 2012), and one or two instances in (Grandjean et al., 2022).
Unconditional cooperators as a separate category have been proposed many times (Burton-Chellew et al., 2016; Katuščák & Miklánek, 2023; Thöni & Volk, 2018). It was defined as a non-zero contribution that does not change with others’ contributions. The problem with this definition is that an individual always investing 10% would be labeled as an unconditional cooperator as well as someone always investing the maximum amount. Grandjean et al. (2022) increased the bar slightly. They only considered someone an unconditional cooperator if their mean contribution was above 10% and the contributions were within the 5% standard deviation range from the mean contribution. Still, someone consistently contributing 20% would be called an unconditional cooperator. One study (Rustagi et al., 2010) only considered someone an unconditional cooperator (altruist) if it always contributed the maximum amount. Another study (Bigoni et al., 2019) was a bit more permissive and included in its altruist category anyone who always contributed more than 75%, irrespective of others’ contributions. At the lower bound of unconditionally investing 80%, such individuals would offer more than others with a low-to-medium average investment and would only fall behind others with high investments.
As seen above, the established definition of free riders is too restrictive. We speculate on the reason in the discussion. Here, we just mention that people do not generally consider a low investment to be fair (Baumard, 2011; Fehr & Schmidt, 1999). Some authors allowed 1 monetary unit out of 20 to be contributed over all choices and still considered it to be free-riding (Makowsky et al., 2014; Rustagi et al., 2010). While there can be potentially more individuals categorized as free riders, it still does not solve the problem of consistently low contributions. One study (Grandjean et al., 2022) considered someone a free rider if their contribution was on average below 10%, while another study (Bergantino et al., 2023) used the cutoff value of 20%. Nagatsu et al. (2018), based on the study by (de Oliveira et al., 2015), on the other hand, considered everyone a selfish player whose contribution never exceeded 25%. There is a subtle difference between these two approaches. The definition requiring an average contribution of not more than 10% or 20% also includes a pattern in which all contributions are 0, except when everyone else’s contribution is the maximum amount, in which case this contribution is matched. This can still be considered selfish, but it is different from the case where one always gives 20%.
Free riders (Burlando & Guala, 2005) and subpar conditional cooperators (Neugebauer et al., 2009) drive repeated cooperation downward. This behavior is selfish, as they contribute less than they expect others to contribute. Lumping most of these together hides important differences between the strategies of individuals. The issue is not really the use of the Spearman correlation vs. the Pearson correlation (Thöni & Volk, 2018), the numerical value of the correlation (Grandjean et al., 2022), or the significance level of the said correlation (Rustagi et al., 2010). All contribution patterns in Figure 1 have both the Pearson correlation and the Spearman correlation above 0.89, and all are highly significant at p < 0.001. One study (Andreozzi et al., 2020) distinguished between perfect conditional cooperators and imperfect conditional cooperators. Perfect conditional cooperators match others’ contributions exactly, whereas imperfect cooperators include all other conditional cooperators. However, there should be a distinction made between those not matching others’ contributions and those that contribute even more (compare top right and top center in Figure 1 and bottom left and center with bottom right). Burlando and Guala (2005) defined conditional cooperation as that where “conditional contribution functions approximate the ‘perfect reciprocation function’, with a margin of variation of ±10%”. By that definition, the patterns/profiles in the top row in Figure 1 would be considered as conditional cooperators while the contribution patterns in the bottom row would not. Fischbacher et al. (2001) called the strategy of not matching others’ contributions as conditional cooperation with a self-serving bias. Teyssier (2012) called them low reciprocators, who match the first mover’s contribution only if it is not too high.
We need to mention the reclassification of categories by Fallucchi et al. (2019). They made a classification based on hierarchical clustering of contribution vectors. Their new categories included own-maximisers, strong conditional cooperators, weak conditional cooperators, unconditional cooperators, and various (which is basically the “others” category). Own-maximizers contribute zero or few tokens (which is in line with the definition of free riders). Strong conditional cooperators match the contributions of others. Weak conditional cooperators, on the other hand, match others’ contributions to at most half the level. Unconditional cooperators contribute the maximum amount (or close to it) to the public goods.
Strategies of players can be inferred from the behavior observed in repeated games. While the strategy space of the public goods game is vast, the comparable strategy space of the prisoner’s dilemma (a two-player version of the PGG) is more manageable. The strategy frequency estimation method (Dal Bó & Fréchette, 2011) can be employed to discern strategies. Interestingly, simple strategies such as “always defect” (comparable to unconditional free riders), “tit-for-tat” (start by cooperating and then do what the others did in the previous round, analogous to the perfect conditional cooperation), and “grim” (cooperate as long as the others cooperate, then switch to free riding) come out frequently (Dal Bó & Fréchette, 2019; Romero & Rosokha, 2023). Even if mixed strategies are allowed, players converge on these simple strategies (Romero & Rosokha, 2023).
Here, we offer a new classification scheme of the outcome of the strategy method (Fischbacher et al., 2001; Selten, 1967). We measured the cooperative tendencies in Hungary, a high-income, former socialist bloc country in Central–Eastern Europe. While unconditional contribution in the PGG has already been reported (Czibor & Bereczkei, 2010; Romano et al., 2021), conditional contribution remains so far unexplored in the Hungarian context. Actually, studies of this sort are currently available only from very few countries (Table 1), as most such research has so far been limited to the USA, UK, Switzerland, and Germany. From the wider Central–Eastern European regional context, data involving conditional contributions has so far only been collected from the Czech Republic (Katuščák & Miklánek, 2023). Consequently, our study also has the potential to add valuable data to the wider question of how culture affects cooperative tendencies.

2. Results

The results are based on 265 responses collected online in Hungary. The questionnaire was open to everyone, but most respondents were university students. The respondents were asked about their unconditional contributions and conditional contributions (according to the strategy method) to a common pool. Furthermore, data on demographics, risk-taking attitudes, attitudes toward competition, and perceived past and present economic status were recorded. The study was voluntary and unincentivized. There were two questions assessing if the respondent understood the game. Responses from those correctly answering both assessment questions and those failing at least one of them did not differ significantly, and thus all responses were retained (see Materials and Methods for details).

2.1. Unconditional Contribution

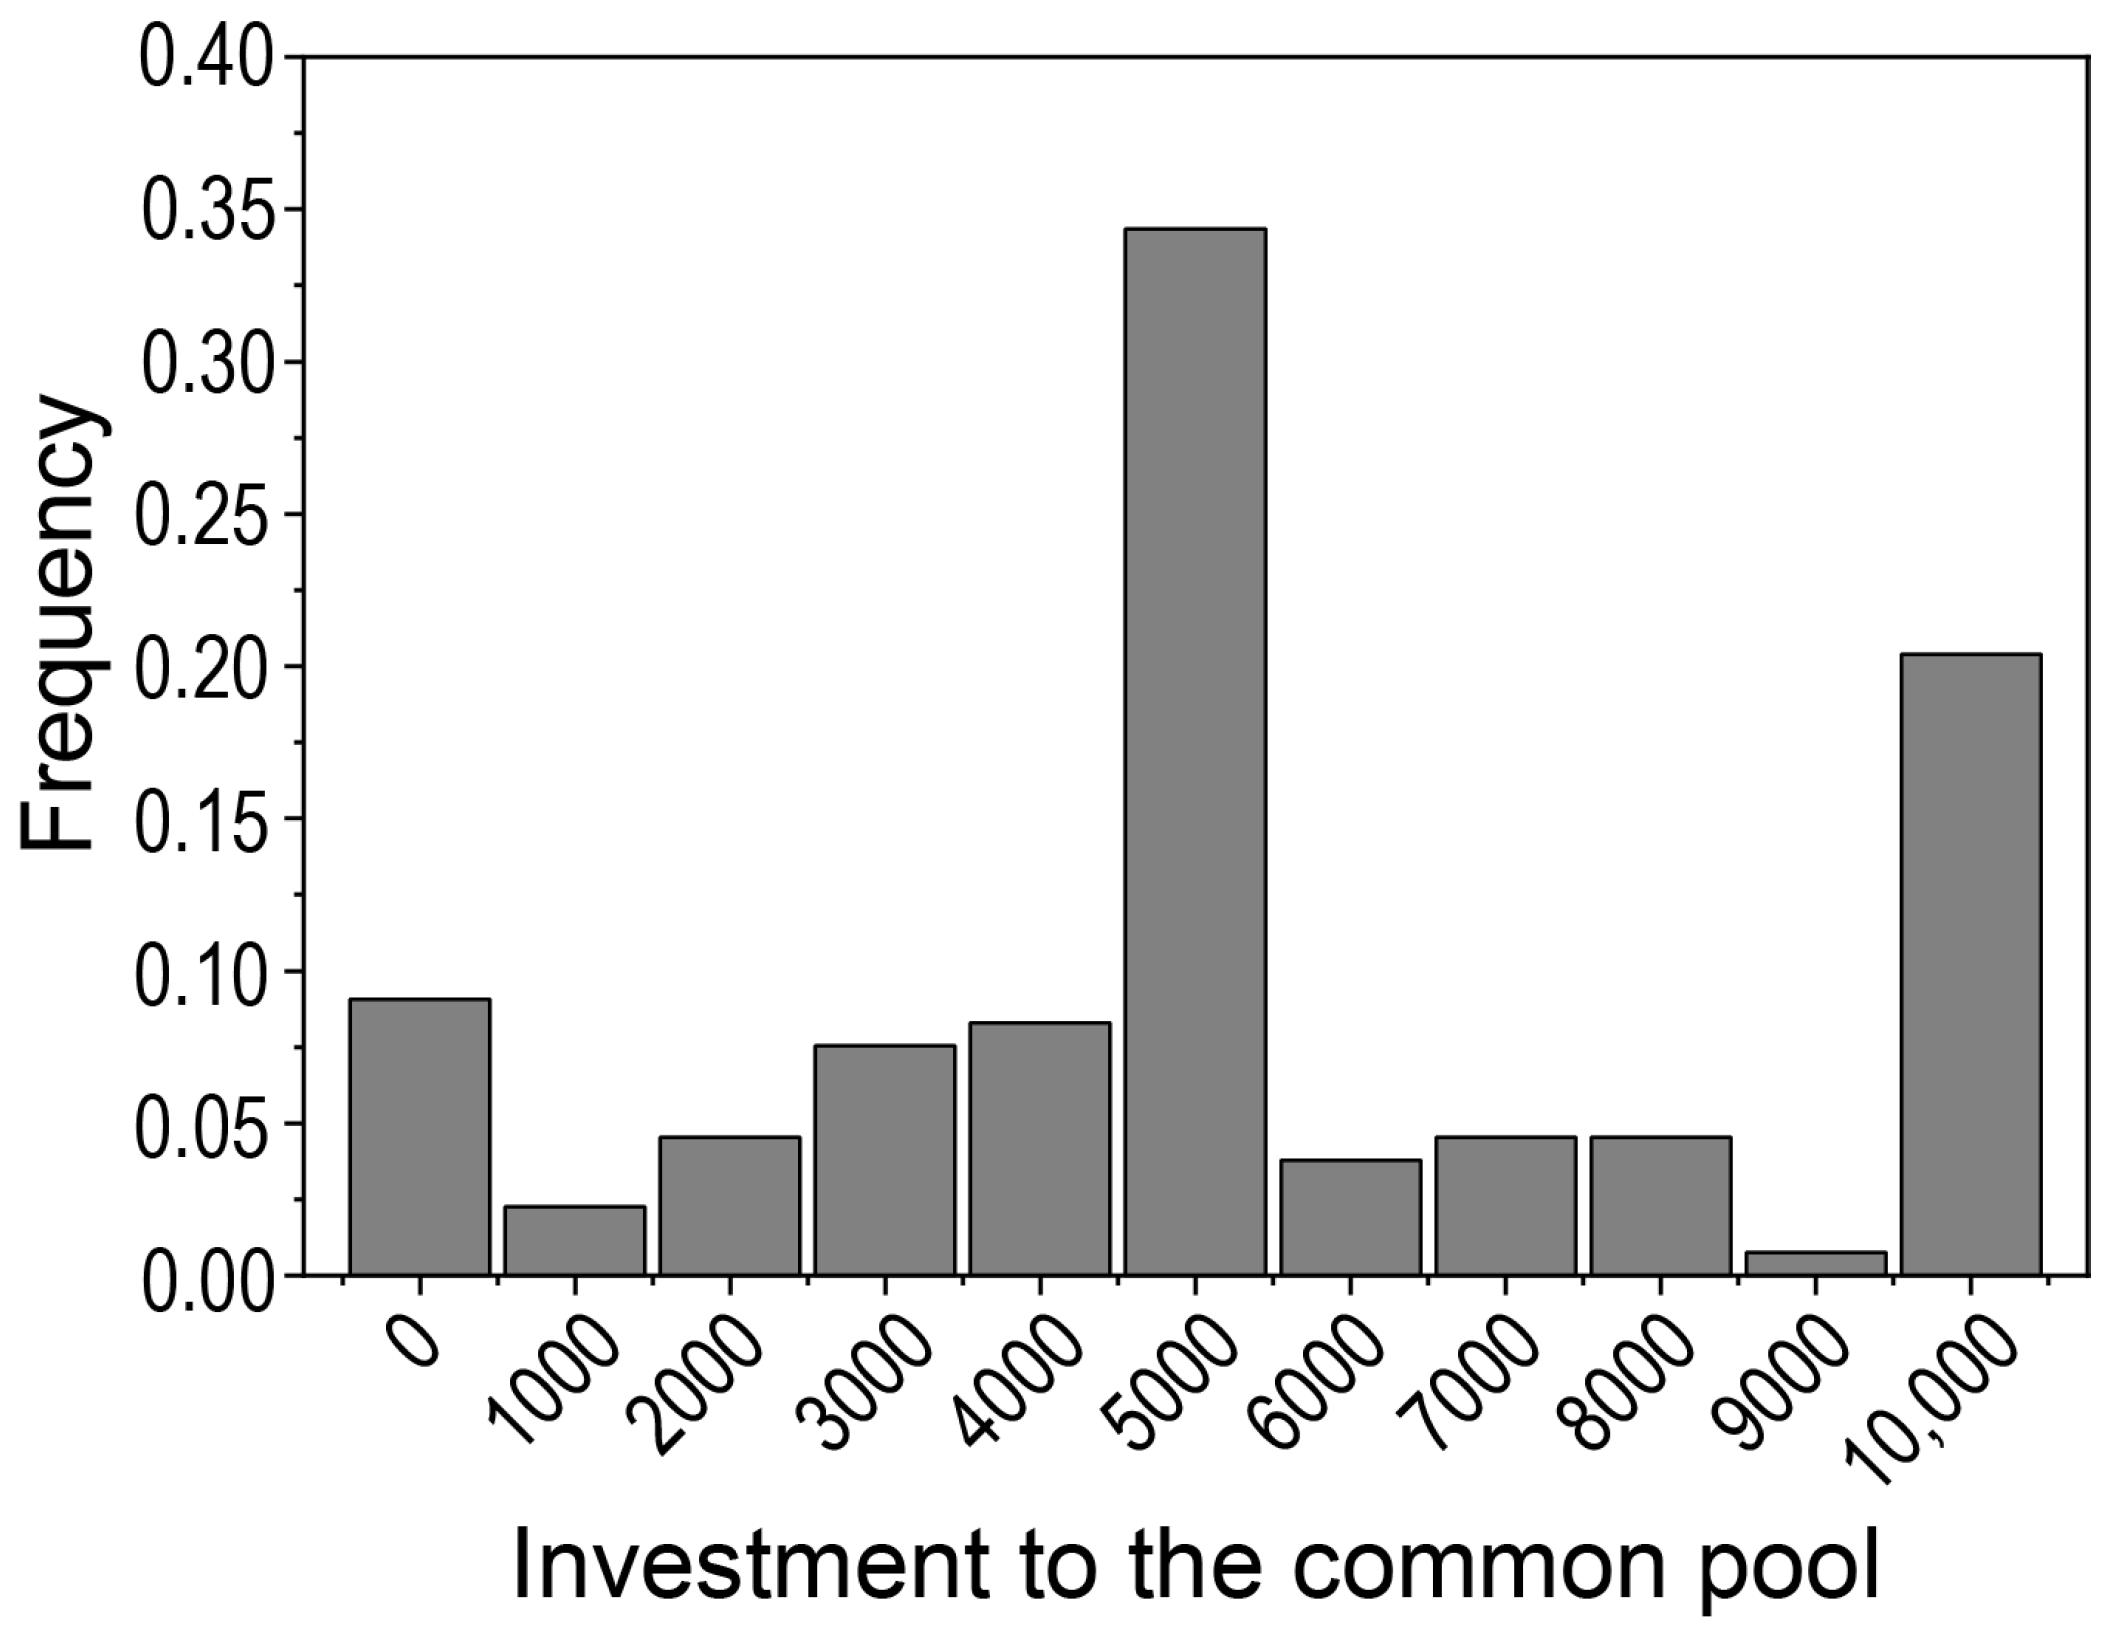
The average unconditional contribution to the common pool was 54%. The respondents, most commonly (34%), invested half of their initial endowment to the common pool. The second most commonly invested amount was the maximum (20%), followed by no investment (9%) (Figure 2).

2.2. Conditional Contribution

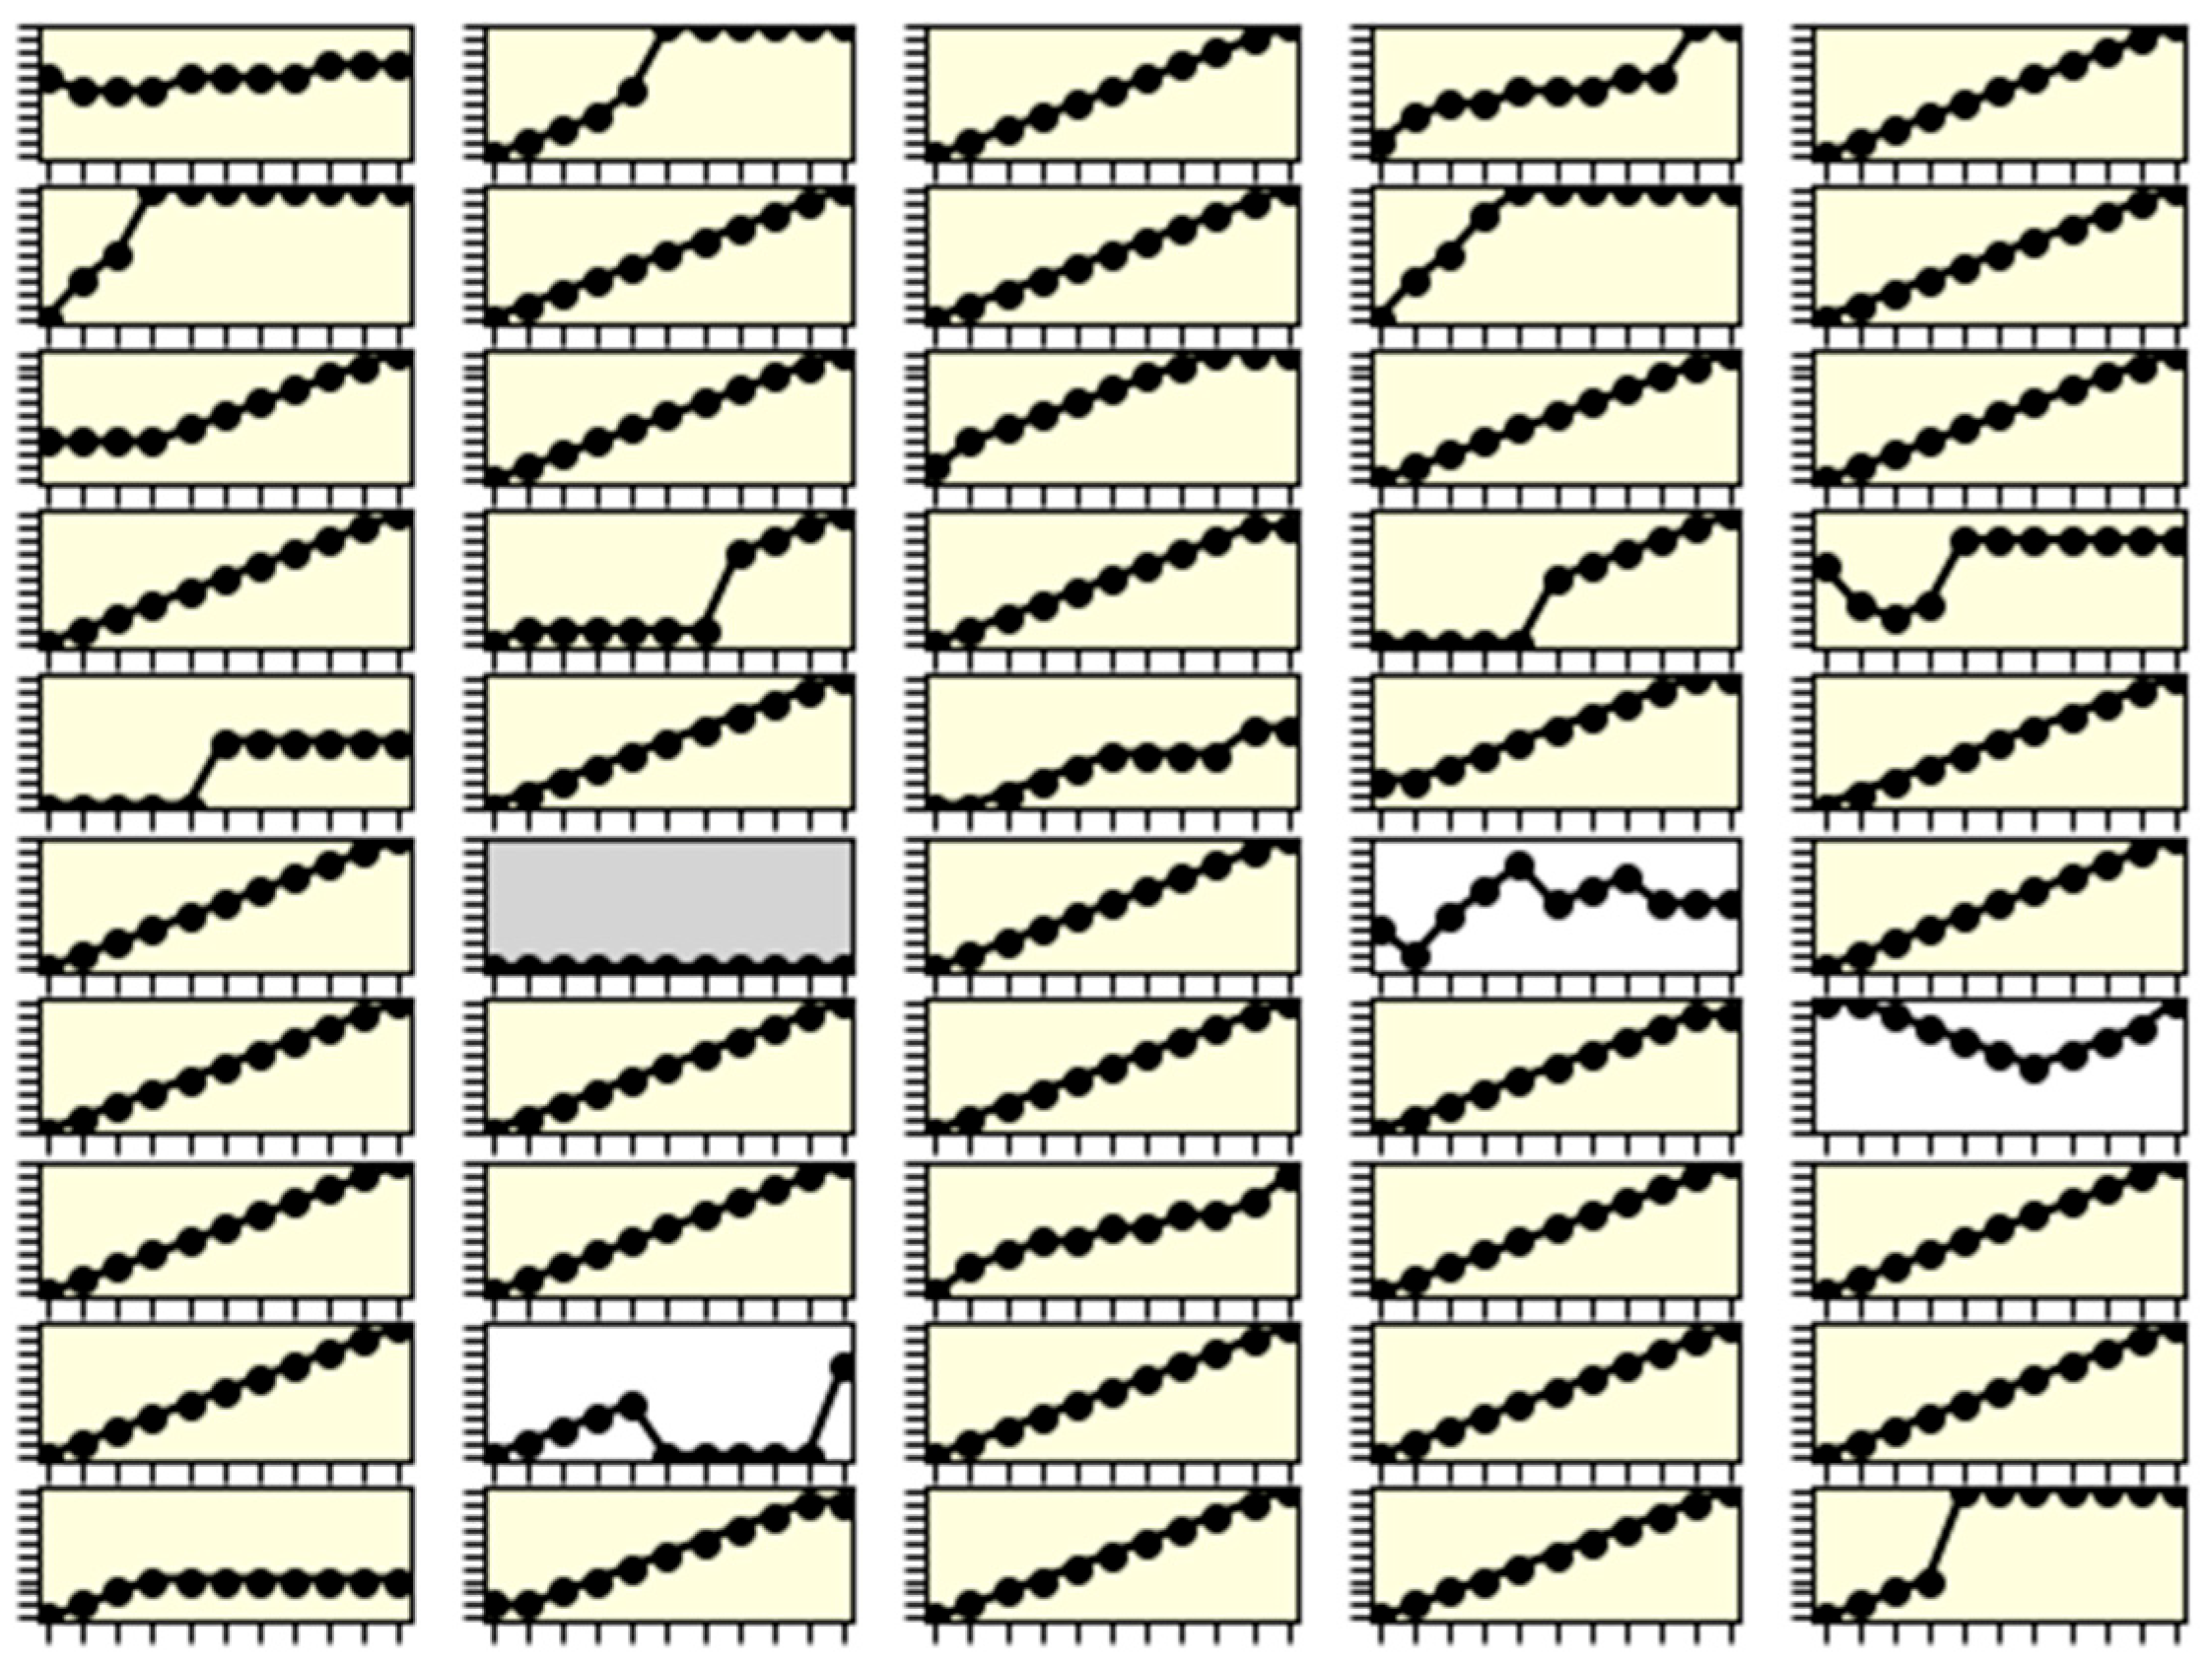
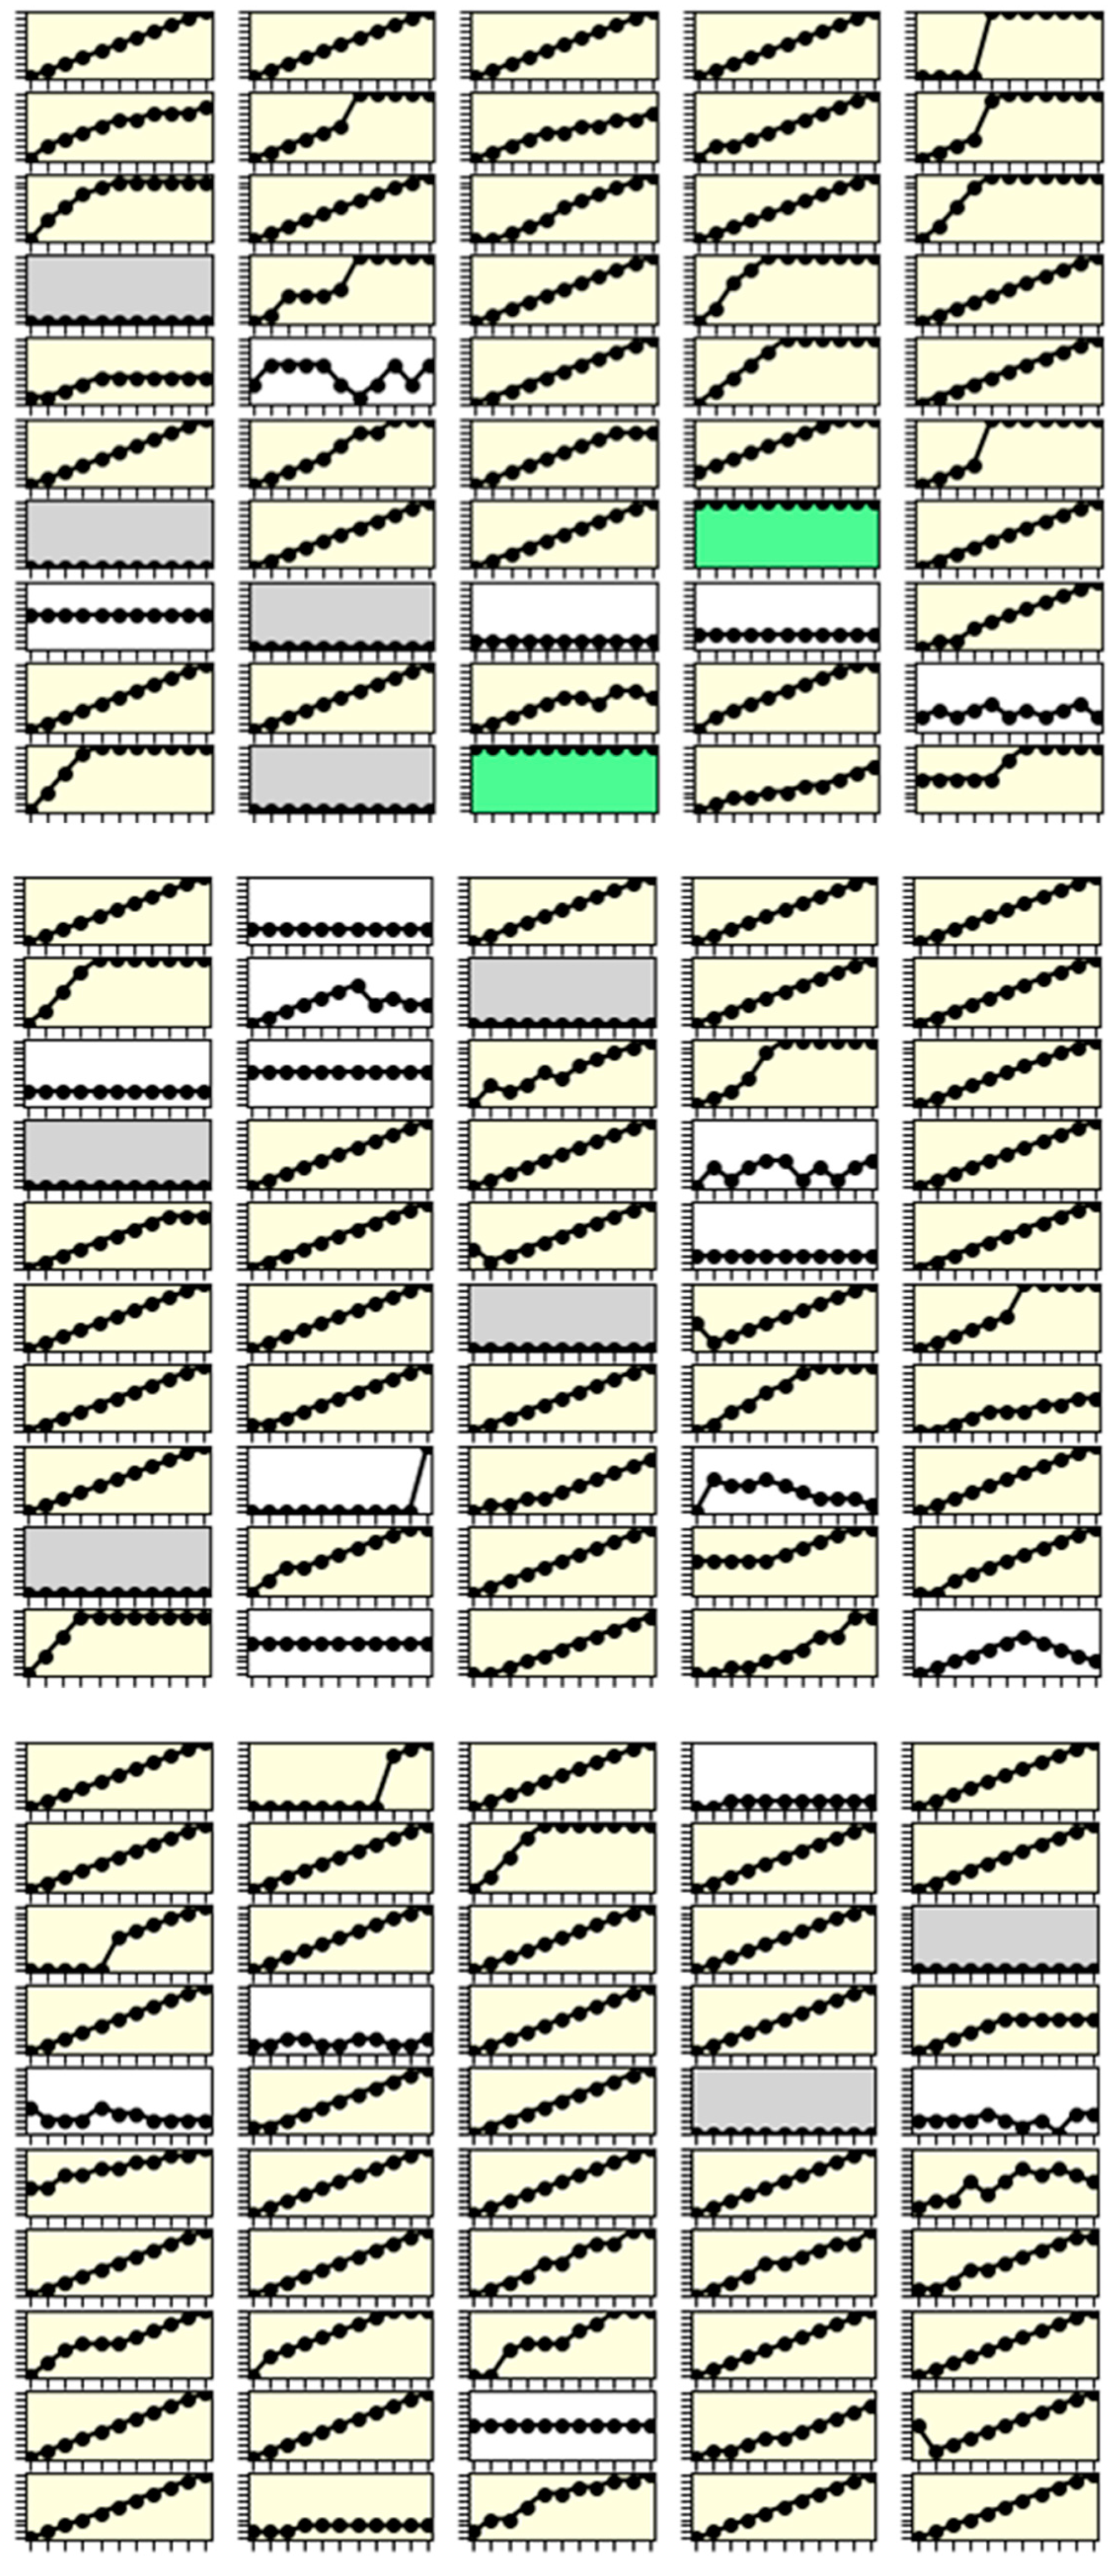
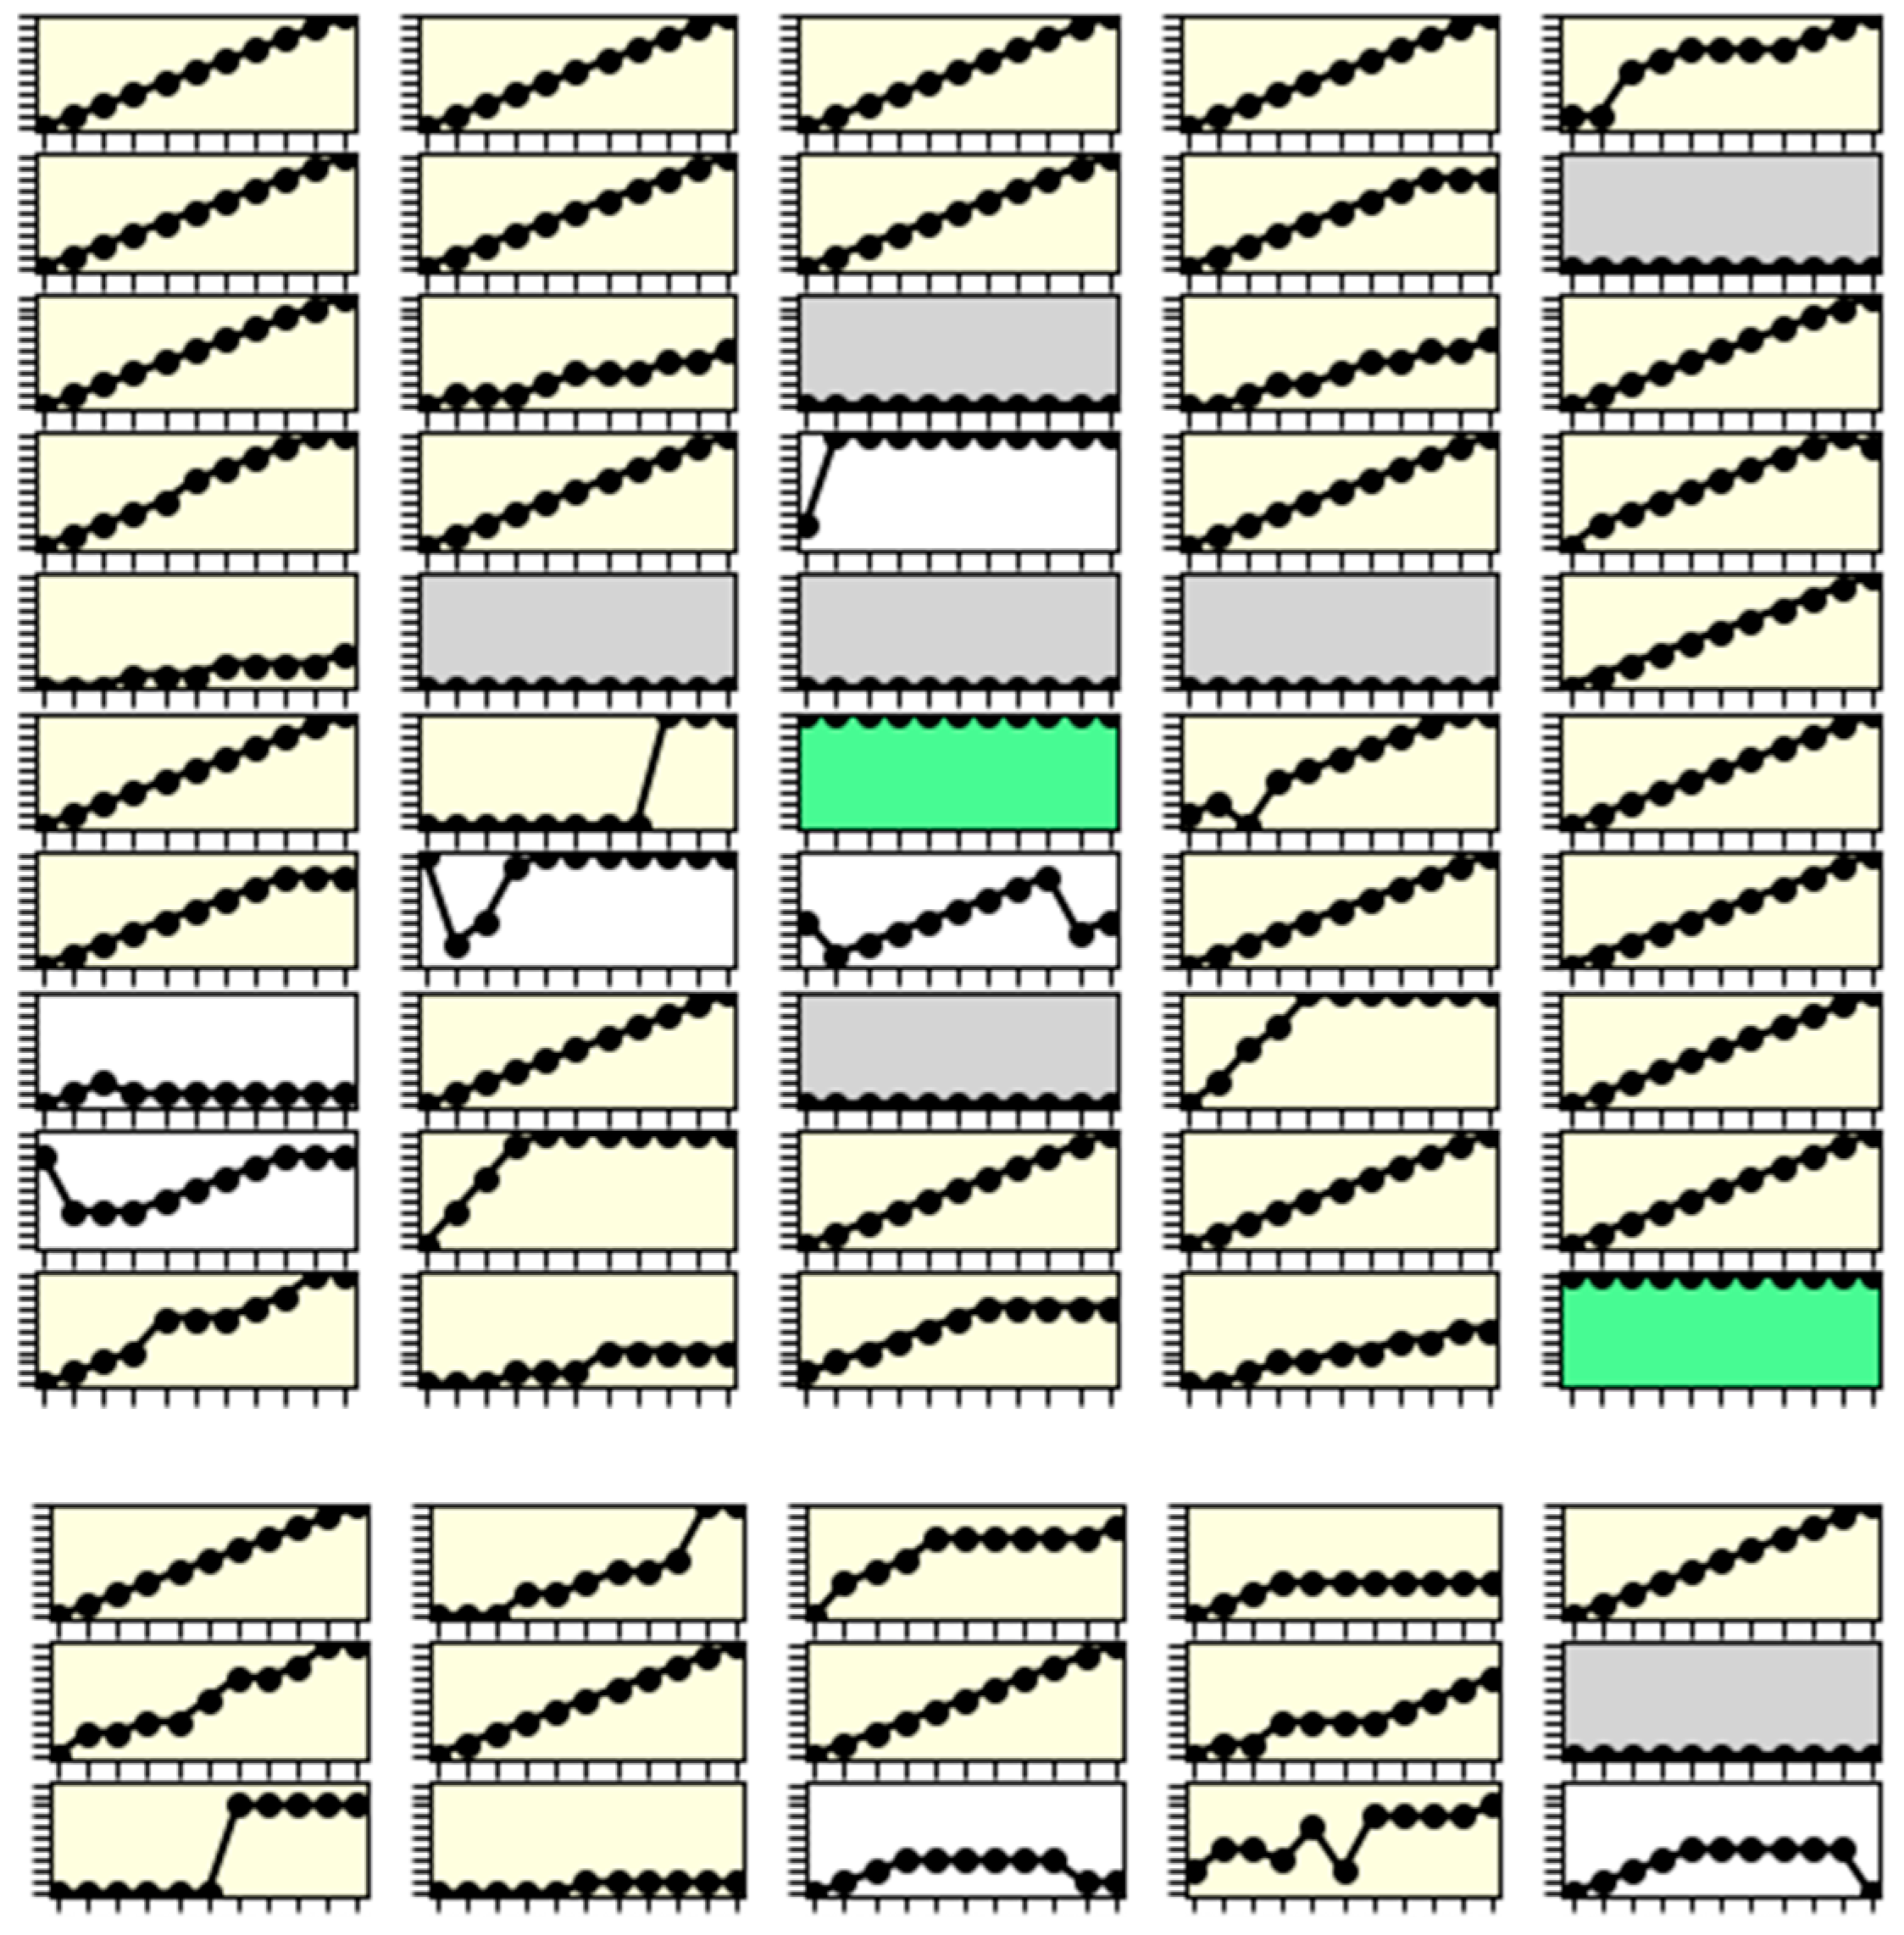
According to the original categorization of Fischbacher et al. (2001) (see Introduction), 18 (6.8%) respondents were free riders; 4 (1.5%) were unconditional cooperators; 2 were hump-shaped contributors (0.7%); 213 were conditional cooperators (80.4%); and 26 were considered to be “others” (9.8%) (see the graphical representation of the strategy of respondents in Appendix A).
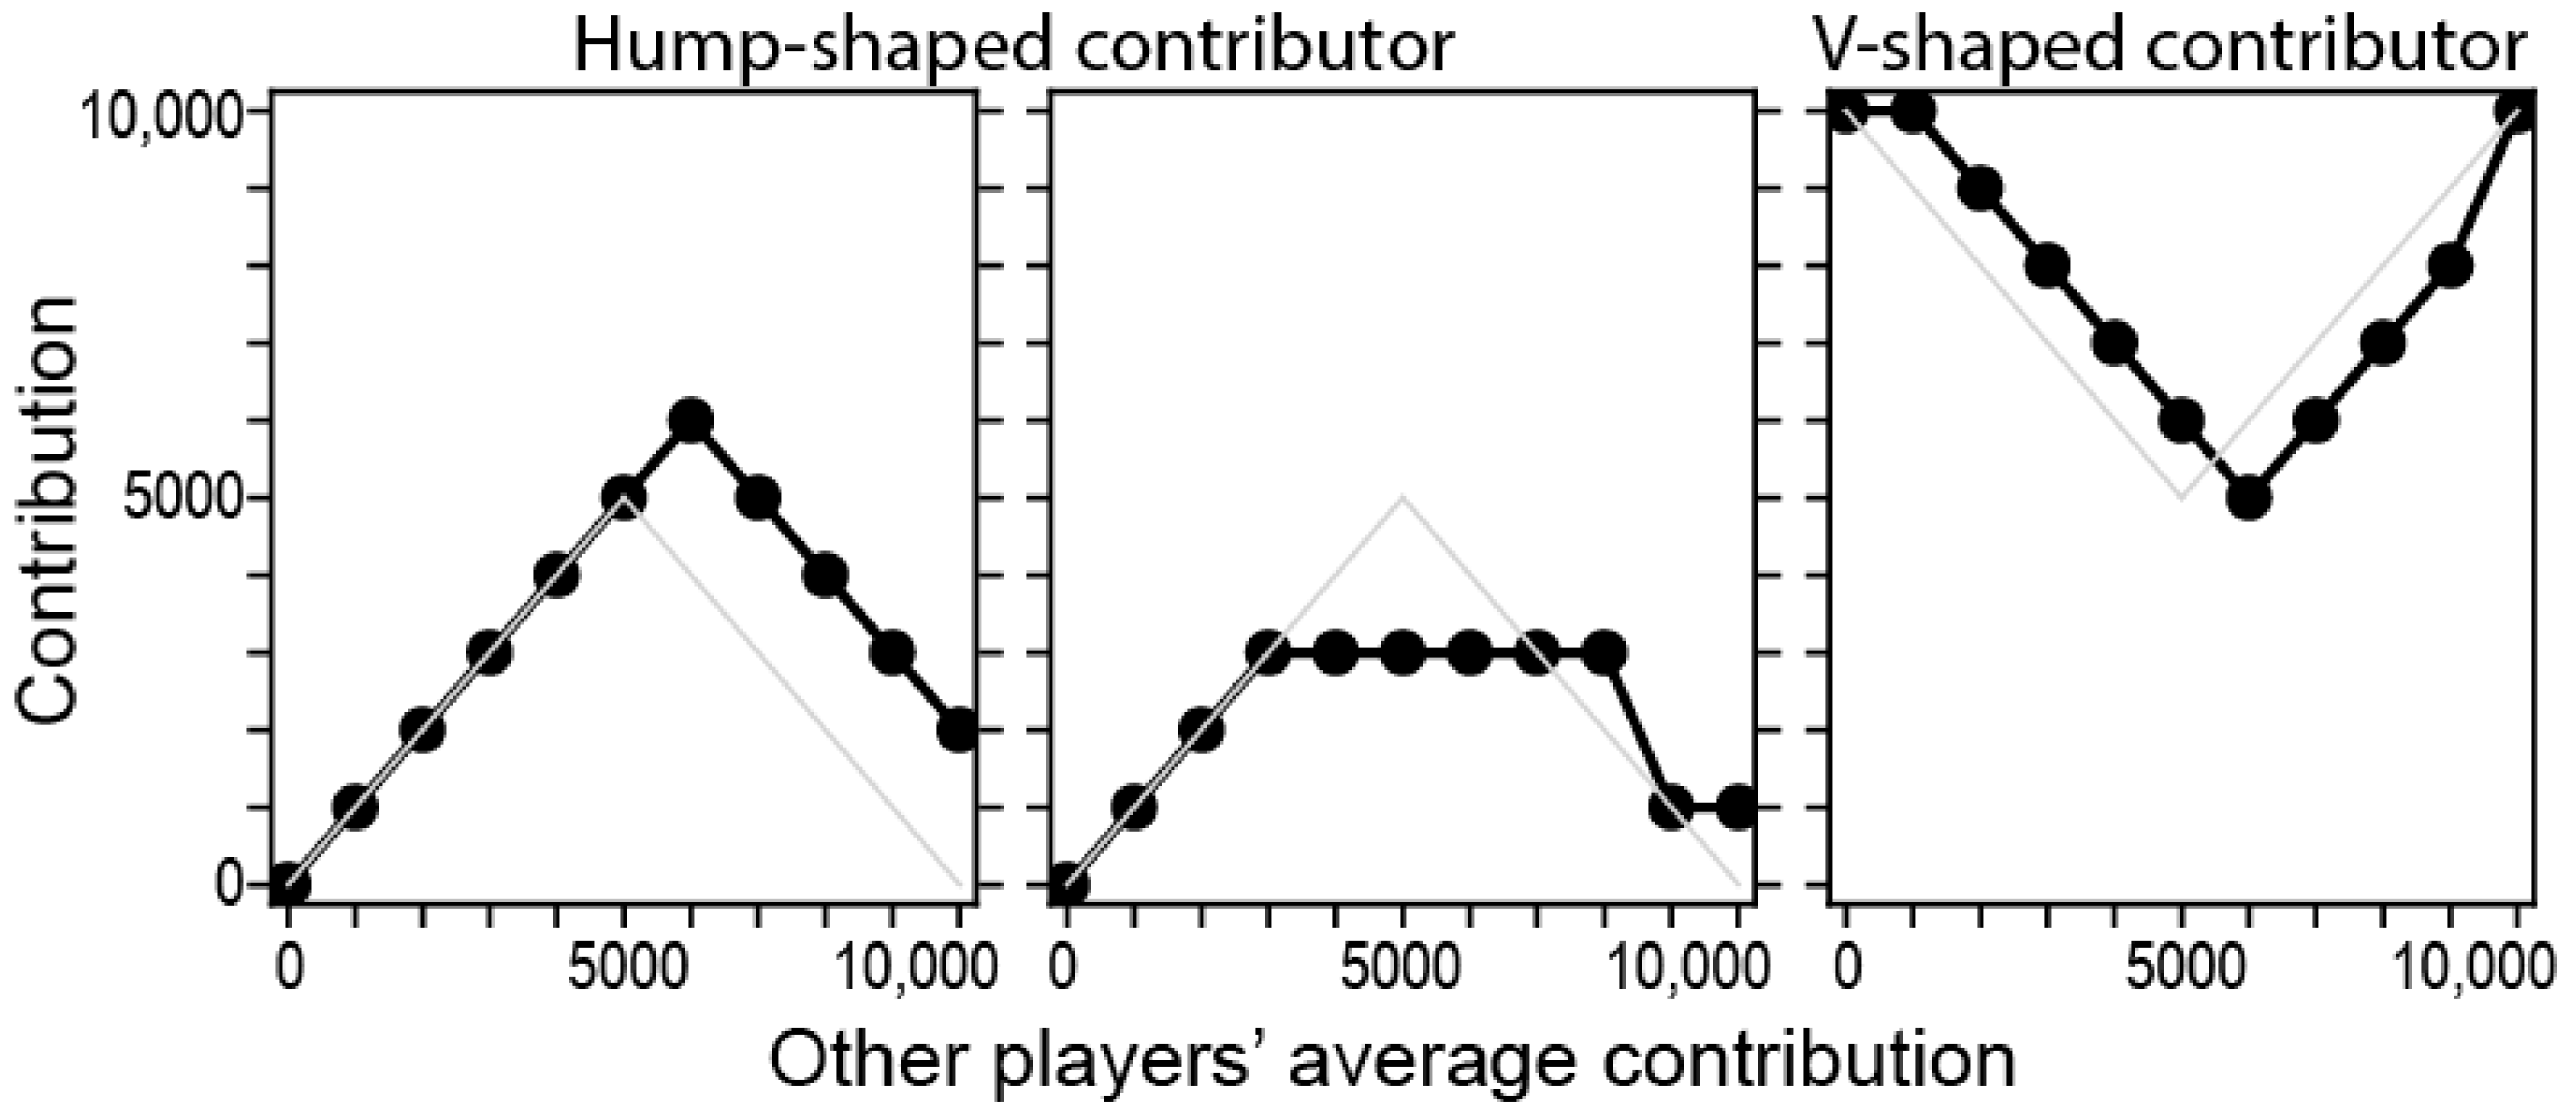
The hump-shaped cooperators found in our survey (Figure 3) were mostly far from the ideal case. We also found one example of a V-shaped contribution pattern, which is the opposite of the pattern exhibited by a hump-shaped cooperator. This underscores that the detection of rare variants requires a larger sample size, and the original categorization missed some such patterns.
In this study, we observed no instances of negative cooperators (Bergantino et al., 2023; Burton-Chellew et al., 2016) who contributed much when others did not, and then reduced their contributions. We only found four full cooperators contributing all their initial endowment and found no one unconditionally investing 80% or 90% of it.
We proceeded with the definition of free riders (selfish players) which specifies the contribution as never exceeding 25%, as proposed by (de Oliveira et al., 2015; Nagatsu et al., 2018).
There are 113 (42.6%) perfect conditional cooperators in our sample. This can be considered a category of its own.

2.3. Recategorization of Conditional Contribution Strategies

Here, we offer, based on the literature, a new categorization scheme. Patterns should be categorized in this order; if a pattern matches more than one rule, then it falls into the first category whose criterion it fulfills.
  • Unconditional cooperators: contribution is always higher than 75%.
  • Unconditional free riders: contribution is always below 25%.
  • Perfect conditional cooperators: contributions match the others’ contributions exactly.
  • Hump-shaped contributors: the contribution schedule has a maximum contribution that is not at 0 or the maximum contributions of others. The increasing part (from the beginning to the maximum of the contribution) has a positive Spearman correlation, which is significant at the p 0.05 level. The decreasing part has a negative Spearman correlation, which is significant at the p 0.05 level.
  • V-shaped contributors: the contribution schedule starts and ends high, but decreases in the middle. The decreasing part (from the beginning to the minimum of the contributions) has a negative Spearman correlation, which is significant at the p 0.05 level. The increasing part has a positive Spearman correlation, which is significant at the p 0.05 level.
  • Conditional cooperators: the contribution is always at least as high as the others’ average contributions. The bottom right panel in Figure 1 shows a conditional cooperator.
  • Conditional free riders: the contribution is at most as high as the others’ average contributions. The bottom left and bottom center panels in Figure 1 show conditional free riders.
  • Conditional contributors: the Spearman correlation between the others’ investments and the contribution of the focal player is positive and significant at p 0.001 . Some investments are above and some are below the others’ average contributions.
  • Negative conditional contributors: the Spearman correlation between the others’ investments and the contribution of the focal player is negative and significant at p 0.001 .
  • Others: if the contribution pattern does not fit into any of the above categories, it is labeled as “others”.
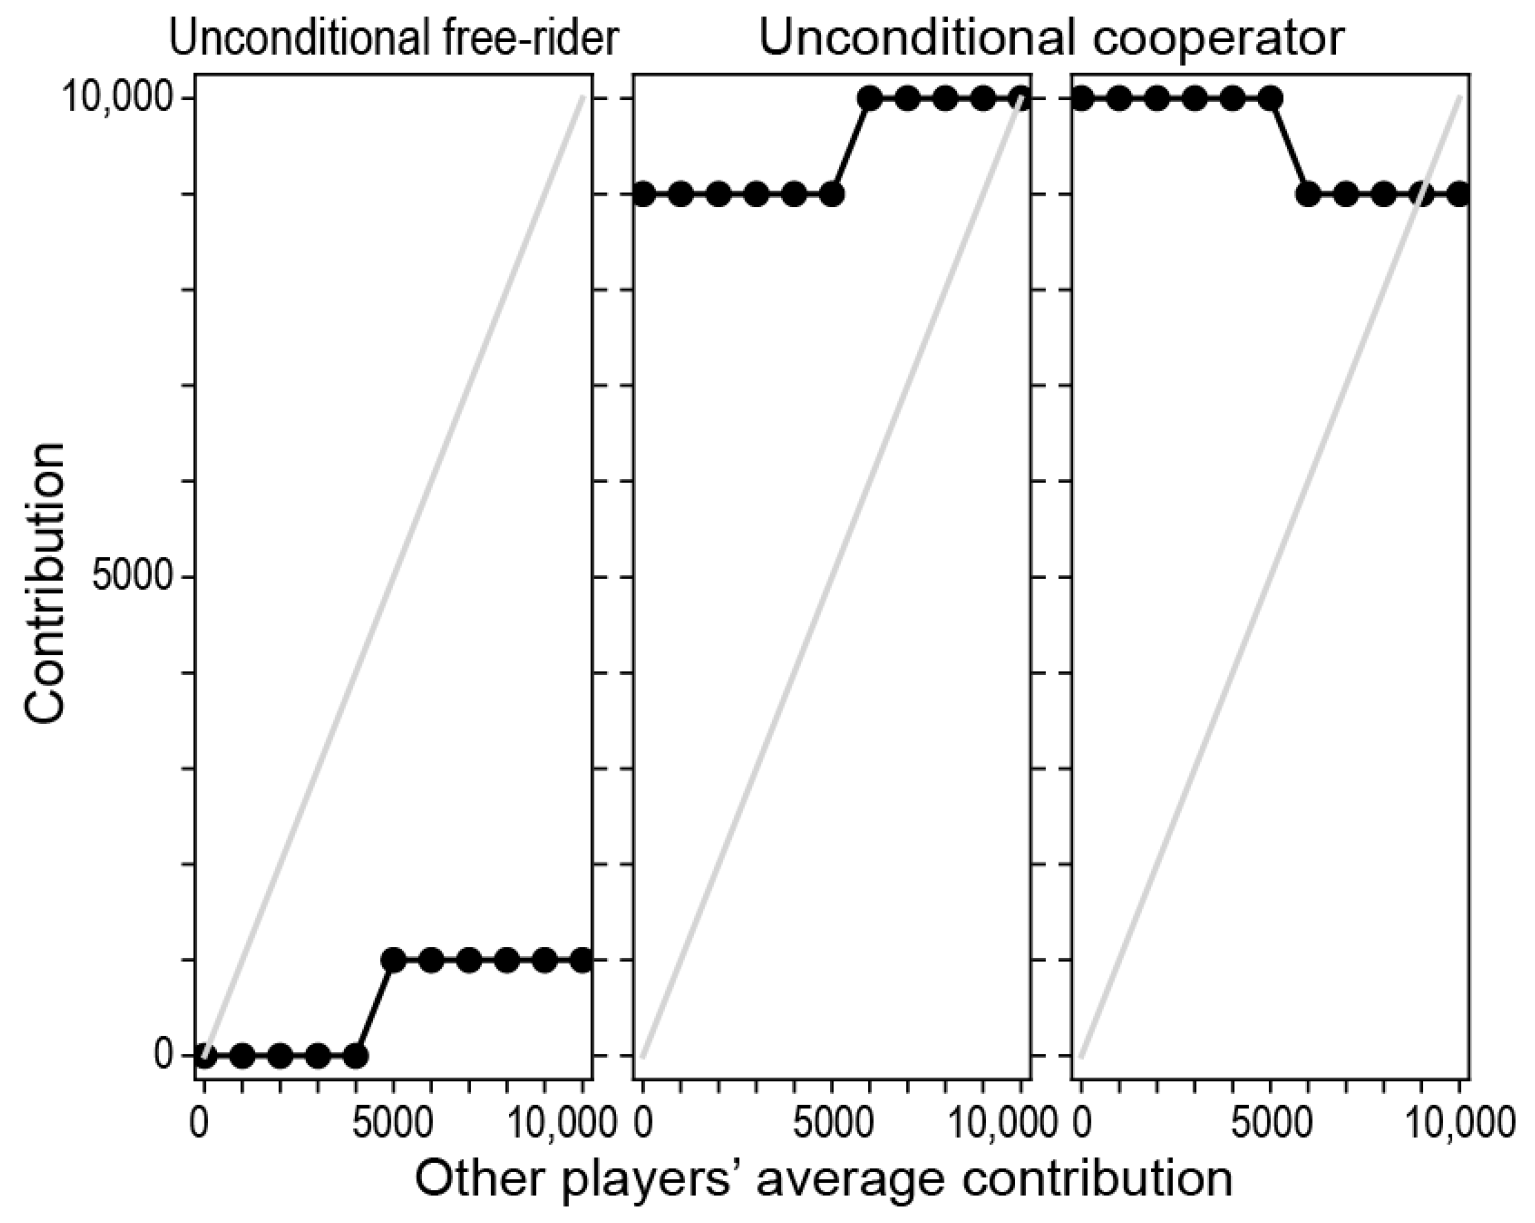
The ordering of categories makes the rule a bit simpler. For example, we categorized any contribution pattern an “unconditional free rider” if it was consistently below 25%. However, the pattern in the left panel of Figure 4 also fulfills the condition for “conditional free riders”. Similarly, the patterns in the middle and rightmost panels of Figure 4 correspond to unconditional cooperators, albeit they fulfill the conditions for conditional cooperators and negative conditional contributors, respectively.
The most frequent strategy type is Perfect conditional cooperator (Table 2), followed by Conditional free riders and Unconditional free riders.
The categorical changes we suggest have two motivations. One is to showcase some minor variants that emerge in a larger dataset. They have low frequencies, but if we want to map the true strategic diversity of contribution types, then we need to identify these. There might be other meaningfully distinct strategy types that are currently still being relegated to the “others” category. The second motivation is the necessary change in language. Former studies mostly went with the notion that anyone willing to contribute any non-zero amount is a cooperator. Some authors (de Oliveira et al., 2015; Grandjean et al., 2022; Nagatsu et al., 2018) have already extended the definition of free riders to include low contributors. Other authors have distinguished low reciprocators (Teyssier, 2012) or own-maximizers (Fallucchi et al., 2019) among those contributing some but not as much as the others. We suggest labeling anyone a free rider who consistently contributes less than others. Furthermore, we only consider someone a cooperator if they consistently contribute at least as much as others (but potentially more in some cases). In our new categorization scheme, there is an in-between category of “contributors” who sometimes contribute less and in other cases more than the perfect conditional cooperators.

2.4. Influence of Demographic Characteristics and Personality Traits on Contributions

A linear regression with the contribution as the dependent variable and sex, age, highest completed education, student status, working status, size of the residential settlement, the five competition types, past and present resource availability, and self-reported willingness to take risks as the independent variables was used. The analysis was completed using SPSS 29. The model was fitted to 265 data points, with R2 = 0.104 and ANOVA F-statistic = 1.913 with a p-value of 0.022. The results are shown in Table 3.
As in our case, most studies have found no difference in the contributions of men and women (Alencar et al., 2008; Barr et al., 2014; Buisson et al., 2013; Buser & Dreber, 2016; Cardenas et al., 2010; Fosgaard & Piovesan, 2016; Herrmann & Thöni, 2009; Keil et al., 2017; Markowska-Przybyła & Ramsey, 2018; Oyediran et al., 2018; Soler, 2012; van Hoorn et al., 2016), but some papers report a difference (Adres et al., 2016; Cadsby et al., 2007; Vogelsang et al., 2014). We found no significant correlation with age, but most of our sample was young. Others mostly found that contributions increased with age (Adres et al., 2016; Arechar et al., 2018; Belot et al., 2015; Cardenas et al., 2010; Fosgaard & Piovesan, 2016; Gächter et al., 2004; List, 2004; Vollan et al., 2017; Whitt & Wilson, 2007), albeit at an older age, people might contribute less (Carpenter et al., 2004; Rieger & Mata, 2013; Thöni et al., 2012). There is also evidence for no correlation with age in some populations (Bergantino et al., 2023). Educational attainment has been reported to increase contribution levels (Attanasio et al., 2009; Carpenter et al., 2004; Diederich et al., 2016), but we found no such correlation. We found no correlation between the contribution and the size of the settlement the participants lived in. Others also found that these are not correlated (Herrmann & Thöni, 2009; Markowska-Przybyła & Ramsey, 2018). Most of our respondents (70.9%) were university students; thus, our results on the correlation of contributions with the highest education attained and age should not be taken as definitive.
We found a significant correlation of the contribution to the common pool with the hypercompetitive orientation (negative correlation) and the self-assessed willingness to take risks in the general question (positive correlation). Thus, those who were driven by the need to win a situation (Orosz et al., 2018) contributed less, and those who were more willing to take more risks contributed more. There is some indication in the literature that risk-takers contribute more (Colasante et al., 2019).

3. Discussion

The respondents contributed, on average, 54% of their initial endowment to the common pool. This is well within the reported range of average contributions found across the globe. It is higher than previously reported on Hungarian samples (49.75% (Czibor & Bereczkei, 2010) and 42.86% (Romano et al., 2021)). We found no difference between the contributions of women and men. No correlation of contribution with age, educational attainment, and size of the residential settlement was found. The students’ contributions were not different from the non-students’ contributions.
As indicated already, most of our respondents were students. It is more accessible for researchers to rely on such a convenience sample as compared to the more representative samples that professional survey companies can reach. From the studies in Table 1, only one of the Danish samples (Fosgaard et al., 2014; Nielsen et al., 2014) was representative. Others mostly used convenience samples of university students or recruited more broadly, but representativeness was not an objective. Even though we labeled students as a “convenience sample,” response rates were low even among them (Poynton et al., 2019). Our second questionnaire was sent out to a class of 152 biology students. They were asked to also send the questionnaire to their former high school classmates. Some did so, as not all the respondents studied natural sciences. We cannot discriminate between our students and other students studying natural sciences. The response rate, at most, was 38% (58/152). There is a general “survey fatigue” in the population (Sammut et al., 2021).
Still, online surveys are a cheap and quick alternative to in-person surveys (Siva Durga Prasad Nayak & Narayan, 2019). They are as socially desirable as paper and pencil surveys (Dodou & de Winter, 2014), but response rates are generally lower (Daikeler et al., 2019). Furthermore, behavioral studies show the same results in online and on-site experiments (Casler et al., 2013). Online studies of the public goods game gave the same general results as offline ones (Cox & Stoddard, 2018; Frey, 2017). When explicitly testing if the contribution to a common pool depends on incentives, studies found no differences (Balliet et al., 2014; Hergueux & Jacquemet, 2015; Romano et al., 2017, 2021). Monetary incentives were found to increase response rates in some studies (Abeler & Nosenzo, 2015; Sammut et al., 2021), but not in others (Neal et al., 2020; Wu et al., 2022). There is, therefore, no reason to assume that our results are much different from those that would be obtained by way of an incentivized experiment.
Cooperation is not a bug; it is a feature. While the PGG’s payoff structure suggests that cooperation is not rational, i.e., it does not maximize one’s payoff, people have an intrinsic drive to cooperate. Even if people do not fully understand the situation, they tend to contribute if it resembles some common action (even if the framing of the situation is one of competition). We found no difference between the contributions of those correctly answering the control questions and those making mistakes in them. Others found that only half of the participants could correctly identify the strategy maximizing self-payoff or collective payoff (Isler et al., 2021). Still, there was no significant difference in contributions between those who answered the control questions correctly or incorrectly (Katuščák & Miklánek, 2023). When given a detailed payoff structure in a two-person game, all confusion about who gets how much can be eliminated (Yamakawa et al., 2016). However, cooperation in itself is not driven by confusion. Even if participants are explicitly told that the best option for them is to not contribute to the common pool and that the best option for the whole group is to contribute all their endowment, participants still contribute the same amount as without this information (Granulo et al., 2023). It is not the ability to calculate that matters; on the contrary, higher education and higher cognitive abilities generally lead to a higher level of cooperation (Attanasio et al., 2009; Buisson et al., 2013; Cardenas et al., 2010; Diederich et al., 2016; Su et al., 2015). Reading the instructions more carefully lowers the contribution (Nielsen et al., 2014). People contribute to the common pool even when they face machines that pick contributions randomly (Burton-Chellew et al., 2022, 2016; Ferraro & Vossler, 2010), and because computers do not get a payoff, there is no group level incentive to cooperate. It is the unnatural situation of the standard public goods game, in which people interact with complete strangers anonymously and strictly only once, that confuses people (Hagen & Hammerstein, 2006).
Human cooperation is mostly seen as an anomaly to be understood. The rationality of the public goods game dictates that individuals do not contribute. It is telling that free riding is defined as no contribution at all, and any positive contribution is labeled as cooperation. We beg to differ. Humans are instinctive cooperators (Lotito et al., 2013; Rand et al., 2012, 2014). Thus, instead of being surprised by any non-zero contribution and hailing it as cooperation, we should investigate the root of free riding, i.e., of low contributions. In a historical timescale, it is a valid question how a high level of cooperation evolved, but in the present, we need to know why there are people who contribute less than the fair share.
The main contribution type, conditional cooperation, as originally defined (Fischbacher et al., 2001), hides a lot of meaningful variability. We found that 80.4% of our respondents could be categorized as those with a correlation between their investment and the others’ investments, and 42.6% of the respondents (a bit more than half of those originally labeled as conditional cooperators) were perfect conditional cooperators: they invested to the common pool exactly what the others invested. The rest, on the other hand, invested either more or less on average. Those who invested more (16.6%) were exemplars; they could be behind stabilizing cooperation (with other cooperating types). It has been shown by Dal Bó and Fréchette (2011, 2018) that in infinitely repeated games, experience with the cooperative ability of the others leads to high levels of cooperation. Perfect conditional cooperators, conditional cooperators, and unconditional cooperators together comprise 60.7% of the responses. This is still a respectable fraction, but we know from iterated public goods games that subpar contributions drive cooperation down (Burlando & Guala, 2005; Neugebauer et al., 2009). In our recategorization of contribution types, 24.2% can be considered unconditional or conditional free riders. Contributing 0 consistently is the payoff-maximizing strategy, and some can definitely arrive at this conclusion by themselves. People might also think that they can get away with a bit of self-serving behavior, and thus contribute less than the others. This still does not explain unconditional free riding, in which someone invests 30% irrespective of what others do. It would be important to understand why people do not cooperate.
A high level of unconditional contribution is rare. In the responses we collected, only 1.5% (4) were unconditional cooperators. This is generally the case, to the extent that many authors do not even bother to include/display unconditional cooperators as a separate category (Table 1). However, there have been studies reporting higher percentages of unconditional cooperators, up to 15% (Fosgaard & Piovesan, 2016). Even if the average for all humanity is closer to the 1.5% we found, that is 120 million people out of the 8 billion with whom we share this planet. We need to take this perspective when assessing the rarity of certain behavioral types. Behavioral diversification has been crucial since the Neolithic (Vásárhelyi & Scheuring, 2018), and there is a consistent need to uncover the full extent of the existing diversity. As raw data are made increasingly available, and some of the papers already list all contribution patterns they found (Bergantino et al., 2023; Burton-Chellew et al., 2016; Grandjean et al., 2022; Kamei, 2012; Li & Noussair, 2024; Muller et al., 2008), we can reassess the contribution categories that have long been taken for granted. We confirm that others have also found the types we identified here. However, there could be more minor variants and also ways to distinguish strategies that our finer categorization is still lumping together.

4. Materials and Methods

4.1. Participants

The study was based on two questionnaires with overlapping items. The questionnaires were presented as Google Forms. The first one was publicly open for answers between 19 January 2023 and 23 April 2023. The link to the questionnaire was sent out to students in a Central–Eastern European university (mostly studying biology), and responses were solicited on social media. We obtained 199 responses to this call. The second questionnaire was sent to university students at the same university in March 2024. We also asked them to send the link to their former high school classmates. A further 66 responses were recorded. Participation was voluntary in every case.
In total, there were 265 answers; 67% of the respondents (178) were female, one identified as nonbinary, and one answered “other” to this demographic question; 188 (71%) were students; 41% of the respondents indicated that they worked; 38 (20.2%) students also had a job. Three of the respondents were pensioners. The mean age of the participants was 26.5 years.
The study protocols and procedures were approved by the United Ethical Review Committee for Research in Psychology (EPKEB 2023-22).

4.2. The Main Research Questions

The main research question about the one-shot level of contribution to the public good and the strategy method was given in the following way. These are English translations of the survey questions; the exact Hungarian text is given in Supplementary Text S1. The question was framed as an economic decision-making scenario to avoid cooperative framing, which is known to increase the contribution (Sally, 1995).
“In the following scenario, we want to explore, in an imaginary situation, how human (economic) decision-making works.
Imagine that you and three other people are involved in a decision-making process at the same time. Each person has 10,000 Hungarian forints (HUF) available in a personal account. Each person, independently and simultaneously, decides how much of these 10,000 HUF to invest in a common account. The money in the common account is doubled. Each participant gets back a quarter of the total amount invested (and is placed in the personal account), i.e., it is divided equally between them. The amount not invested is kept by each participant in his/her own account. The amount that ends up in the personal account is yours.
How many Hungarian forints would you invest in the joint account?”
“Imagine the previous decision-making situation again. That is, you have 10,000 HUF at your disposal. You can invest this money into a common account. The money in the common account is doubled. Each participant gets a quarter of the final amount invested back into their own account, i.e., it is divided equally between them. The amount not invested is kept by each participant in his/her own account.
In this case, however, you can decide on the investment after the other three people.
How much would you invest in the common account if the others invested, on average, the following amount (i.e., the common account has three times the amount below):”
Please note that Hungarian does not have grammatical genders, so there was no need to refer to genders in the original text.
The value of 10,000 HUF is ca. 25 euros or 28 US dollars. We inserted a meaningful amount here, which is roughly a half-day salary for unskilled labor (and more than a day’s salary for someone in academia with a PhD).
The mean per capita return (MPCR) was 0.4 in the study by (Fischbacher et al., 2001), and that is used as a standard for the strategy method. However, not all studies presented in Table 1 used this MPCR. The MPCR has an effect on cooperative tendencies (Gächter & Fages, 2023). We used a slightly higher one (0.5) in this experiment so that payoff calculation would be easier.
Group size in a classical PGG is 4, albeit some games employ other sizes (3 or 2 also being common choices). There is no effect of group size in these low ranges (Adres et al., 2016; Gächter & Fages, 2023; Koopmans & Rebers, 2009) (cooperation was found to be higher (Diederich et al., 2016; Isaac et al., 1994) or lower (Alencar et al., 2008) for larger groups). We used the standard 4-player game in our questionnaire.
There was no default contribution option set in the questionnaire. A default could have some minor effect (Fosgaard & Piovesan, 2016).
The questionnaires had two questions assessing if the respondent understood the game. In the first, an imaginary situation was given in which none of the participants gave anything to a common pool. We asked what the final payoff of the respondent would be (exact wording can be found in Supplementary Text S1). The correct answer was 10,000 HUF, which is what they had in the beginning of the decision task in their personal account; 237 respondents (89%) gave the correct answer to this question. In the second situation, the other participants gave, in total, 15,000 HUF, and the respondent gave 5000 HUF. We, again, asked the respondents to come up with their final payoff. Here, the common pool contained 20,000 HUF, which was doubled to 40,000 HUF, and everyone received their share of 10,000 HUF. As the respondent only gave 5000 HUF out of his/her 10,000 HUF, the leftover in his/her personal account was added to this share, yielding 15,000 as the correct answer; 142 individuals (54%) gave the correct answer. Only 4 individuals answered the second question correctly, but got the first question wrong. In total, 138 individuals answered both questions correctly. There was no significant difference in the invested amount between those who answered the question correctly and those who did not (t-test, p = 0.22). We retained all the responses.
Among those who answered both assessment questions correctly, we found 0 (0%) unconditional cooperators; 8 (5.8%) unconditional free riders; 76 (55.1%) perfect conditional cooperators; 20 (14.5%) conditional cooperators; 18 (13.0%) conditional free riders; 8 (5.8%) conditional contributors; 0 (0%) hump-shaped contributors; 1 (0.7%) V-shaped contributor; and 7 (5.1%) others.

4.3. The Questionnaire

The participants had to confirm first that they were 18 years old or older, and they agreed that their answers would be used in a study. Then, several standard demographic questions were asked: sex (male, female, or other), age, highest completed education level (elementary school, secondary education, tertiary education, or PhD), employment status (student, employee, self-employed, pensioner, unemployed, or other), size of the residential settlement (capital; city with more than 100,000 inhabitants or county capital; city with 20,000–100,000 inhabitants; town with 5000–20,000 inhabitants; town with 1000–5000 inhabitants; village with fewer than 1000 inhabitants).
The main questions (see above) were introduced after the demographic questions. Then, further questions about personality traits were presented.
The “Risk preference lottery choice sequence using the staircase method” and the “Self-assessment: willingness to take risks in general” items were used from the Preference Survey Module (Falk et al., 2018, 2023).
Competition types were assessed according to (Orosz et al., 2018). The five types are lack of interest in competition (LIC); hypercompetitive orientation (HCO); anxiety-driven competition avoidance (ADCA); self-developmental competitive orientation (SDCO); and fear of losing competition orientation (FOL).
Individual differences in perceived resource availability were assessed through three questions about the perceived socioeconomic status in childhood and three questions about the present/near future perceived resource availability (Griskevicius et al., 2011a, 2011b).
Both questionnaires had further items assessing other personality traits as well as attitudes toward climate change that are not analyzed here and did not overlap between the questionnaires. All the non-demographic questions came after the main questions to avoid priming.

Supplementary Materials

The following supporting information can be downloaded at: https://www.mdpi.com/article/10.3390/g16030022/s1, Table S1: Recorded responses; Text S1: The questionnaire.

Author Contributions

Initiation and conceptualization, Á.K.; questionnaire development, A.K. and Á.K.; data collection, K.S.; data curation, K.S. and Á.K.; statistical analysis, A.K. and Á.K.; writing—original draft preparation, Á.K. All authors contributed to the editing and finalization of the manuscript. All authors have read and agreed to the published version of the manuscript.

Funding

This work was supported by HUN-REN (grant number ELKH SA-50/2021).

Data Availability Statement

The responses are available in Supplementary Table S1.

Conflicts of Interest

The authors declare no conflicts of interest. The funders had no role in the design of the study; in the collection, analyses, or interpretation of data; in the writing of the manuscript; or in the decision to publish the results.

Appendix A

Figure A1. All 265 conditional contribution pattern from the respondents. Each of the subplots has x- and y-axes going from 0 to 10,000, with x being the average contribution of the other players’ and y being the respondent’s contribution. Subplots are shaded according to the categorization by (Fischbacher et al., 2001, 2012): conditional cooperators—yellow; free riders—gray; unconditional cooperators—green; and others—white.
Games 16 00022 g0a1aGames 16 00022 g0a1bGames 16 00022 g0a1c

References

  1. Abeler, J., & Nosenzo, D. (2015). Self-selection into laboratory experiments: Pro-social motives versus monetary incentives. Experimental Economics, 18(2), 195–214. [Google Scholar] [CrossRef]
  2. Adres, E., Vashdi, D. R., & Zalmanovitch, Y. (2016). Globalization and the retreat of citizen participation in collective action: A challenge for public administration. Public Administration Review, 76(1), 142–152. [Google Scholar] [CrossRef]
  3. Ahmed, A. M., & Salas, O. (2009). Is the hand of God involved in human cooperation? International Journal of Social Economics, 36, 70–80. [Google Scholar] [CrossRef]
  4. Aimone, J. A., Iannaccone, L. R., Makowsky, M. D., & Rubin, J. (2013). Endogenous group formation via unproductive costs. The Review of Economic Studies, 80(4), 1215–1236. [Google Scholar] [CrossRef]
  5. Alencar, A. I., de Oliveira Siqueira, J., & Yamamoto, M. E. (2008). Does group size matter? Cheating and cooperation in Brazilian school children. Evolution and Human Behavior, 29(1), 42–48. [Google Scholar] [CrossRef]
  6. Andreozzi, L., Ploner, M., & Saral, A. S. (2020). The stability of conditional cooperation: Beliefs alone cannot explain the decline of cooperation in social dilemmas. Scientific Reports, 10(1), 13610. [Google Scholar] [CrossRef]
  7. Arechar, A. A., Gächter, S., & Molleman, L. (2018). Conducting interactive experiments online. Experimental Economics, 21(1), 99–131. [Google Scholar] [CrossRef]
  8. Attanasio, O., Pellerano, L., & Reyes, S. P. (2009). Building trust? Conditional cash transfer programmes and social capital. Fiscal Studies, 30(2), 139–177. [Google Scholar] [CrossRef]
  9. Balliet, D., Wu, J., & De Dreu, C. K. W. (2014). Ingroup favoritism in cooperation: A meta-analysis. Psychological bulletin, 140(6), 1556–1581. [Google Scholar] [CrossRef]
  10. Barr, A., Packard, T., & Serra, D. (2014). Participatory accountability and collective action: Experimental evidence from Albania. European Economic Review, 68, 250–269. [Google Scholar] [CrossRef]
  11. Baumard, N. (2011). Punishment is not a group adaptation: Humans punish to restore fairness rather than to support group cooperation. Mind and Society, 10(1), 1–26. [Google Scholar] [CrossRef]
  12. Belot, M., Duch, R., & Miller, L. (2015). A comprehensive comparison of students and non-students in classic experimental games. Journal of Economic Behavior & Organization, 113, 26–33. [Google Scholar] [CrossRef]
  13. Bergantino, A. S., Gil-Gallen, S., & Morone, A. (2023). Do risk and competition trigger conditional cooperation? Evidence from public good experiments. Annals of Public and Cooperative Economics, 94(1), 39–73. [Google Scholar] [CrossRef]
  14. Bigoni, M., Bortolotti, S., Casari, M., & Gambetta, D. (2019). At the root of the north–south cooperation gap in Italy: Preferences or beliefs? The Economic Journal, 129(619), 1139–1152. [Google Scholar] [CrossRef]
  15. Bigoni, M., Bortolotti, S., Casari, M., Gambetta, D., & Pancotto, F. (2016). Amoral familism, social capital, or trust? The behavioural foundations of the Italian north–south divide. The Economic Journal, 126(594), 1318–1341. [Google Scholar] [CrossRef]
  16. Bilancini, E., Boncinelli, L., & Celadin, T. (2022). Social value orientation and conditional cooperation in the online one-shot public goods game. Journal of Economic Behavior & Organization, 200, 243–272. [Google Scholar] [CrossRef]
  17. Björk, L., Kocher, M., Martinsson, P., & Nam Khanh, P. (2016). Cooperation under risk and ambiguity. Working Papers in Economics 683. University of Gothenburg. Available online: https://gupea.ub.gu.se/handle/2077/50814 (accessed on 8 September 2024).
  18. Bowles, S., & Gintis, H. (2003). The origin of human cooperation. In P. Hammerstein (Ed.), The genetic and cultural origins of cooperation. MIT Press. [Google Scholar]
  19. Brandts, J., & Charness, G. (2011). The strategy versus the direct-response method: A first survey of experimental comparisons. Experimental Economics, 14(3), 375–398. [Google Scholar] [CrossRef]
  20. Buisson, M.-C., Das, A., & Mukherji, A. (2013). What determines contribution to a common fund for upkeep of water infrastructures? Evidence from experimental game in coastal Bangladesh. CPWF. [Google Scholar]
  21. Burlando, R. M., & Guala, F. (2005). Heterogeneous agents in Public Goods experiments. Experimental Economics, 8(1), 35–54. [Google Scholar] [CrossRef]
  22. Burton-Chellew, M. N., D’Amico, V., & Guérin, C. (2022). The strategy method risks conflating confusion with a social preference for conditional cooperation in Public Goods Games. Games, 13(6), 69. [Google Scholar] [CrossRef]
  23. Burton-Chellew, M. N., El Mouden, C., & West, S. A. (2016). Conditional cooperation and confusion in public-goods experiments. Proceedings of the National Academy of Sciences, USA, 113(5), 1291–1296. [Google Scholar] [CrossRef]
  24. Buser, T., & Dreber, A. (2016). The flipside of comparative payment schemes. Management Science, 62(9), 2626–2638. [Google Scholar] [CrossRef]
  25. Cadsby, C. B., Hamaguchi, Y., Kawagoe, T., Maynes, E., & Song, F. (2007). Cross-national gender differences in behavior in a threshold public goods game: Japan versus Canada. Journal of Economic Psychology, 28(2), 242–260. [Google Scholar] [CrossRef]
  26. Cardenas, J. C., Rodriguez, L. A., & Johnson, N. (2010). Collective action for watershed management: Field experiments in Colombia and Kenya. Environment and Development Economics, 16(3), 275–303. [Google Scholar] [CrossRef]
  27. Carpenter, J. P., Daniere, A. G., & Takahashi, L. M. (2004). Cooperation, trust, and social capital in Southeast Asian urban slums. Journal of Economic Behavior & Organization, 55(4), 533–551. [Google Scholar] [CrossRef]
  28. Cartwright, E. J., & Lovett, D. (2014). Conditional cooperation and the marginal per capita return in Public Good Games. Games, 5(4), 234–256. [Google Scholar] [CrossRef]
  29. Casler, K., Bickel, L., & Hackett, E. (2013). Separate but equal? A comparison of participants and data gathered via Amazon’s MTurk, social media, and face-to-face behavioral testing. Computers in Human Behavior, 29(6), 2156–2160. [Google Scholar] [CrossRef]
  30. Chaudhuri, A., Graziano, S., & Maitra, P. (2006). Social learning and norms in a public goods experiment with inter-generational advice. The Review of Economic Studies, 73(2), 357–380. [Google Scholar] [CrossRef]
  31. Cherry, T. L., McEvoy, D. M., & Sælen, H. (2017). Conditional cooperation and cultural worldviews. Economics Letters, 158, 51–53. [Google Scholar] [CrossRef]
  32. Colasante, A., García-Gallego, A., Georgantzis, N., Morone, A., & Temerario, T. (2019). Intragroup competition in public good games: The role of relative performance incentives and risk attitudes. Journal of Public Economic Theory, 21(5), 847–865. [Google Scholar] [CrossRef]
  33. Cox, C. A., & Stoddard, B. (2018). Strategic thinking in public goods games with teams. Journal of Public Economics, 161, 31–43. [Google Scholar] [CrossRef]
  34. Cubitt, R., Gächter, S., & Quercia, S. (2017). Conditional cooperation and betrayal aversion. Journal of Economic Behavior & Organization, 141, 110–121. [Google Scholar] [CrossRef]
  35. Czibor, A., & Bereczkei, T. (2010). Ki nyeri meg a versenyt? Egy kompetitív kísérleti játék tanulságai. [Who will win the competition? Personality, strategy and success in a competitive game.]. Magyar Pszichológiai Szemle, 65(1), 165–182. [Google Scholar] [CrossRef]
  36. Daikeler, J., Bošnjak, M., & Lozar Manfreda, K. (2019). Web versus other survey modes: An updated and extended meta-analysis comparing response rates. Journal of Survey Statistics and Methodology, 8(3), 513–539. [Google Scholar] [CrossRef]
  37. Dal Bó, P., & Fréchette, G. R. (2011). The evolution of cooperation in infinitely repeated games: Experimental evidence. American Economic Review, 101(1), 411–429. [Google Scholar] [CrossRef]
  38. Dal Bó, P., & Fréchette, G. R. (2018). On the determinants of cooperation in infinitely repeated games: A survey. Journal of Economic Literature, 56(1), 60–114. [Google Scholar] [CrossRef]
  39. Dal Bó, P., & Fréchette, G. R. (2019). Strategy choice in the infinitely repeated Prisoner’s Dilemma. American Economic Review, 109(11), 3929–3952. [Google Scholar] [CrossRef]
  40. Dariel, A., & Nikiforakis, N. (2014). Cooperators and reciprocators: A within-subject analysis of pro-social behavior. Economics Letters, 122(2), 163–166. [Google Scholar] [CrossRef]
  41. de Oliveira, A. C. M., Croson, R. T. A., & Eckel, C. (2015). One bad apple? Heterogeneity and information in public good provision. Experimental Economics, 18(1), 116–135. [Google Scholar] [CrossRef]
  42. Diederich, J., Goeschl, T., & Waichman, I. (2016). Group size and the (in)efficiency of pure public good provision. European Economic Review, 85, 272–287. [Google Scholar] [CrossRef]
  43. Dodou, D., & de Winter, J. C. F. (2014). Social desirability is the same in offline, online, and paper surveys: A meta-analysis. Computers in Human Behavior, 36, 487–495. [Google Scholar] [CrossRef]
  44. Eckel Catherine, C. (2015). Four classic public goods experiments: A replication study. In H. Harwell (Ed.), Replication in experimental economics (Vol. 18, pp. 13–40). Emerald Group Publishing Limited. [Google Scholar]
  45. Falk, A., Becker, A., Dohmen, T., Enke, B., Huffman, D., & Sunde, U. (2018). Global evidence on economic preferences. The Quarterly Journal of Economics, 133(4), 1645–1692. [Google Scholar] [CrossRef]
  46. Falk, A., Becker, A., Dohmen, T., Huffman, D., & Sunde, U. (2023). The preference survey module: A validated instrument for measuring risk, time, and social preferences. Management Science, 69(4), 1935–1950. [Google Scholar] [CrossRef]
  47. Fallucchi, F., Luccasen, R. A., & Turocy, T. L. (2019). Identifying discrete behavioural types: A re-analysis of public goods game contributions by hierarchical clustering. Journal of the Economic Science Association, 5(2), 238–254. [Google Scholar] [CrossRef]
  48. Fehr, E., & Schmidt, K. M. (1999). A theory of fairness, competition, and cooperation. The Quarterly Journal of Economics, 114(3), 817–868. [Google Scholar] [CrossRef]
  49. Ferraro, P. J., & Vossler, C. A. (2010). The source and significance of confusion in Public Goods experiments. The B.E. Journal of Economic Analysis & Policy, 10(1), 53. [Google Scholar] [CrossRef]
  50. Fischbacher, U., & Gächter, S. (2010). Social preferences, beliefs, and the dynamics of free riding in Public Goods experiments. The American Economic Review, 100(1), 541–556. [Google Scholar] [CrossRef]
  51. Fischbacher, U., Gächter, S., & Fehr, E. (2001). Are people conditionally cooperative? Evidence from a public goods experiment. Economics Letters, 71(3), 397–404. [Google Scholar] [CrossRef]
  52. Fischbacher, U., Gächter, S., & Quercia, S. (2012). The behavioral validity of the strategy method in public good experiments. Journal of Economic Psychology, 33(4), 897–913. [Google Scholar] [CrossRef]
  53. Fischbacher, U., Schudy, S., & Teyssier, S. (2014). Heterogeneous reactions to heterogeneity in returns from public goods. Social Choice and Welfare, 43(1), 195–217. [Google Scholar] [CrossRef]
  54. Fosgaard, T. R., Hansen, L. G., & Wengström, E. (2014). Understanding the nature of cooperation variability. Journal of Public Economics, 120, 134–143. [Google Scholar] [CrossRef]
  55. Fosgaard, T. R., & Piovesan, M. (2016). Nudge for (the Public) Good: How defaults can affect cooperation. PLoS ONE, 10(12), e0145488. [Google Scholar] [CrossRef] [PubMed]
  56. Frey, U. J. (2017). Cooperative strategies outside the laboratory—Evidence from a long-term large-N-study in five countries. Evolution and Human Behavior, 38(1), 109–116. [Google Scholar] [CrossRef]
  57. Gächter, S., & Fages, D. M. (2023). Using the strategy method and elicited beliefs to explain group size and MPCR effects in Public Good experiments. IZA Discussion Paper 16605. IZA—Institute of Labor Economics. [Google Scholar] [CrossRef]
  58. Gächter, S., Herrmann, B., & Thöni, C. (2004). Trust, voluntary cooperation, and socio-economic background: Survey and experimental evidence. Journal of Economic Behavior & Organization, 55(4), 505–531. [Google Scholar] [CrossRef]
  59. Gächter, S., Herrmann, B., & Thöni, C. (2010). Culture and cooperation. Philosophical Transactions of the Royal Society B: Biological Sciences, 365(1553), 2651–2661. [Google Scholar] [CrossRef]
  60. Gächter, S., Kölle, F., & Quercia, S. (2017). Reciprocity and the tragedies of maintaining and providing the commons. Nature Human Behaviour, 1(9), 650–656. [Google Scholar] [CrossRef]
  61. Gächter, S., Kölle, F., & Quercia, S. (2022). Preferences and perceptions in provision and maintenance public goods. Games and Economic Behavior, 135, 338–355. [Google Scholar] [CrossRef]
  62. Grandjean, G., Lefebvre, M., & Mantovani, M. (2022). Preferences and strategic behavior in public goods games. Journal of Economic Behavior & Organization, 195, 171–185. [Google Scholar] [CrossRef]
  63. Granulo, A., Kerschreiter, R., & Kocher, M. G. (2023). Cooperation and confusion in public goods games: Confusion cannot explain contribution patterns. Journal of the Economic Science Association, 9(2), 308–318. [Google Scholar] [CrossRef]
  64. Griskevicius, V., Delton, A. W., Robertson, T. E., & Tybur, J. M. (2011a). Environmental contingency in life history strategies: The influence of mortality and socioeconomic status on reproductive timing. Journal of Personality and Social Psychology, 100(2), 241–254. [Google Scholar] [CrossRef] [PubMed Central]
  65. Griskevicius, V., Tybur, J. M., Delton, A. W., & Robertson, T. E. (2011b). The influence of mortality and socioeconomic status on risk and delayed rewards: A life history theory approach. Journal of Personality and Social Psychology, 100(6), 1015–1026. [Google Scholar] [CrossRef] [PubMed Central]
  66. Guilfoos, T., & Kurtz, K. J. (2017). Evaluating the role of personality trait information in social dilemmas. Journal of Behavioral and Experimental Economics, 68, 119–129. [Google Scholar] [CrossRef]
  67. Hagen, E. H., & Hammerstein, P. (2006). Game theory and human evolution: A critique of some recent interpretations of experimental games. Theoretical Population Biology, 69, 339–348. [Google Scholar] [CrossRef]
  68. Hardin, G. (1968). The tragedy of the commons. Science, 162, 1243–1248. [Google Scholar] [CrossRef] [PubMed]
  69. Hartig, B., Irlenbusch, B., & Kölle, F. (2015). Conditioning on what? Heterogeneous contributions and conditional cooperation. Journal of Behavioral and Experimental Economics, 55, 48–64. [Google Scholar] [CrossRef]
  70. Hergueux, J., & Jacquemet, N. (2015). Social preferences in the online laboratory: A randomized experiment. Experimental Economics, 18(2), 251–283. [Google Scholar] [CrossRef]
  71. Herrmann, B., & Thöni, C. (2009). Measuring conditional cooperation: A replication study in Russia. Experimental Economics, 12(1), 87–92. [Google Scholar] [CrossRef]
  72. Herrmann, B., Thöni, C., & Gächter, S. (2008). Antisocial punishment across societies. Science, 319(5868), 1362–1367. [Google Scholar] [CrossRef]
  73. Hiraishi, K., Shikishima, C., Yamagata, S., & Ando, J. (2015). Heritability of decisions and outcomes of public goods games. Frontiers in Psychology, 6, 373. [Google Scholar] [CrossRef]
  74. Isaac, R. M., Walker, J. M., & Williams, A. W. (1994). Group size and the voluntary provision of public goods: Experimental evidence utilizing large groups. Journal of Public Economics, 54(1), 1–36. [Google Scholar] [CrossRef]
  75. Ishii, K., & Kurzban, R. (2008). Public Goods Games in Japan. Human Nature, 19(2), 138–156. [Google Scholar] [CrossRef]
  76. Isler, O., Gächter, S., Maule, A. J., & Starmer, C. (2021). Contextualised strong reciprocity explains selfless cooperation despite selfish intuitions and weak social heuristics. Scientific Reports, 11(1), 13868. [Google Scholar] [CrossRef] [PubMed]
  77. Kamei, K. (2012). From locality to continent: A comment on the generalization of an experimental study. The Journal of Socio-Economics, 41(2), 207–210. [Google Scholar] [CrossRef]
  78. Kaplan, H. S., Hooper, P. L., & Gurven, M. (2009). The evolutionary and ecological roots of human social organization. Philosophical Transactions of the Royal Society B: Biological Sciences, 364(1533), 3289–3299. [Google Scholar] [CrossRef] [PubMed]
  79. Katuščák, P., & Miklánek, T. (2023). What drives conditional cooperation in public good games? Experimental Economics, 26(2), 435–467. [Google Scholar] [CrossRef]
  80. Katuščák, P., & Nikolaychuk, O. (Eds.). (2023). How unconditional is conditional cooperation? Center for Economic Research and Graduate Education. [Google Scholar]
  81. Keil, J., Michel, A., Sticca, F., Leipold, K., Klein, A. M., Sierau, S., von Klitzing, K., & White, L. O. (2017). The Pizzagame: A virtual public goods game to assess cooperative behavior in children and adolescents. Behavior Research Methods, 49(4), 1432–1443. [Google Scholar] [CrossRef] [PubMed]
  82. Kocher, M. G., Cherry, T., Kroll, S., Netzer, R. J., & Sutter, M. (2008). Conditional cooperation on three continents. Economics Letters, 101(3), 175–178. [Google Scholar] [CrossRef]
  83. Kocher, M. G., Martinsson, P., Matzat, D., & Wollbrant, C. (2015). The role of beliefs, trust, and risk in contributions to a public good. Journal of Economic Psychology, 51, 236–244. [Google Scholar] [CrossRef]
  84. Koopmans, R., & Rebers, S. (2009). Collective action in culturally similar and dissimilar groups: An experiment on parochialism, conditional cooperation, and their linkages. Evolution and Human Behavior, 30(3), 201–211. [Google Scholar] [CrossRef]
  85. Kumar, P., & Kant, S. (2016). Revealed social preferences and joint forest management outcomes. Forest Policy and Economics, 72, 37–45. [Google Scholar] [CrossRef]
  86. Lamba, S., & Mace, R. (2011). Demography and ecology drive variation in cooperation across human populations. Proceedings of the National Academy of Sciences, USA, 108(35), 14426–14430. [Google Scholar] [CrossRef]
  87. Ledyard, J. O. (1995). Public Goods: A survey of experimental research. In J. Kagel, & A. Roth (Eds.), Handbook of experimental economics (pp. 111–194). Princeton University Press. [Google Scholar]
  88. Leibbrandt, A., Ramalingam, A., Sääksvuori, L., & Walker, J. M. (2015). Incomplete punishment networks in public goods games: Experimental evidence. Experimental Economics, 18(1), 15–37. [Google Scholar] [CrossRef]
  89. Li, T., & Noussair, C. N. (2024). Conditional cooperation and group size: Experimental evidence from a public good game. Journal of the Economic Science Association, 10(1), 98–112. [Google Scholar] [CrossRef]
  90. List, J. A. (2004). Young, selfish and male: Field evidence of social preferences. The Economic Journal, 114(492), 121–149. [Google Scholar] [CrossRef]
  91. Lotito, G., Migheli, M., & Ortona, G. (2013). Is cooperation instinctive? Evidence from the response times in a public goods game. Journal of Bioeconomics, 15(2), 123–133. [Google Scholar] [CrossRef]
  92. Makowsky, M. D., Orman, W. H., & Peart, S. J. (2014). Playing with other people’s money: Contributions to public goods by trustees. Journal of Behavioral and Experimental Economics, 53, 44–55. [Google Scholar] [CrossRef]
  93. Markowska-Przybyła, U., & Ramsey, D. M. (2018). Gender as a factor determining declarations to cooperate and cooperative behaviour among Polish students. Economics and Sociology, 11(1), 218–232. [Google Scholar] [CrossRef]
  94. Martinsson, P., Pham-Khanh, N., & Villegas-Palacio, C. (2013). Conditional cooperation and disclosure in developing countries. Journal of Economic Psychology, 34, 148–155. [Google Scholar] [CrossRef]
  95. Martinsson, P., Villegas-Palacio, C., & Wollbrant, C. (2009). Conditional cooperation and social group—Experimental results from Colombia. Gothenburg University. [Google Scholar]
  96. Mertins, V., Schote, A. B., Hoffeld, W., Griessmair, M., & Meyer, J. (2011). Genetic susceptibility for individual cooperation preferences: The role of monoamine oxidase a gene (MAOA) in the voluntary provision of Public Goods. PLoS ONE, 6(6), e20959. [Google Scholar] [CrossRef]
  97. Muller, L., Sefton, M., Steinberg, R., & Vesterlund, L. (2008). Strategic behavior and learning in repeated voluntary contribution experiments. Journal of Economic Behavior & Organization, 67(3), 782–793. [Google Scholar] [CrossRef]
  98. Nagatsu, M., Larsen, K., Karabegovic, M., Székely, M., Mønster, D., & Michael, J. (2018). Making good cider out of bad apples—Signaling expectations boosts cooperation among would-be free riders. Judgment and Decision Making, 13(1), 137–149. [Google Scholar] [CrossRef]
  99. Neal, Z., Neal, J. W., & Piteo, A. (2020). Call me maybe: Using incentives and follow-ups to increase principals’ survey response rates. Journal of Research on Educational Effectiveness, 13(4), 784–793. [Google Scholar] [CrossRef]
  100. Neugebauer, T., Perote, J., Schmidt, U., & Loos, M. (2009). Selfish-biased conditional cooperation: On the decline of contributions in repeated public goods experiments. Journal of Economic Psychology, 30(1), 52–60. [Google Scholar] [CrossRef]
  101. Nielsen, U. H., Tyran, J.-R., & Wengström, E. (2014). Second thoughts on free riding. Economics Letters, 122(2), 136–139. [Google Scholar] [CrossRef]
  102. Nishi, A., Christakis, N. A., & Rand, D. G. (2017). Cooperation, decision time, and culture: Online experiments with American and Indian participants. PLoS ONE, 12(2), e0171252. [Google Scholar] [CrossRef]
  103. Orosz, G., Tóth-Király, I., Büki, N., Ivaskevics, K., Bőthe, B., & Fülöp, M. (2018). The four faces of competition: The development of the multidimensional competitive orientation inventory. Frontiers in Psychology, 9, 779. [Google Scholar] [CrossRef] [PubMed]
  104. Ostrom, E. (1990). Governing the commons: The evolution of institutions for collective action. Cambridge University Press. [Google Scholar]
  105. Oyediran, O. A., Rivas, M. F., Coulson, M., & Kernohan, D. (2018). Cooperation and optimism in a social dilemma. Bulletin of Economic Research, 70(4), 335–340. [Google Scholar] [CrossRef]
  106. Poynton, T. A., DeFouw, E. R., & Morizio, L. J. (2019). A systematic review of online response rates in four counseling journals. Journal of Counseling & Development, 97(1), 33–42. [Google Scholar] [CrossRef]
  107. Préget, R., Nguyen-Van, P., & Willinger, M. (2016). Who are the voluntary leaders? Experimental evidence from a sequential contribution game. Theory and Decision, 81(4), 581–599. [Google Scholar] [CrossRef]
  108. Rand, D. G., Greene, J. D., & Nowak, M. A. (2012). Spontaneous giving and calculated greed. Nature, 489(7416), 427–430. [Google Scholar] [CrossRef]
  109. Rand, D. G., & Nowak, M. A. (2013). Human cooperation. Trends in Cognitive Sciences, 17(8), 413–425. [Google Scholar] [CrossRef]
  110. Rand, D. G., Peysakhovich, A., Kraft-Todd, G. T., Newman, G. E., Wurzbacher, O., Nowak, M. A., & Greene, J. D. (2014). Social heuristics shape intuitive cooperation. Nature Communications, 5(1), 3677. [Google Scholar] [CrossRef]
  111. Rieger, M., & Mata, R. (2013). On the generality of age differences in social and nonsocial decision making. The Journals of Gerontology: Series B, 70(2), 200–212. [Google Scholar] [CrossRef] [PubMed]
  112. Romano, A., Balliet, D., Yamagishi, T., & Liu, J. H. (2017). Parochial trust and cooperation across 17 societies. Proceedings of the National Academy of Sciences, USA, 114(48), 12702–12707. [Google Scholar] [CrossRef] [PubMed]
  113. Romano, A., Sutter, M., Liu, J. H., Yamagishi, T., & Balliet, D. (2021). National parochialism is ubiquitous across 42 nations around the world. Nature Communications, 12(1), 4456. [Google Scholar] [CrossRef] [PubMed]
  114. Romero, J., & Rosokha, Y. (2023). Mixed strategies in the indefinitely repeated Prisoner’s Dilemma. Econometrica, 91(6), 2295–2331. [Google Scholar] [CrossRef]
  115. Rustagi, D., Engel, S., & Kosfeld, M. (2010). Conditional cooperation and costly monitoring explain success in forest commons management. Science, 330(6006), 961–965. [Google Scholar] [CrossRef]
  116. Sally, D. (1995). Conversation and cooperation in social dilemmas: A meta-analysis of experiments from 1958 to 1992. Rationality and Society, 7(1), 58–92. [Google Scholar] [CrossRef]
  117. Sammut, R., Griscti, O., & Norman, I. J. (2021). Strategies to improve response rates to web surveys: A literature review. International Journal of Nursing Studies, 123, 104058. [Google Scholar] [CrossRef]
  118. Schroeder, K. B., McElreath, R., & Nettle, D. (2013). Variants at serotonin transporter and 2A receptor genes predict cooperative behavior differentially according to presence of punishment. Proceedings of the National Academy of Sciences, USA, 110(10), 3955–3960. [Google Scholar] [CrossRef]
  119. Schroeder, K. B., Nettle, D., & McElreath, R. (2015). Interactions between personality and institutions in cooperative behaviour in humans. Philosophical Transactions of the Royal Society B: Biological Sciences, 370, 20150011. [Google Scholar] [CrossRef]
  120. Selten, R. (1967). Die Strategiemethode zur Erforschung des eingeschränkt rationalen Verhaltens im Rahmen eines Oligopolexperimente. In H. Sauermann (Ed.), Beiträge zur experimentellen Wirtschaftsforschung (pp. 136–168). J. C. B. Mohr. [Google Scholar]
  121. Siva Durga Prasad Nayak, M., & Narayan, K. A. (2019). Strengths and weaknesses of online surveys. IOSR Journal of Humanities and Social Sciences, 24(5), 31–38. [Google Scholar] [CrossRef]
  122. Soler, M. (2012). Costly signaling, ritual and cooperation: Evidence from Candomblé, an Afro-Brazilian religion. Evolution and Human Behavior, 33(4), 346–356. [Google Scholar] [CrossRef]
  123. Su, Z., Wei, G., & Binbin, F. (2015). Cognitive ability and cooperation: Evidence from the public goods experiments. Annals of Economics and Finance, 16(1), 43–68. [Google Scholar]
  124. Teyssier, S. (2012). Inequity and risk aversion in sequential public good games. Public Choice, 151(1), 91–119. [Google Scholar] [CrossRef]
  125. Thöni, C., Tyran, J.-R., & Wengström, E. (2012). Microfoundations of social capital. Journal of Public Economics, 96(7), 635–643. [Google Scholar] [CrossRef]
  126. Thöni, C., & Volk, S. (2018). Conditional cooperation: Review and refinement. Economics Letters, 171, 37–40. [Google Scholar] [CrossRef]
  127. van Hoorn, J., van Dijk, E., Meuwese, R., Rieffe, C., & Crone, E. A. (2016). Peer influence on prosocial behavior in adolescence. Journal of Research on Adolescence, 26(1), 90–100. [Google Scholar] [CrossRef]
  128. Vásárhelyi, Z., & Scheuring, I. (2018). Behavioral specialization during the Neolithic—An evolutionary model. Frontiers in Sociology, 3, 35. [Google Scholar] [CrossRef]
  129. Vogelsang, M., Jensen, K., Kirschner, S., Tennie, C., & Tomasello, M. (2014). Preschoolers are sensitive to free riding in a public goods game. Frontiers in Psychology, 5, 729. [Google Scholar] [CrossRef]
  130. Volk, S., Thöni, C., & Ruigrok, W. (2012). Temporal stability and psychological foundations of cooperation preferences. Journal of Economic Behavior & Organization, 81(2), 664–676. [Google Scholar] [CrossRef]
  131. Vollan, B., Landmann, A., Zhou, Y., Hu, B., & Herrmann-Pillath, C. (2017). Cooperation and authoritarian values: An experimental study in China. European Economic Review, 93, 90–105. [Google Scholar] [CrossRef]
  132. Weber, T. O., Schulz, J. F., Beranek, B., Lambarraa-Lehnhardt, F., & Gächter, S. (2023). The behavioral mechanisms of voluntary cooperation across culturally diverse societies: Evidence from the US, the UK, Morocco, and Turkey. Journal of Economic Behavior & Organization, 215, 134–152. [Google Scholar] [CrossRef]
  133. Weber, T. O., Weisel, O., & Gächter, S. (2018). Dispositional free riders do not free ride on punishment. Nature Communications, 9(1), 2390. [Google Scholar] [CrossRef] [PubMed]
  134. Whitt, S., & Wilson, R. K. (2007). Public goods in the field: Katrina evacuees in Houston. Southern Economic Journal, 74(2), 377–387. [Google Scholar] [CrossRef]
  135. Wu, M.-J., Zhao, K., & Fils-Aime, F. (2022). Response rates of online surveys in published research: A meta-analysis. Computers in Human Behavior Reports, 7, 100206. [Google Scholar] [CrossRef]
  136. Yamakawa, T., Okano, Y., & Saijo, T. (2016). Detecting motives for cooperation in public goods experiments. Experimental Economics, 19(2), 500–512. [Google Scholar] [CrossRef]
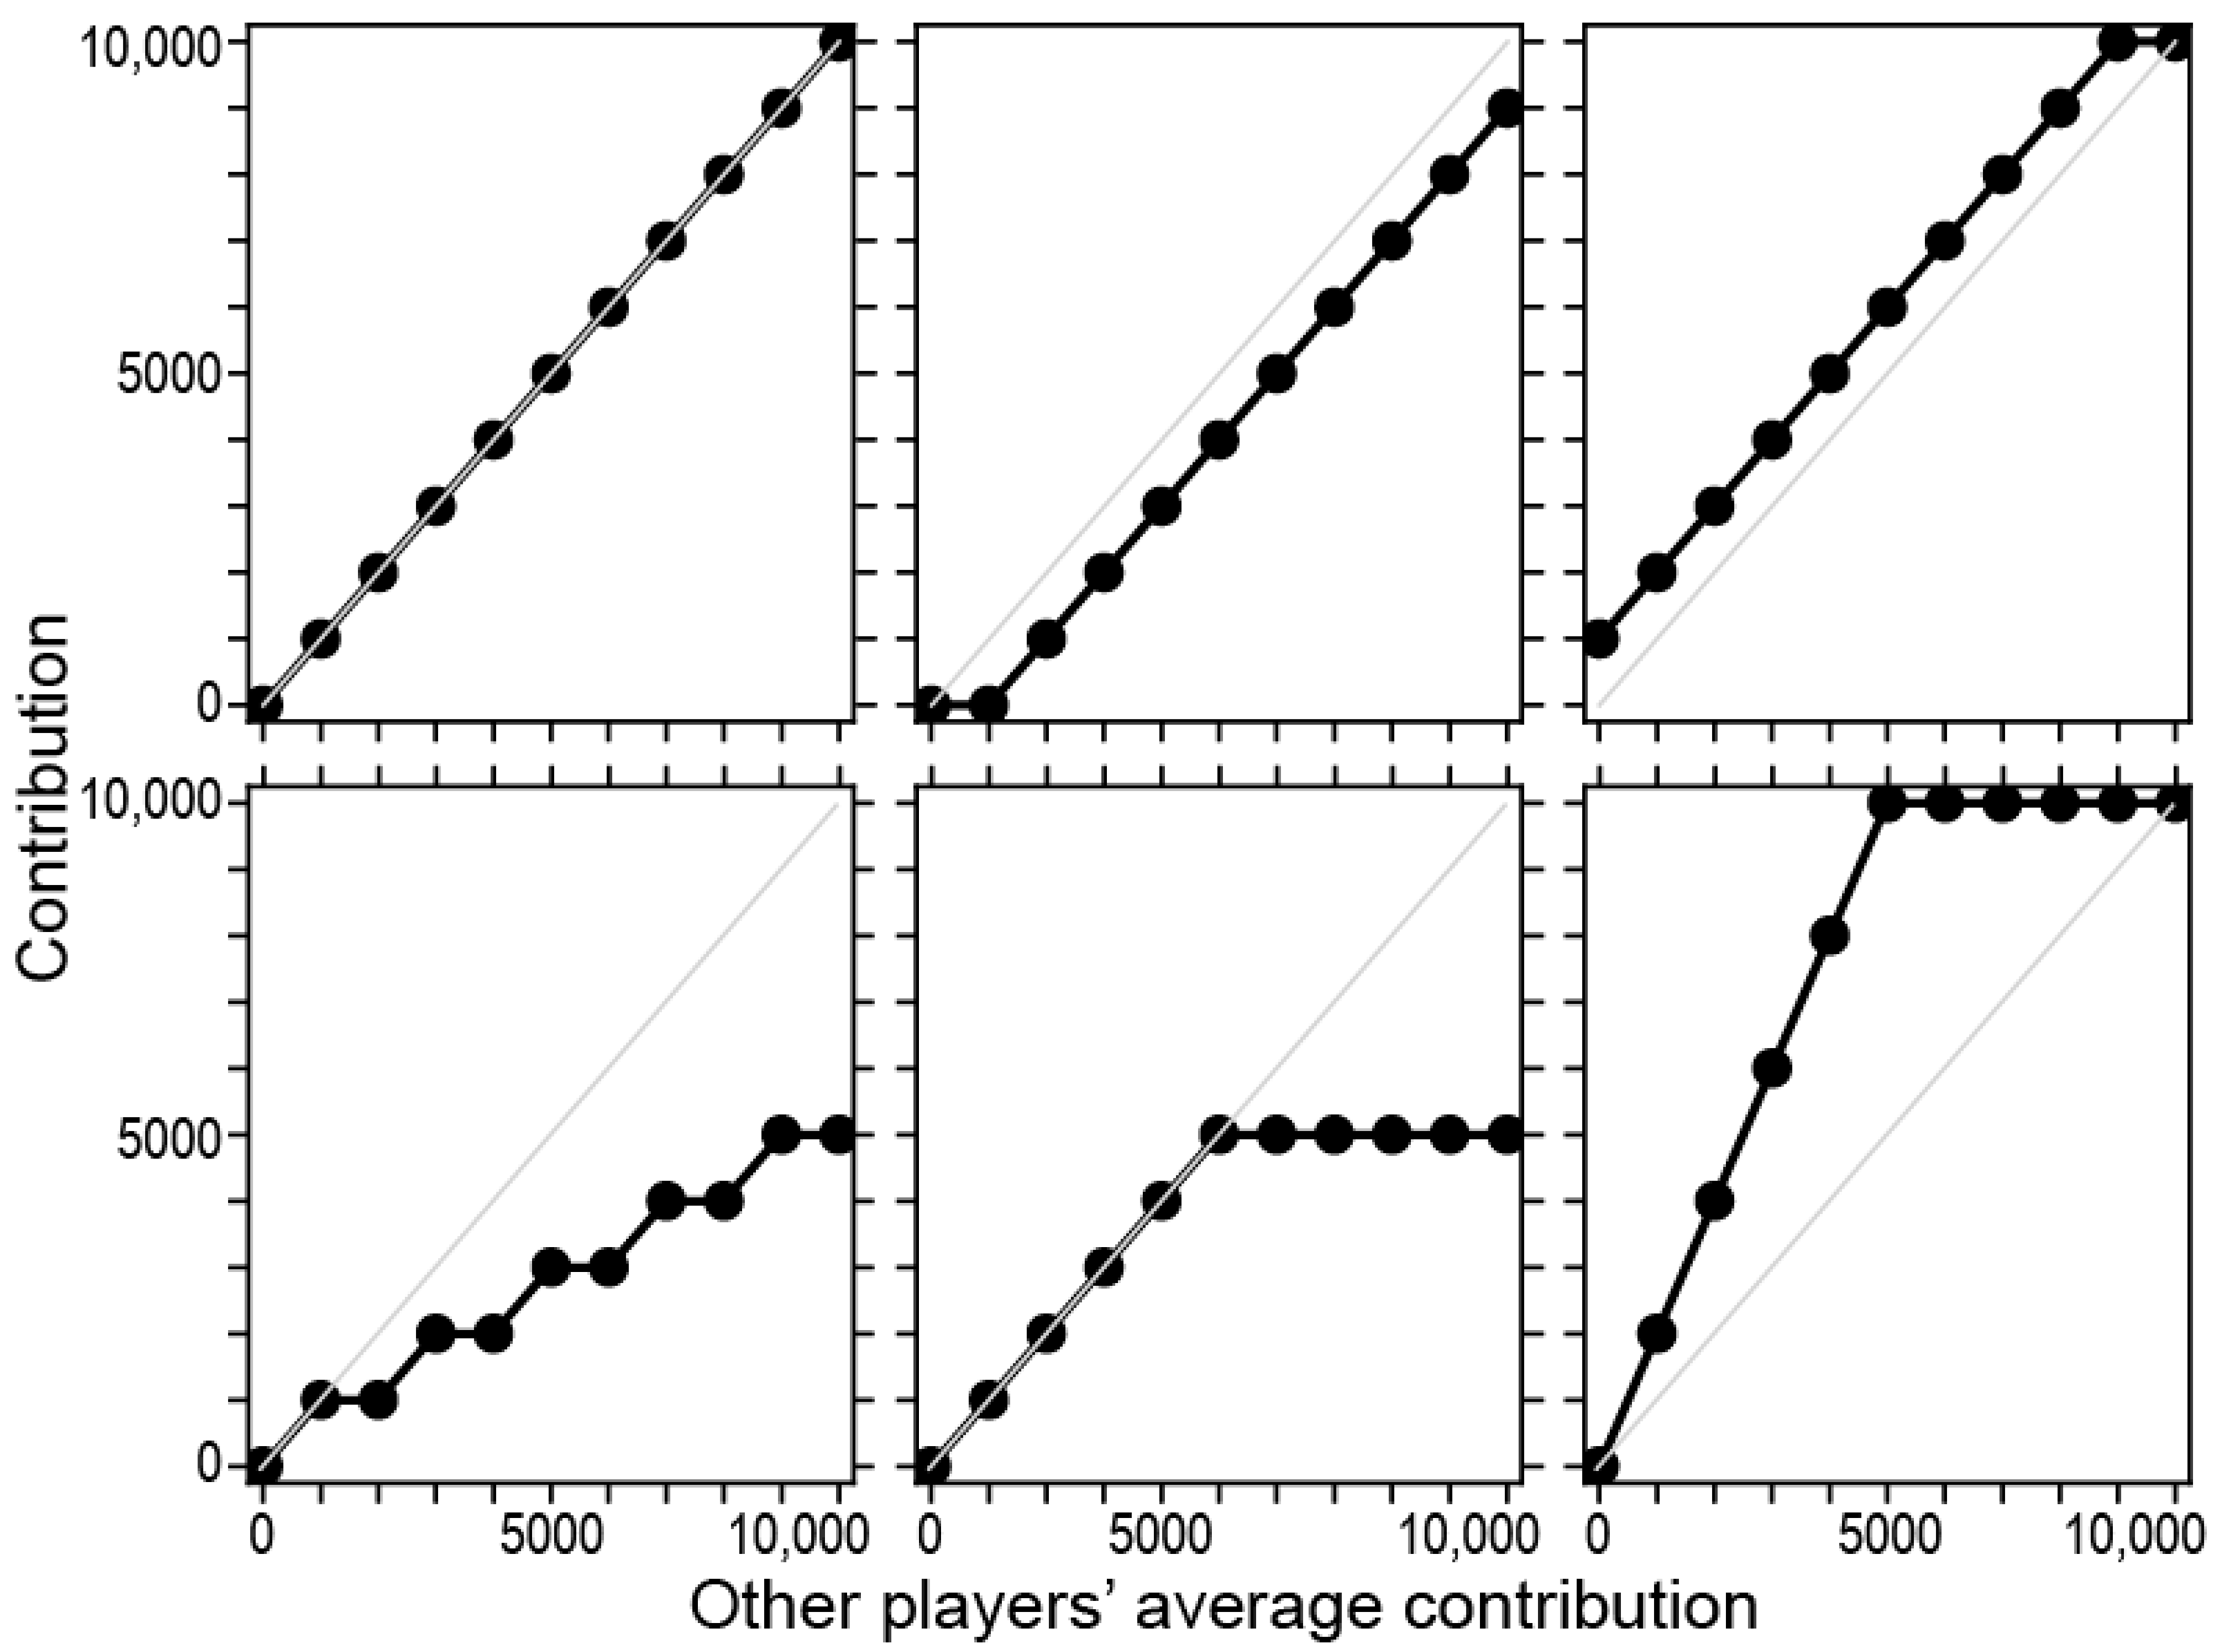
Figure 1. Different conditional cooperators. The top left panel shows a perfect conditional cooperator. The next panel shows a contribution pattern in which contributions are consistently 10% less (top center) or 10% more (top right) compared to the perfect conditional cooperator. In the bottom row, the first two panels show conditional free riders, and the rightmost one shows a conditional cooperator.
Games 16 00022 g001
Figure 2. Frequency of the given investment to the common pool among the respondents.
Games 16 00022 g002
Figure 3. Minor contribution types: hump-shaped contributors and V-shaped contributors. The examples are as found in our dataset. The gray lines depict the quintessential form of such contribution patterns and are given as reference.
Games 16 00022 g003
Figure 4. Contribution patterns that might fall into more than one category. We did not find such examples, but because they may exist, the rule for categorization needs to be exact.
Games 16 00022 g004
Table 1. Distribution of contribution types from the literature.
ConditionalFree RiderHump-ShapedUnc. CooperatorNumber of ParticipantsCountryRef.
5029.513.6-44Switzerland(Fischbacher et al., 2001)
80.68.3--36USA(Kocher et al., 2008)
41.736.111.1-36Japan(Kocher et al., 2008)
44.422.211.1-36Austria(Kocher et al., 2008)
3835151.660UK(Muller et al., 2008)
58.314.68.3-96Colombia(Martinsson et al., 2009)
55.56.37.5-160Russia(Herrmann & Thöni, 2009)
552312-140Switzerland(Fischbacher & Gächter, 2010)
34.011.52.952.2679Ethiopia(Rustagi et al., 2010)
58.325.013.9-724(Volk et al., 2012)
55.022.912.11.4140Switzerland(Fischbacher et al., 2012)
6915--1488Denmark(Thöni et al., 2012)
50.025.714.0-350USA(Kamei, 2012)
47.823.315.1-272USA(Aimone et al., 2013)
62.54.28.3-48Colombia(Martinsson et al., 2013)
50.04.28.3-48Vietnam(Martinsson et al., 2013)
63.222.89.6-228Germany(Fischbacher et al., 2014)
66.72--48The Netherlands and Switzerland(Dariel & Nikiforakis, 2014)
6815--1366Denmark(Fosgaard et al., 2014; Nielsen et al., 2014)
5113.517.7-96USA(Makowsky et al., 2014)
71.06.53.2-31UK(Cartwright & Lovett, 2014)
6324--128Germany(Hartig et al., 2015)
43.624.8--296Japan(Hiraishi et al., 2015)
58.1320.1611.63-144Germany(Kocher et al., 2015)
67. 815.54.0-174UK(Abeler & Nosenzo, 2015)
54.46.56.515.246Denmark(Fosgaard & Piovesan, 2016)
502110-72UK(Burton-Chellew et al., 2016)
37.522.515.0-40France(Préget et al., 2016)
81.76.76.7-36Germany(Björk et al., 2016)
73.616.96-201USA 3(Cherry et al., 2017)
499.54.54299China(Vollan et al., 2017)
59.725.6- 1-592UK(Cubitt et al., 2017)
6417--444UK(Gächter et al., 2017)
48.926.6--184UK(Weber et al., 2018)
56.421.6--227Denmark(Nagatsu et al., 2018)
6612-2134Italy(Bigoni et al., 2019)
6721.67.5-134Italy(Andreozzi et al., 2020)
42339-88Czech Republic(Katuščák & Nikolaychuk, 2023)
57.43.1--3653UK(Isler et al., 2021)
50011.1-36Italy(Bergantino et al., 2023)
808--703USA(Gächter et al., 2022)
7610--845Switzerland(Burton-Chellew et al., 2022)
64.425.2-250USA/UK(Bilancini et al., 2022)
50305.2-192France(Grandjean et al., 2022)
57.612.012.6-192Czech Republic(Katuščák & Miklánek, 2023)
63.415.16.5-93Germany(Granulo et al., 2023)
551122.6-106USA(Weber et al., 2023)
522218.2-88UK(Weber et al., 2023)
48828.7-80Morocco(Weber et al., 2023)
47207-86Turkey(Weber et al., 2023)
47.720.115.61.566USA(Li & Noussair, 2024)
80.46.80.71.5265HungaryThis study
The percentages of conditional cooperators, free riders, hump-shaped cooperators (or triangular cooperators), and unconditional full cooperators are given. The remaining percentage falls under the “others” category, which is not displayed here—this category was not reported in the studies. 1 There were triangular cooperators in the sample, but too few, and so these respondents were categorized as “others”. 2 All non-cooperators were pooled into the “others” category. We cannot distinguish between the categories. 3 The experiment was conducted via Mechanical Turk, and so subjects could come from any country. 4 The method only states that the experiment was conducted in a European university.
Table 2. Frequencies of cooperation types according to the new categorization.
Cooperation TypeNumber FoundPercentage
Unconditional cooperators41.5%
Unconditional free riders2810.6%
Perfect conditional cooperators11342.6%
Hump-shaped contributors20.7%
V-shaped contributors10.4%
Conditional cooperators4416.6%
Conditional free riders3613.6%
Conditional contributors176.4%
Negative conditional contributors00.0%
Others207.6%
Table 3. Determinants of contribution in the public goods game.
CharacteristicStandardized Coefficient
Beta
p-Value
Sex−0.0550.385
Age−0.1210.168
Highest completed education−0.0720.297
Student−0.0440.664
Worker0.0610.479
Size of the residential settlement−0.1010.102
Self-developmental competitive orientation0.1450.116
Anxiety-driven competition avoidance−0.0430.648
Lack of interest in competition0.0160.843
Hypercompetitive orientation−0.1760.010
Fear of losing competition0.1150.162
Past resource availability−0.0300.654
Present resource availability0.1120.116
Risk-taking self-assessment0.1330.048
Risk-taking lottery method−0.1130.077
The lines in bold highlight statistically significant characteristics.
Disclaimer/Publisher’s Note: The statements, opinions and data contained in all publications are solely those of the individual author(s) and contributor(s) and not of MDPI and/or the editor(s). MDPI and/or the editor(s) disclaim responsibility for any injury to people or property resulting from any ideas, methods, instructions or products referred to in the content.