1. Introduction
Financial exchanges nowadays operate almost entirely electronically, supporting automation of trading and consequential scaling of volume and speed across geography and asset classes. With data and information streaming on an extremely short timescale, often below the limits of human response time, autonomous trading agents directed by algorithms operate on behalf of human traders. Such increasing automation has transformed the financial market landscape from a human decision ecosystem to an algorithmic one, where autonomous agents learn new information, make decisions and interact with each other at an unprecedented speed and complexity. Whereas these developments in market operation and trading technology may contribute to improved efficiency, they also introduce risks, such as the potential for new forms of manipulative practice driven by algorithms.
Market manipulation is defined by the U.S. Securities and Exchange Commission (SEC) as “intentional or willful conduct designed to deceive or defraud investors by controlling or artificially affecting the price of securities, or intentional interference with the free forces of supply and demand”. Although it has long been present, the practice has also evolved in its forms to exploit automated trading and the dissemination of market information offered by many trading platforms [
1]. Computer programs are employed to inject deceitful information, as other investors use algorithms to extract information from all possible sources (including the misleading ones) and execute decisions accordingly. On 21 April 2015, nearly five years after the “Flash Crash”—a sudden trillion-dollar dip in U.S. stock markets on 6 May 2010, during which stock indexes collapsed and rebounded rapidly [
2], the U.S. Department of Justice charged Navinder Singh Sarao with 22 criminal counts, including fraud and market manipulation. Prior to the Flash Crash, Sarao allegedly used an algorithm to place orders amounting to about
million seemingly betting that the market would fall and later replaced or modified those orders 19,000 times before cancellation. The U.S. Commodity Futures Trading Commission (CFTC) concluded that Sarao’s manipulative practice was responsible for significant order imbalances. Although recent analysis has cast doubt on the causal role of Sarao on the Flash Crash [
3], many agree that such manipulation could increase the vulnerability of markets and exacerbate market fluctuations.
The specific form of manipulation we examine in this paper,
spoofing, operates through a series of direct trading actions in a market. Traders interact with the market by submitting orders to buy or sell. Orders that do not transact immediately rest in the
order book, a repository for outstanding orders to trade. At any given time, the order book for a particular security reflects the market’s expressed supply and demand. Spoofing refers to the practice of submitting large
spurious buy or sell orders with the intent to cancel them before execution. The orders are spurious in that instead of expressing genuine trading intent, they feign a strong buy or sell interest in the market, thus corrupting the order book’s signal on supply and demand. Other traders are then misled by the spoof orders to believe that prices may soon rise or fall, thus altering their own behavior in a way that will directly move the price. To profit on its feint, the manipulator can submit a real order on the opposite side of the market and, as soon as the real order transacts, cancel all the spoof orders.
Figure 1 illustrates an alleged spoofing activity conducted over the course of 0.6 s, demonstrating how quickly and effectively such manipulation behavior can affect the market and profit from the spoofed belief.
In 2010, the Dodd–Frank Wall Street Reform and Consumer Protection Act was signed into U.S. law, outlawing spoofing as a deceptive practice. In describing its concern about spoofing, the CFTC notes that “many market participants, relying on the information contained in the order book, consider the total relative number of bid and ask offers in the order book when making trading decisions”. In fact, spoofing can be effective only to the extent that traders actually use order book information to make trading decisions. In ideal markets without manipulation, traders may extract useful information from the order book, making more informed decisions over those that neglect such information. A manipulator exploits such learning process, minimizing its own risk in the process. Spoof orders are typically placed at price levels just outside the current best quotes to mislead other investors and withdrawn with high probability before any market movement could trigger a trade [
4,
5].
We aim to reproduce spoofing in a computational model, as a first step toward developing more robust measures to characterize and prevent spoofing.
Figure 2 gives an overview of our agent-based market model. The model implements a
continuous double auction (CDA) market with a single security traded. The CDA is a two-sided mechanism adopted by most financial and commodity markets [
6]. Traders can submit limit orders at any time, and, whenever an incoming order matches an existing one, they trade at the incumbent order’s limit price. We adopt an agent-based modeling approach to simulate the interactions among players with different strategies. The market is populated with multiple background traders and in selected treatments, one manipulator who executes the spoofing strategy. Background traders are further divided to follow two types of trading strategies:
zero intelligence (ZI) that ignores the order book and
heuristic belief learning (HBL) that learns from the order book to predict price outcomes. Upon each arrival to trade, a background trader receives a noisy observation of the security’s fundamental value. Based on a series of fundamental observations and its private value, a ZI agent computes the limit-order price by shading a random offset from its valuation, and thus it is non-manipulable. An HBL agent, on the other hand, is susceptible to spoofing: it considers information about orders recently submitted to the market, estimates the probability that orders at various prices would be transacted and chooses the optimal price to maximize expected surplus. The manipulator in our model executes a spoofing strategy similar to that illustrated in
Figure 1. The spoofer injects and maintains large spurious buy orders at one tick behind the best bid, designed to manipulate the market by misleading others about the level of demand.
We conduct extensive simulation over hundreds of strategy profiles across parametrically different market environments with and without manipulation. The simulation data are used to estimate normal-form game models over the strategies explored in agent-based simulation. From these models, we derive empirical equilibria, where every agent chooses its best response within the set of available strategies to both the market environment and others’ behavior. Studying behavior in (empirical) equilibrium provides robustness to designer choices in agent-based modeling, selecting behaviors based on a rationality criterion [
7]. Although the strategies considered in this game model are restricted compared to the true underlying game (where any conceivable trading strategy is possible), imposing a rationality filter on the set considered accounts for strategic response to different settings and ensures that we are evaluating the most relevant configurations of available strategies.
Our fundamental goals of this work are: (1) to reproduce spoofing and understand its impact on market performance (
Section 5); and (2) to propose and evaluate variations of market designs (
Section 6) and learning-based trading strategies (
Section 7) in mitigating manipulation. Below, we overview the structure of the paper and summarize our main contributions and results.
Roadmap
We start by reproducing spoofing in an agent-based model and evaluating its impact on background traders.
Section 3 introduces the design of our CDA market model and parameterized trading strategies.
Section 4 describes the empirical game-theoretic analysis (EGTA) methodology [
7], which we adopt for finding equilibria in games defined by heuristic strategy space and simulated payoff data.
Section 5 addresses the choice of background traders among HBL and ZI strategies in markets with and without spoofing. We demonstrate through EGTA that, in a range of non-spoofing environments, HBL is preferred in equilibrium and benefits price discovery and social welfare. However, this renders a market vulnerable to manipulation: by executing a spoofer against the equilibrium profiles, we show that simple spoofing strategies can manipulate prices in a desired direction. After re-equilibrating games with spoofing, we find HBL still persists in equilibria but with smaller mixture probability, suggesting a consistently spoofable market. Although the welfare benefits of HBL remain, the presence of spoofing decreases market surplus.
Building on our computational model of spoofing, we investigate market mechanisms and trading strategies to mitigate spoofing without directly detecting each individual activity. In
Section 6, we propose
a cloaking mechanism to deter spoofing. It adapts the way a standard order book discloses market information by symmetrically concealing a specified number of price levels from the inside of the book. The idea is to make it more difficult for the spoofer to post misleading bids, while not unduly degrading the general usefulness of market information. We characterize market conditions under which such cloaking may mitigate manipulation and benefit market welfare. We further design sophisticated spoofing strategies that probe to reveal cloaked information and demonstrate that the effort and risk of probing exceed the gains.
In
Section 7, we explore two variations of the standard HBL strategy to reduce the vulnerability of learning traders to spoofing. The first selectively ignores orders at certain price levels, particularly where spoof orders are likely to be placed. The second considers the full order book, but adjusts its limit order price to correct for bias in decisions based on the learned heuristic beliefs. We evaluate these variations on two criteria: effectiveness in non-manipulated markets and robustness against manipulation.
3. Market Model
We present the general structure of the agent-based financial market environment in which we model spoofing. Our model comprises agents trading a single security through a continuous double auction (CDA), the mechanism adopted by most financial markets today. We first describe the market mechanism in
Section 3.1. Our model is designed to capture key features of market microstructure (e.g., fundamental shocks and observation noise), supporting a configurable simulator to understand the effect of spoofing under different market conditions. The market is populated with multiple background traders who represent investors in the market, and in selected treatments, a spoofer who seeks trading profit through manipulative action. We specify the valuation model of background traders in
Section 3.2 and the two families of background-trader strategies in
Section 3.3. In
Section 3.4, we discuss the behavior of the spoofing agent.
3.1. Market Mechanism
The market employs a CDA mechanism with a single security traded. Prices are fine-grained and take discrete values at integer multiples of the tick size. Time is also fine-grained and discrete, with trading over a finite horizon T. Agents in the model submit limit orders, which specify the maximum (minimum) price at which they would be willing to buy (sell) together with the number of units to trade. Orders are immediately matched as they arrive: if at any time, one agent’s maximum price to buy a unit is greater than or equal to another agent’s minimum price to sell a unit, a transaction will occur and the agents trade at the price of the incumbent order.
The CDA market maintains a
limit order book of outstanding orders and provides information about the book to traders with zero delay. The buy side of the order book starts with
, the highest-price buy order at time
t, and extends to lower prices. Similarly, the sell side starts with
, the lowest-price sell order at time
t, and extends to higher prices. On order cancellation or transaction, the market removes the corresponding orders and updates the order book. Agents may use order book information at their own discretion. In
Section 6, we investigate how changes made in such order book disclosure may help to mitigate spoofing.
3.2. Valuation Model
Our valuation model combines individual (private) and fundamental (common) values for a security, following prior computational literature on financial markets [
13,
50]. The
fundamental value of the security at time
changes throughout the trading period according to a mean-reverting stochastic process:
The parameter
specifies the degree to which the value reverts back to a fundamental mean
. A process with
corresponds to a martingale Gaussian fundamental, whereas
specifies a process of i.i.d. Gaussian draws around the fundamental mean. A mean-reverting time series of this sort has been empirically observed in financial markets such as foreign exchange and commodity markets [
51]. The perturbation
captures a systematic random shock upon the fundamental at time
t and is normally distributed as
, where
represents an environment-specific shock variance. The shock variance governs fluctuations in the fundamental time series and consequently affects the predictability of future price outcomes.
Our time-varying fundamental induces adverse selection, a situation where outstanding orders reflect outdated information and thus can be at a disadvantage at the current time. If the fundamental shifts significantly, subsequent agents are more likely to transact with orders on the side opposite to the direction of fundamental change. That is, a positive price shock will tend to trigger transactions with stale sell orders, and a negative shock with stale buys. An agent’s exposure to adverse selection in a market is jointly controlled by the fundamental shock variance , the degree of mean reversion and the arrival rate of that agent.
The entries of a background trader follow a Poisson process with an arrival rate . Upon each entry, the trader observes an agent-and-time-specific noisy fundamental , where the observation noise is drawn from . Just as in real financial markets, investors will never know the true value of the underlying security, such noisy observations represent each trader’s assessment of the security’s fundamental value at that time. Given its incomplete information about the fundamental, the agent can potentially benefit by considering market information, which is influenced by and therefore reflects the aggregate observations of other agents. When it arrives, the trader withdraws its previous order (if untransacted) and submits a new single-unit limit order, either to buy or sell as instructed with equal probability.
The
individual (private) value of a background trader
i represents its preferences over holdings of the security:
The vector has length
, where
is the maximum position (long or short) a trader can hold at any time. Element
in the vector specifies the incremental private benefit
foregone by selling one unit of the security given a current net position of
q. Alternatively,
can be understood as the marginal private gain from buying an additional unit given current net position
q.
Private values follow the law of diminishing marginal utility observed in many economic settings, as well as commonly assumed for assets trading in financial markets [
13]. One natural example is when a trader is aiming for a target investment position. Before reaching this position, the private component is positive for each incremental share, and the more shares the trader needs to buy to reach the optimal position, the higher the marginal utility would be (as the agent is more eager to get close to the optimal position); after a trader passes her desired holding position, she gets negative private value an extra share (e.g., due to cumulative risk), and the more the position deviates from the optimal, the higher the penalty becomes. To capture this diminishing marginal utility, that is
for all
, we generate
from a set of
values drawn independently from
, sort elements in descending order and assign
to its respective value in the sorted list.
Agent
i’s incremental surplus for a trade can be calculated based on its position
q before the trade, the value of the fundamental at the end of the trading horizon
and the transaction price
p:
An agent’s total surplus is the sum of the agent’s incremental surplus over all transactions. Alternatively, we can also calculate an agent’s total surplus by adding its net cash from trading to the
final valuation of holdings. Specifically, the market’s final valuation of trader
i with ending holdings
H is
We define
background-trader surplus as the sum of all background agents’ surpluses at the end of the trading period
T.
3.3. Background Trading Agents
Recall that background traders represent investors with actual preferences for holding long or short positions in the underlying security. The limit-order price submitted by a background trader is jointly decided by its valuation and trading strategy, which we describe in detail below.
3.3.1. Estimating the Final Fundamental
As holdings of the security are evaluated at the end of a trading period (i.e., ), a background trader estimates the final fundamental value based on a series of its noisy observations. We assume the market environment parameters (mean reversion, shock variance, etc.) are common knowledge for background agents.
Given a new noisy observation
, an agent estimates the current fundamental by updating its posterior mean
and variance
in a Bayesian manner. Let
denote the agent’s preceding arrival time. We first update the previous posteriors,
and
, by mean reversion for the interval since preceding arrival, denoted
:
The estimates for the current arrive at time
t are then given by
Based on the posterior estimate of
, the trader computes
, its estimate at time
t of the terminal fundamental
, by adjusting for mean reversion:
3.3.2. Zero Intelligence (ZI) as a Background Trading Strategy
We consider parameterized trading strategies in the zero intelligence (ZI) family [
16]. Background traders who choose to adopt ZI strategies compute limit-order prices solely based on fundamental observations and private values. ZI agents generate bids reflecting a
requested surplus, determined by a random offset uniformly drawn from
. These bids shade from the agent’s valuation by this requested surplus. Specifically, a ZI trader
i arriving at time
t with position
q generates a limit price
Our version of ZI further considers the market’s current best quotes, and it can choose to immediately trade to get a certain fraction of its requested surplus. This option is governed by a strategic threshold parameter : if the agent could achieve a fraction of its requested surplus at the current price quote, it would simply take that quote rather than submitting a new limit order. Setting to 1 is equivalent to the strategy without a threshold. Both shading and threshold-taking provide some non-learning ways for ZI agents to strategically adapt to different market environments and improve profitability.
3.3.3. Heuristic Belief Learning (HBL) as a Background Trading Strategy
The second background trading strategy family we consider is heuristic belief learning (HBL). Background traders who choose to adopt HBL go beyond their own observations and private values by also considering order book information. We make a set of changes to adapt the strategy to our dynamic market environment, supporting multiple-unit trading with a flexible buy or sell role.
The strategy is centered on the belief function that a background trader forms on the basis of its observed market data. The agent uses the belief function to estimate the probability that orders at various prices would be accepted in the market and then chooses a limit price that maximizes its expected surplus at current valuation estimates.
Specifically, an HBL agent constructs its belief function based on a dataset
that records accepted and rejected buy and sell orders during the last
L trades. The strategic parameter
L represents the agent’s memory length, which controls the size of
. Upon an arrival at time
t, the HBL agent builds a belief function
, designed to represent the probability that an order at price
P will result in a transaction. Specifically, the belief function is defined for any encountered price
P as the following:
Here,
T and
R specify
transacted and
rejected orders, respectively;
A and
B represent
asks and
bids; and
L and
G describe orders with prices
less than or equal to and
greater than or equal to price
P, respectively. For example,
is the number of transacted bids found in the memory with price less than or equal to
P up to time
t. An HBL agent updates its dataset
whenever the market receives new order submissions, transactions or cancellations and computes the statistics in Equation (
4) upon each arrival.
Since our market model supports persistent orders and cancellations, the classification of an order as rejected is non-obvious and remains to be defined. To address this, we associate orders with a grace period
and an alive period
. We define the grace period as the average time interval per arrival, that is
, and the alive period
of an order as the time interval from submission to transaction or withdrawal if it is inactive or to the current time if active. An order is considered as rejected only if its alive period
is longer than
, otherwise it is partially rejected by a fraction of
. As the belief function, Equation (
4) is defined only at encountered prices; we further extend it over the full price domain by cubic spline interpolation. To speed the computation, we pick knot points and interpolate only between those points.
After formulating the belief function, an agent
i with the arrival time
t and current holdings
q searches for the optimal price
that maximizes its expected surplus:
In the special cases when there are fewer than
L transactions at the beginning of a trading period or when one side of the order book is empty, HBL agents behave the same as ZI agents until enough information is gathered to form the belief function. As those cases are rare, the specific ZI strategy that HBL agents adopt does not materially affect the overall performance. In
Section 7, we explore variations of the HBL strategy to improve its learning robustness in the face of market manipulation.
3.4. The Spoofing Agent
The spoofing agent seeks profits only through manipulating prices. Unlike background traders, the spoofer has no private value for the security. We design a simple spoofing strategy which maintains a large volume of buy orders at one tick behind the best bid. Specifically, upon arrival at
, the spoofing agent submits a buy order at price
with volume
. Whenever there is an update on the best bid, the spoofer cancels its original spoof order and submits a new one at price
with the same volume. Since in our model, background traders submit only single-unit orders, they cannot transact with the spoof order, which is always shielded by the order at a higher price
. If that higher-price order gets executed, the spoofer immediately cancels and replaces its spoof orders before another background trader arrives. Here, we assume in effect that the spoofing agent can react infinitely fast, in which case its spoof orders are guaranteed never to transact. Even without making any trade, the spoofer maneuvers HBL traders’ pricing beliefs (Equation (
4)) via such submissions and cancellations of spoof orders, which ultimately affect their bidding behavior (Equation (
5)) and move the price.
By continuously feigning buy interest in the market, this spoofing strategy specifically aims to raise market beliefs. To profit from such manipulation practice, a spoofing agent may first buy some shares of the security, manipulate the market to push prices up and later sell those previously bought shares at higher prices. Other spoofing strategies such as adding sell pressure or alternating between buy and sell pressure can be extended from the basic version.
4. Empirical Game-Theoretic Analysis
To reproduce spoofing and understand its effect, we employ a computational approach that combines agent-based modeling, simulation and equilibrium computation. The point of identifying equilibria of the agent-based model is to focus on the most relevant strategic contexts, where agents are making the best choices among their available strategies, given others’ choices. To derive Nash equilibria, we employ empirical game-theoretic analysis (EGTA), a methodology that finds approximate equilibria in games defined by heuristic strategy space and simulated payoff data [
7]. We conduct systematic EGTA studies over a range of parametrically defined market environments, all based on the market model described in
Section 3.
We model the market as a game with players in two roles: N background traders, treated symmetrically, and a single spoofer. In most of our games, the spoofing agent, when present, implements a fixed policy so is not considered a strategic player. Symmetry of the background traders means that each has the same set of available strategies (from the ZI and/or HBL families) to choose from, and their payoffs depend on their own strategy and the number of players choosing each of the other strategies (i.e., it does not matter which other-agent plays which other-strategy). For each game, we evaluate a wide variety of strategy profiles (i.e., agent-strategy assignments). For each strategy profile, we conduct thousands of simulation runs to account for stochastic effects such as the market fundamental series, agent arrival patterns and private valuations and get low-variance estimates of the expected payoffs for that profile. Given background trader symmetry, the payoff of a specific strategy in a profile can be taken as the average payoff over all agents playing that strategy in the profile. From the payoff data accumulated from these simulated samples of explored strategy profiles, we induce an empirical game model, and from that we derive an approximate Nash equilibrium.
We employ an iterative EGTA process. First, we find candidate equilibria in
subgames, where a subgame here is defined as a normal-form game over strategy subsets (we note the contrast with the standard notion in extensive-form games of subgame as subtree). We then confirm or refute candidate solutions by examining deviations and incrementally extend subgames, until the termination criteria are satisfied. Below, we describe two key components of the EGTA process we follow: profile search (
Section 4.1) and game reduction (
Section 4.2).
4.1. Profile Search
We apply EGTA iteratively to guide the profile search over the strategy space. Exploration starts with singleton subgames, and then it incrementally considers each strategy outside the subgame strategy set. Specifically, the singleton subgames are profiles where the same strategy is adopted by all background agents. Starting from this base, we extend evaluation to neighboring profiles with single-agent deviations. Following such a procedure, we systematically explore profiles and incorporate their payoff estimates into the partial payoff matrix corresponding to the empirical game model.
After subgames are completed (all profiles explored for strategy subsets), we compute their equilibria and consider these as candidate solutions of the full game. We attempt to refute these candidates by evaluating deviations outside the subgame strategy set, constructing a new subgame when a beneficial deviation is found. If we examine all deviations without refuting, the candidate is confirmed. We continue to refine the empirical subgame with additional strategies and corresponding simulations until at least one equilibrium is confirmed and all non-confirmed candidates are refuted (up to a threshold support size). In this study, we have support sizes (i.e., numbers of strategies played with positive probability) up to five for background agents.
The procedure aims to confirm or refute promising equilibrium candidates found throughout our exploration of the strategy space. By following a fixed procedure and reporting all equilibria found meeting pre-specified criteria, we maintain consistency across the games analyzed. Since it is often not computationally feasible to search the entire profile space, additional distinct equilibria (e.g., with large support size) are possible. We are aware of no systematic biases in the search procedure with respect to properties of interest, and therefore consider it unlikely that we are missing qualitatively important phenomena across the range of environments analyzed. Finally, we note that equilibria identified in empirical games must generally be viewed as provisional, as they are subject to refutation by strategies outside the restricted set considered in the analysis.
4.2. Game Reduction
As the
game size (i.e., number of possible strategy profiles) grows exponentially in the number of players and strategies, it is computationally prohibitive to directly analyze games with more than a moderate number of players. We therefore apply aggregation methods to approximate a many-player game by a game with fewer players. The specific technique we employ, called
deviation-preserving reduction (DPR) [
52], defines reduced-game payoffs in terms of payoffs in the full game as follows. Consider an
N-player symmetric game, which we want to reduce to a
k-player game. The payoff for playing strategy
in the reduced game, with other agents playing strategies
, is given by the payoff of playing
in the full
N-player game when the other
agents are evenly divided among the
strategies
. To facilitate DPR, we choose values for
N and
k to ensure that the required aggregations come out as integers. For example, in one of the market environment, we reduce games with 28 background traders to games with four background traders. With one background player deviating to a new strategy, we can reduce the remaining 27 players to three. For games that vary smoothly with the number of other players choosing any particular strategy, we can expect DPR to produce reasonable approximations of the original many-player games with exponential reduction in simulation.
5. Spoofing the Limit Order Book
In this section, we reproduce spoofing in the agent-based market model and study its effect on background trading behavior and market outcomes. We start in
Section 5.1 by exploring a range of market environments that can affect the effectiveness of both learning and spoofing.
Section 5.2 addresses agents’ choices among ZI and HBL strategies in markets without spoofing. This is an important step, as spoofing can be effective only if some fraction of background traders choose to learn from the order book information.
Section 5.3 investigates games with spoofing. We first illustrate that a market populated with HBL traders is susceptible to spoofing: a simple spoofing strategy can cause a rise in market prices and a redistribution of surplus between ZI and HBL traders. We finally re-equilibrate the game with spoofing to investigate the impact of spoofing on HBL adoption and market surplus.
5.1. Market Environments
Based on the defined market model, we conduct preliminary explorations over a range of market settings and include the most salient and meaningful ones for our study. We consider nine market environments that differ in fundamental shock, , and in observation noise, . Recall that shock variance controls fluctuations in the fundamental time series and observation variance governs the quality of information agents get about the true fundamental. The nine environments cover representative market conditions that can affect an agent’s ability and need to learn from market information. For example, when the market shock variance is large, prices fluctuate more and market history may become less predictive; when observation noise is high, agents can glean only limited information from their own observations and may gain more from the market’s aggregated order book information. We label the low, medium and high shock variances as and noisy observation variances as , respectively. For instance, the label LSLN refers to a market with low shock, , and low observation noise, .
The global fundamental time series is generated according to Equation (
1) with fundamental mean
, mean reversion
and specified shock variance
. The minimum tick size is fixed at one. Each trading period lasts
T = 10,000 time steps. For each environment, we consider markets populated with
background traders and in selected treatments, a spoofer. Background traders arrive at the market according to a Poisson distribution with a rate
, and, upon each arrival, the trader observes a noisy fundamental
, where
. The maximum number of units background traders can hold at any time is
. Private values are drawn from a Gaussian distribution with zero mean and a variance of
. The spoofing agent starts to manipulate at time
by submitting a large buy order at price
with volume
, and later maintains spoofing orders at price
throughout the trading period.
To provide a benchmark for market surplus, we calculate the social optimum—the expected total possible gains from trade, which depends solely on the trader population size and valuation distribution. From 20,000 samples of the joint valuations, we estimate mean social optima of 18,389 and 43,526 for markets with 28 and 65 background traders, respectively. We further calculate the average order book depth (on either buy or sell side) in markets without spoofing. Throughout the trading horizon, the market has a relatively thin order book with an average depth of 12 per side, whereas the market has a thicker one with an average depth of 30.
The background trading strategy set (see
Table 1) includes seven versions of ZI and four versions of HBL. Agents are allowed to choose from this restricted set of strategies. We have also explored ZI strategies with larger shading ranges and HBL strategies with longer memory lengths, but they fail to appear in equilibrium in games where they were explored.
5.2. Games without Spoofing
Since spoofing targets the order book and can be effective only to the extent traders exploit order book information, we investigate whether background agents adopt the HBL strategy in markets without spoofing. Applying EGTA to the eleven background strategies in
Table 1, we found at least one equilibrium for each market environment. Detailed results on equilibrium mixture and outcomes of games without spoofing can be found in
Appendix A.2.
Figure 3 (blue circles) depicts the proportion of background traders who choose trading strategies in the HBL family. In most non-spoofing environments, HBL is adopted with positive probability, suggesting that investors generally have incentives to make bidding decisions based on order book information. We find that HBL is robust and widely preferred in markets with more traders, low fundamental shocks and high observation noise. Intuitively, a larger population size implies a thick order book with more learnable aggregated data; low shocks in fundamental time series increase the predictability of future price outcomes; and high observation noise limits what an agent can glean about the true fundamental from its own information. This is further confirmed in the two exceptions where all agents choose ZI:
HSLN and
HSMN with
, the environments with fewer traders, high fundamental shocks and at most medium observation noise.
We further quantify how learning from market information may benefit overall market performance. We conduct EGTA in games where background traders are restricted to strategies in the ZI family (
–
in
Table 1). This is tantamount to disallowing learning from order book information. Detailed equilibrium results on games restricted to ZI strategies can be found in
Appendix A.4. We compare equilibrium outcomes for each environment, with and without HBL available to background traders, on two measures: surplus (
Figure 4) and price discovery (
Figure 5). Recall that we define background-trader surplus as the sum of all background agents’ surpluses at time
T, the end of trading. Price discovery is defined as the root-mean-squared deviation (RMSD) of the transaction price from the estimate of the true fundamental in Equation (
2) over the trading period. It reflects how well transactions reveal the true value of the security. Lower RMSD means better price discovery. We calculate the two measures by averaging the outcomes of 20,000 simulations of games with strategy profiles sampled according to each equilibrium mixture.
Overall, background traders achieve higher surplus (
Figure 4) and better price discovery (
Figure 5) when the market provides order book information and enables the HBL strategy option. When HBL exists in the equilibrium, we find transactions reveal fundamental estimates well, especially in markets with lower shock and observation variances (i.e.,
LSLN,
LSMN,
MSLN and
MSMN). We also notice small exceptions in scenarios with high observation variance and more background traders (environments
LSHN and
HSHN with 65 players) where ZI-only equilibria exhibit higher surplus than equilibria combining HBL and ZI.
5.3. Games with Spoofing
5.3.1. Comparing across Fixed Strategy Profiles
We examine the effectiveness of our designed spoofing strategy (
Section 3.4) by playing a spoofer against each HBL-and-ZI equilibrium found in
Section 5.2. We perform controlled comparisons on these games with and without spoofing. As ZI agents are oblivious to spoofing, we ignore the ZI-only equilibria in this analysis. In the paired instances, background agents play identical strategies and are guaranteed to arrive at the same time, receive identical private values and observe the same fundamental values. Therefore, any change in behavior is an effect of spoof orders on HBL traders. For every setting, we simulate 20,000 paired instances, evaluate transaction price differences (
Figure 6) and compare surplus attained by HBL and ZI traders. Transaction price difference at a specific time is defined as the most recent transaction price in the run with spoofing minus that of the paired instance without spoofing. Similarly, surplus difference of HBL or ZI is the aggregated surplus obtained in an environment with spoofing minus that of the corresponding environment without spoofing.
Figure 6 shows positive changes in transaction prices across all environments, subsequent to the arrival of a spoofing agent at
. This suggests that HBL traders are tricked by the spoof buy orders: they believe the underlying security should be worth more and therefore submit or accept limit orders at higher prices. Although ZI agents do not change their bidding behavior directly, they may transact at higher prices due to the increased bids of HBL traders.
Several other interesting findings are revealed by the transaction-price difference series. First, the average price rise caused by spoofing the market with 28 background traders is higher than for . This indicates that a market with fewer background traders can be more susceptible to spoofing, due to the limited pricing information a thin market could aggregate. Second, for markets populated with more HBLs than ZIs in the equilibrium mixture, the transaction price differences tend to increase throughout the trading period. This amplification can be explained by HBLs consistently submitting orders at higher prices and confirming each other’s spoofed belief. However, for markets with more ZIs, the spoofing effect diminishes as ZIs who do not change their limit-order pricing can partly correct the HBLs’ illusions. Finally, we observe that the spoofing effect tends to attenuate over time: differences in transaction prices first increase, and then stabilize or decrease. This is due to the mean-reverting property of the fundamental series and the way background traders estimate the final fundamental. As time approaches the end of the trading period, background agents rely more on accumulated fundamental observations and get better estimates of the final fundamental value. Therefore, spoofing tends to wear off in the face of accumulated observations and mean reversion.
We further compare background-trader payoffs attained in environments with and without spoofing. We find a redistribution of surplus between HBL and ZI agents: HBL aggregated surplus decreases, while that for ZI increases compared to the non-spoofing baselines. Specifically, across 28-trader market environments, HBL traders suffer an average surplus decrease of 184 across all equilibrium profiles, whereas the ZI traders have an average surplus gain of 19. For the 65-trader markets, the average surplus decrease for HBL traders is 238, while the average increase for ZI is 40. This suggests that the ZI agents benefit from the HBL agents’ spoofed beliefs. Since the decreases in HBL surplus are consistently larger than the increases for ZI, the overall market surplus decreases. We leave further discussion of spoofing’s impact on market surplus to
Section 5.3.2, where background traders can choose other strategies to adjust to the presence of spoofing.
To examine the potential to profit from a successful price manipulation, we extend the spoofing agent with an exploitation strategy: buying, (optionally) spoofing to raise the price and then selling. The exploiting spoofer starts by buying when there is a limit sell order with price less than the fundamental mean in the market. It then optionally runs the spoofing trick, or alternatively waits, for 1000 time steps. Finally, the agent sells the previously bought unit (if any) when it finds a limit buy order with price more than fundamental mean. Note that, even without spoofing, this single-unit exploitation strategy is profitable in expectation due to the mean reversion captured by the fundamental process and the reliable arrivals of background traders with private preferences.
Figure 7 compares the exploitation profits with and without spoofing. In controlled experiments, we find that exploitation profits are consistently increased when the spoof action is also deployed. Across 28-trader market environments, the exploiter makes an average profit of 206.1 and 201.8 with and without spoofing, respectively, and the increases in profit range from 1.2 to 11.5. For the 65-trader market, the average profits of this exploitation strategy with and without spoofing are 50.5 and 46.3, respectively, with the increases in profit varying from 1.7 to 9.4 across environments. Statistical tests show all increases in profit are significantly larger than zero. Regardless of spoofing, the exploitation strategy profits more in the thinner market due to the greater variance in transaction prices.
5.3.2. Re-Equilibrating Games with Spoofing
To understand how spoofing changes background-trading behavior, we conduct EGTA again to identify Nash equilibria, allowing background traders to choose any strategy in
Table 1, in games with spoofing. Detailed results on equilibrium mixture and outcomes of games with spoofing can be found in
Appendix A.3. As indicated in
Figure 3 (orange triangles), after re-equilibrating games with spoofing, HBL is generally adopted by a smaller fraction of traders, but it still persists in equilibrium in most market environments. HBL’s existence after re-equilibration indicates a consistently spoofable market: the designed spoofing tactic fails to eliminate HBL agents, and, in turn, the persistence of HBL may incentivize a spoofer to continue effectively manipulating the market.
We characterize the effect of spoofing on market surplus.
Figure 8 compares the total surplus achieved by background traders in equilibrium with and without spoofing. Given the presence of HBL traders, spoofing generally decreases total surplus (as, in
Figure 8, most filled orange triangles are below the filled blue circles). However, spoofing has ambiguous effect in the thicker market with large observation variance (environments
LSHN and
HSHN with 65 background agents). This may be because noise and spoofing simultaneously hurt the prediction accuracy of the HBL agents and therefore shift agents to other competitive ZI strategies with higher payoffs. Finally, we find the welfare effects of HBL strategies persist regardless of spoofing’s presence: markets populated with HBL agents in equilibrium achieve higher total surplus than those markets without HBL (as, in
Figure 8, the hollow markers are below the filled markers).
5.4. Discussion
Our agent-based model of spoofing aims to capture the essential logic of manipulation through influencing belief about market demand. In our model, the order book reflects aggregate information about the market fundamental, and learning traders can use this to advantage in their bidding strategies. The presence of such learning traders benefits price discovery and social welfare, but it also renders the market vulnerable to manipulation. As we demonstrate, simple spoofing strategies can effectively mislead learning traders, thereby distorting prices and reducing surplus compared to the non-spoofing baseline. Moreover, the persistence of learning traders in equilibrium with manipulation suggests that the elimination of spoofing requires active measures.
We acknowledge several factors that can limit the accuracy of our equilibrium analysis in individual game instances; these include sampling error, reduced-game approximation and restricted strategy coverage. Despite such limitations (inherent in any complex modeling effort), we believe the model offers a constructive basis to evaluate manipulation practices and any preventive or deterrent proposals to mitigate manipulation under strategic settings. In the rest of the paper, we build on this model and conduct comprehensive analysis to investigate the following questions:
Are there more robust ways for exchanges to disclose order book information (
Section 6)?
Are there strategies by which individual traders can adopt to exploit market information but in less vulnerable ways (
Section 7)?
6. A Cloaking Mechanism to Mitigate Spoofing
Despite regulatory enforcement and detection efforts, an individual spoofing episode is hard to catch in high-volume, high-velocity data streams. Legal definitions cannot be easily translated to computer programs to direct detection, and the lack of datasets with labeled manipulation cases makes training a reliable detector infeasible with supervised machine learning techniques. Based on its definition, to determine that a pattern of activity constitutes spoofing requires establishing the manipulation intent behind submission and cancellation of placed orders. However, this is not easy, as order cancellation is in itself common and legitimate: according to one study, 95% of NASDAQ limit orders are canceled, with a median order lifetime less than one second [
53]. Another challenge arises from the adversarial nature of a manipulator who may strategically adapt to evade detection and regulation [
54]. Given difficulties in robustly detecting manipulation, we study systematic approaches to deter spoofing, by rendering manipulative practices difficult or uneconomical.
Along these lines, Prewit [
55] and Biais and Woolley [
56] advocated the imposition of cancellation fees to disincentivize manipulative strategies that rely on frequent cancellations of orders. Others argue that cancellation fees could discourage the beneficial activity of liquidity providers, and, in the event of a market crash, such a policy may lengthen the recovery process [
57].
We propose here a cloaking mechanism to deter spoofing via the selective disclosure of order book information. The mechanism extends the traditional CDA market with a cloaking parameter K, which specifies the number of price levels to hide symmetrically from inside of the limit order book. The idea is to make it more difficult for the spoofer who relies on the instant order book information to post misleading bids, while not unduly degrading the general usefulness of market information. We focus on deterministic cloaking (i.e., a constant K throughout the trading period), as a stochastic mechanism may raise issues regarding verification of faithful market operations.
We extend our agent-based model of spoofing to support order book cloaking and conduct simulations to evaluate and find the optimal cloaking parameter under strategic settings, where both the learning traders and the spoofer adapt to the new mechanism.
Section 6.1 formally defines the cloaking mechanism and describes how we modify the background trading and spoofing strategies accordingly. In
Section 6.2, we present an EGTA study conducted to understand agents’ strategic responses to the proposed mechanism.
Section 6.3 reports results from performing
empirical mechanism design [
58] to set cloaking parameters that maximize efficiency. Finally, in
Section 6.4, we explore and evaluate sophisticated spoofing strategies that use probing to reveal cloaked information.
6.1. A Cloaking Market Mechanism
The cloaking mechanism maintains a full limit order book just as the regular CDA market, but discloses only a selective part of the book to traders. Let denote the kth-highest buy price in the book at time t and the kth-lowest sell price. In a standard order book, at any given time t, the buy side of the book starts with the best bid, , and extends to lower values; the sell side starts with the best ask, , and extends to higher ones. The cloaking mechanism works by symmetrically hiding a deterministic number of price levels K from inside of the order book. Thus, the disclosed order book in a cloaking mechanism with parameter K starts with and and extends to lower and higher values, respectively. Upon order submissions, cancellations and transactions, the market updates the full order book and then cloaks the K inside levels. Therefore, an order hidden in the past can be revealed later due to the arrival of new orders at more competitive prices, or it can be hidden throughout its lifetime due to a cancellation. The market discloses all the transaction information at zero delay.
Example 1 (A Cloaking Mechanism with Parameter K). When , the market acts as a standard CDA, disclosing the full limit order book with zero delay. When , the mechanism conceals orders at the best quotes, that is and . When , the market does not reveal any part of the book and thus disallows learning from order book information.
Cloaking operates to deter spoofing in two ways. First, it mitigates the effect of spoof orders, pushing them further from the inside of the book. Second, it increases the spoofer’s transaction risks, as it cannot as easily monitor the quantity of orders ahead of the spoof. On the other hand, the information hiding also affects the non-manipulative traders, for instance in our model it may degrade the HBL traders’ learning capability. To quantify this tradeoff, we start by exploring a range of cloaking parameters,
, which control the amount of information being concealed at any given time. We compare trading behavior and outcomes in markets with cloaking to that of a standard CDA. Among the nine market environments defined in
Section 5.1, we consider three representatives that are increasingly challenging for the learning traders:
LSHN with
,
MSMN with
and
HSLN with
. Together with the four cloaking parameters, this gives us a total of 12 market settings, or 24 games with and without spoofing.
The market is populated with 64 background traders and one exploitation agent. Therefore, when adopting DPR to approximate this many-player game, we use simulation data from the (64, 1)-agent environments to estimate reduced (4, 1)-player games, where four players are used to aggregate and represent the background traders. In each game, we consider background trading strategies and spoofing practice similar to those of
Section 3, but they are slightly modified to adapt to order book cloaking. Below, we describe changes made to each strategy.
6.1.1. Zero Intelligence
Recall that our ZI strategy uses a threshold parameter
to immediately transact with an existing order to grasp a portion of desired surplus. That is, if the agent could achieve a fraction
of its requested surplus at the market best quotes, it would simply take that quote rather than posting a limit order for a future transaction. Under a cloaking mechanism, however, ZI may take into account only the current
visible best quotes that are less competitive compared to the hidden quotes. To adjust to cloaking, we explore a range of more aggressive (smaller)
values to ensure that ZI traders may still transact with incumbent orders to lock a certain fraction of surplus. Besides the seven ZI strategies in
Table 1, we further include three ZI strategies with
(
Table 2), which are competitive enough to appear in at least one equilibrium of our explored environments.
6.1.2. Heuristic Belief Learning
We modify HBL to consider only the
revealed order book information under the corresponding cloaking markets. Orders at competitive price levels will be missed in the belief function (Equation (
4)) if they are hidden throughout order lifetime, or they may be considered with delay if later exposed at visible levels. This reduction in bid information would naturally be expected to degrade HBL’s learning effectiveness and thus its trading performance.
6.1.3. Spoofing Strategy
We extend the original spoofing strategy (
Section 3.4) to cloaking markets. The strategy includes three stages. At the beginning of a trading period
, the agent buys by accepting any sell order at price lower than the fundamental mean
. In a cloaking market, this can be achieved by placing a one-unit limit buy order at price
and immediately withdrawing it if does not transact with an existing order.
During the second stage , the agent submits spoof buy orders at a tick behind the first visible bid with volume . Whenever there is an update on the first visible bid, the spoofer replaces its original spoof with new orders at price . This spoofing strategy aims to boost price, in the hope that the units purchased in Stage 1 can be later sold at higher prices. In controlled experiments, when the agent is not manipulating, it waits until the selling stage.
During the last stage , the agent starts to sell the units it previously bought by accepting any buy orders at a price higher than . Inverse to the first stage, this operates by placing one-unit limit sell orders at price , followed by immediate cancellation if not filled. The agent who also manipulates continues to spoof until all the bought units are sold or the trading period ends. The pure exploitation strategy can be considered as a baseline for the spoofing strategy, allowing us to quantify how much more the agent may profit from spoofing the market.
We refer to the agent who employs the above strategy, whether places spoof orders or not, as an
exploitation agent or
exploiter. An exploiter who also spoofs is referred to as a
spoofing agent or
spoofer. Note that the spoofing strategy considered here does not face any execution risk on its spoof orders under the assumption it can immediately respond to quote changes. A more sophisticated strategy could
probe the market to reveal the cloaked bids, and then spoof at a visible price higher than
. We leave discussion of such probing strategies to
Section 6.4.
6.2. Tradeoff Faced by Cloaking Mechanisms
We start by separately investigating the impact of cloaking on background traders and on the spoofer. Our first set of games cover the range of cloaking environments without spoofing (i.e., markets populated with background traders and the non-manipulative exploiter). Detailed results on equilibrium mixture and outcomes of cloaking mechanisms without spoofing can be found in
Appendix B.1.
Figure 9 displays the HBL adoption rate (i.e., total probability over HBL strategies) at equilibrium across cloaking mechanisms,
. We find that the competitiveness of HBL generally persists when the mechanism hides one or two price levels, but at higher cloaking levels the HBL fraction can drastically decrease. The information loss caused by cloaking weakens HBL’s ability to make predictions. The effect is strongest in environments with high fundamental shocks (e.g.,
HSLN), as previous hidden orders can become uninformative or even misleading by the time they are revealed. Such information loss is further confirmed in
Figure 10, which compares the price discovery achieved at market equilibrium. We find that in markets where the fundamental shock is relatively high and a higher level of cloaking is adopted, transactions may not reveal fundamental estimates very well. Given the decreasing HBL prevalence and learning effectiveness, background-trader surplus achieved at equilibrium also decreases (as shown in
Figure 11b (blue diamonds).
Next, we examine whether cloaking can effectively mitigate manipulation. We perform controlled experiments by letting the exploitation agent also execute the spoofing strategy against each found equilibrium and compare the impact of spoofing under the cloaking mechanism to the standard fully revealed order book (). For every equilibrium, we simulate at least 10,000 paired instances and evaluate their differences on transaction price and agents’ payoffs.
From these controlled experiments, we find that cloaking can considerably diminish price distortion caused by spoofing across environments. Recall that we measure price distortion as the transaction price series in a market with spoofing minus that of its paired market without spoofing.
Figure 12a demonstrates the case in a specific environment
MSMN: without cloaking (
), transaction prices significantly rise subsequent to the execution of spoofing at
, as HBL traders are tricked by the spoof buy orders; in cloaked markets, this price rise is effectively mitigated.
Figure 12b further illustrates the surplus change in background traders and the exploiter when it also spoofs. We find the exploiter can robustly profit from manipulating the learning agents in the no-cloaking case. In contrast, partially hiding the order book can significantly reduce spoofing profits and prevent background traders from losing much. These findings indicate the cloaking mechanism may deter or even eliminate the exploiter’s incentive to spoof.
6.3. Finding the Optimal Cloaking
Given the tradeoff between preserving order book informativeness and mitigating manipulation, the question becomes: Under what circumstances do the deterrence benefits of cloaking exceed its efficiency costs? To answer this, we
re-equilibrate games allowing the exploiter to strategically choose whether to spoof, with background traders able to execute any strategy in
Table 1 or
Table 2. This allows background traders and the exploitation agent to strategically respond to each other under a certain level of information cloaking. Detailed results on equilibrium mixture and outcomes can be found in
Appendix B.2.
Our findings are presented in
Figure 11. We compare market outcomes with and without cloaking on two metrics: the probability of spoofing and total background-trader surplus in equilibrium. (Due to the welfare benefits of HBL, equilibria with pure ZIs usually achieve much lower surplus than those with HBLs. For presentation simplicity, we omit all-ZI equilibria from
Figure 11b. Environments with such cases are marked with asterisks.) As shown in
Figure 11a, the cloaking mechanism effectively decreases the probability of spoofing under most environment settings—completely eliminating spoofing in some cases. Moreover, we find moderate cloaking can preserve the prevalence of HBL at equilibrium, which otherwise would be decreased by spoofing as we saw in
Section 5.
This weakened spoofing effect is further confirmed by
Figure 11b, which compares the total background-trader surplus achieved in equilibrium under mechanisms with and without cloaking. Without cloaking (i.e.,
columns), background surplus achieved in equilibrium where the exploiter strategically chooses to spoof (orange triangles) is much lower than the surplus attained when the exploiter is prohibited from spoofing (blue diamonds). We find the decrease in surplus due to spoofing can be considerably mitigated by order book cloaking. As shown in
Figure 11b, the vertical distances between the blue diamonds and orange triangles get smaller with
. Moreover, we find the benefit of this improved robustness to spoofing can outweigh its associated efficiency costs in markets with moderate fundamental shocks (e.g.,
LSHN and
MSMN). In those environments, background traders in mechanisms that cloak one or two price levels achieve higher surplus than those without cloaking. However, in a market with high shocks (e.g.,
HSLN), hiding or delaying even a little market information degrades learning to such a degree as to render cloaking counter-productive.
6.4. Probing the Cloaking Mechanism to Spoof
To this point, we have only considered spoofers who are unwilling to risk execution of their spoof orders. A more sophisticated manipulator could probe the market, submitting a series of orders at slightly higher prices, in an attempt to reveal the cloaked bids and spoof at a visible price higher than . In this section, we study the feasibility of such probing to the spoofing agent.
We design and evaluate parameterized versions of the spoofing strategy combined with probing. The strategy is governed by two parameters: the step size , which controls probing aggressiveness, and the maximum attempts allowed per time step l, which limits the probing effort.
The spoofer probes by submitting a unit buy order at
, a price inside the visible quotes, in the hopes of exposing
. If the probe succeeds, it immediately cancels the probe order, and places a new spoof order at
, right behind the lowest hidden bid level. If probing fails because the price is too conservative, the spoofer re-probes by raising the price at a decreasing rate (as a function of
and the attempt number), until a higher price is revealed or the number of probing attempts reaches
l. If probing causes a transaction, the spoofer halves the price increment and re-probes. Algorithm 1 describes the detailed probing procedure.
| Algorithm 1 Spoofing with probing in a cloaking market with K hidden price levels () |
Input: The probing step size and the attempt limit l.
The spoofer’s time to place spoof orders , and its current holding H.
- 1:
whileanddo - 2:
if no active spoof orders then - 3:
, ▹ track the number of probing attempts and the price increment - 4:
submit a single-unit probe buy order at price - 5:
while the visible remains unchanged and do - 6:
- 7:
if the probe buy order gets transacted then - 8:
- 9:
submit a single-unit probe buy order at price - 10:
else - 11:
- 12:
substitute the probe order with a new one at price - 13:
end if - 14:
end while - 15:
submit spoof orders at price - 16:
cancel the probe order - 17:
else - 18:
if spoof orders become hidden then - 19:
substitute spoof orders with new ones at price - 20:
else if spoof orders are no longer one tick behind then - 21:
withdraw spoof orders - 22:
end if - 23:
end if - 24:
end while
|
Table 3 reports, for cloaking-beneficial environments, the minimum
l required for step sizes
to achieve higher payoffs than the equilibrium performance we found for the exploiter in
Section 6.3. Multiple rows for the same cloaking parameter correspond to the multiple equilibria found in that market setting. Dashes in the table indicate that an exploiter cannot beat the equilibrium performance with the corresponding
. We find that, to achieve higher payoffs, the spoofer has to probe with multiple attempts per time step, and conservative probing strategy with smaller
usually requires more effort. In practice, such frequent cancellation and placement of orders may not be feasible and can largely increase the risk of the associated probing and spoofing intent being identified.
Figure 13 further quantifies the change in exploitation payoff and transaction risk (measured as the number of transactions caused by probing), as we vary the probing step
and the attempt limit
l. As shown
Figure 13a, relaxing the maximum number of probing attempts steadily increases the transaction risk, but it does not necessarily improve payoff. Moreover, the spikiness we observe in the exploiter’s payoff suggests that the performance is highly sensitive and therefore it would be difficult to find a
that robustly maximizes profit.
Figure 13b further demonstrates that an exploiter can probe aggressively with larger step sizes to reduce effort, but it is usually at the cost of a higher transaction risk and consequently a lower payoff. In highly dynamic markets with frequently updated quotes, finding an appropriate
to successfully probe a cloaking mechanism within a reasonable number of attempts would be quite challenging.
We have explored other more aggressive probing strategies, where the spoofer probes to expose multiple hidden levels and spoofs at even higher prices. To accomplish that, the spoofer is forced to keep at least one order in the cloaked levels to guarantee that its spoof orders are visible. However, according to our experiments, such aggressive probing strategies fail to beat the equilibrium performance, as orders kept in hidden levels are often accepted by background traders due to adverse selection. Those transactions tend to accumulate the spoofer’s position, and consequently they impose losses at the end of the trading period.
6.5. Discussion
Our cloaking mechanism offers a systematic approach to disincentivizing spoofing. We conduct EGTA to understand agents’ strategic responses to the proposed mechanism and evaluate the effectiveness and robustness of cloaking. Experimental results demonstrate that cloaking the order book can significantly diminish the efficacy of spoofing, but at the loss of useful information for the learning traders. With the goal of balancing this tradeoff to maximize background-trader surplus, we perform empirical mechanism design to choose the optimal cloaking across parametrically distinct environments. We find that, in markets with moderate shocks, the benefit of cloaking in mitigating spoofing can outweigh its efficiency cost, whereas, in markets with large fundamental fluctuations, hiding even a little order book information can largely degrade learning efficiency and render the cloaking mechanism counter-productive. By further exploring sophisticated spoofing strategies that probe to reveal cloaked information, we observe that associated effort and risk generally exceeds the gains and that finding reliably profitable probing regiments is quite difficult. We conclude that the proposed cloaking mechanism cannot be easily circumvented by probing.
7. Learning-Based Trading Strategies under the Presence of Market Manipulation
We next consider how individual traders may construct strategies that are more robust to manipulation. In realistic market scenarios, traders are aware of potential manipulation but unable to reliably detect spoofing behavior in real time. In the absence of manipulation, traders submit orders that reflect their private observations and preferences, and thus learning from others’ actions enables more informed decisions. Indeed, as shown above, learning as implemented by HBL agents is effective in a realistic market model and provides benefits to the learning agent as well as to market efficiency. HBL is vulnerable to spoofing, however, and agents adopting such learning are harmed by spoofing compared to non-learning strategies that are oblivious to spoofers and thus non-manipulable. The question we investigate in this section is whether learning-based strategies can be designed to be similarly robust to spoofing. We seek strategies by which individual traders can learn from market information, but in less vulnerable ways.
We treat the original HBL described in
Section 3.3.3 as a baseline strategy and propose two variations that aim to reasonably trade off learning effectiveness in non-manipulated markets for robustness against manipulation. The first variation works by selectively ignoring orders at certain price levels, particularly where spoof orders are likely to be placed. The second variation considers the full order book, but has the flexibility to adjust the offer price by a stochastic offset. The adjustment serves to correct biases in learned price beliefs either caused by manipulation or the intrinsic limitation built in the belief function. We formally define the two variations in
Section 7.1, and then evaluate the proposed strategies in terms of the effectiveness in non-manipulated markets and robustness against manipulation in
Section 7.2.1.
We adopt the standard CDA market mechanism as described in
Section 3.1. The market is populated with 64 background traders and one profitable exploiter. Background traders can choose from a select set of strategies that covers ZI, original HBL and the two proposed variations of HBL. The exploiter follows the three-stage exploitation strategy specified in
Section 6.1 and executes spoofing in selected treatments. As in our study of cloaking mechanisms, we consider three representative market settings for our experiments, namely
LSHN,
MSMN and
HSLN.
7.1. Two Variations of HBL
7.1.1. HBL with Selective Price Level Blocking
Our first HBL variation is inspired by the success of our cloaking mechanism. It takes advantage of the common placement of spoof orders closely behind the market best quotes. Instead of including all observed trading activities in its memory to construct the belief function just as the standard HBL, the idea is to neglect limit orders at a specified price level when assembling the dataset to learn from. We extend standard HBL with a blocking parameter , which specifies the index of a single price level to ignore symmetrically from inside of the limit order book. For example, when , the trading agent constructs a dataset, , by considering only orders strictly outside the best bid and ask. The goal of this additional strategic parameter is to exclude price levels where spoof orders are likely to appear. However, ignoring orders may come at the cost of less effective learning, especially when information that conveys true insight is blocked from the belief function.
7.1.2. HBL with Price Offsets
Our second HBL variation considers all orders in its memory, but translates the target price
derived by surplus maximization in Equation (
5) with an offset uniformly drawn from
. Specifically, a background trader
i who arrives the market at time
t with the optimized price
submits a limit order for a single unit of the security at price
A positive offset can be viewed as a hedge against misleading information, effectively shading the bid to compensate for manipulation risk. A negative offset increases the probability of near-term transaction, which may have benefits in reducing exposure to future spoofing. Offsets (positive or negative) may also serve a useful correction function even when manipulation is absent. In particular, negative offsets may compensate for the myopic nature of HBL optimization Equation (
5), which considers only the current bid, ignoring subsequent market arrivals and opportunities to trade additional units. Our design here is in line with prior literature [
24,
25] that refines the original HBL to become more competitive.
7.2. Empirical Evaluation
7.2.1. Standard HBL
We start with our baseline market environments where background traders are restricted to choose from the standard HBL strategies and five parametrically different ZI strategies in
Table 4. Figure 18 (dark grey columns) verifies what is observed in
Section 5 within this restrictive set of background-trading strategies: (1) the learning-based trading strategy is more widely preferred in environments where fundamental shock is low and observation noise is high (e.g.,
LSHN is the most learning-friendly environment); and (2) the presence of spoofing generally hurts the learning-based strategy and reduces background-trader surplus. Detailed equilibrium outcomes can be found in
Appendix C.1. We next evaluate the two HBL variations.
7.2.2. HBL with Selective Price Level Blocking
Learning traders who choose to ignore certain orders face a natural tradeoff between losing useful information and correctly blocking spoof orders to avoid manipulation. We first examine, under
non-spoofing environments, how learning effectiveness may be compromised by excluding orders at each price level. Starting with the equilibrium strategy profile of each non-spoofing market environment found in
Section 7.2.1 (we arbitrarily select one if there are multiple equilibria found in a certain environment), we perform controlled experiments by letting background traders who adopt the standard HBL strategy ignore orders from a selected price level throughout the trading period.
Table 5 compares the payoffs obtained by HBL in its standard form and variations that, respectively, block orders at the first, second and third price level in the order book. We find that, consistently across market settings, HBL agents benefit the most by learning from market best bids and asks and can achieve fairly similar performance even when orders at a selected level beyond the market best quotes are ignored.
In response to the HBL variation that ignores price levels, we extend the exploiter to be able to place spoof orders behind a chosen price level, denoted by
. For example, when
, the exploiter injects spoof orders at one tick behind the second-best bid. We start with the same set of equilibrium strategy profiles and conduct controlled experiments to evaluate how injecting spoof orders at different levels can change the manipulation effect, even when learning traders are considering the full order book (i.e., adopting standard HBL). We measure the effectiveness of each spoofing strategy by profits from trade as well as the price deviation caused by spoof orders. Experimental results (
Table 5) show that the exploiter benefits the most by placing spoof orders behind the best bid (i.e.,
) and moving spoof orders to less competitive levels reduces exploitation profit. We further confirm this weakened manipulation effect in
Figure 14, which showcases market price deviations caused by different spoofing strategies in the
MSMN environment. We find the price rise diminishes as spoof orders are placed further away from the best bid.
Although our exploration of possible spoofing strategies here is limited, the results suggest that spoof orders near the market quotes tend to maximize manipulation effect. In response, HBL traders who adapt to the presence of spoofing may naturally block orders around such levels.
Figure 15 shows that, when blocking the correct level, HBL traders can significantly increase their payoffs and reduce the amount the exploiter could profit via manipulation. This mitigated manipulation effect is further verified by the dashed blue line in
Figure 14, which shows price deviations close to zero. Price differences are not strictly zero before spoofing (time 1000), as traders who adopt
consistently block orders throughout the trading period.
Given these beneficial payoff deviations, in the final set of experiments, we conduct EGTA to find approximate Nash equilibria in games where background traders may choose trading strategies from the ZI family and HBLs that block a selected price level (any strategy in
Table 4 or
Table 6). Detailed equilibrium results can be found in
Appendix C.2. As shown in Figure 18 (light grey columns), we find that: (1) adding the blocking strategic parameter does not affect the competitiveness of learning-based strategies with respect to ZI (HBL adoption rates in equilibrium remain in similar ranges as those of markets where only the standard HBL strategy is provided); and (2) the extended order blocking ability improves the learning robustness of HBL traders (compared to surplus decreases caused by manipulation in markets where background agents are restricted to the standard HBL, background-trader surpluses are no longer significantly reduced when agents can strategically block orders in the face of manipulation). In other words, background traders who learn from market information but also strategically ignore orders can achieve robustness against manipulation and retain comparable effectiveness in non-manipulated markets.
7.2.3. HBL with Price Offsets
Our second HBL variation relies on a price adjustment rather than information selection to adapt to different market conditions. We start by exploring a set of price offset intervals
, ranging from positive values that understate the learned offer prices (e.g., similar to price shading) to negative values that adjust prices to become more competitive. As in
Section 7.2.2, we conduct controlled experiments starting from equilibrium profiles found in
Section 7.2.1 and then deviating from standard HBL to allow price offsets.
Figure 16 shows for the
MSMN non-spoofing environment how HBL surplus and number of transactions vary in markets where HBL traders adopt different offset intervals. (HBL with positive offset usually generates much lower payoff. For presentation simplicity, we cropped the surplus decrease at −400 in
Figure 16.) We find adjusting learned prices with a range of negative offsets can be generally beneficial in our setting where agents have reentry opportunities. It increases HBL payoff and facilitates transactions, thus improving overall price convergence in markets.
To test the effectiveness of spoofing against the new HBL variation, we further have the
spoof in markets where the learning background traders, respectively, adopt the standard HBL,
,
,
and
.
Figure 17 compares market price deviations caused by spoof orders in those markets. We find that, although all markets experience initial price rise as a result of misled pricing beliefs, the spoofing effect tends to wear off faster in markets where HBL traders adopt negative price offsets. This may be because negative offsets promote near-term transaction: as more transactions happen, HBL traders can glean true information from the transaction prices to construct more accurate belief functions, and the
places spoof orders at lower prices due to the widened bid-ask spreads. Indeed, we find that markets populated with the standard HBL,
,
and
, respectively, have average
spoof-order prices of 99,972, 99,951, 99,945 and 99,950.
Finally, we conduct EGTA in games with and without spoofing to find Nash equilibria where background traders can choose from ZI strategies and HBL variations that adjust learned prices with certain offsets (
Table 4 and
Table 7). Detailed equilibrium results can be found in
Appendix C.3. Equilibrium results (
Figure 18 white columns) show that the extended price offsets tend to largely improve HBL’s profitability and background-trader surpluses, in markets both with and without manipulation. Such price adjustments can especially help learning traders to better adapt to high shock environments where prices are less predictable from past observations. However, the extended offsets may not directly address manipulation and improve learning robustness against spoofing.
7.3. Combine Order Blocking and Price Offsets
We observe that HBL with price offsets is overall competitive across different market settings, but its performance still degrades in markets with spoofing (refer to
Figure 18, white columns). Since the second HBL variation demonstrates a general improvement in both settings with and without manipulation, we augment this variation with price level blocking to reduce vulnerability to spoofing. Specifically, we extend the background trading strategy set in
Table 6 with three strategies:
,
and
, which appear to be competitive in our preliminary explorations. We conduct EGTA in a similar manner across market environments with and without spoofing (detailed results can be found in
Appendix C.4). Equilibrium outcomes (
Figure 18, striped columns) show that: (1) compared to markets where only the standard and the price-blocking HBL are provided, HBL that combines the two variations is more widely preferred and can help to increase overall background-trader surplus in equilibrium; and (2) across all environments, background-trader surpluses in markets with and without spoofing fall roughly into the same ranges. These suggest that, by combining the two proposed variations, HBL traders can enjoy both improved competitiveness and robustness against manipulation.
8. Conclusions
In this paper, we construct a computational model of spoofing: the tactic of manipulating market prices by targeting the order book. We design an HBL strategy that uses order book information to make pricing decisions. Since HBL traders use the order book, they are potentially vulnerable to spoofing attacks, and we confirm this in simulation analysis. We demonstrate that, in the absence of spoofing, HBL is generally adopted in equilibrium and benefits price discovery and social welfare. Although the presence of spoofing decreases the HBL proportion in background traders, HBL’s persistence in equilibrium indicates a robustly spoofable market. By comparing equilibrium outcomes with and without spoofing, we find that spoofing tends to decrease market surplus. Comparisons across parametrically different environments reveal factors that may influence the adoption of HBL and the impact of spoofing.
We further propose a cloaking mechanism to deter spoofing. The mechanism discloses a partially cloaked order book by symmetrically concealing a deterministic number of price levels from the inside. Our results demonstrate that the proposed cloaking mechanism can significantly diminish the efficacy of spoofing, but at the cost of a reduced HBL proportion and surplus in equilibrium. With the goal of maximizing background trader surplus, we perform empirical game-theoretic analysis across parametrically different mechanisms and environments, and find in markets with moderate shocks, the benefit of cloaking in mitigating spoofing outweighs its efficiency cost. By further exploring sophisticated spoofing strategies that probe to reveal cloaked information, we demonstrate the associated effort and risk exceed the gains, and verified that the proposed cloaking mechanism cannot be circumvented.
Two strategy variations based on the standard HBL strategy are explored. The first variation considers common characteristics of spoofing activities and works by offering agents the flexibility to neglect limit orders at a specified price level when assembling a dataset to learn from. The second variation learns from full order book information and later adjusts the target price derived from surplus maximization with a random offset to correct any biases in the learning process. Our analysis shows that the first HBL variation offers learning traders a way to strategically block orders to improve robustness against spoofing, while achieving similar competitiveness in non-manipulated markets. Our second HBL variation exhibits a general improvement over baseline HBL, in markets both with and without manipulation. Further explorations suggest that traders can enjoy both improved profitability and robustness by combining the two HBL variations.


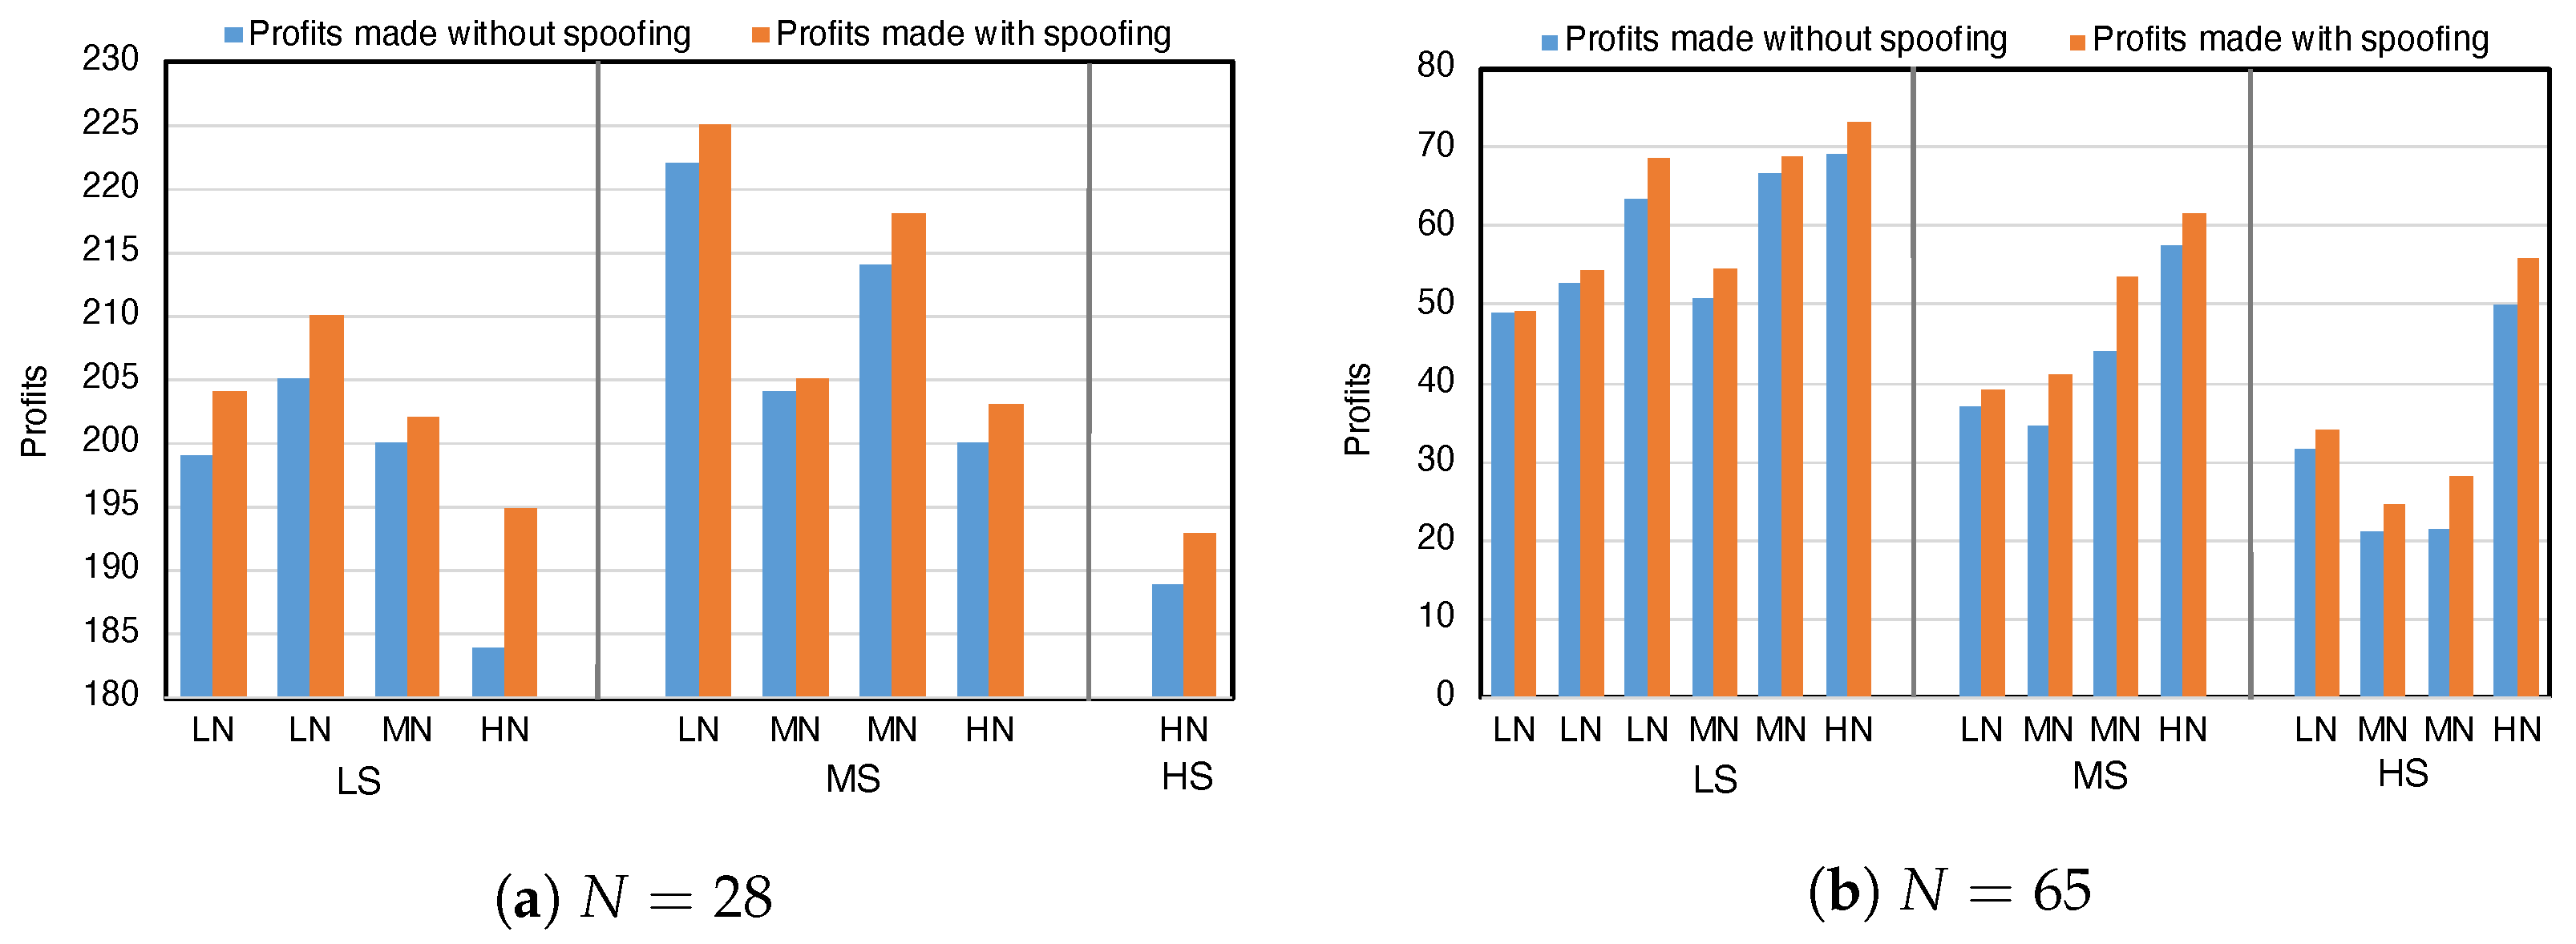
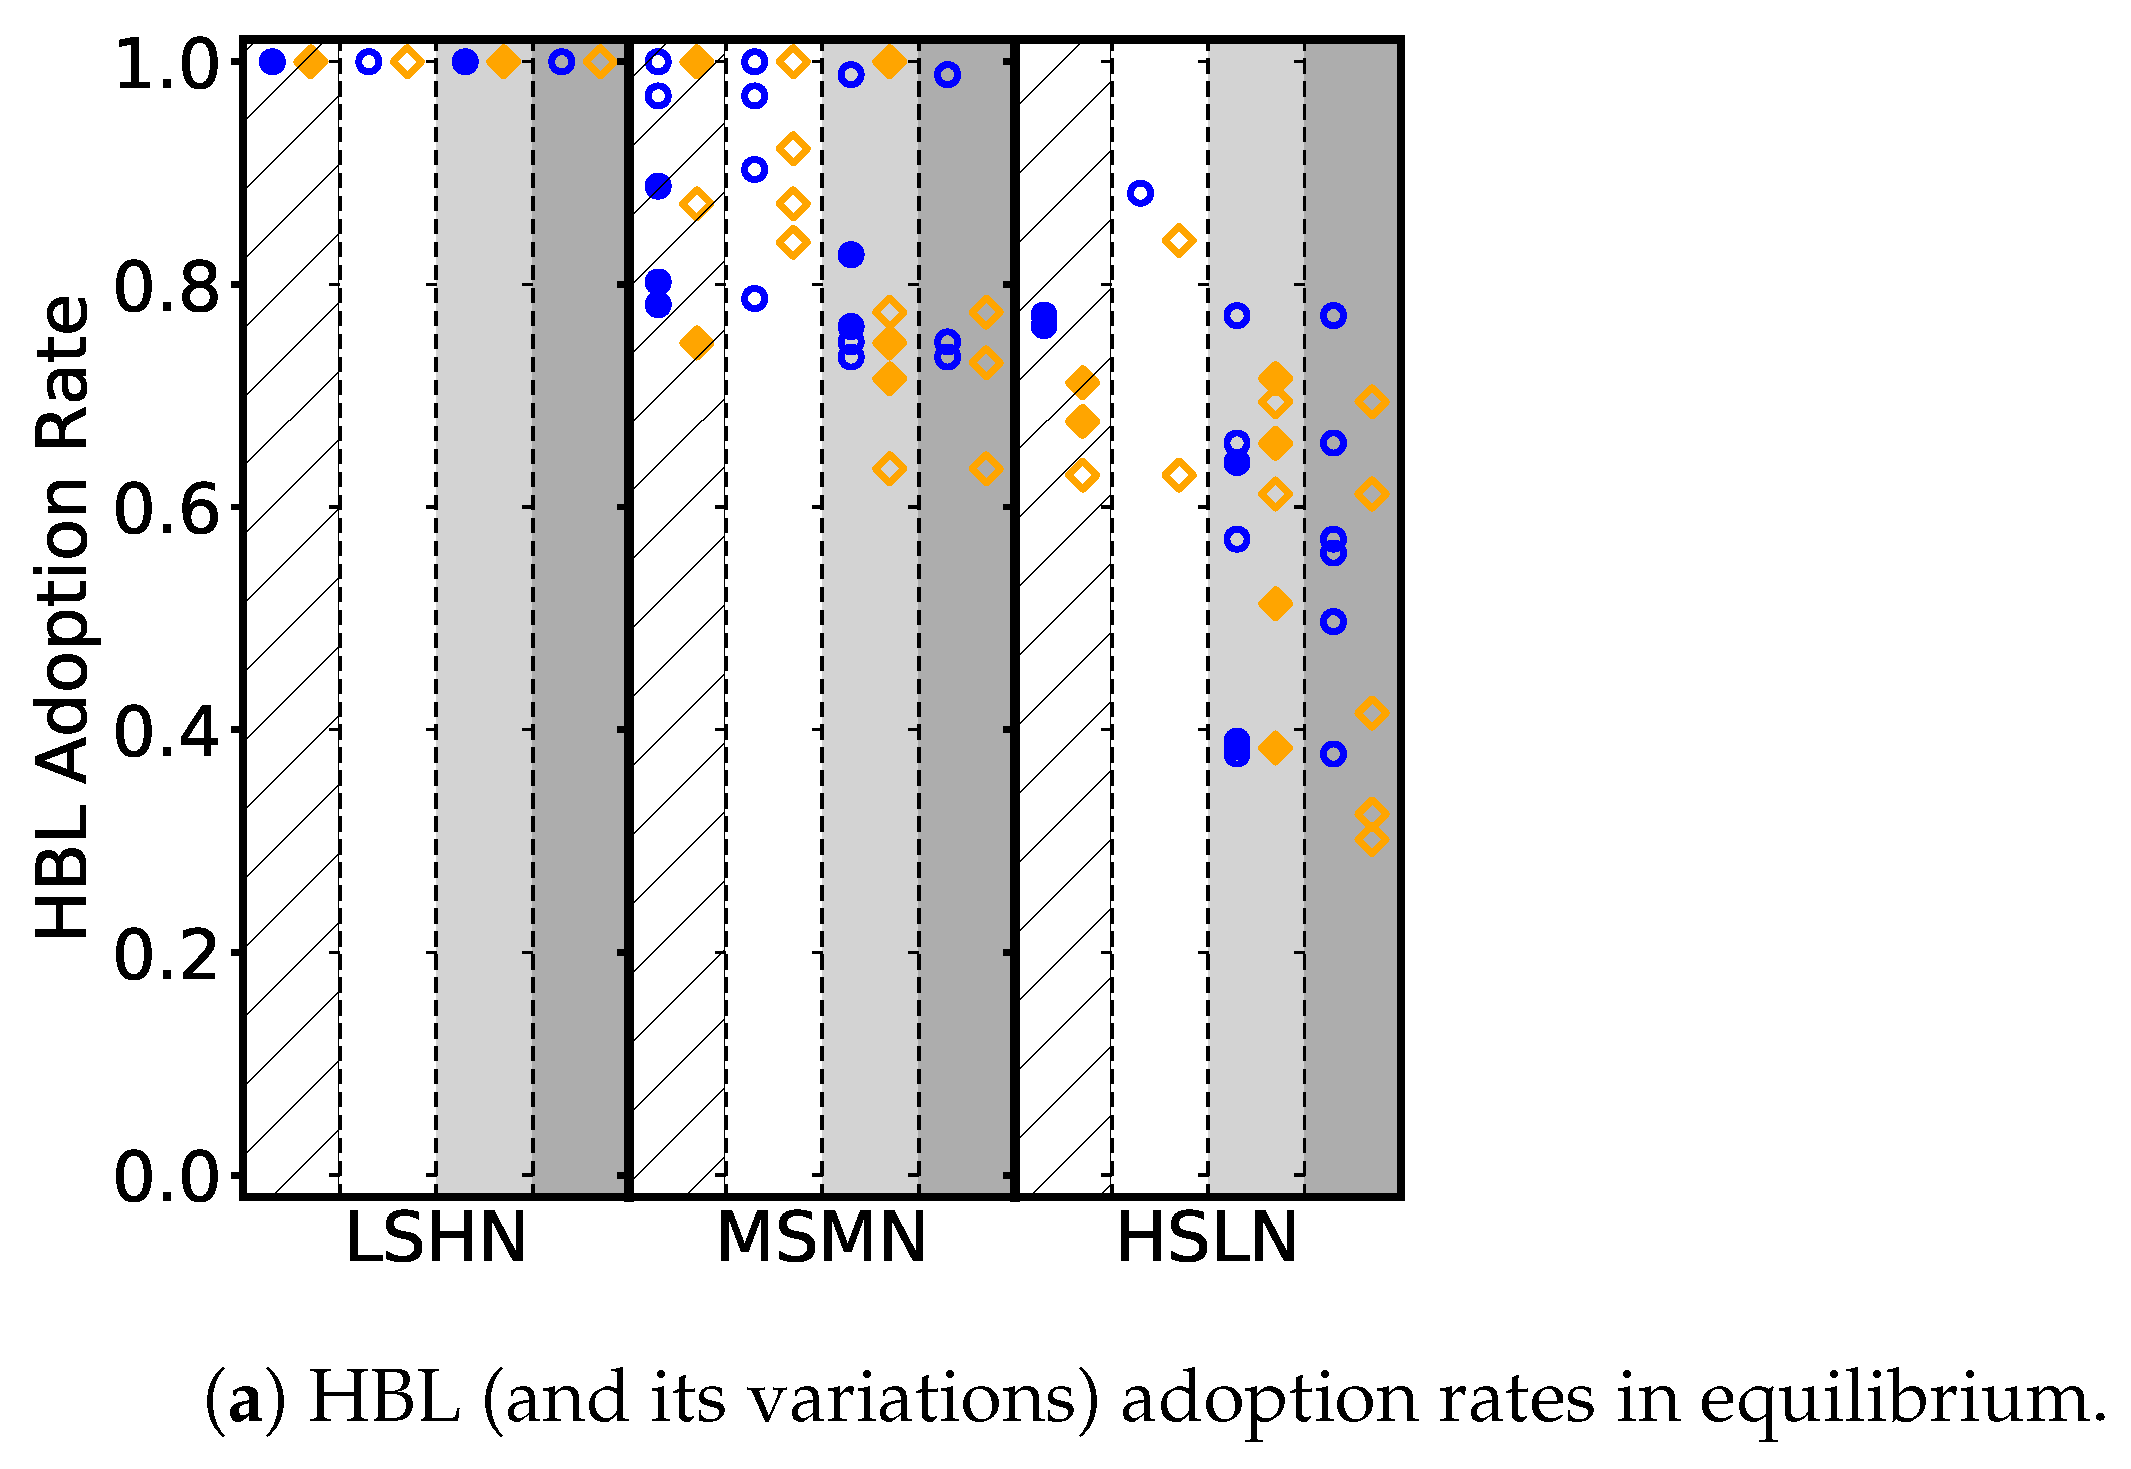


