Article

Thankful or Thankless: Does the Past’s Altruism Increase the Present’s Public Good Contributions?

by
Anna Lou Abatayo
1,2,3,*,
Lea Skræp Svenningsen
2,4 and
Bo Jellesmark Thorsen
2,3
1
Centre for Research on Geography, Resources, Environment, Energy, and Networks, Bocconi University, 20136 Milan, Italy
2
Department of Food and Resource Economics, University of Copenhagen, 1958 Frederiksberg, Denmark
3
Center for Macroecology, Evolution and Climate, University of Copenhagen, 2100 Copenhagen, Denmark
4
Climate Risks and Economics, Department of Technology, Management and Economics, Technical University of Denmark, 2800 Kgs. Lyngby, Denmark
*
Author to whom correspondence should be addressed.
Games 2020, 11(1), 6; https://doi.org/10.3390/g11010006
Submission received: 14 October 2019 / Revised: 26 November 2019 / Accepted: 16 December 2019 / Published: 21 January 2020

Abstract

:
Two important aspects of global environmental problems are that (1) the actions of past generations affect the opportunities of the present, and (2) both in the past and the present generations, collaboration across different countries is needed to provide global public goods. In this paper, we study how these two aspects influence public good provisions by running simultaneous intercountry laboratory experiments using a modified public goods game in Denmark, Spain and Ghana. While the theoretical predictions of the modified public goods game do not differ from that of the standard public goods game, our experimental results show otherwise. Pooling across results from our Danish, Spanish and Ghanaian participants, we find that present-generation individuals contribute a higher percentage of their endowments when they have better institutions and a lower percentage of their endowments when they have higher endowments. We also find that present-generation individuals contribute less to transnational public goods only when their initial conditions have not been affected by past-generation contributions.
JEL Classification:
H87; H41; D99

1. Introduction

The 21 km 2 island of Nauru in the Central Pacific once boasted of having the highest per-capita income enjoyed by any sovereign state in the world [1]. Their income came solely from strip mining the island of its phosphate deposits. Knowing that their major source of income was unsustainable, the 12,000 residents of the island invested the mining revenues in a trust fund to protect their future generations, ensuring them a source of income. They called this the Nauru Phosphate Royalties Fund. Decline in phosphate demands in the 1980s coupled with bad investment decisions (many in real estate), reduced the trust from AUS 1.53 billion in 1990 to under AUS 100 million today. As a response to its declining trust fund, Nauru promoted itself as a tax haven and an illegal money laundering center in the late 1990s. In a 2000 report, the Organisation for Economic Co-operation and Development (OECD) identified Nauru as one of the many jurisdictions that served as tax havens; but, in 2003, due to its commitments to transparency and exchange of information, it was subsequently taken off the OECD blacklist of renegade tax havens.
The lesson here is this: decisions made by individuals in the past generation affect not just the circumstances of individuals in the present generation, but also the decisions that they can make. The initial conditions of the present are constrained by the choices of the past. For instance, in the environmental literature, the present’s decisions on how much to allocate for climate mitigation or biodiversity conservation is a function of how much has been allocated for these projects in the past. Given what the past has done for the present, are present-generation individuals more likely to continue the past’s efforts—or less? In the context of present-day climate change mitigation and adaptation efforts, will our actions reinforce the willingness of future generations to make similar or better efforts?
In this paper, we examine, through a laboratory experiment, how public good contribution decisions made by individuals in the past generation affect present-generation circumstances and contribution decisions. We consider two scenarios in which the past can affect the present. First, past-generation individuals can leave bequests that would increase the present generation’s initial endowment. Mathematically, we do this by modifying the standard public goods game to allow public good contributions by past-generation individuals to positively affect the initial endowments of present-generation individuals. Second, the past generation can bequeath, instead of money, a “better world”, in terms of having better institutions in place. Mathematically, we do this by allowing past-generation contributions to positively affect the present generation’s marginal per-capita return (MPCR), which are the returns to investments in public goods. The assumption is that an economy with better institutions have higher returns to public good investments and hence, higher MPCRs. Under these two scenarios, we are interested in examining whether present individuals expend larger mitigation efforts when (1) returns from doing so are higher due to better institutions or (2) because individuals have a higher endowment of wealth.
Our intergenerational public good design draws from the literature on intergenerational public goods and public good externalities [2,3,4,5,6,7]. Similar to Sherstyuk et al. [6], the intergenerational nature of the public good comes in the form of past-generation decisions affecting the initial conditions of present-generation individuals. However, unlike Sherstyuk et al., present-generation individuals are not merely bystanders. They also make their own public good contribution decisions. Moreover, while Chaudhuri et al. [2] and Offerman et al. [8] look at the role of intergenerational advice, and Van der Heijden et al. [7] look at how information on how the choice made by past generation affect the choices made by the present generation, none, to the best of our knowledge, have looked at how public good decisions made by the past generation can affect decisions made by the present generation.
We also modify the standard public goods game in another way. An individual, past and present, can be contributing to provide a public good that is either national (such as national defense and public highways) or transnational (such as climate change mitigation and biodiversity conservation). A public good is transnational if it traverses national borders. In our transnational public good setup, individuals contributing to and affected by public good provisions, are individuals belonging to different countries. Our primary motivation for having such a setup stems from results on public good contributions with heterogeneous group compositions [9,10,11,12,13]. These studies find that although theoretically contributions should be similar between national and transnational public goods, individuals contribute more when they are in homogeneous groups as opposed to when they are in heterogeneous groups. Many experimental studies on heterogeneous group compositions, however, induce heterogeneity in the lab by giving individuals asymmetric show-up fees [9], asymmetric initial endowments [10,11,12,13], or asymmetric marginal per-capita returns [14,15]. Our paper exploits real-world heterogeneity by simultaneously running experiments in three very different countries. Hence, the paper provides external validity for results on how heterogeneous group compositions affect individual public good provisions behavior.
Running experiments simultaneous in three countries, with participants in each country interacting with participants in the two other countries, our experiment is not so much cross-country as it intercountry. This particular design is similar to experiments by Cappelen et al. [16] using a dictator game, Chuah et al. [17] using an ultimatum game, and Carpenter and Cardenas [18] using a common pool resource game. To our knowledge, only two papers conduct intercountry experiments using a public goods game. This paper differs from the first paper, Castro [19], in two ways: first, individuals in three, instead of two countries interact with one another; and second, we specifically picked our countries to make the transnationality of our public good more salient, i.e., instead of running experiments in England and Italy like Castro [19] does, we run our experiments in Denmark, Spain and Ghana. We made sure that there are noticeable differences across countries: in culture, in wealth, in historicity, and in geographic location. This paper also differs from the second paper, Buchan et al. [20], in that instead of using a global public goods game where participants divide their contributions between a local public good and a global public good, we use a standard, simple public goods game. Our setup allows us to collect data on how individual contributions to public good provisions change given differences in the geographical extent of a public good rather than investigating how individuals divide their endowments between two public goods.
Pooling across results from our Danish, Spanish and Ghanaian participants, we find that present-generation individuals contribute a higher percentage of their endowments when they have better institutions and a lower percentage of their endowments when they have higher endowments. We also find that present-generation individuals contribute less to transnational public goods only when their initial conditions have not been affected by past-generation contributions.
The rest of the paper is structured as follows. Section 2 presents our methodology. This includes an explanation of our experimental design, our modified public goods game and its predictions, and our experimental procedures. Our results are shown in Section 4. We discuss our results and conclude in Section 5.

2. Methodology

2.1. Experimental Design

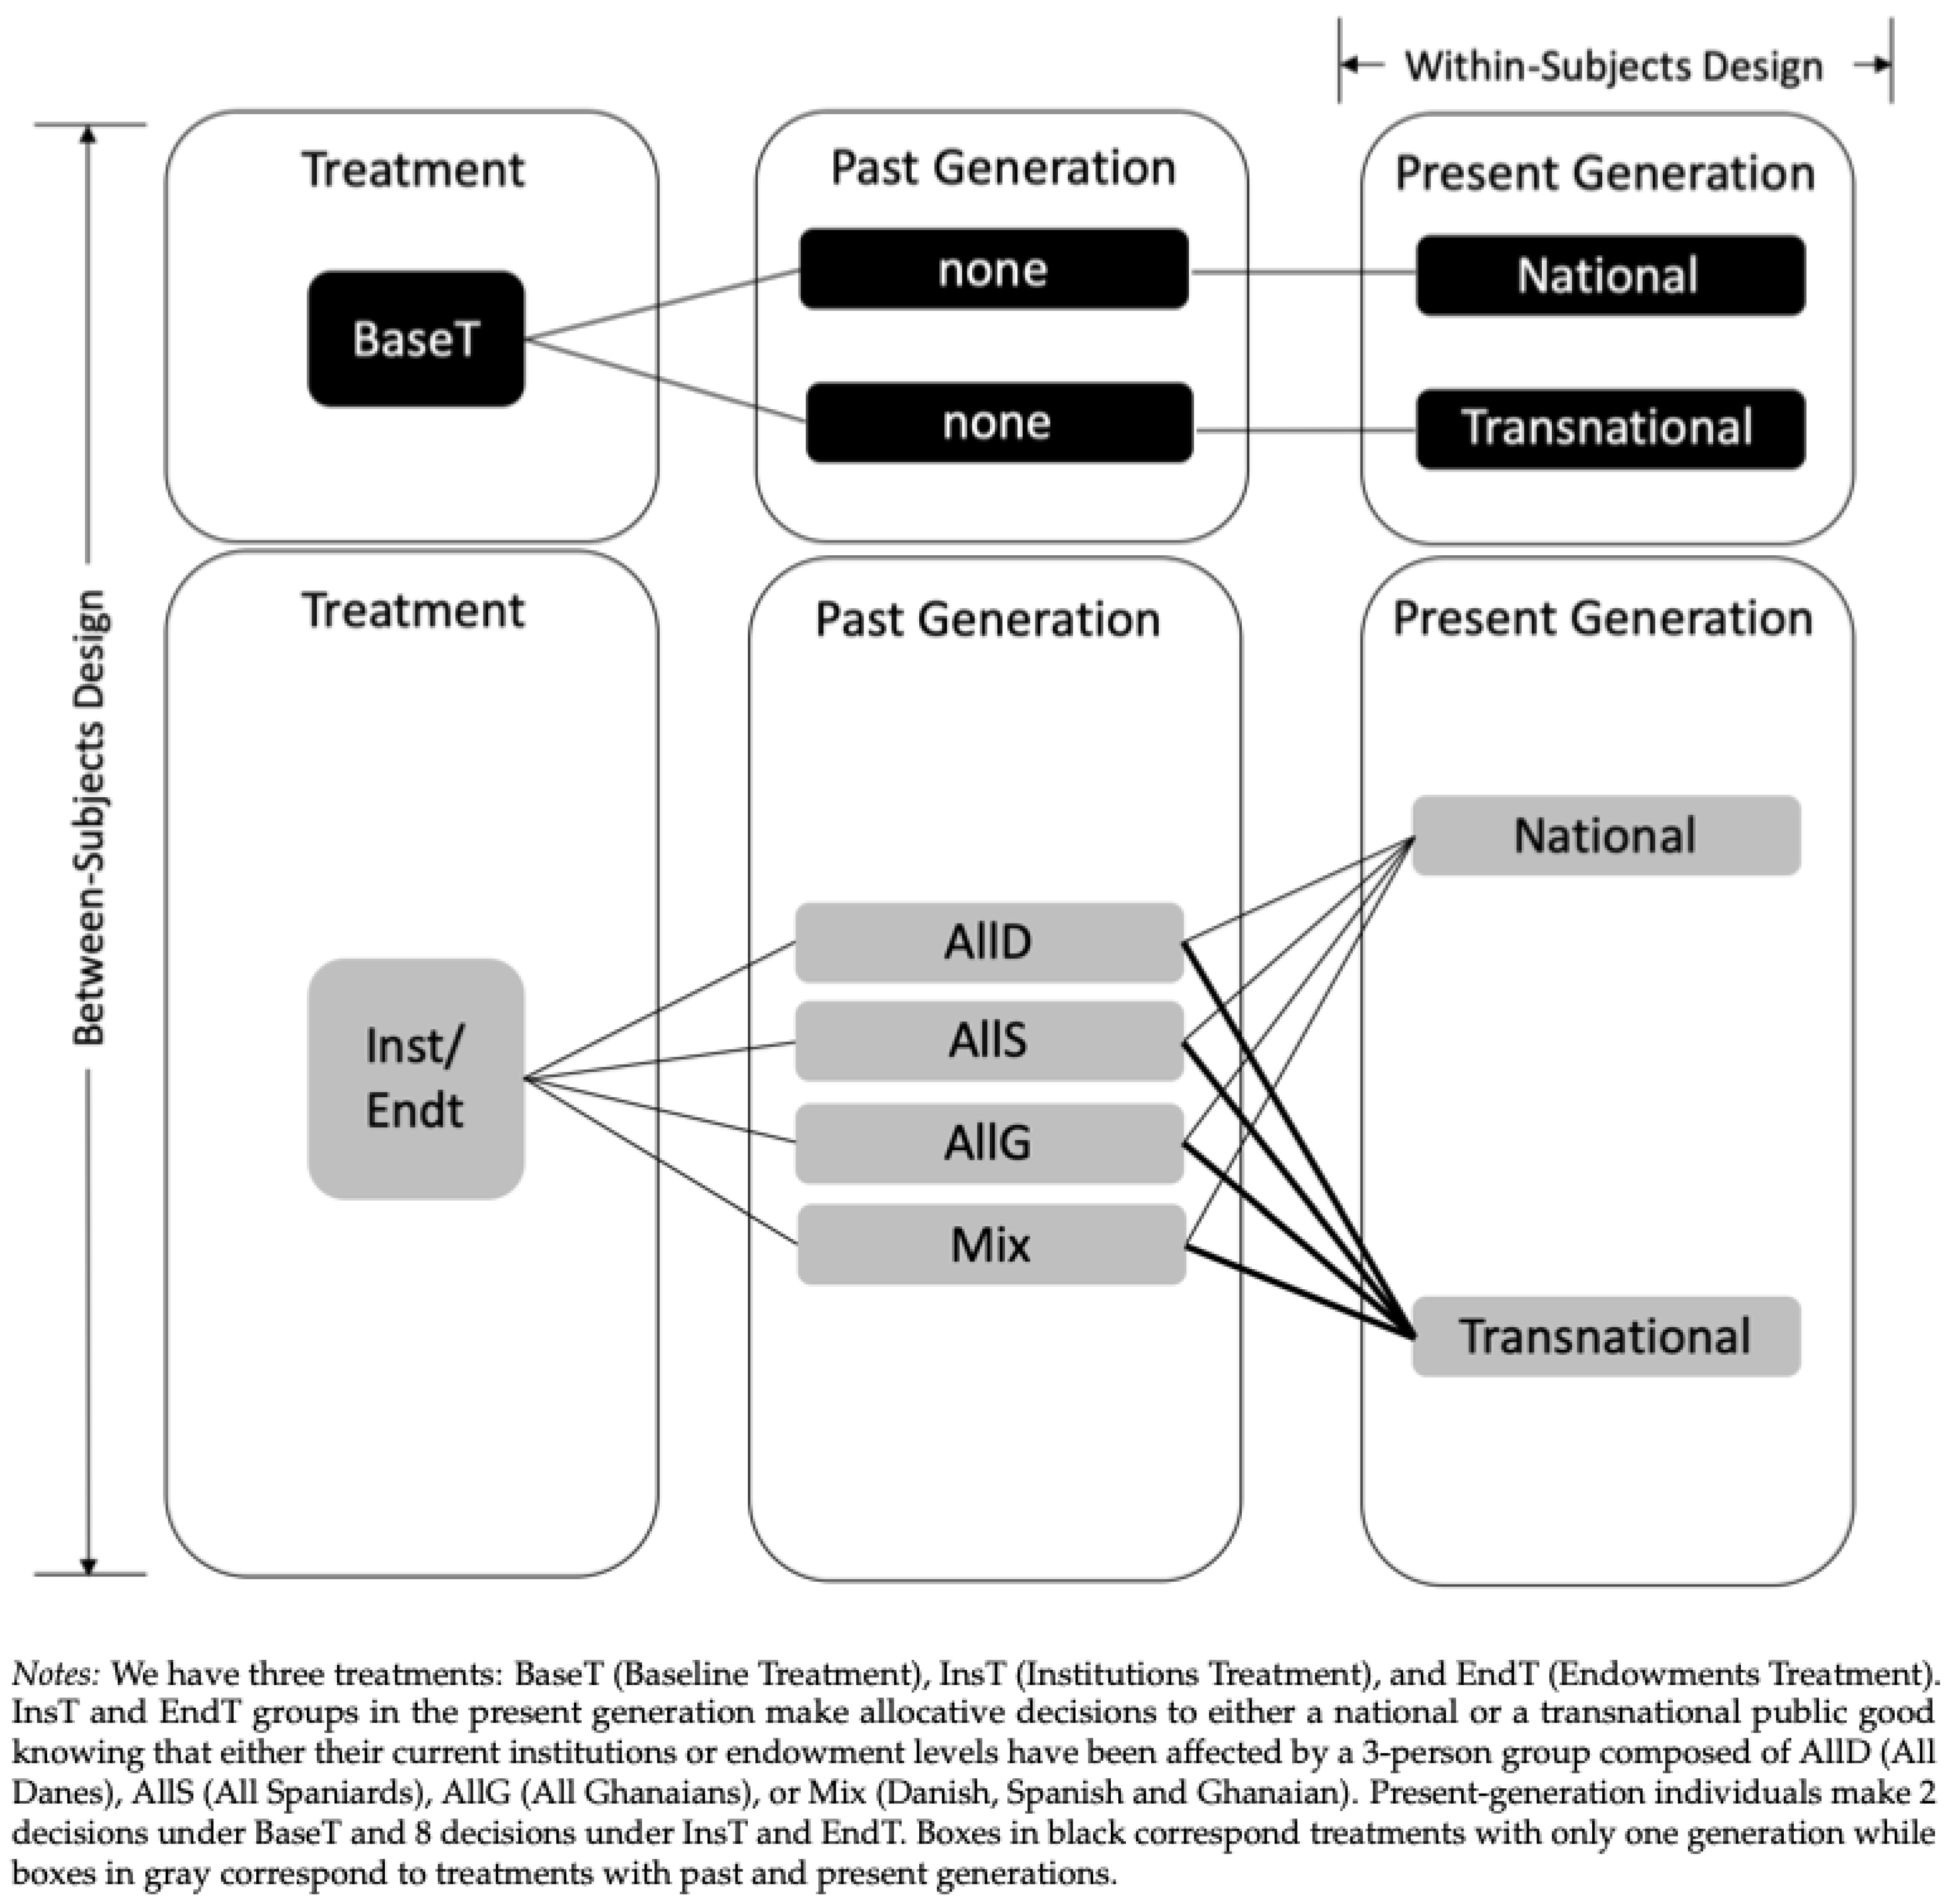
Our experiment is composed of three treatments: Baseline (BaseT), Institutions Treatment (InsT) and Endowments Treatment (EndT). A summary of our experimental design is presented in Figure 1. We use both a within-subjects and a between-subjects design: a within-subjects design to examine the effects of a transnational public good and a between-subjects design to examine the effects of an altruistic past generation. As depicted in Figure 1, a within-subjects design is when we compare allocative decisions made by the same individual within the same treatment in the present generation while a between-subjects design is when we compare allocative decisions made by different individuals across our three treatments. We will elaborate on this below.
To examine the effects of a transnational public good, we compare individual contributions when an individual is grouped with individuals from their own country (national public good) with the same individual’s contribution when grouped with individuals from two other countries (transnational public good). In this regard, we can hold everything constant and only vary the group composition to reflect the type of public good. Using the strategy method, we ask participants to make allocative decisions when a public good is national and when a public good is transnational. In Figure 1, this is depicted as the decision made under the “Present Generation” for “BaseT” (our baseline treatment). To ensure that the sequence at which they make allocative decisions do not influence their decisions, we shuffle the order at which decisions were solicited.1
This particular design makes use of a version of the strategy method [21]. An individual, assigned to BaseT, makes two contribution decisions: (1) contribution to the national public good and (2) contribution to the transnational public good. The participants are informed that at the end of the experiment, a decision is randomly picked, implemented and paid in cash. Doing so makes the experimental design cleaner, as we no longer must worry that the differences we find between national and transnational public good contributions are due to differences in assigned individuals. It is worth noting that there is a debate in the literature regarding running experiments using the direct-response method as opposed to the strategy method. A meta-analysis by Brandts and Charness [22] finds that whenever a treatment effect exists in the strategy method, it also exists in the direct-response method. Hence, our use of the strategy method should not invalidate our statistically significant results.
To examine how present-day public good contributions change when present-generation institutions or endowments are endogenous to past-generation decisions, we compare public good contributions under BaseT with public good contributions under InsT (for the effect of endogenous institutions) and EndT (for the effect of endogenous endowments). Under both InsT and EndT, a past-generation group of individuals (called “Set A” in the experiment) first played the standard public goods game knowing exactly how they will be affecting a future generation group of individuals (called “Set B” in the experiment). Only after decisions by past-generation individuals were collected and MPCRs or endowments were computed can present-generation individuals decide how much of their present endowment to contribute for public goods provision. We compare this contribution by present-generation individuals with the contribution of those under BaseT. 2
In both InsT and EndT, past-generation individuals make allocative decisions based on whether they have a national or transnational public good and whether they are influencing an all-Dane (AllD), all-Spaniard (AllS), all-Ghanaian (AllG), or Dane-Spaniard-Ghanaian (Mix) present group. Present-generation individuals, in turn, make allocative decisions based on whether they have a national or transnational public good and whether their institutions or endowments have been influenced by an AllD, AllS, AllG, or Mix past group. Again, all these are done via the strategy method for the same reason discussed above for BaseT. The only difference between BaseT and these two other treatments is that under the present generation, an individual assigned to BaseT only makes 2 decisions while an individual assigned to InsT or EndT makes 8 decisions. To account for the fact that an individual makes multiple decisions, we cluster our standard errors on an individual level in all our regressions below.

2.2. Game and Predictions

Both past and present-generation individuals play the standard public good game. Each participant i is given an endowment E and is asked how much of their endowment they are willing to contribute to the group account, x i . Participants can earn an experimental dollar (E$) from every token that they keep and β , where 1 / n < β < 1 , for every token invested by them and the other ( n 1 ) members of their group. Mathematically, we have:
π i = ( E x i ) + β i = 1 n x i
i = 1 , …. , n . The social optimal solution is for participants to contribute all their tokens to the group account while the Nash equilibrium solution is for participants to contribute nothing to the group account.
Participants under BaseT, InsT and EndT make allocative decisions under two different kinds of public goods: a national and a transnational public good. These two goods differ in the national composition of the group and do not affect either the symmetric Nash equilibrium or the social optimal solutions.
InsT and EndT differ from BaseT in that public good contributions by past-generation individuals positively affects either the β or the E of future generation individuals.3 Under InsT,
β P r = β P a 1 + i = 1 n x i P a i = 1 n E P a ,
where the superscripts P a and P r denote whether an individual belongs to a group in the past generation or a group in the present generation, respectively. On the other hand, under EndT,
E P r = E P a 1 + i = 1 n x i P a i = 1 n E P a .
The Nash equilibrium and the social optimal solutions under InsT and EndT are exactly the same as BaseT. In our experiment, E P a = E = 20 , β P a = β = 0.40 , and n = 3 . This yields a profit of 20 E$ under Nash equilibrium and a profit of 24 E$ under social optimal. If individuals in the past generation contribute their entire endowment for public good provisions, this will double either the marginal per-capita return (MPCR) or the endowment of present-generation individuals. In this situation, if present-generation individuals also contribute their entire endowment for public good provisions, their profits under both InsT and EndT will be 48 E$.

3. Hypotheses

Although the predictions of our modified public goods game do not differ from the predictions of the standard public goods game, previous literature dealing separately with intergenerational and intercountry games suggest that human behavior in a lab may differ from the Nash equilibrium predictions. Previous literature on past individuals giving present individuals advice [2,8] as well as giving present individuals information on the choices made by the past [7] have been shown to change individual behavior. Hence, we have the following hypothesis regarding the behavior of past-generation individuals:
Hypothesis 1.
(Behavior of Past-Generation Individuals) Past-generation individuals whose public good contributions can increase present-generation initial endowments or improve present-generation endowments will contribute more.
As for the present generation, previous experimental results have shown that higher MPCRs incentivize individuals to contribute more to public good provisions (see the literature review of Ledyard [23]). Hence, we have the following hypothesis for the InsT treatment:
Hypothesis 2.
(Institutions and Public Goods) With better institutions, present-generation individuals will contribute a higher share of endowments for public good provisions.
Previous experimental papers have also found that when endowments increase, the ratio of public good contributions to total endowment either decrease [24,25] or stay the same [26]. Hence, we have the following hypothesis:
Hypothesis 3.
(Endowments and Public Goods) With higher endowments, present-generation individuals will contribute either less or exactly same share of their endowments for public good provisions as they would under baseline.
Lastly, literature on the effects of heterogeneous group compositions on public good provisions find that heterogeneity lowers contributions [13,15,19]. As such, we have the following hypothesis:
Hypothesis 4.
(Transnational Public Goods) Contributions for transnational public goods will be less than contributions for national public goods, regardless of whether current institutions or endowments are affected by past-generation public good contributions.

Procedures

We ran intercountry public goods experiments with Danish, Spanish and Ghanaian undergraduate students in their respective countries. Most of our participants were undergraduate students from the University of Copenhagen (Denmark), Pompeu Fabra University (Spain), and University of Ghana (Ghana).4 We chose to run in Denmark, Spain and Ghana for two primary reasons: external validity and logistics. Running experiments across countries and having individuals in different countries interact with one another provides greater external validity for the effects of a transnational public good. In this regard, we made sure that all our participants were nationals in each of the three respective countries. However, because we wanted to run our experiment simultaneously across countries, we faced great logistical constraints. We wanted countries within the same time zone. To make salient the transnationality of our transnational public good, we also wanted countries that were vastly different from one another: historically, culturally, linguistically, socially, and economically.
Due to regular power outages in Ghana, we decided to run our experiments in all countries using pen and paper. To collect and share cross-country information, experimenters in each country updated a Google Sheets file in real time. All experimenters and instructors were trained in Denmark prior to the experiment, and instructors were nationals of the country they were instructing in. Participants in Denmark and Spain were recruited via the Online Recruitment System for Experimental Economics (ORSEE) [27]. In Ghana, a database for participants needed to be created first. Ghanaians in the created database were randomly invited to sessions. Participants either sat with dividers between them or two seats apart. Communication between participants was prohibited. Instructions, available in Appendix A, were given in the country’s language of instruction.5 Sample decision sheets for partiipants are also availabe in Appendix B.
We had 612 participants in total: 204 participants in Denmark, 204 participants in Spain and 204 participants in Ghana. Table 1 shows the number of participants we have in each treatment for each country. A total of 216 participants were assigned to BaseT, 216 participants were assigned to InsT and 180 participants were assigned to EndT. We initially planned to run a total of 20 sessions with exactly 12 participants per session in each country. However, despite inviting more than 12 participants to each session, we had sessions with less than 12 participants. We had to drop these sessions across all our three countries. All subjects gave their informed consent for inclusion before they participated in the study. The study was conducted in accordance with Danish legislation, under the Danish Protection Act (REF: 2015-15-0117).
At the end of the experiment, each participant filled in an exit questionnaire that collected demographic characteristics as well as other measures of preferences. Demographic questions include age, gender, field of study, marital status and number of children. We asked the individuals whether they believed similar experiments were being conducted in the other two countries and had them rate their level of risk-taking. Belief was measured as either a yes or a no while risk was measured on a 10-point scale with 1 as extremely risk averse and 10 as extremely risk-loving. We also asked them whether or not they agree with statements that a particular nationality can be trusted, an individual from a particular nationality is not cooperative, an individual from a particular nationality is wealthy, and an individual from a particular nationality does not care about the participant’s country and people. All these were measured using a 4-point Likert scale, with 1 as strongly disagree and 4 as strongly agree. A copy of the questionnaire can be found in Appendix C.
Our participants were all above 18 years of age. On average, Danish participants were 24 years old, Spanish participants were 21 years old and Ghanaian participants were 23 years old. 46%, 34% and 72% of our Danish, Spanish and Ghanaian participants, respectively, were male. From the exit questionnaire, we find that 77% of our Danish and Spanish participants and 89% of our Ghanaian participants believed that they were interacting with individuals in the two other countries. These, along with individual measures of risk and trust preferences, wealth perception, and cooperativeness are included as controls in our regressions.
On average, participants in Denmark, Spain and Ghana earned 126.17 DKK, 7.96 EUR and 10.11 GHS, respectively, for an hour of participation. This is higher than the minimum hourly wage, purchasing power parity corrected, of 110 DKK in Denmark, 6 EUR in Spain and 7 GHS in Ghana. Participants were only informed of the exact exchange rate from experimental dollars to national currency in their country. They were also told that the value of each token is adjusted relative to each country’s minimum hourly wage.

4. Results

4.1. Main Results

Public good contributions by past-generation individuals were higher when these contributions were able to affect either the institutions or endowments of the next generation. On average, those in BaseT contributed an average of 7.65 (std. dev. of 6.06) while those in InsT and EndT contributed an average of 8.79 (std. dev. of 6.51) and 8.14 (std. dev. of 5.86), respectively. One-tailed t-tests show that contributions under BaseT statistically significantly differ from contributions under InsT (BaseT < InsT: p = 0.0010) but not under EndT (BaseT < EndT: p = 0.0623).6 Ordinary least squares (OLS) regression results with standard errors clustered at the individual level (Column (1) of Table 2) show positive coefficients for both InsT and EndT, but only statistically significant for InsT. When controls (order, gender, age, belief, and risk) are included in the regression, the coefficient of EndT becomes statistically significant.
Result 1.
(Past-Generation Contributions.) When past-generation public good contributions can affect present-generation institutions and endowments, they contribute more to public good provisions.
Table 3 presents the results for the public good contributions of present-generation individuals. The baseline for columns (1), (3) and (5) is BaseT while the baseline for column (7) is the interaction between BaseT and a national public good. The even numbered columns have the same specification as the column to its left but with additional controls. We control for gender (1 = Male), age, belief (1 = Believed the experimental setup), and stated risk aversion (1 = risk averse, 10 = risk-loving). Hence, the baseline for the even number columns are individuals in BaseT who are female, disbelieving of the experimental setup and risk averse.
Results in Table 3 shows that being in InsT lead to a higher percentage of tokes contributed in the pooled sample, a result that is mainly driven by contributions to transnational public goods. The EndT treatment, on the other hand, is only marginally statistically significant in the pooled sample. However, when analyzing contributions to just national public goods (columns (5) and (6)), we see that higher endowments lead to a decrease of 0.03 percentage points.
Table 4 examines the effect of a marginal increase in MPCR or endowments is on the percentage of tokes contributed. Results for these regressions support regression results in Table 3. Individuals in InsT, contribute a bigger percentage of their endowments when MPCRs are higher. Results are consistent between with and without controls for transnational public goods. Individuals in EndT, on the other, contribute a lower percentage of their endowments when endowments are higher. As in Table 3, these results are consistent for national public goods.
Hence, we have the following results:
Result 2.
(Institutions or Endowments and Public Goods) Present-generation individuals contribute a higher percentage of their endowments when they have better institutions and a lower percentage of their endowments when they have higher endowments. These results are consistent for transnational public goods under better institutions and for national public goods under higher endowments.
As for contributions for transnational versus national public goods, F-tests between coefficients in column (8) of Table 3 find that it is only for BaseT where contributions for national public goods are higher than contributions for transnational public goods ( p = 0.0302 ). Contributions between national and transnational public goods are statistically similar under InsT ( p = 0.8655 ) and EndT ( p = 0.4412 ). Hence, we have the following result:
Result 3.
(National vs. Transnational Contributions). Present-generation individuals contribute less to transnational public goods compared to national public goods only under our Baseline treatment.

4.2. Other Results

While it is not a core part of our hypothesis, we additionally investigate whether there are differences in the present-generation public good contributions across countries. Table 5 presents results from running a specification similar to columns (7) and (8) of Table 3. The odd numbered columns are regressions without control variables and the even numbered columns are regressions with controls. Since we are now investigating separately per country, as opposed to the pooled investigation in Section 4.1, we include country-specific controls for perception of trust, cooperativeness, wealthy and degree of caring on top of the standard controls of gender, age, belief, and risk.
Table 5 consistently show that the percentage of tokens contributed decreases in all countries when public goods are transnational as opposed to national. This lends support to Hypothesis 4 above. We also find that for Danes, an increase in their initial endowments decreases the percentage of their tokens that they contribute, regardless of whether the public good is national or transnational. The same coefficients are positive but not statistically significant for Spain and changes signs for Ghana when controls are added. It would seem that the negative results for EndT in Section 4.1 are mainly driven by our Danish sample. Hence, we have the following result:
Result 4.
(Present-Generation Contributions by Country). Transnational public goods significantly decrease present-generation public good contributions of our Danish and Spanish participants. Present-generation Danish participants with higher endowments significantly decrease the proportion of their endowments that they contribute to the provision of public goods, regardless of whether these goods are national or transnational.

5. Discussion

5.1. Intergenerational and Transnational Effect

Are present-generation individuals thankful or thankless for having been positively affected by past-generation individuals? Our paper investigates how contributions to public good provision changes when either the institutions or the endowments of present-generation individuals are affected by public good contributions by past-generation individuals. We believe this is important, as consciously and unconsciously, the decisions made by different individuals in the past has bearing on the present generation’s circumstances and behavior.
Pooling our Danish, Spanish and Ghanaian participants, we find that past generations contribute more, when they know they affect the options of future generations. Although our paper mainly looks at differences in behavior between BaseT and each of our two treatments, InsT and EndT, we note that past-generation individuals contribute more under InsT than under EndT. This difference is statistically significant, although the implications in terms of the magnitude in possible profits is not significantly different. The average contribution of 8.79 under InsT resulted in a present-generation MPCR of 0.57 while an average contribution of 8.14 resulted in a present-generation Endowment of 28.02 tokens. If individuals in both treatments played the optimum, those in InsT would have earned 34.20 experimental dollars while those in EndT would have earned 33.62. If both the past and the present generations played the optimal, present-generation profits between InsT and EndT would be payoff equivalent.
Our intergenerational results are clear in at least one aspect. Decisions made by individuals in the past—although, indeed past and can no longer be changed—significantly affect the behavior of present-generation individuals. The effect varies, depending on what has been affected and who has affected it. We find that present-generation individuals contribute a higher percentage of their endowments when they inherit better institutions from past generations, yet contribute a lower percentage of their endowments when they inherit higher endowments.
We also find that present-generation individuals contribute less to transnational public goods only when their initial conditions have not been affected by past-generation contributions. Our transnational results under the baseline coincides with the results from the literature on heterogeneous group compositions. Heterogeneity, whether naturally occurring or lab-induced, increases free riding and as such, decreases contributions to public good provisions [13,15,19].
While our hypotheses do not concern country level results, we briefly comment on those too. Our results vary substantially between Denmark, Spain and Ghana. Without a past generation, Danes and Spaniards contribute less to transnational public goods while Ghanaians behave the same. This changes when they are informed that a past generation has affected the present’s institutions or endowments. Better institutions increase the public good provisions by Danes and Spaniards. For the Danes, this happens regardless of the group composition of the past generation. For Spaniards, this happens only when the group composition of the past generation is all-Ghanaian. With only three countries and a multitude of things varying across countries, there is little we can say and formally test about the observed differences in behavior across Denmark, Spain and Ghana. Hence, we can only offer some suggestive speculations to this end, and have no way of interpreting effects of differences in culture. We speculate that the behavior of the Danes and Spaniards under our institution treatment can be explained by better institutions generating a higher trust in that their contributions to public goods provisions will yield higher returns, leading them to invest more.
We note that while the samples differ in several respects, e.g., on gender, age and similar, our pooled results include sufficient controls for these differences to be accounted for.

5.2. Experimental Design Caveats

While our results appear clear, consistent and robust, we acknowledge that the external validity of our results are constrained by our experimental design and our chosen sample. Our study shares the constraint of most laboratory experiments in that (1) participants make decisions in an artificial environment and (2) participants are university students. The former leads to a type of scrutiny that differs from the kind of scrutiny present in the real world [28] while the latter implies that our experiment participants are not representative of the population. Both these constraints entail difficulty in generalizing our results. However, despite the first constraint and given the complexities in studying public goods that span borders and generations, we believe that a laboratory experiment is the best way to examine how individual contributions to public good provision changes given different types of public goods. Many experimental papers have also shown that results for laboratory experiments like ours are reflective of real-world behavior [29,30,31]. As for the second constraint, this is something we have deliberated with at length. By using undergraduate students, we have more comparable sample across countries since, to some extent, we are keeping educational attainment, profession and age constant. In addition, our study is not so much interested in the levels of public good provisions as we are with differences in public good provisions across treatments. We believe that despite these constraints, important implications can be drawn from our results. Our paper sheds light on what happens to individuals’ contributions to public good provision when informed how past generations actions have affected either the institutional set up or their endowment. Thus, this behavior in itself may not represent an increase in altruistic motivations as much as a framing effect, which is nevertheless relevant for real-world decision contexts.
A final comment is needed on the parameters chosen for the public goods game. Given the group size of 3 individuals, it could be argued that our MPCR of 0.4 does not provide a strong incentive for contributing to the public good. Nevertheless, we find fairly clear and intuitive treatment effects in our pooled sample. A stronger incentive could have raised overall contributions, but we find no reason to believe it would eliminate or otherwise affect treatment effects.

6. Concluding Remarks

The increasing difficulty in securing co-operation around public goods provision in the transnational relative to the national case reflects the findings in the experimental literature’s that heterogeneity among participants causes lower contributions and co-operation. This fundamental behavioral finding is likely part of what causes difficulties faced by transnational and supra-national organizations, such as the European Union and the United Nations, which are responsible for negotiating legislation and agreements targeting policies that require cross-country co-operation.
Pooling across our Danish, Spanish and Ghanaian participants, we find that past generations contribute more, when they know they affect the options of future generations. We find that present-generation individuals contribute a higher percentage of their endowments when they inherit better institutions from past generations, yet contribute a lower percentage of their endowments when they inherit higher endowments. We also find that present-generation individuals contribute less to transnational public goods only when their initial conditions have not been affected by past-generation contributions.
Thus, our results bring positive news moving forward. Those who have been positively affected by decisions made by individuals in the past generation are more likely to contribute to present-day public goods provision. This suggests that in general, individuals are thankful, rather than thankless, and that positive actions reap positive outcomes.

Author Contributions

All authors designed the experiment and created the draft of the paper. A.L.A. and L.S.S. ran the experiment. A.L.A. analyzed the data. All authors have read and agreed to the published version of the manuscript.

Funding

The authors would like to acknowledge the Danish National Research Foundation for funding for the Center for Macroecology, Evolution and Climate (grant number DNRF96). A.L.A. would like to acknowledge the support of the European Research Council under the European Community’s Programme “Ideas” (Call Identifier ERC-2013-StG/Grant No. 336703, Project RISICO, “RISk and uncertainty in developing and Implementing Climate change pOlicies”).

Acknowledgments

We thank Rosemarie Nagel, Wisdom Akpalu, and Finn Tarp for their organizational and logistical assistance and for enabling us to conduct our study on their university campuses. We are also grateful for the extensive on-the-ground assistance and translation services of Elvira Rey Redondo, Gianluca Vassallo, Isaac Ankamah-Yeboah, Josep Renard Segarra, Mathias Vodrup-Schmidt, Mathilde Lund Holm, Maria Ellemann Hansen, and Wisdom Takumah.

Conflicts of Interest

We have no conflict of interest to disclose.

Appendix A. Instructions

Below are the English instructions for the experimental sessions in Ghana for our three treatments. The Baseline instructions are labeled “PG-T0G”, the Institution Treatment instructions are labeled “PG-T1G”, and the Endowment Treatment instructions are labeled “PG-T2G”. Danish and Spanish instructions are available upon request.
Prior to reading these instructions, participants were told to put their cellphones in silent mode. They were also told that they are not allowed to talk to other participants. Participants signed a consent form to signify their consent.

Appendix A.1. Experiment Instructions (PG-T0G)
Introduction
Welcome to the experiment. For showing up to today’s session, you will be paid 3 GHS. You will have a chance to receive additional money as the result of the outcome in this experiment. At the end of the experiment, we will pay you in cash an amount equal to 0.4 GHS for every E$ that you earn.
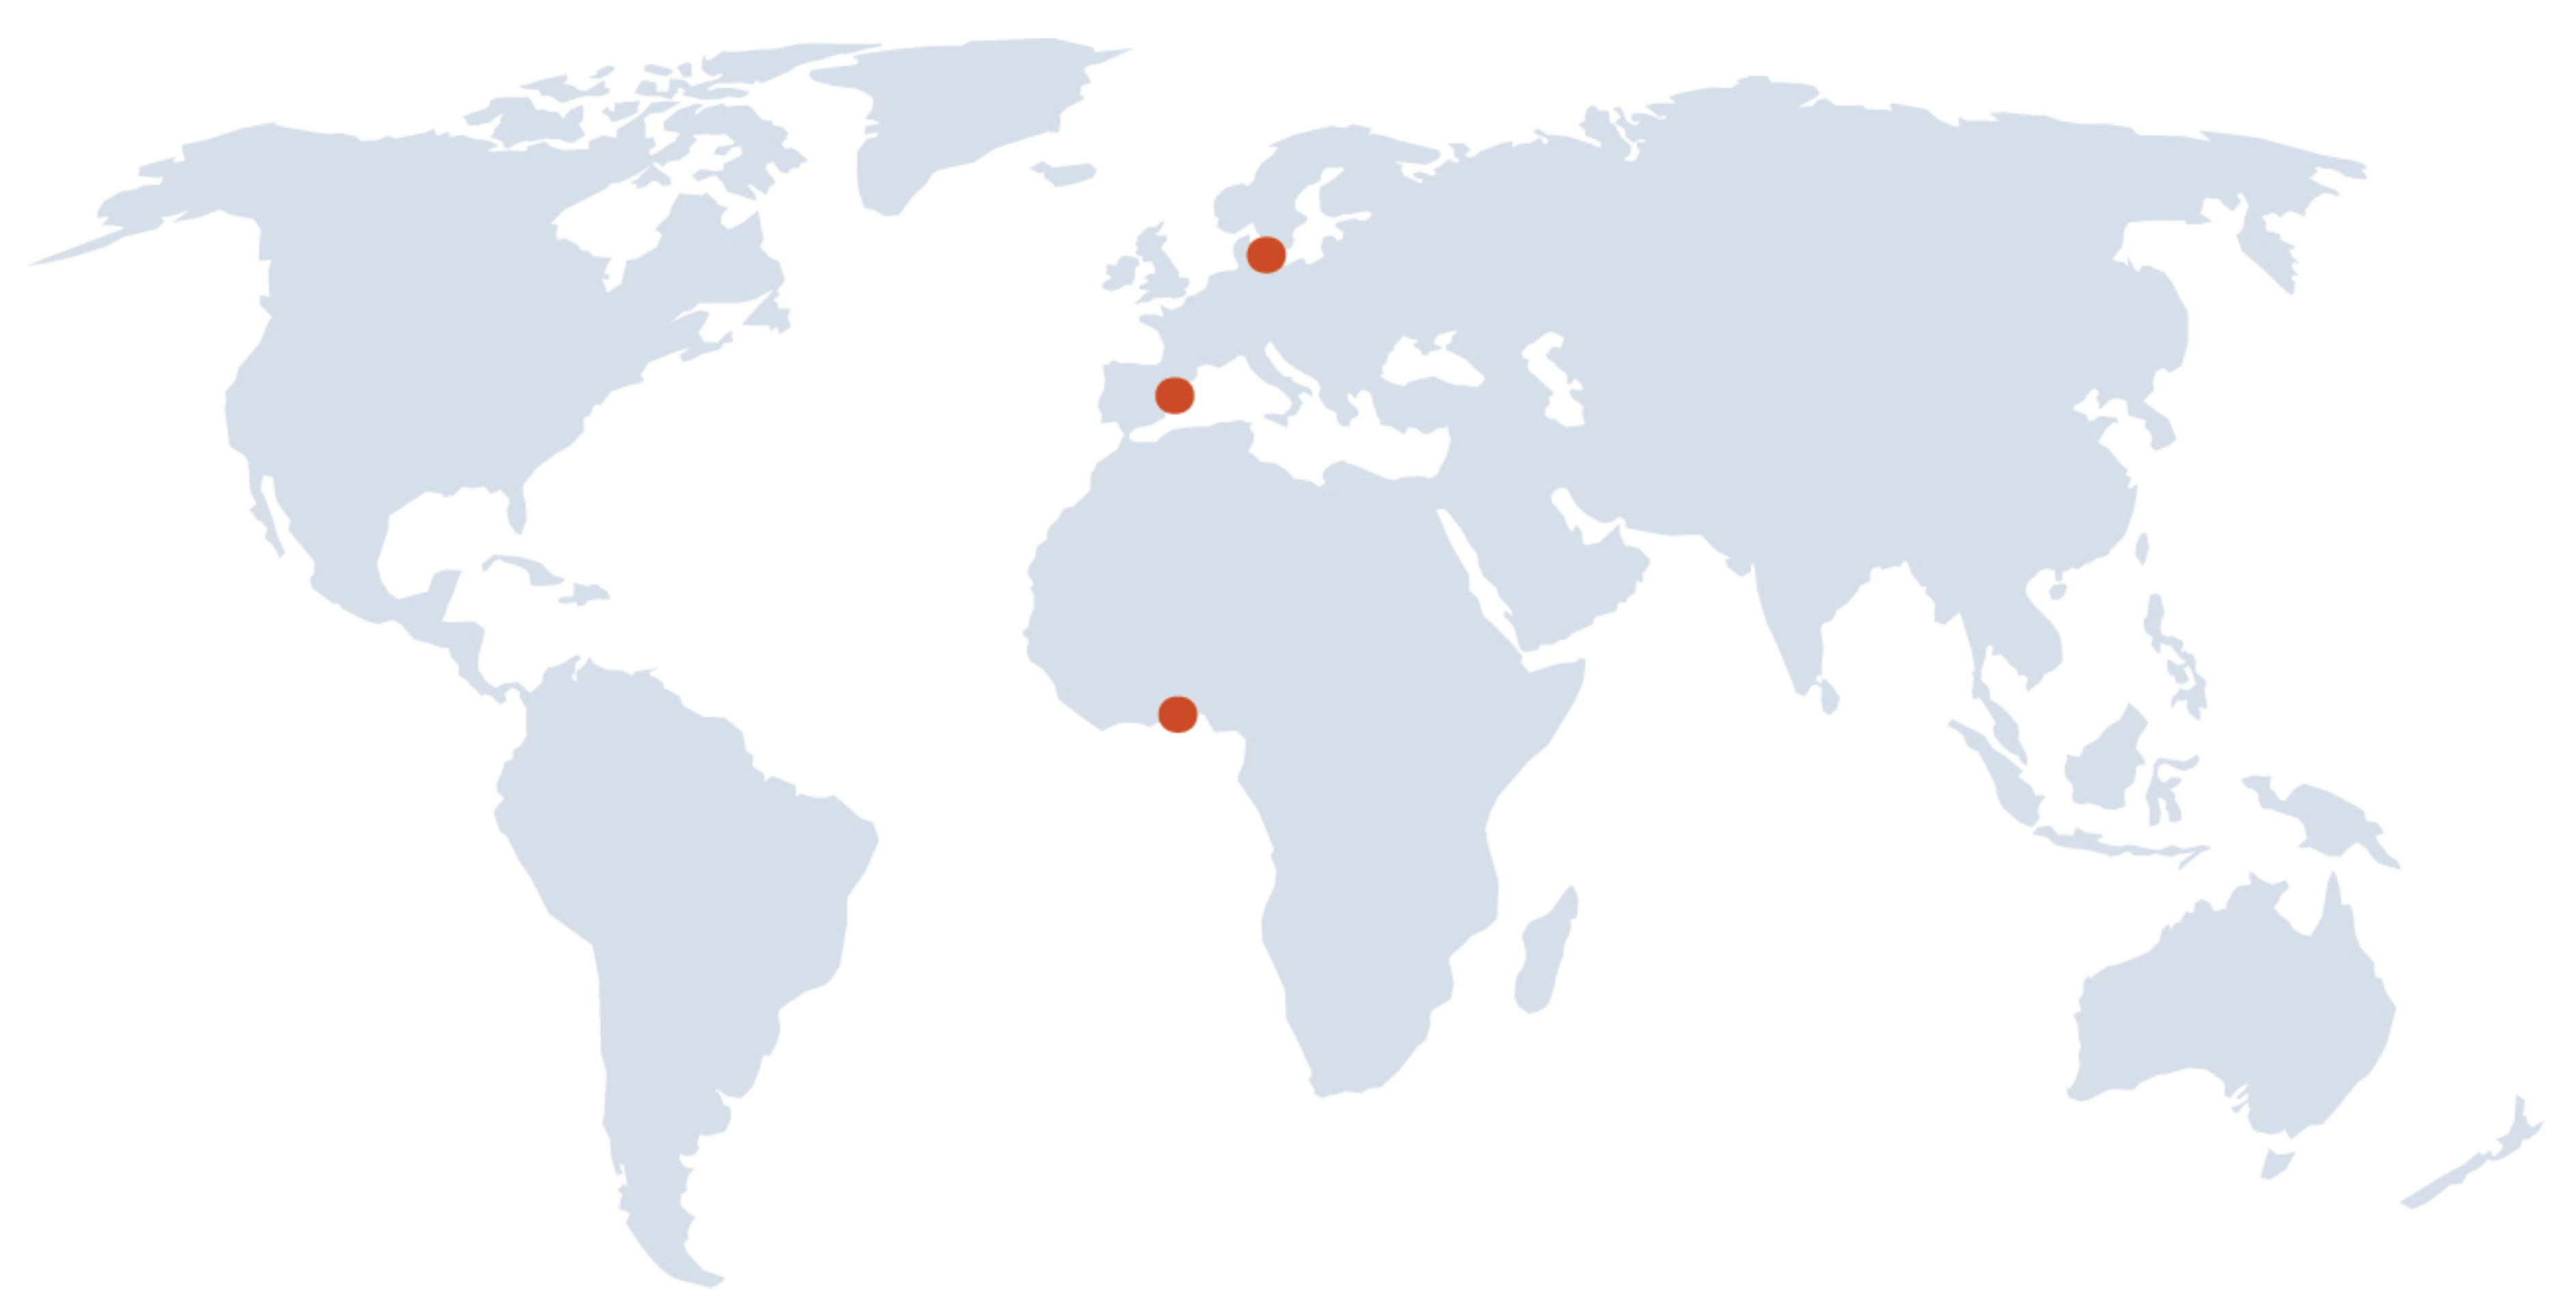
We are currently running similar experiments in Spain and Denmark. This means that right now, participants in these two countries are being read the same instructions as you. At the end of these instructions is a map of the world. The dots on the map indicate the places where the exact same experiment is taking place.
Are there any questions?
Decisions and payoffs
At the beginning of this decision-making experiment you will be randomly matched with two other people, to form a group of three. The two other members of your group could be from Denmark, Spain or Ghana. Before you make your decision, you will be told which country the two other members of your group come from. The names of the other members of your group will not be revealed.
You and each other person in your group will receive 20 tokens. You must decide how much of this amount to keep and how much to invest in the Group Account: you can invest any number between 0 and 20. Only integer values will be accepted.
Each token that you keep earns you 1 E$ while each token invested in the Group Account by you and other members of your group will earn you and each other member of your group 0.4 E$. Thus,
E a r n i n g s ( E $ ) = 1 ( T o k e n s   y o u   k e e p ) + 0.4 ( T o t a l   i n v e s t m e n t   i n   t h e   G r o u p   A c c o u n t )
where the T o k e n s   y o u   k e e p is equal to 20 tokens minus the tokens you invest in the Group Account.
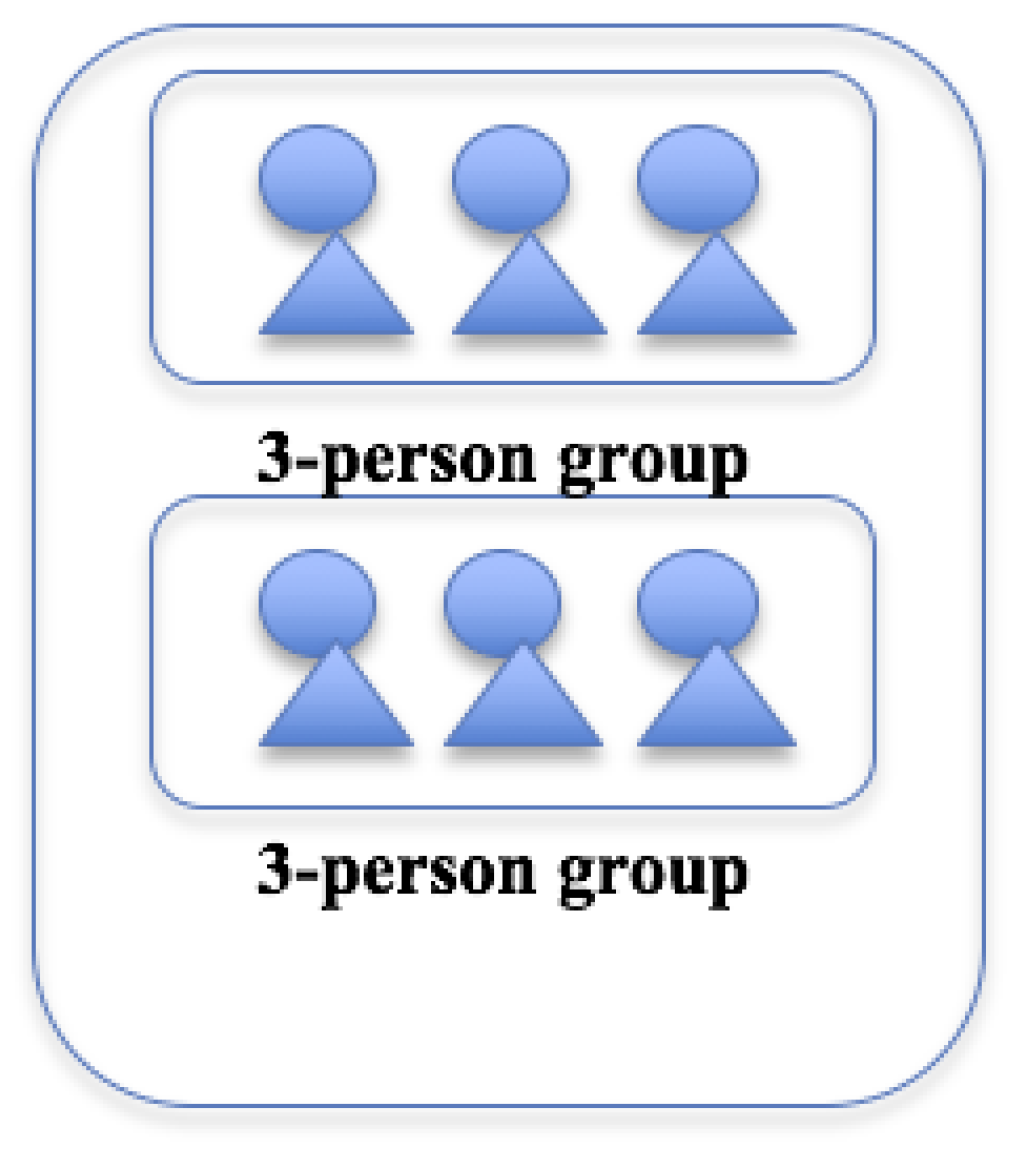
Figure A1. Matching of 3-person groups.
Games 11 00006 g0a1
EXAMPLE 01: Suppose that all the other people in your group invested a total of 10 tokens. If you decide to invest 7 tokens, the total investment in the Group Account will be 10 + 7 = 17 tokens. This will yield you earnings of 19.8 E$ (13 E$ from tokens kept + 0.4*17 E$ from the Group Account).
EXAMPLE 02: Suppose that all the other people in your group invested a total of 24 tokens. If you decide to invest 8 tokens, the total investment in the Group Account will be 24 + 8 = 32 tokens. This will yield you earnings of 24.8 E$ (12 E$ from tokens kept + 0.4*32 E$ from the Group Account).
You will only be making this decision with the other members of your group once. Please make sure you completely understand the instructions.
Are there any questions?
Entering Decisions
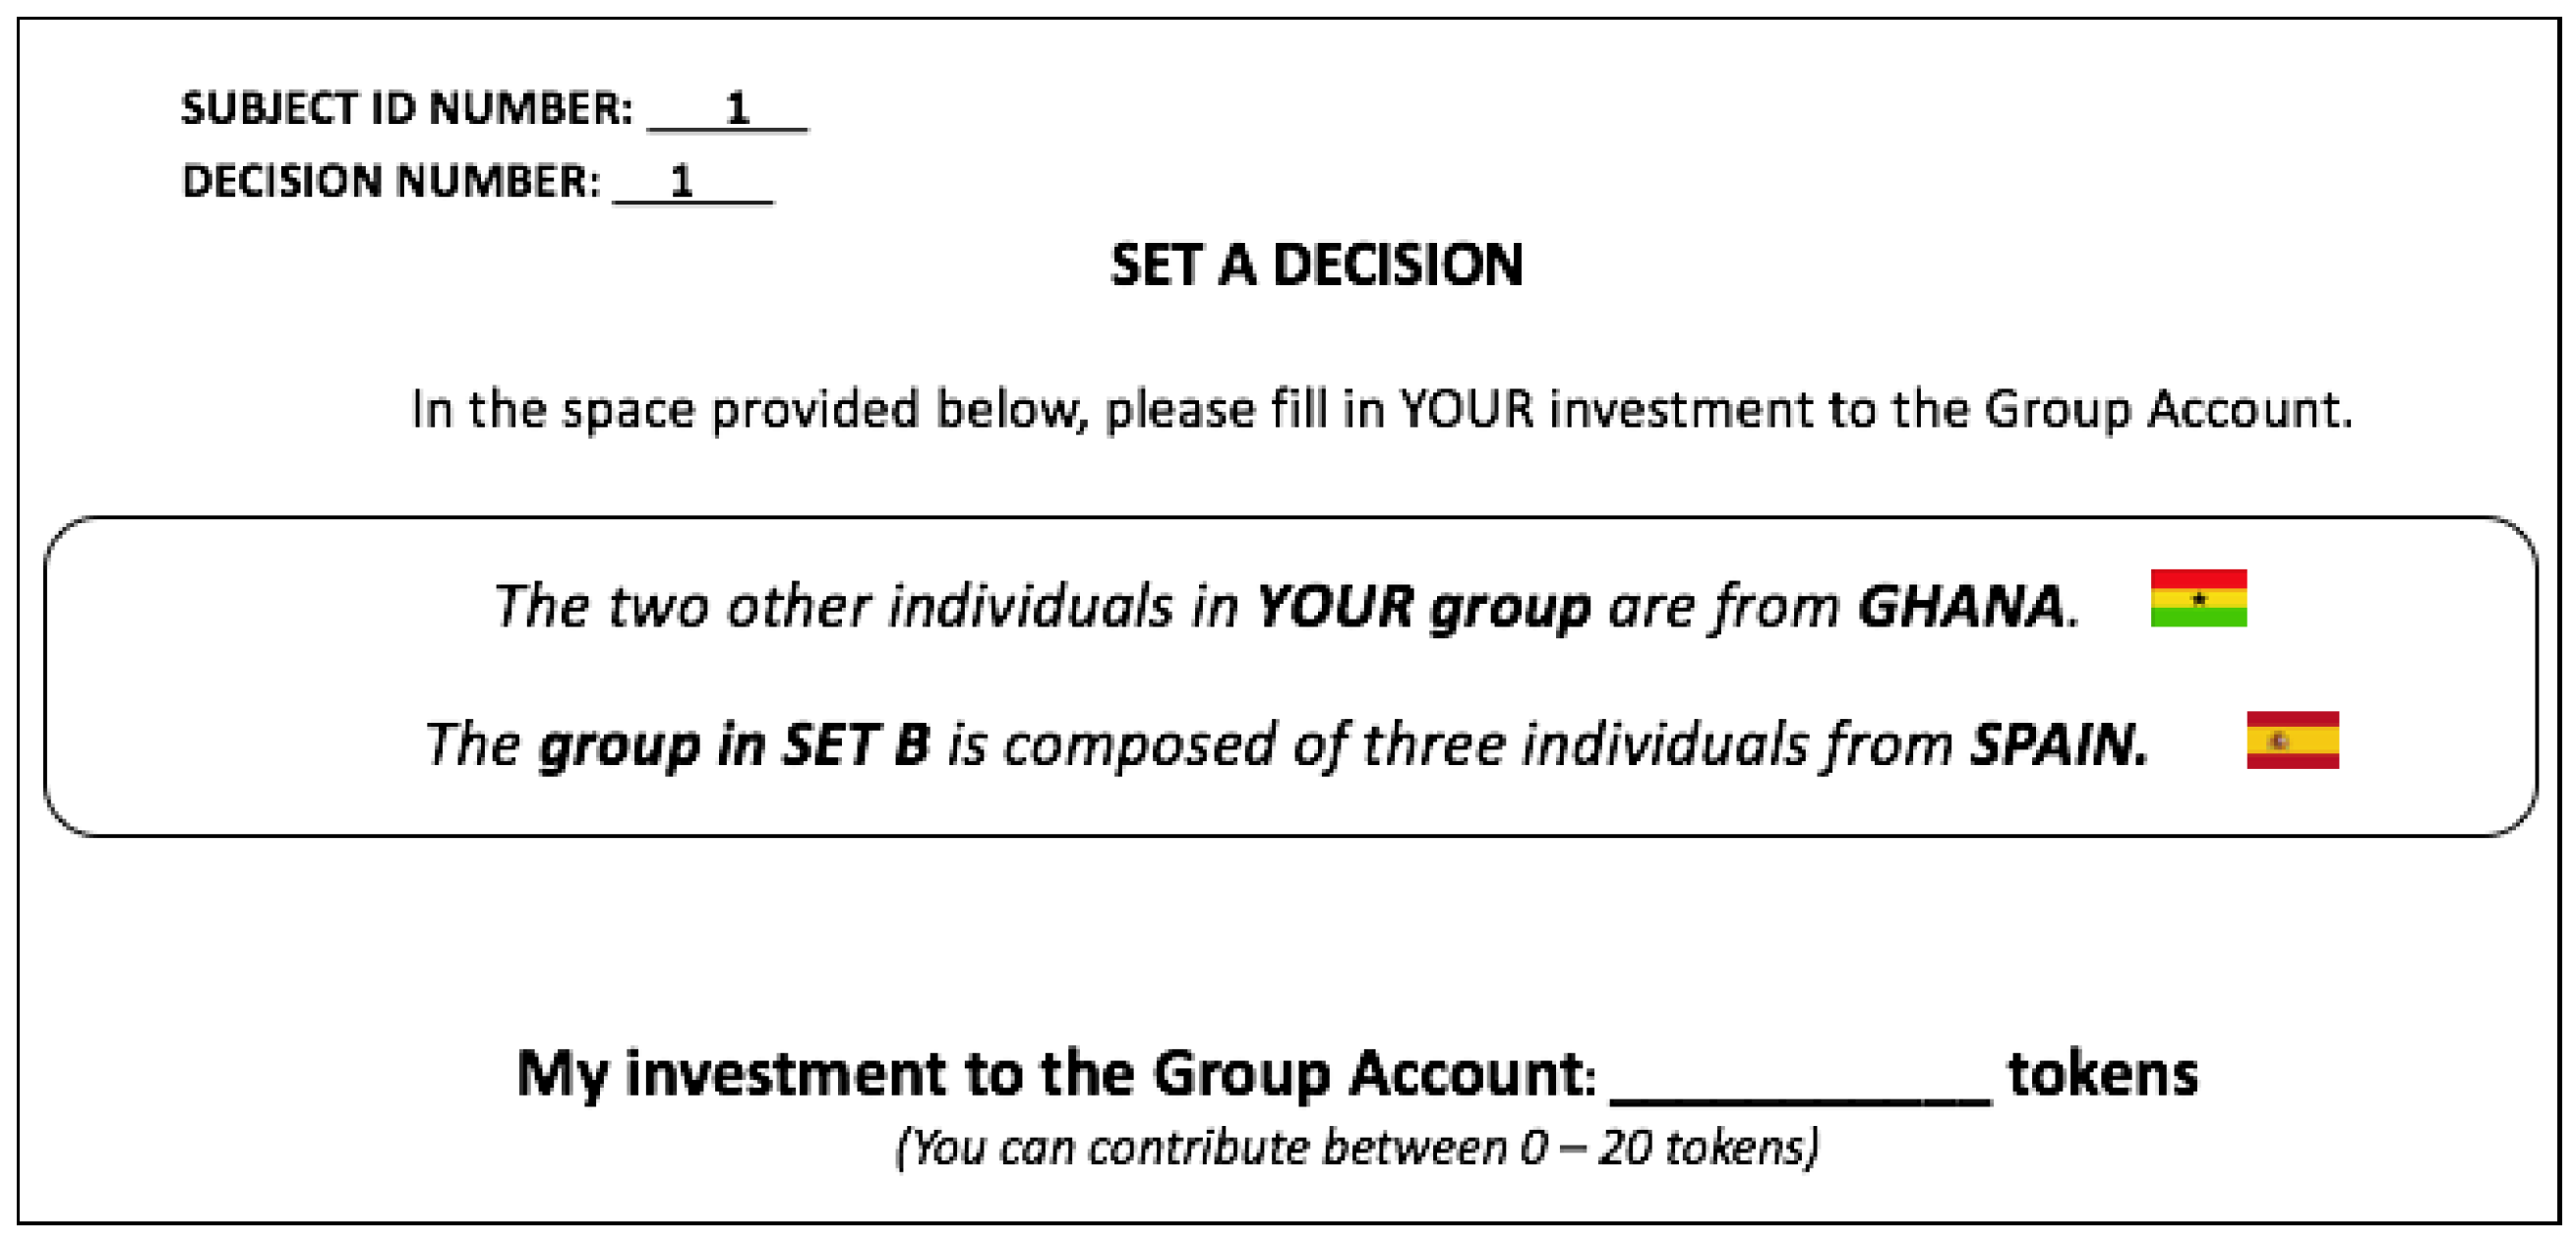
To make your decisions, fill the amount you would like to invest in the Group Account in the decision sheet you have been given. Before you make your decision, you will be told where the other members of your 3-person group are from. You will be provided with 2 decision sheets. Please make a decision regarding how much to invest in the Group Account for each of these decision sheets.
The 2 decision sheets are stapled together. Start by filling in your decisions on the topmost slip. Once you are done, hand your answers to the instructor.
Are there any questions?
Results
We will randomly pick 1 of the 2 decisions you have made to be paid. We will do this by rolling an 8-sided die. If the die returns 1, 2, 3 or 4, we will pay your decision in the first decision sheet; if the die returns 5, 6, 7 or 8, we will pay your decision in the second decision sheet. When you make your decisions, you of course will not know which decision will be made. You will therefore have to think carefully about your investment in the Group Account because every investment decision has an equal chance of being paid.
At the end of this experiment, you will be given your RECORD SHEET. The RECORD SHEET will show, for the decision that has been chosen, which group you belong to, your investment in the Group Account, the sum investments of the other members of your group, and your earnings for this part of the experiment.
Are there any questions?
You may now answer the review questions below. When you are finished, please raise your hand and wait for the instructor to check your answers.
Review
Suppose you kept 6 tokens and your other group members invested 32 tokens in the Group Account. What is:
  • The total group investment in the Group Account?
  • Your earnings from the Group Account?
  • Your total earnings?

Appendix A.2. Experiment Instructions (PG-T1G)
Introduction
Welcome to the experiment. For showing up to today’s session, you will be paid 3 GHS. You will have a chance to receive additional money as the result of the outcome in this experiment. At the end of the experiment, we will pay you in cash an amount equal to 0.4 GHS for every E$ that you earn.
We are currently running similar experiments in Spain and Denmark. This means that right now, participants in these two countries are being read the same instructions as you. At the end of these instructions is a map of the world. The dots on the map indicate the places where the exact same experiment is taking place.
Are there any questions?
Decisions and payoffs
At the beginning of this decision-making experiment you will be randomly matched with two other people, to form a group of three. The two other members of your group could be from Denmark, Spain or Ghana. Before you make your decision, you will be told which country the two other members of your group come from. The names of the other members of your group will not be revealed.
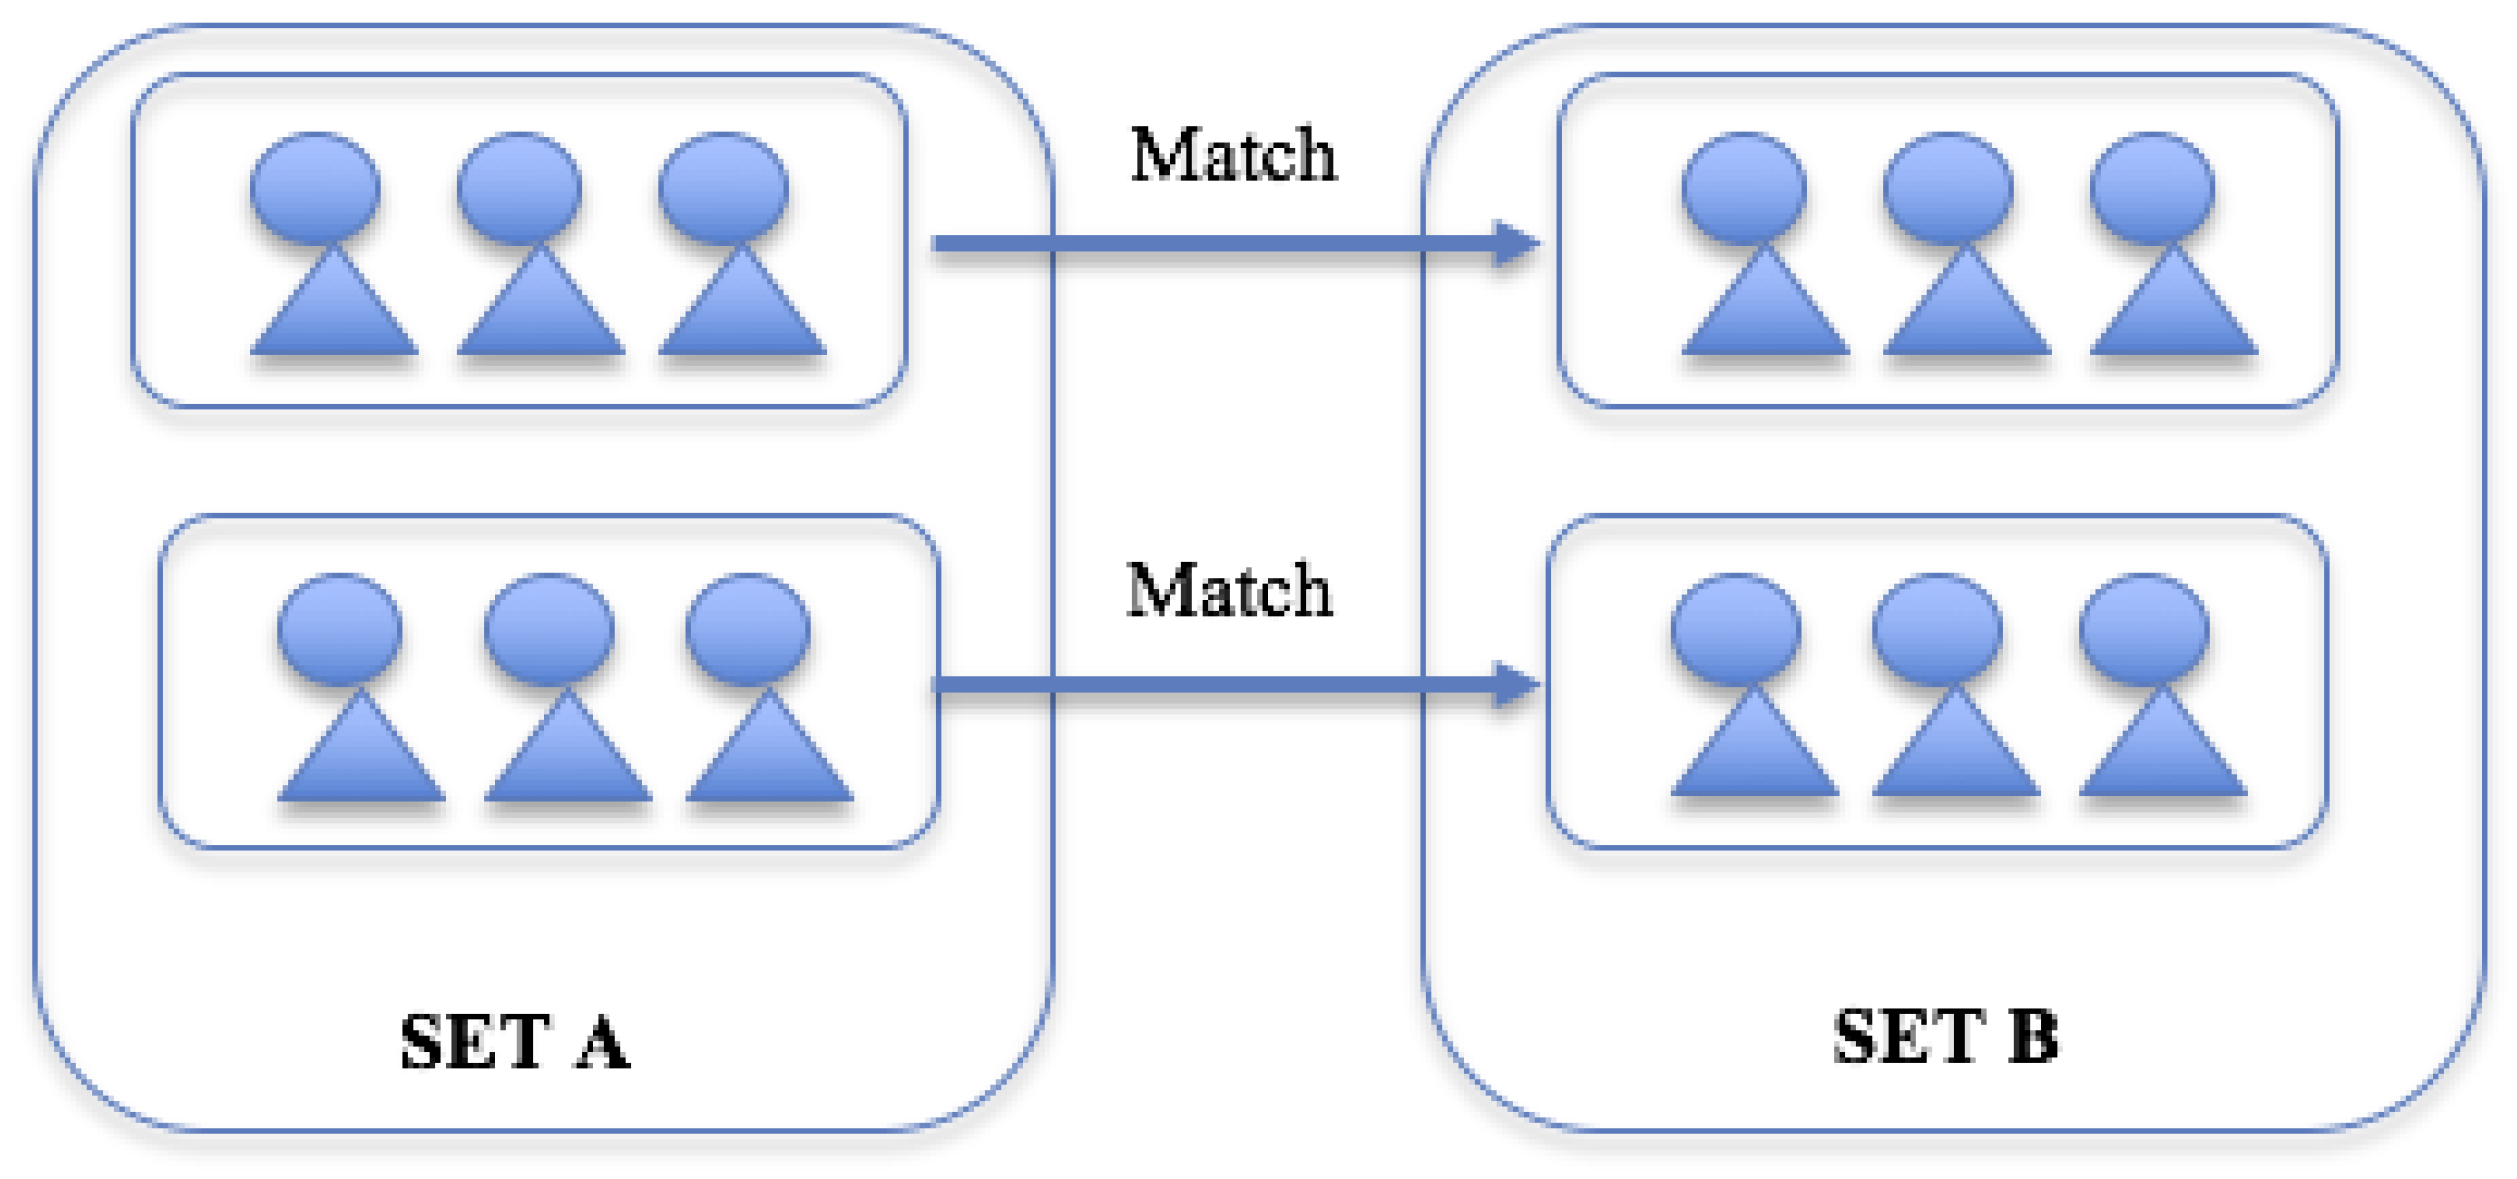
Each 3-person group has been randomly assigned to either be in SET A or SET B. Each group assigned to SET A will be matched with another group assigned to SET B (see figure below). You will not be told whether you and the other members of your group have been assigned to SET A or SET B until the experiment is over.
Figure A2. Matching of 3-person groups.
Games 11 00006 g0a2
Decisions by individuals in groups assigned to SET A will influence the group in SET B that they are matched with. How SET A decisions influence SET B will be discussed below.
Since you are not initially told which SET your group belongs to, you will be making decisions for both SET A and SET B. You will only be paid for the decision you make for the SET that you have been randomly assigned to. As such, you must think carefully about your decisions in both SET A and SET B.
Are there any questions?
Set A
In SET A, you and each other person in your group will receive 20 tokens. You must decide how much of this amount to keep and how much to invest in the Group Account: you can invest any number between 0 and 20. Only integer values will be accepted.
Each token that you keep earns you 1 E$ while each token invested in the Group Account by you and other members of your group will earn you and each other member of your group 0.4 E$. Thus,
E a r n i n g s ( E $ ) = 1 ( T o k e n s   y o u   k e e p ) + 0.4 ( T o t a l   i n v e s t m e n t   i n   t h e   G r o u p   A c c o u n t )
where the Tokens you keep is equal to 20 tokens minus the tokens you invest in the Group Account.
EXAMPLE 01: Suppose that all the other people in your group invested a total of 10 tokens. If you decide to invest 7 tokens, the total investment in the Group Account will be 10 + 7 = 17 tokens. This will yield you earnings of 19.8 E$ (13 E$ from tokens kept + 0.4*17 E$ from the Group Account).
EXAMPLE 02: Suppose that all the other people in your group invested a total of 24 tokens. If you decide to invest 8 tokens, the total investment in the Group Account will be 24 + 8 = 32 tokens. This will yield you earnings of 24.8 E$ (12 E$ from tokens kept + 0.4*32 E$ from the Group Account).
The sum of your and others’ investment in the Group Account will also affect those assigned to SET B. Every token invested in the Group Account will influence the amount multiplied to the “Total investment to the Group Account”. We will explain this further below.
Are there any questions?
Set B
In SET B, you and each other person in your group will receive 20 tokens. You must decide how much of this amount to keep and how much to invest in the Group Account: you can invest any number between 0 and 20. Only integer values will be accepted.
Each token that you keep earns you 1 E$ while each token invested in the Group Account by you and other members of your group will earn you and each other member of your group E$. Thus,
E a r n i n g s ( E $ ) = 1 ( T o k e n s   y o u   k e e p ) + x ( T o t a l   i n v e s t m e n t   i n   t h e   G r o u p   A c c o u n t )
where the Tokens you keep is equal to 20 tokens minus the tokens you invest in the Group Account.
The lowest value x can take is 0.4 and the highest is 0.8. The lowest value happens when everyone in the matched 3-person group in SET A invests nothing in the Group Account while the highest value happens when everyone in the matched 3-person group in SET A invests everything in the Group Account. Hence, the value of increases as investments in the Group Account in the matched 3-person group in SET A increases.
You will only be making this decision with the other members of your group once. Please make sure you completely understand the instructions.
Are there any questions?
Entering Decisions
Everyone will be making SET A decisions. To make your decisions, fill the amount you would like to invest in the Group Account in the decision sheet you have been given. Before you make your decision, you will be told where the other members of your 3-person group are from. You will also be told where the individuals in the 3-person group in SET B are from. You will be provided with 8 decision sheets. Each decision sheet matches you and your 3-person group to different individuals. Please make a decision regarding how much to invest in the Group Account for each of these decision sheets.
Once all SET A decisions have been made and submitted, everyone will be making SET B decisions. Just like the SET A decisions, you will be told where the other members of your 3-person group are from and where the individuals in the 3-person group in SET A were from. You will also be told what x is. Again, you will be provided with 8 decision sheets. Each decision sheet matches you to different individuals. Please make a decision regarding how much to invest in the Group Account for each of these decision sheets.
The 8 decision sheets are stapled together. Start by filling in your decisions on the topmost slip. Once you are done, hand your answers to the instructor.
Are there any questions?
Results
Once you have made all your decisions, it will be revealed whether your group is in SET A or SET B. Please note that although you made decisions for both SET A or SET B, you can only either be in SET A or SET B. If you have been assigned to SET A, your decisions in SET B will not count. If you have been assigned to SET B, your decisions in SET A will not count.
We will also randomly pick 1 of the 8 decisions you have made to be paid. We will do this by throwing an 8-sided die. If the die returns 1, we will pay your decision in the first decision sheet; if the die returns 2, we will pay your decision in the second decision sheet; and so on. When you make your decisions, you of course will not know which decision will be made. You will therefore have to think carefully about your investments to the Group Account because every investment decision has an equal chance of being paid.
At the end of this experiment, you will be given your RECORD SHEET. The RECORD SHEET will show, for the decision that has been chosen, which set you belong to, your investment in the Group Account, the sum investment of the other members of your group, and your earnings for this part of the experiment.
Are there any questions?
You may now answer the review questions below. When you are finished, please raise your hand and wait for the instructor to check your answers.
Review
  • Which set are you assigned to?
  • Suppose you kept 6 tokens and your other group members invested 32 tokens in the Group Account. What is:
    (a)
    The total group investment in the Group Account?
    (b)
    Your earnings from the Group Account?
    (c)
    Your total earnings?
  • If a group in SET A invested all their tokens to the Group Account, what is for the matched group in SET B?

Appendix A.3. Experiment Instructions (PG-T2G)
Introduction
Welcome to the experiment. For showing up to today’s session, you will be paid 3 GHS. You will have a chance to receive additional money as the result of the outcome in this experiment. At the end of the experiment, we will pay you in cash an amount equal to 0.4 GHS for every E$ that you earn.
We are currently running similar experiments in Spain and Denmark. This means that right now, participants in these two countries are being read the same instructions as you. At the end of these instructions is a map of the world. The dots on the map indicate the places where the exact same experiment is taking place.
Are there any questions?
Decisions and payoffs
At the beginning of this decision-making experiment you will be randomly matched with two other people, to form a group of three. The two other members of your group could be from Denmark, Spain or Ghana. Before you make your decision, you will be told which country the two other members of your group come from. The names of the other members of your group will not be revealed.
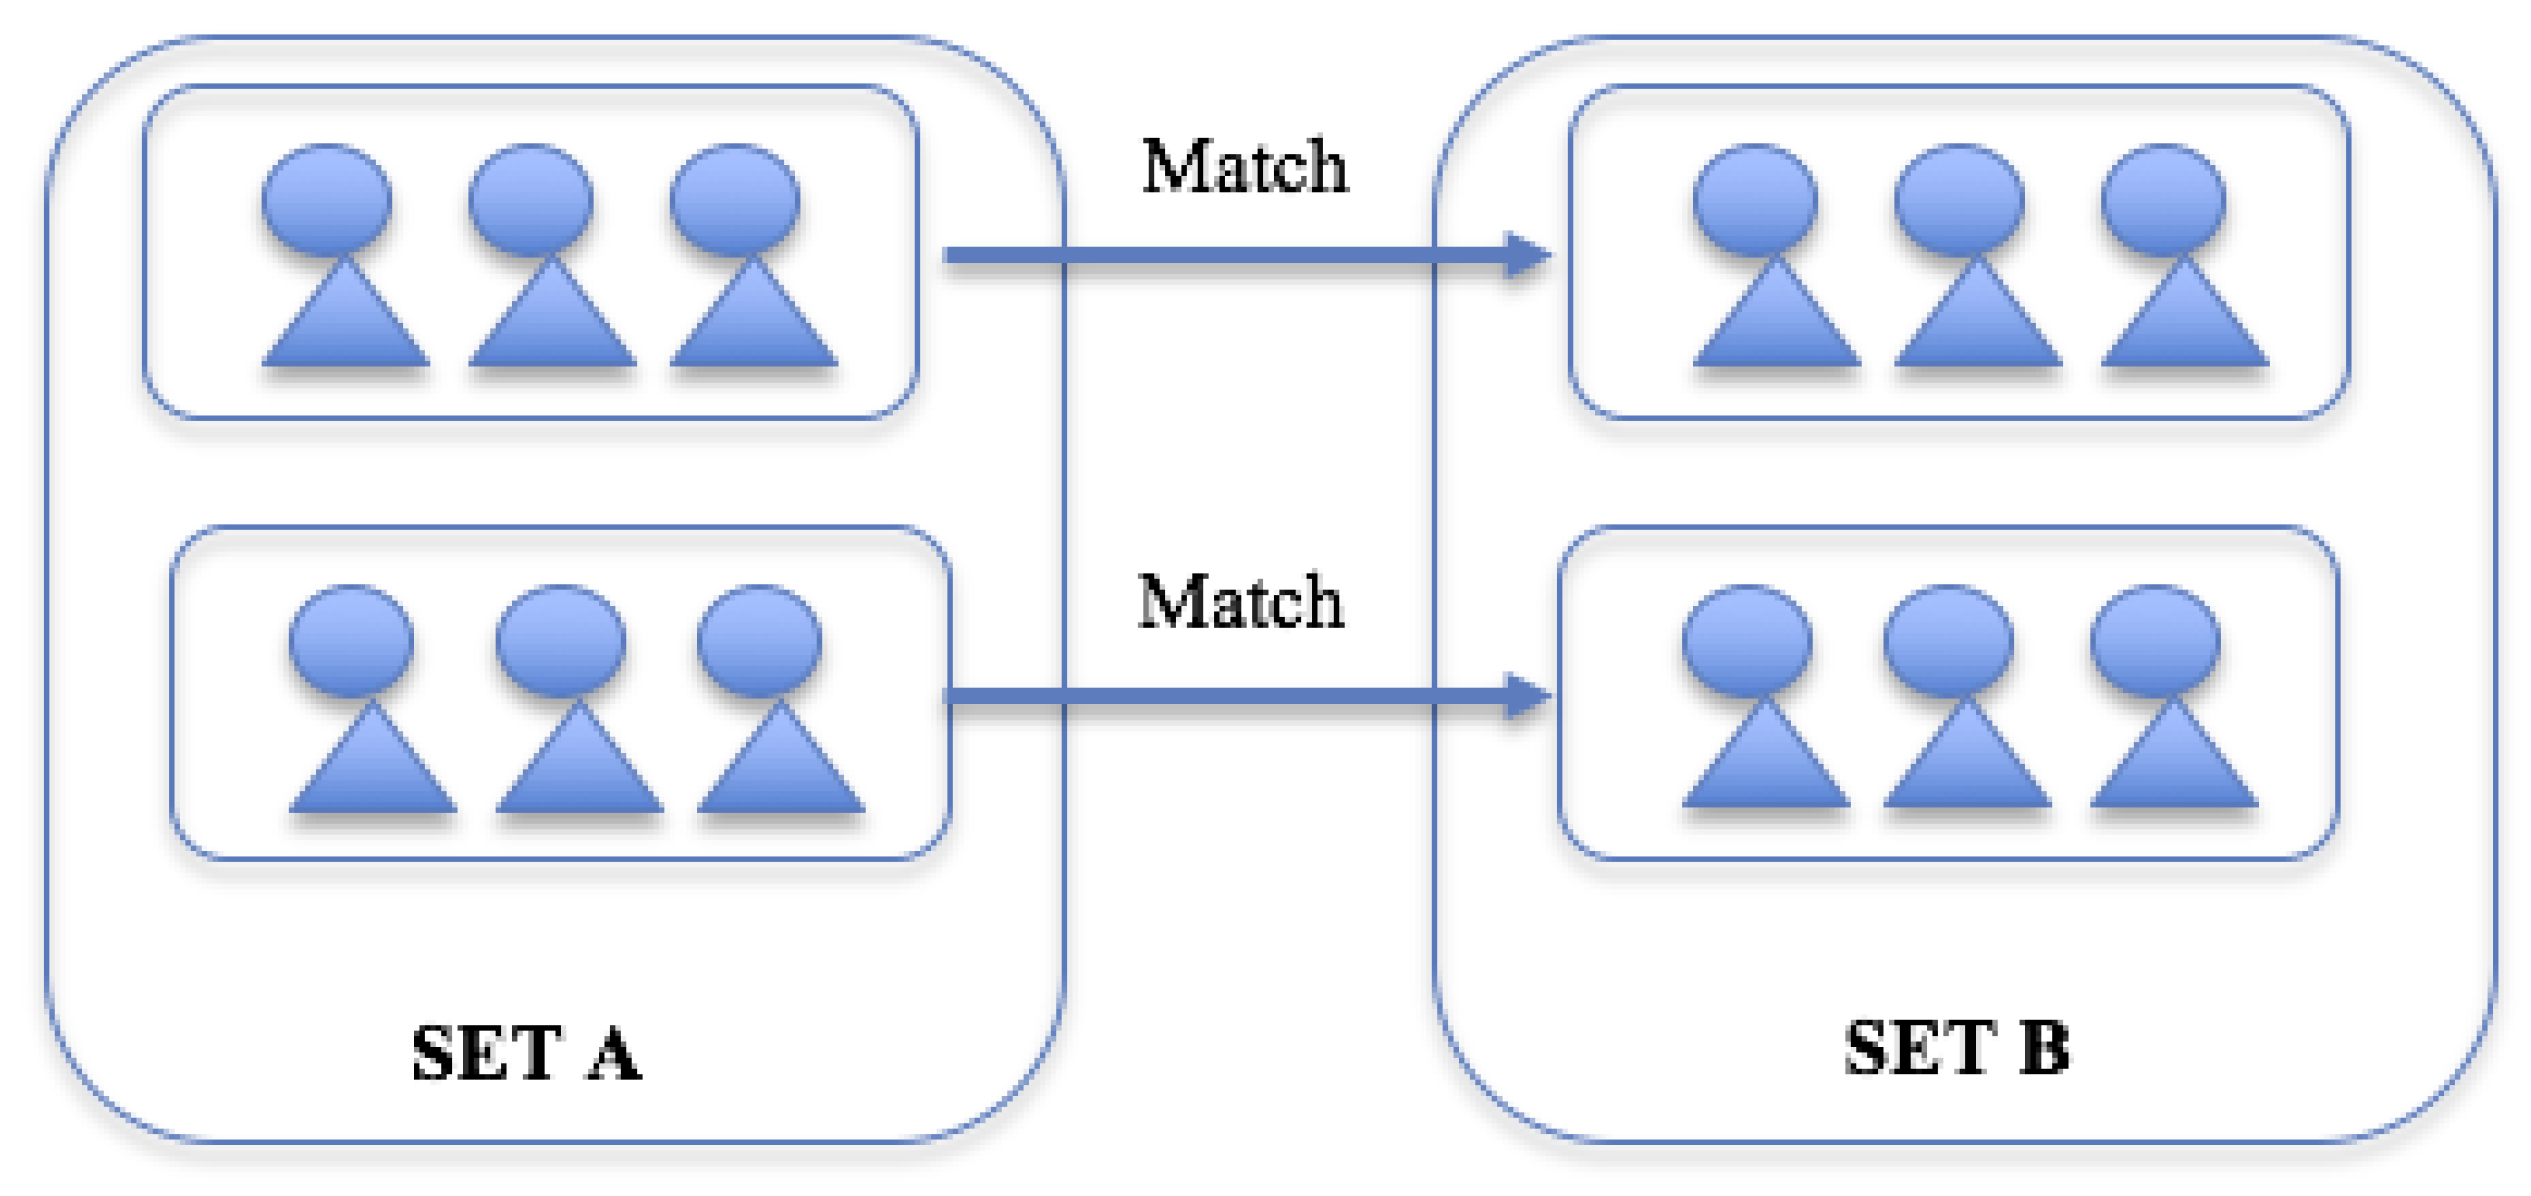
Each 3-person group has been randomly assigned to either be in SET A or SET B. Each group assigned to SET A will be matched with another group assigned to SET B (see figure below). You will not be told whether you and the other members of your group have been assigned to SET A or SET B until the experiment is over.
Figure A3. Matching of 3-person groups.
Games 11 00006 g0a3
Decisions by individuals in groups assigned to SET A will influence the group in SET B that they are matched with. How SET A decisions influence SET B will be discussed below.
Since you are not initially told which SET your group belongs to, you will be making decisions for both SET A and SET B. You will only be paid for the decision you make for the SET that you have been randomly assigned to. As such, you must think carefully about your decisions in both SET A and SET B.
Are there any questions?
Set A
In SET A, you and each other person in your group will receive 20 tokens. You must decide how much of this amount to keep and how much to invest in the Group Account: you can invest any number between 0 and 20. Only integer values will be accepted.
Each token that you keep earns you 1 E$ while each token invested in the Group Account by you and other members of your group will earn you and each other member of your group 0.4 E$. Thus,
E a r n i n g s ( E $ ) = 1 ( T o k e n s   y o u   k e e p ) + 0.4 ( T o t a l   i n v e s t m e n t   i n   t h e   G r o u p   A c c o u n t )
where the Tokens you keep is equal to 20 tokens minus the tokens you invest in the Group Account.
EXAMPLE 01: Suppose that all the other people in your group invested a total of 10 tokens. If you decide to invest 7 tokens, the total investment in the Group Account will be 10 + 7 = 17 tokens. This will yield you earnings of 19.8 E$ (13 E$ from tokens kept + 0.4*17 E$ from the Group Account).
EXAMPLE 02: Suppose that all the other people in your group invested a total of 24 tokens. If you decide to invest 8 tokens, the total investment in the Group Account will be 24 + 8 = 32 tokens. This will yield you earnings of 24.8 E$ (12 E$ from tokens kept + 0.4*32 E$ from the Group Account).
The sum of your and others’ investment in the Group Account will also affect those assigned to SET B. Every token invested in the Group Account will influence the number of tokens available for SET B group members. We will explain this further below.
Are there any questions?
Set B
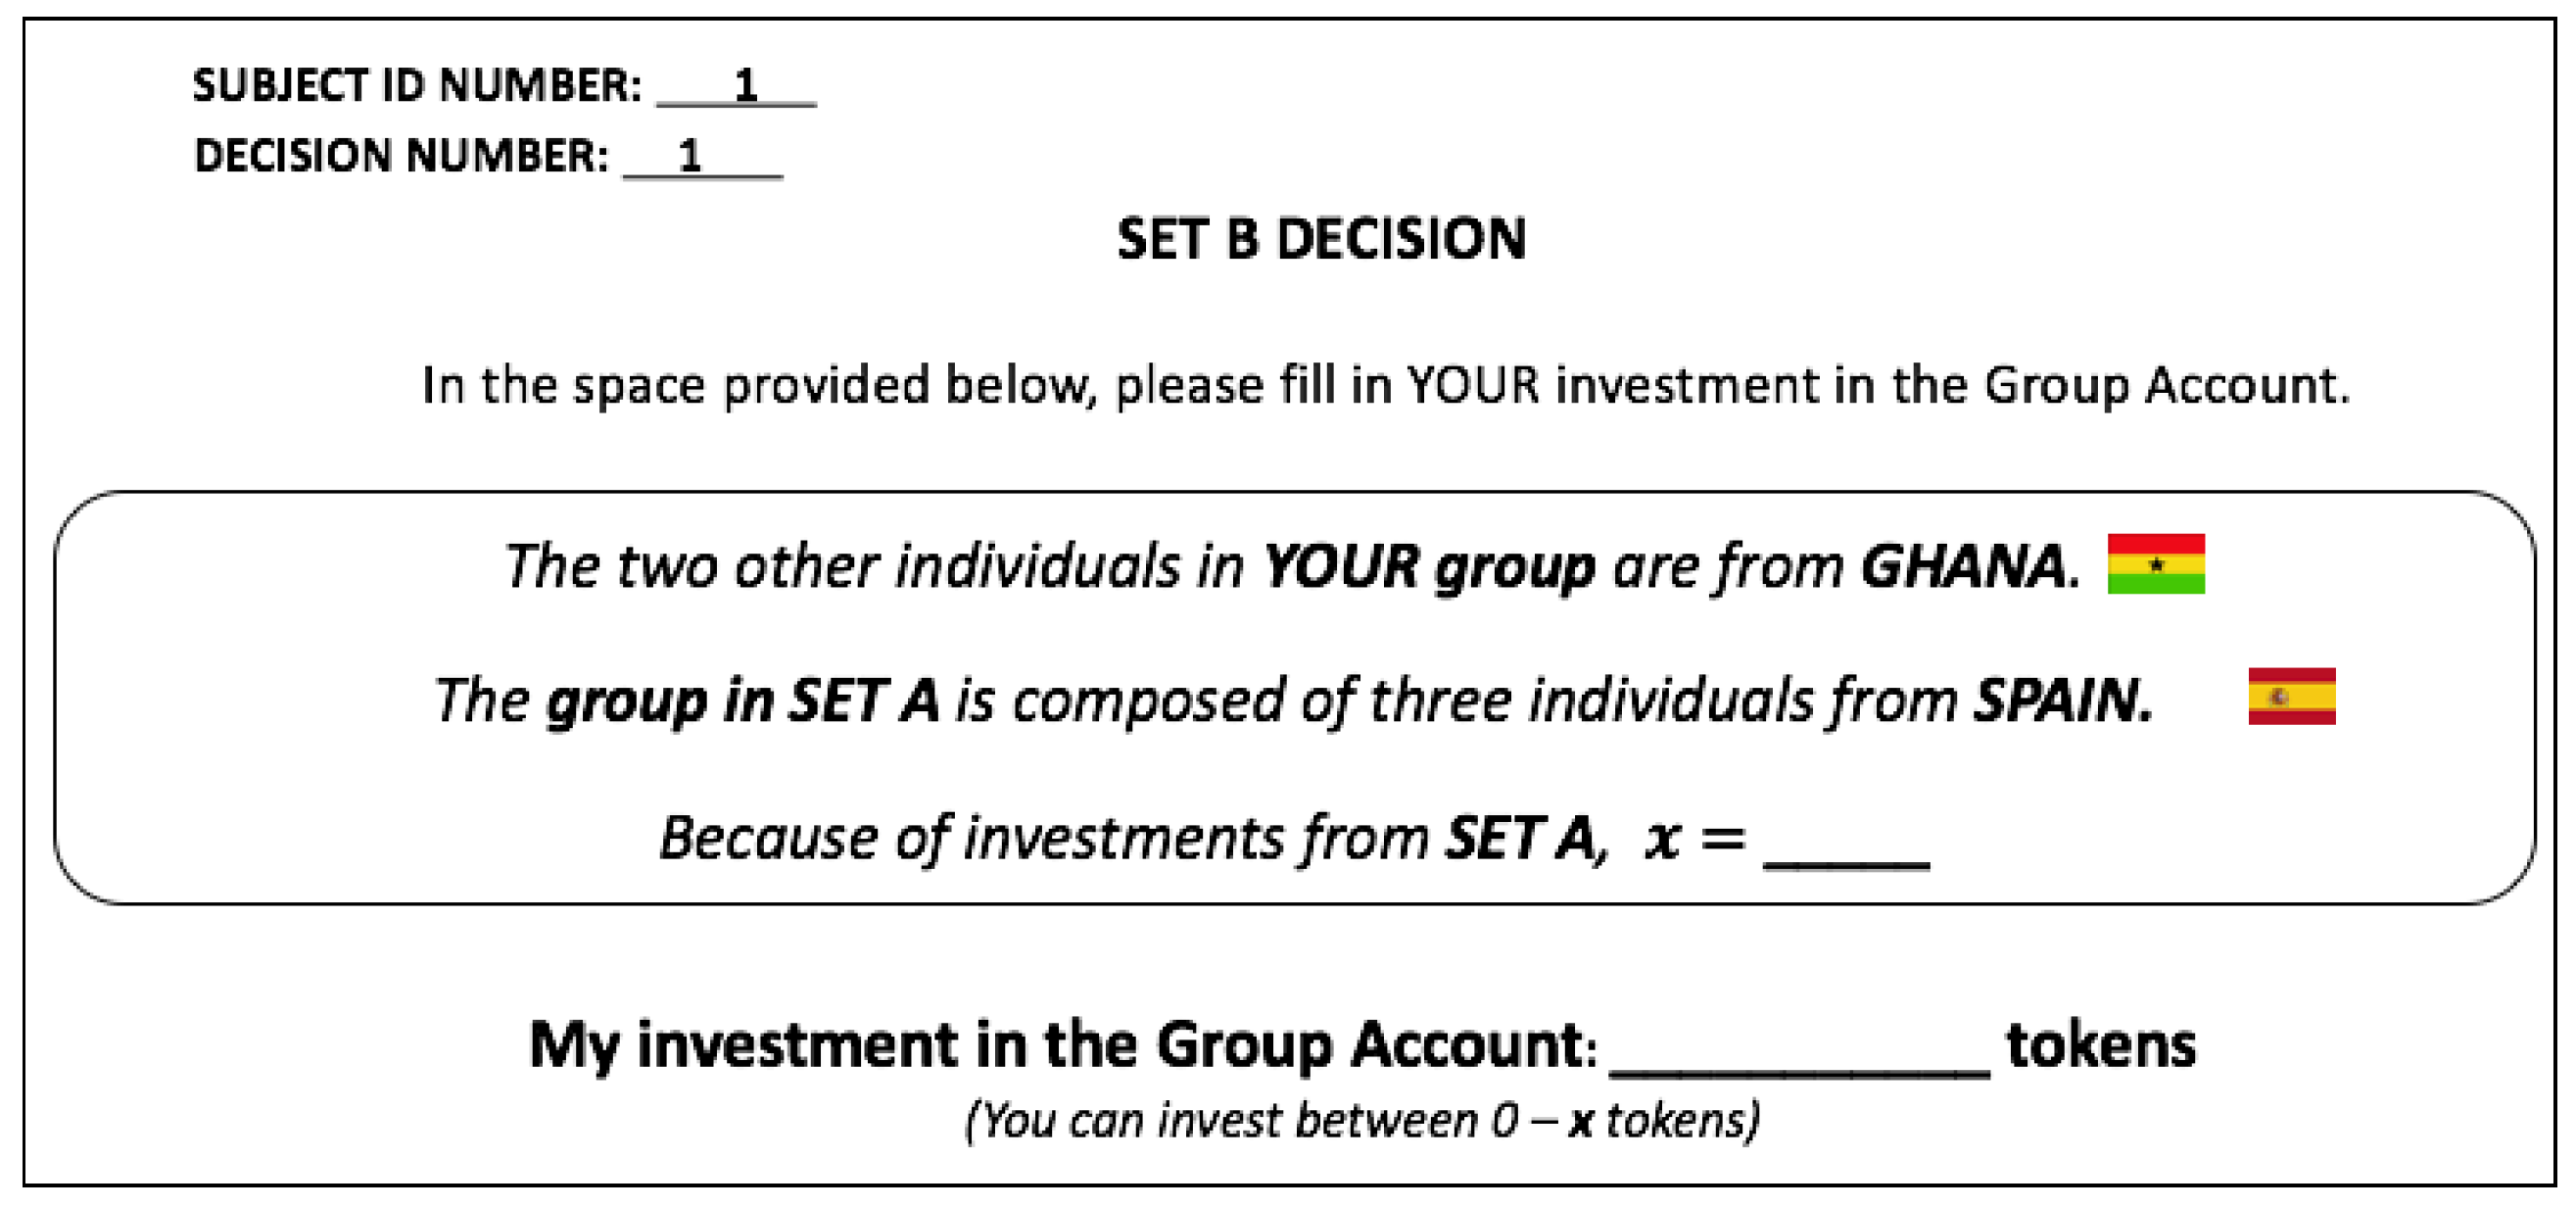
In SET B, you and each other person in your group will receive tokens. You must decide how much of this amount to keep and how much to invest in the Group Account: you can invest any number between 0 and x. Only integer values will be accepted.
Each token that you keep earns you 1 E$ while each token invested in the Group Account by you and other members of your group will earn you and each other member of your group 0.4 E$. Thus,
E a r n i n g s ( E $ ) = 1 ( x ( T o k e n s   y o u   k e e p ) ) + 0.4 ( T o t a l   i n v e s t m e n t   i n   t h e   G r o u p   A c c o u n t )
where the Tokens you keep is equal to x tokens minus the tokens you invest in the Group Account.
The lowest value can take is 20 and the highest is 40. The lowest value happens when everyone in the matched 3-person group in SET A invests nothing in the Group Account while the highest value happens when everyone in the matched 3-person group in SET A invests everything in the Group Account. Hence, the value of increases as investments in the Group Account in the matched 3-person group in SET A increases.
You will only be making this decision with the other members of your group once. Please make sure you completely understand the instructions.
Are there any questions?
Entering Decisions
Everyone will be making SET A decisions. To make your decisions, fill the amount you would like to invest in the Group Account in the decision sheet you have been given. Before you make your decision, you will be told where the other members of your 3-person group are from. You will also be told where the individuals in the 3-person group in SET B are from. You will be provided with 8 decision sheets. Each decision sheet matches you and your 3-person group to different individuals. Please make a decision regarding how much to invest in the Group Account for each of these decision sheets.
Once all SET A decisions have been made and submitted, everyone will be making SET B decisions. Just like that SET A decisions, you will be told where the other members of your 3-person group are from and where the individuals in the 3-person group in SET A were from. You will also be told what is. Again, you will be provided with 8 decision sheets. Each decision sheet matches you to different individuals. Please make a decision regarding how much to invest in the Group Account for each of these decision sheets.
The 8 decision sheets are stapled together. Start by filling in your decisions on the topmost slip. Once you are done, hand your answers to the instructor.
Are there any questions?
Results
Once you have made all your decisions, it will be revealed whether your group is in SET A or SET B. Please note that although you made decisions for both SET A or SET B, you can only either be in SET A or SET B. If you have been assigned to SET A, your decisions in SET B will not count. If you have been assigned to SET B, your decisions in SET A will not count.
We will also randomly pick 1 of the 8 decisions you have made to be paid. We will do this by throwing an 8-sided die. If the die returns 1, we will pay your decision in the first decision sheet; if the die returns 2, we will pay your decision in the second decision sheet; and so on. When you make your decisions, you of course will not know which decision will be made. You will therefore have to think carefully about your investments to the Group Account because every investment decision has an equal chance of being paid.
At the end of this experiment, you will be given your RECORD SHEET. The RECORD SHEET will show, for the decision that has been chosen, which set you belong to, your investment in the Group Account, the sum investment of the other members of your group, and your earnings for this part of the experiment.
Are there any questions?
You may now answer the review questions below. When you are finished, please raise your hand and wait for the instructor to check your answers.
Figure A4. Map of the World.
Games 11 00006 g0a4
Review
  • Which set are you assigned to?
  • Suppose you kept 6 tokens and your other group members invested 32 tokens in the Group Account. What is:
    (a)
    The total group investment in the Group Account?
    (b)
    Your earnings from the Group Account?
    (c)
    Your total earnings?
  • If a group in SET A invested all their tokens to the Group Account, what is for the matched group in SET B?

Appendix B. Decision Sheets

Below are sample decisions sheets for our three treatments: Appendix B.1 for the Baseline Treatment, Appendix B.2 for groups in the present generation of both the Institutions Treatment and Endowments Treatment, Appendix B.3 for groups in the future generation of the Institutions Treatment, and Appendix B.4 for groups in the future generation of the Endowments Treatment. All decisions sheets are for the participant assigned to Subject ID 1 in Ghana. Decision sheets for other countries and other Subject ID numbers are available upon request.

Appendix B.1. Baseline Treatments

Figure A5. Baseline Cover Page.
Games 11 00006 g0a5
Figure A6. Baseline Treatment First Decision.
Games 11 00006 g0a6

Appendix B.2. Set A: Institutions and Endowments Treatments

Figure A7. Set A Cover Page.
Games 11 00006 g0a7
Figure A8. Set A First Decision.
Games 11 00006 g0a8

Appendix B.3. Set B: Institutions Treatment
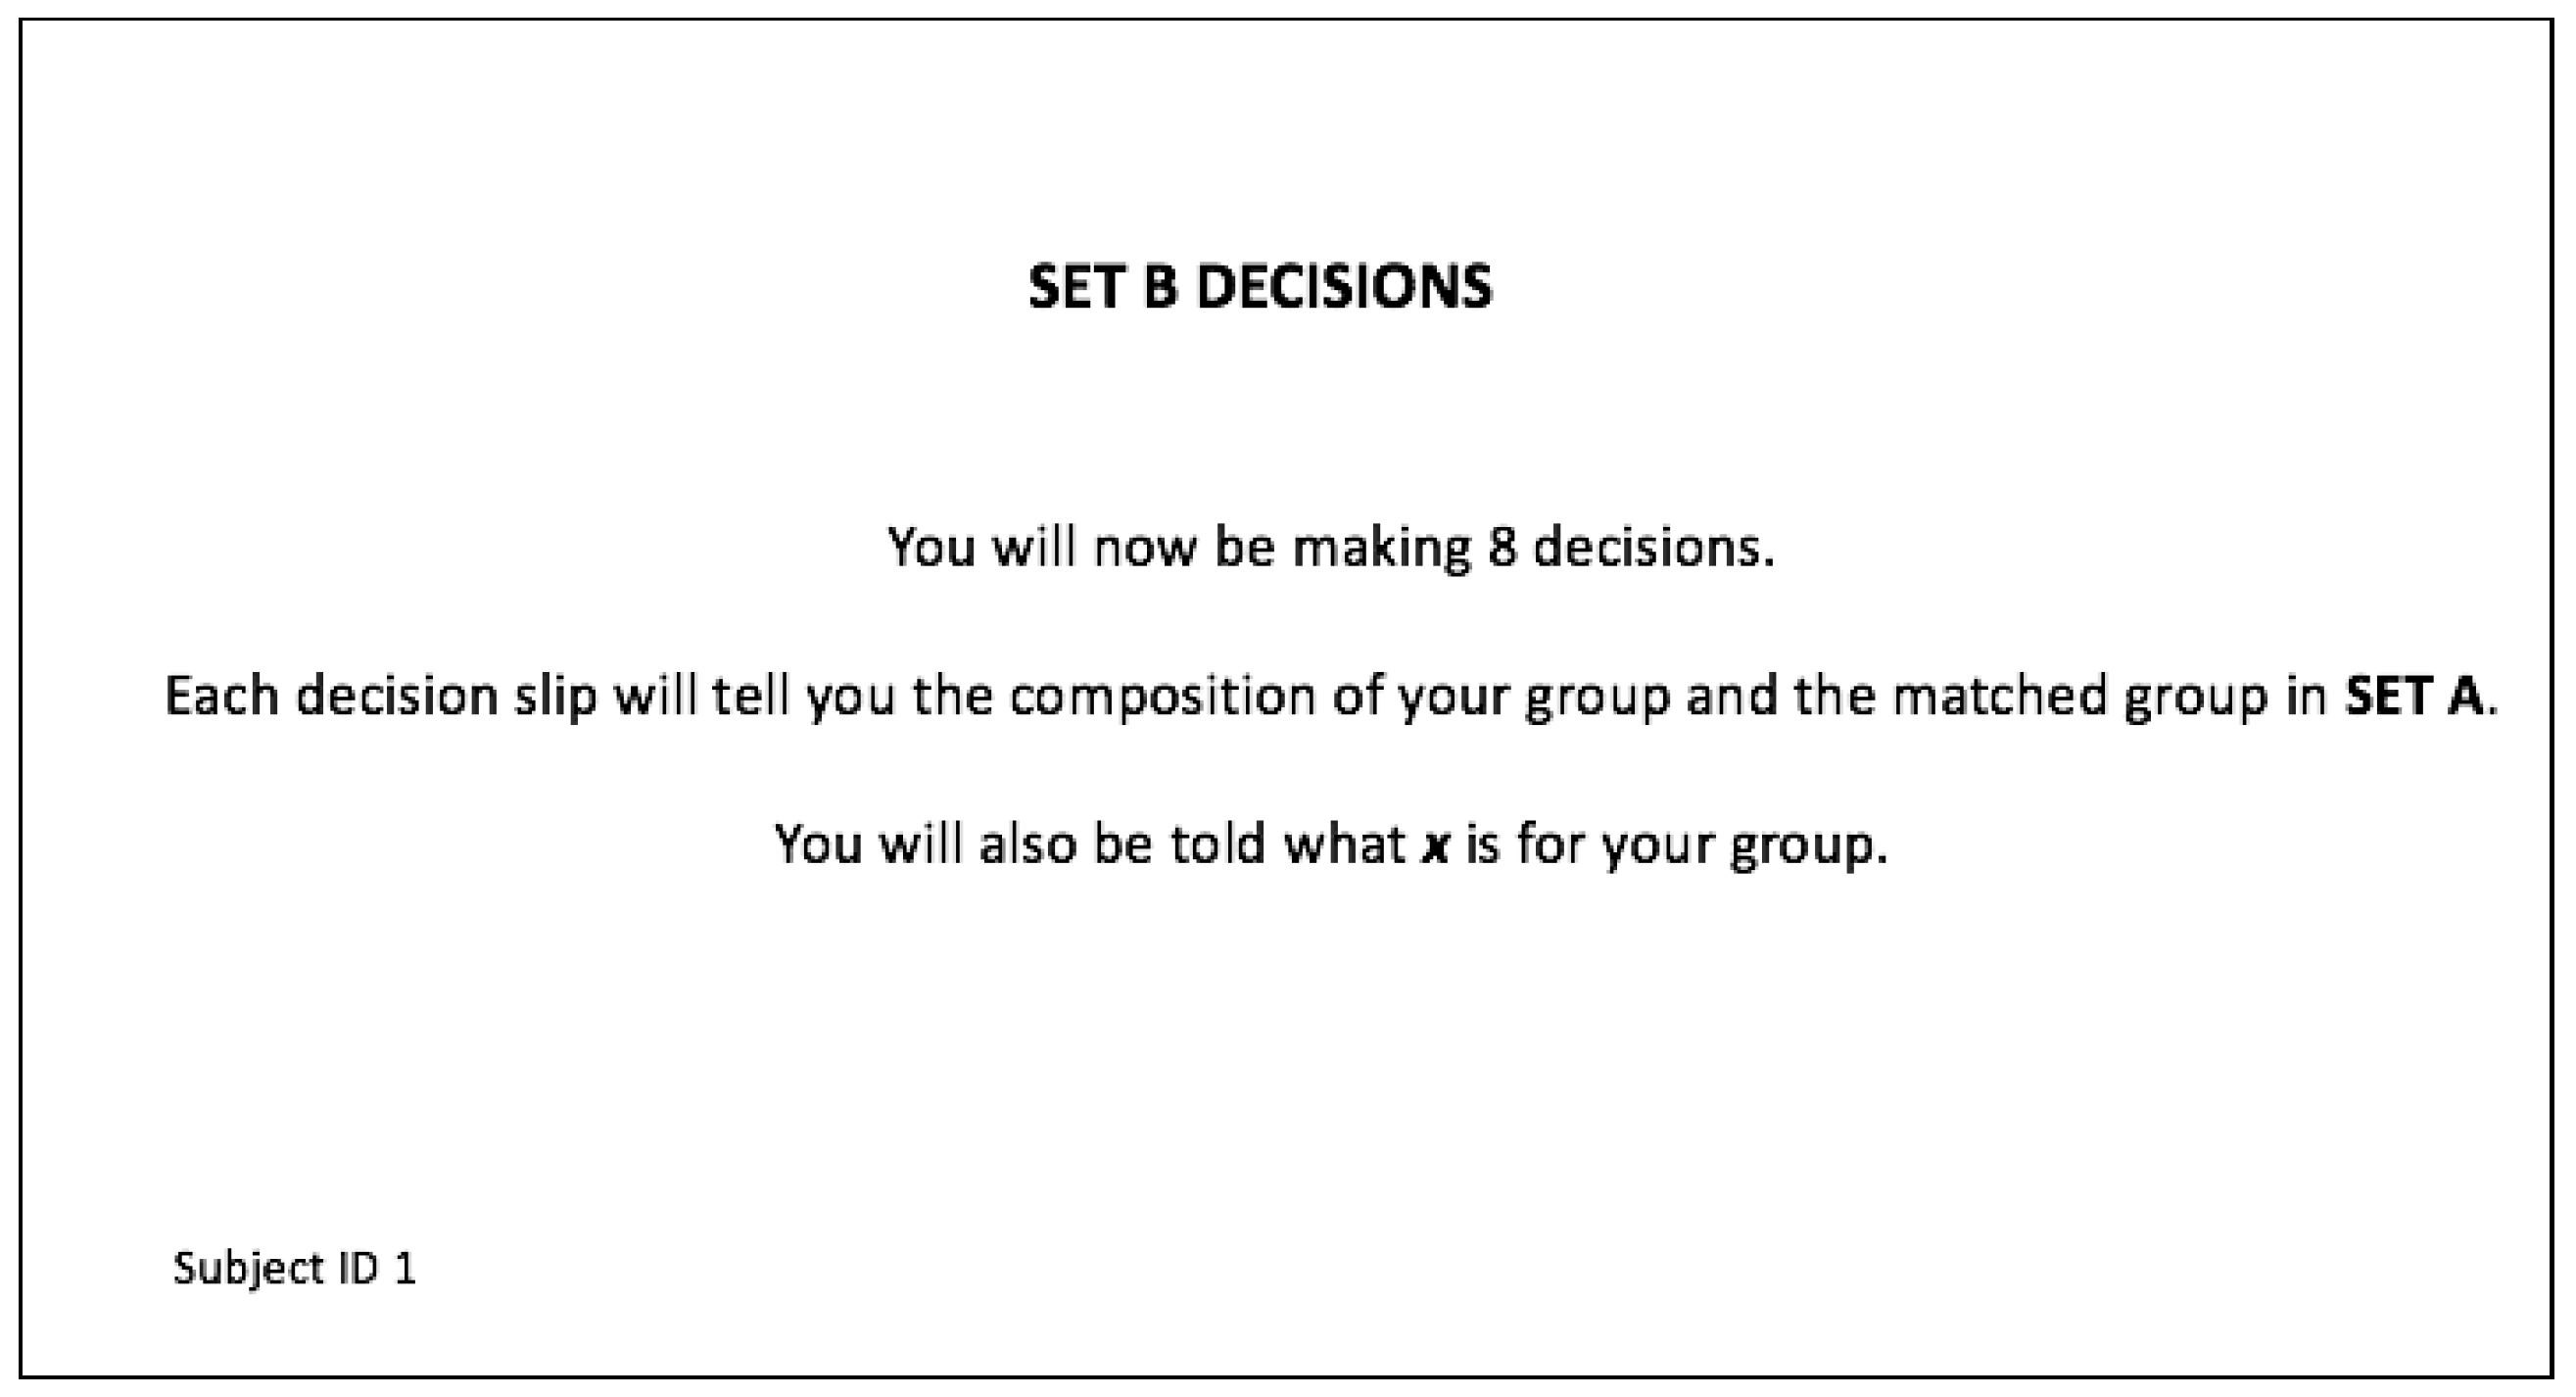
Figure A9. Institution Treatment Set B Cover Page.
Games 11 00006 g0a9
Figure A10. Institution Treatment Set B First Decision.
Games 11 00006 g0a10

Appendix B.4. Set B: Endowments Treatment

Figure A11. Endowments Treatment Cover Page.
Games 11 00006 g0a11
Figure A12. Endowments Treatment First Decision.
Games 11 00006 g0a12

Appendix C. Survey Questionnaire

Thank you for participating in our decision-making experiment. We are now preparing your earnings from our experiment. While we do that, we would like you to answer a questionnaire. Your answers in the questionnaire will not affect your payoffs in any way.
Please fill in the blanks or shade your answer. Please note that all answers are anonymous as we only relate them to your Subject ID.
  • Subject ID Number:
  • Age:
  • Gender:
    Female
    Male
  • Are you a student?
    Yes
    No
  • Field of Study:
  • Highest Educational Attainment:
  • Marital Status
    Single
    Co-habiting
    Married
    Widowed
  • Number of Children:
  • Do you believe that individuals in Denmark and Spain had the same experiment you had?
    Yes
    No
Are you generally a person who is fully prepared to take risks or do you try to avoid taking risks? Please tick a box on the scale below.
Not at all willing to take risks Very willing to take risks
0 10
Thinking about people from Denmark, how much do you agree with the following statements:
Strongly agreeKind of agreeKind of disagreeStrongly disagreeI don’t know
I like the Danes
I think Danes can be trusted
I think Danes are not very cooperative
I think Danes care for nature
I think Danes will not protect the habitats of migratory birds
I think Danes are quite wealthy
I think Danes do not care what happens to my country and my people
Thinking about people from Spain, how much do you agree with the following statements:
Strongly agreeKind of agreeKind of disagreeStrongly disagreeI don’t know
I like the Spaniards
I think Spaniards can be trusted
I think Spaniards are not very cooperative
I think Spaniards care for nature
I think Spaniards will not protect the habitats of migratory birds
I think Spaniards are quite wealthy
I think Spaniards do not care what happens to my country and my people
Thinking about people from Ghana, how much do you agree with the following statements:
Strongly agreeKind of agreeKind of disagreeStrongly disagreeI don’t know
I like the Ghanaians
I think Ghanaians can be trusted
I think Ghanaians are not very cooperative
I think Ghanaians care for nature
I think Ghanaians will not protect the habitats of migratory birds
I think Ghanaians are quite wealthy
I think Ghanaians do not care what happens to my country and my people

References

  1. The New York Times. World’s Richest Little Isle. 1982. Available online: https://www.nytimes.com/1982/03/07/magazine/world-s-richest-little-isle.html (accessed on 30 December 2019).
  2. Chaudhuri, A.; Graziano, S.; Maitra, P. Social learning and norms in a public goods experiment with inter-generational advice. Rev. Econ. Stud. 2006, 73, 357–380. [Google Scholar] [CrossRef]
  3. Duffy, J.; Lafky, J. Birth, death and public good provision. Exp. Econ. 2014, 19, 317–341. [Google Scholar] [CrossRef] [Green Version]
  4. Engel, C.; Rockenbach, B. We are not alone: The impact of externalities on public good provision. MPI Collect. Goods Prepr. 2011. [Google Scholar] [CrossRef] [Green Version]
  5. Schotter, A.; Sopher, B. Social learning and coordination conventions in intergenerational games: An experimental study. J. Polit. Econ. 2003, 111, 498–529. [Google Scholar] [CrossRef] [Green Version]
  6. Sherstyuk, K.; Tarui, N.; Ravago, M.-L.V.; Saijo, T. Intergenerational games with dynamic externalities and climate change experiments. J. Assoc. Environ. Resour. Econ. 2016, 3, 247–281. [Google Scholar] [CrossRef] [Green Version]
  7. Van der Heijden, E.C.; Nelissen, J.H.; Potters, J.J.; Verbon, H.A. Transfers and the effect of monitoring in an overlapping-generations experiment. Eur. Econ. Rev. 1998, 42, 1363–1391. [Google Scholar] [CrossRef] [Green Version]
  8. Offerman, T.; Potters, J.; Verbon, H.A. Cooperation in an overlapping generations experiment. Games Econ. Behav. 2001, 36, 264–275. [Google Scholar] [CrossRef] [Green Version]
  9. Anderson, L.R.; Mellor, J.M.; Milyo, J. Inequality and public good provision: An experimental analysis. J. Soc.-Econ. 2008, 37, 1010–1028. [Google Scholar] [CrossRef] [Green Version]
  10. Isaac, R.; Walker, J. Communication and free-riding behavior: The voluntary contribution mechanism. Econ. Inq. 1988, 26, 585–608. [Google Scholar] [CrossRef]
  11. Kachelmeier, S.J.; Shehata, M. Internal auditing and voluntary cooperation in firms: A cross-cultural experiment. Acc. Rev. 1997, 72, 407–431. [Google Scholar]
  12. Nitta, K. The Effect of Income Heterogeneity in An Experiment with Global and Local Public Goods; Working Paper No. 14-3; University of Hawaii at Manoa, Economics Department: Honolulu, HI, USA, 2015. [Google Scholar]
  13. Oxoby, R.J.; Spraggon, J. A clear and present minority: Heterogeneity in the source of endowments and the provision of public goods. Econ. Inq. 2013, 51, 2071–2082. [Google Scholar] [CrossRef]
  14. Fellner, G.; Iida, Y.; Kröger, S.; Seki, E. Heterogeneous Productivity in Voluntary Public Good Provision: An Experimental Analysis; Working Paper Series 133; University of Vienna, Department of Economics: Vienna, Austria, 2011. [Google Scholar]
  15. Fisher, J.; Isaac, R.M.; Schatzberg, J.W.; Walker, J.M. Heterogenous demand for public goods: Behavior in the voluntary contributions mechanism. Public Choice 1995, 85, 249–266. [Google Scholar] [CrossRef]
  16. Cappelen, A.W.; Moene, K.O.; Sørensen, E.Ø.; Tungodden, B. Needs versus entitlements—An international fairness experiment. J. Eur. Econ. Assoc. 2013, 11, 574–598. [Google Scholar] [CrossRef] [Green Version]
  17. Chuah, S.-H.; Hoffmann, R.; Jones, M.; Williams, G. Do cultures clash? Evidence from cross-national ultimatum game experiments. J. Econ. Behav. Org. 2007, 64, 35–48. [Google Scholar] [CrossRef]
  18. Carpenter, J.; Cardenas, J.C. An intercultural examination of cooperation in the commons. J. Confl. Resolut. 2011, 55, 632–651. [Google Scholar] [CrossRef] [Green Version]
  19. Castro, M.F. Where are you from? Cultural differences in public good experiments. J. Soc.-Econ. 2008, 37, 2319–2329. [Google Scholar] [CrossRef]
  20. Buchan, N.R.; Grimalda, G.; Wilson, R.; Brewer, M.; Fatas, E.; Foddy, M. Globalization and human cooperation. Proc. Natl. Acad. Sci. USA 2009, 106, 4138–4142. [Google Scholar] [CrossRef] [Green Version]
  21. Fischbacher, U.; Gächter, S.; Fehr, E. Are people conditionally cooperative? evidence from a public goods experiment. Econ. Lett. 2001, 71, 397–404. [Google Scholar] [CrossRef] [Green Version]
  22. Brandts, J.; Charness, G. The Strategy Method: A Survey of Experimental Evidence; Technical Report, Mimeo; Department of Business Economics, Autònoma de Barcelona and Department of Economics: Santa Barbara, CA, USA, 2009. [Google Scholar]
  23. Ledyard, J. Public Goods: A Survey of Experimental Research in Handbook of Experimental Economics; Princeton University Press: Princeton, NJ, USA, 1997. [Google Scholar]
  24. Heap, S.P.H.; Ramalingam, A.; Stoddard, B.V. Endowment inequality in public goods games: A re-examination. Econ. Lett. 2016, 146, 4–7. [Google Scholar] [CrossRef] [Green Version]
  25. Buckley, E.; Croson, R. Income and wealth heterogeneity in the voluntary provision of linear public goods. J. Public Econ. 2006, 90, 935–955. [Google Scholar] [CrossRef]
  26. Hofmeyr, A.; Burns, J.; Visser, M. Income inequality, reciprocity and public good provision: An experimental analysis. S. Afr. J. Econ. 2007, 75, 508–520. [Google Scholar] [CrossRef]
  27. Greiner, B. Subject pool recruitment procedures: Organizing experiments with ORSEE. J. Econ. Sci. Assoc. 2015, 1, 114–125. [Google Scholar] [CrossRef]
  28. Levitt, S.D.; List, J.A. What do laboratory experiments measuring social preferences reveal about the real world? J. Econ. Perspect. 2007, 21, 153–174. [Google Scholar] [CrossRef] [Green Version]
  29. Tanaka, T.; Camerer, C.F.; Nguyen, Q. Risk and time preferences: Linking experimental and household survey data from vietnam. Am. Econ. Rev. 2010, 100, 557–571. [Google Scholar] [CrossRef] [Green Version]
  30. Gneezy, U.; Leibbrandt, A.; List, J.A. Ode to the sea: Workplace organizations and norms of cooperation. Econ. J. 2015, 126, 1856–1883. [Google Scholar] [CrossRef]
  31. Henrich, J.; Boyd, R.; Bowles, S.; Camerer, C.; Fehr, E.; Gintis, H.; McElreath, R. In search of homo economicus: Behavioral experiments in 15 small-scale societies. Am. Econ. Rev. 2001, 91, 73–78. [Google Scholar] [CrossRef] [Green Version]
1.
Tests show no statistically significant order effect in our results.
2.
In our design, our participants made decisions as both “Set A” and “Set B” individuals. This introduces the possibility of a self-serving bias, where one could imagine that the same individual when deciding to contribute in “Set A” thinks that this might benefit her/himself in “Set B”. We made sure to inform participants that this would never be the case; however, one cannot exclude this as a possible motivational bias in the observed public good contributions.
3.
To limit the complexity of the experimental design, we chose only to examine the influence of a positive feedback from a past generation. We acknowledge that this is a limitation of our design, as a negative feedback mechanism is a realistic possibility in the real world, which also have been studied previously in the literature [4].
4.
Two participants in Denmark, five participants in Spain and 3 participants in Ghana were no longer students at the time of the experiment.
5.
Instructions were originally written in English, translated to Danish and Spanish and then re-translated to English by a different translator.
6.
Contributions are also statistically significantly different between InsT and EndT. One-sided t-Tests show that past-generation individuals under InsT contributed more than past-generation individuals under EndT, p = 0.0019 .
Figure 1. Overview of Experimental Design.
Games 11 00006 g001
Table 1. Number of Sessions and Participants Per Treatment.
Denmark
CodeTreatment Name# Sessions# Participants
BaseTBaseline672
InsTInstitutions Treatment672
EndTEndowments Treatment560
Spain
CodeTreatment Name# Sessions# Participants
BaseTBaseline672
InsTInstitutions Treatment672
EndTEndowments Treatment560
Ghana
CodeTreatment Name# Sessions# Participants
BaseTBaseline672
InsTInstitutions Treatment672
EndTEndowments Treatment560
Notes: We initially planned to run a total of 20 sessions in each country. Despite inviting more than 12 participants to each session, we had sessions with less than 12 participants. We had to drop these sessions across all our three countries.
Table 2. Past-Generation Behavior.
Dependent Variable: Tokens Contributed
Simple
(1)
Controls
(2)
InsT1.1424 **
(0.4158)
0.7229 **
(0.3261)
EndT0.4979
(0.3837)
2.2572 ***
(0.4214)
Constant7.6458 ***
(0.2561)
−3.2526
(2.7702)
R-squared00.06
N36003536
Controlsnoyes
Notes: I n s T , and E n d T are dummy variables that take on the value of 1 if an observation is under InsT and EndT, respectively. Control variables include gender (1 = Male), age, belief (1 = Believed the experimental setup), and risk (1 = risk averse, 10 = risk-loving). In Column (1), the baseline is an individual in the B a s e T treatment. Order effects are included in all regressions. OLS regressions run. Robust standard errors clustered on an individual level in parentheses. *** p < 0.01 , ** p < 0.05 .
Table 3. Present Contributions Due to Past Contributions.
Dependent Variable: % Tokens Contributed
PooledTransnational OnlyNational OnlyPooled with Interaction
(1)(2)(3)(4)(5)(6)(7)(8)
InsT0.0477 ***0.0397 **0.0568 ***0.0453 **0.0385 **0.0335
(0.0147)(0.0151)(0.0154)(0.0164)(0.0167)(0.0233)
EndT−0.027−0.0327−0.0175−0.0271−0.0365 **−0.0388
(0.0152)(0.0170)(0.0173)(0.0202)(0.0142)(0.0211)
BaseT * Trans −0.0206 **−0.0206 **
(0.0083)(0.0083)
InsT * Nat 0.0385 **0.0303
(0.0167)(0.0187)
InsT * Trans 0.0362 **0.0285
(0.0123)(0.0132)
EndT * Nat −0.0365 **−0.0415 **
(0.0142)(0.0173)
EndT * Trans −0.0381 **−0.0445 **
(0.0146)(0.0184)
Constant0.3823 ***−0.12490.3720 ***−0.10570.3926 ***−0.14350.3926 ***−0.1146
(0.0128)(0.1201)(0.0141)(0.1186)(0.0128)(0.1243)(0.0128)(0.1196)
R-Squared0.010.070.010.080.010.080.010.07
N36003536180017681800176836003536
Controlsnoyesnoyesnoyesnoyes
Notes: B a s e T , I n s T , and E n d T are dummy variables that take on the value of 1 if an observation is under BaseT, InsT, and EndT, respectively. T r a n s and N a t are also dummy variables that take on the value of 1 an individual is contributing to a transnational and national public good, respectively. For BaseT is the baseline in columns (1) to (6) and BaseT * Nat is the baseline in column (7) and (8). Control variables include gender (1 = Male), age, belief (1 = Believed the experimental setup), and risk (1 = risk averse, 10 = risk-loving). Order effects are included in all regressions. OLS regressions run. Robust standard errors clustered on an individual level in parentheses. *** p < 0.01 , ** p < 0.05 , “*” in the variable name indicates an interaction term.
Table 4. Present Contributions by Treatment.
Dependent Variable: % Tokens Contributed
PooledTransnational OnlyNational Only
(1)(2)(3)(4)(6)
MPCR0.2141 ***0.2464 **0.1875 **0.1824 **0.1381
(0.0686)(0.0806)(0.0630)(0.0769)(0.0889)
Constant0.3050 ***0.2845 ***−0.3501 **0.3251 ***−0.3738 **
(0.0318)(0.0388)(0.1553)(0.0369)(0.1648)
R-squared00.010.1200.12
N21601080107210801072
Controlsnonoyesnoyes
PooledTransnational OnlyNational Only
(7)(8)(9)(10)(11)
Endowment−0.003−0.0024−0.0029−0.0035 **−0.0036
(0.0017)(0.0020)(0.0022)(0.0014)(0.0018)
Constant0.4392 ***0.4221 ***0.14020.4561 ***0.0883
(0.0436)(0.0527)(0.1285)(0.0380)(0.1252)
R-squared000.0400.05
N1872936912936912
Controlsnonoyesnoyes
Notes: Control variables include gender (1 = Male), age, belief (1 = Believed the experimental setup), and risk (1 = risk averse, 10 = risk-loving). Order effects are included in all regressions. OLS regressions run. Robust standard errors clustered on an individual level in parentheses. *** p < 0.01 , ** p < 0.05 .
Table 5. Present Contributions by Country.
Dependent Variable: % Tokens Contributed
DenmarkDenmarkSpainSpainGhanaGhana
(1)(2)(3)(4)(5)(6)
BaseT * Trans−0.0361 **−0.0369 ***−0.0243 ***−0.0243 ***−0.0243 ***−0.0021
(0.0116)(0.0099)(0.0065)(0.0074)(0.0065)(0.0222)
InsT * Nat0.05360.05710.02810.02820.0281−0.0025
(0.0511)(0.0393)(0.0212)(0.0226)(0.0212)(0.0458)
InsT * Trans0.0580.06160.03890.03920.0389−0.0191
(0.0443)(0.0354)(0.0216)(0.0243)(0.0216)(0.0471)
EndT * Nat−0.0943−0.08770.01520.01410.0152−0.0616
(0.0432)(0.0446)(0.0289)(0.0354)(0.0289)(0.0422)
EndT * Trans−0.0995 **−0.0927 **0.00710.00580.0071−0.0557
(0.0384)(0.0400)(0.0251)(0.0319)(0.0251)(0.0453)
Constant0.4743 ***0.30470.2236 ***0.1930.2236 ***0.1288
(0.0280)(0.1962)(0.0208)(0.1248)(0.0208)(0.3385)
R-Squared0.050.2100.100.09
N120011741200116812001014
Controlsnoyesnoyesnoyes
Notes: B a s e T , I n s T , and E n d T are dummy variables that take on the value of 1 if an observation is under BaseT, InsT, and EndT, respectively. T r a n s and N a t are also dummy variables that take on the value of 1 an individual is contributing to a transnational and national public good, respectively. Control variables include gender, age, belief, risk, trust, cooperativeness, wealthy, and degree of caring. Order effects are included in all regressions. OLS regressions run. Robust standard errors clustered on an individual level in parentheses. *** p < 0.01 , ** p < 0.05 , “*” in the variable name indicates an interaction term.