1. Introduction
Serverless has grown into a very convincing cloud solution for almost any type of application, promising to remove the overhead associated with infrastructure maintenance. All major cloud providers are invested in this type of platform [
1]. The advertised benefits are the lack of server maintenance, autoscaling, pay-per-usage, and high availability [
2,
3,
4].
Although serverless covers resources like computing, database, storage, stream processing, message queueing, and more, our focus is on computing resources, specifically on function-as-a-service. This type of resource, also referred to as FaaS, is essentially a stateless computing container that is event-triggered and lasts for a single invocation. Unlike virtual machines, the provider is responsible for resource provisioning and allocation. FaaS is billed per invocation and per gigabyte-of-memory used per second, measured during actual invocations [
5,
6]. FaaS can be used for data-processing or as application backends, including web applications, or more generically, Web Application Programming Interfaces or Web APIs. Traditionally, the latter are deployed on virtual machines, with the additional cost of provisioning and configuring the underlying infrastructure. Features like load balancing and dynamic scaling fall under the customer’s responsibility.
This paper shows the results for the investigation on finding the best ways of deploying a Web API into the cloud, focusing on how end-users perceive performance, more precisely on response times. We look at three types of deployments in the cloud: monolithic on virtual machines, microservices on virtual machines, and function-as-a-service. The goal is to compare response times for each type of deployment, while also factoring-in costs, in order to help with better decision-making when it comes to designing and deploying a Web API into the cloud.
1.1. Research Questions
FaaS is advertised as a good fit for Web API applications and especially microservices since they have similar granularity. We want to find out how the same application deployed on virtual machines compares to serverless, by looking at monolithic, microservices, and function-as-a-service deployments. We start from the assumption that the existing resource constraints of FaaS are already considered, and the application is within these limits. We try to answer to the following research questions in order to support and structure the investigation:
How do different types of deployments in the cloud for Web API compare to one another in terms of response times with respect to load?
Are cost differences significant in order to offset the balance in favor of one type of deployment?
Multiple cloud providers offer serverless platforms, with many similarities between them in terms of hardware specification, configurability, and costs. We compare response times for our function-as-a-service application across different providers, using similar deployments in terms of hardware specification, in order to answer the following research question:
Is there any difference between FaaS providers when it comes to response times and costs?
1.2. Structure
This paper contains an analysis of other work that intersect or help with the proposed investigation, followed by a summary of the serverless offers from major cloud vendors.
Section 4 describes the implementation setup and testing strategy in more detail. In the subsequent chapter, we discuss results while trying to answer Research Questions 1, 2, and 3. Finally, we summarize the results and draw the conclusions.
2. Related Work
2.1. Improving Web Application Deployment in the Cloud
Roberts and Chapin’s work [
7,
8] is a good starting point to get an in-depth view of the Serverless domain, illustrating areas where the Serverless domain needs improvement, for example vendor lock-in, state management, the lack of any Serverless architecture patterns, and more [
9].
Lynn et al. [
10] compare FaaS offerings using other criteria besides just performance and cost. They argue that the advertised advantages of Serverless are based on few use-cases and research papers. However, Adzic and Chatley [
11] studied two production applications that have successfully transitioned to Serverless and found that the most compelling reasons for transitioning are hosting costs. They also concluded that high-throughput applications are a better choice than high-availability ones when it comes to costs. Eivy [
12] compared costs for running an application on a virtual machine versus running it on Serverless and found that it is cheaper to deploy it on virtual machines if there is a constant and predictable load. He advises that rigorous testing and simulations should be performed anyway, before deciding to move to Serverless.
Trihinas et al. [
13] make the case for microservices adoption, illustrating their drawbacks and presenting a solution [
14] that promises to solve the existing challenges. Georgiou et al. [
15] investigated a specific use-case, Internet-of-Things applications and edge processing, while showcasing their framework for streaming sensor analytics with the help of queries. Both references [
13,
15] point out the challenges of modern applications and successfully address these in one way or another, with the use of microservices and containers. This goes to show that although serverless may address the same issues, there are solid alternatives, such as microservices and containers, that should be considered or even better, be used together with serverless.
2.2. Serverless Computing Performance
Back and Andrikopoulos [
16] as well as Lee et al. [
17] did performance testing to compare FaaS offerings of different providers. They did this by gradually incrementing load on a single function while observing resource usage and comparing costs. The benchmark they defined can be used when individual raw power of a function is concerned. Lee et al. on the other hand, tracked more than just resource consumption and concluded that distributed data applications are a good candidate for FaaS, whereas applications that require high-end computing power are not a good fit. They found that the main reasons for this are the known execution time limit and fixed hardware resources. Lloyd et al. [
18] deployed microservices as FaaS and looked at a variety of factors that affect their performance. They did this by changing the load in order to observe how the underlying infrastructure performs.
Some papers [
10,
11,
12] look at possible use-case for Serverless by considering their advertised benefits and costs. Others [
16,
17,
18] investigated FaaS performance in-depth and across multiple cloud providers. We see an opportunity here to investigate a specific and common use-case for FaaS, namely Web APIs. We plan to focus on the end-user’s perspective by measuring and comparing a single metric, i.e., response times.
3. Serverless Computing Platforms
We compared two commercial serverless providers, Amazon Web Services or AWS Lambda and Microsoft Azure Functions, to help answer the proposed research questions. Google Cloud Functions are also considered for cost comparison.
3.1. Amazon Web Services Lambda
Amazon’s FaaS offering has been around since 2014 and is one of the most popular implementations of FaaS. In 2019 it supports Node.js, Python, Java, GO, C#, and PowerShell. Amazon counts and bills each request that invokes your Lambda function, with
$0.20 for each one million requests, across all your functions. Duration is also billed depending on the amount of memory you allocate to your function, with
$0.00001667 for every GB-second used [
5]. Duration is calculated from the time your code begins executing until it returns or terminates, rounded up to the nearest 100 ms. Amazon also provides one million free requests per month and 400,000 GB-seconds of computing time per month. Each individual function can be configured to use any amount of memory between 128 MB and 3 GB in 64 MB increments and you will be billed based on your configured amount. Lambda allocates CPU power linearly in proportion to the amount of memory configured. At 1792 MB, a function has the equivalent of one full virtual CPU. Amazon limits the execution time of a function to 900 s. Total concurrent executions across all functions within a given region are also limited by default to 1000 [
19].
3.2. Azure Functions
The FaaS alternative from Microsoft works with Node.js, Python, Java, C#, and F#. Like AWS Lambda, Azure Functions are billed based on executions and per-second resource consumption. Price for one million executions is
$0.20 and price for consumption is
$0.000016 per GB-second, identical to Amazon’s pricing scheme. Free grants are also the same: one million executions and 400,000 GB-seconds of computing time per month [
6].
Individual functions are hosted in a Function app, so multiple functions can be implemented in a single host. Function apps are allocated 1536 MB and one CPU, but you are not billed on this amount, you are billed on actual memory consumption, rounded to the nearest 128 MB, with execution time calculated by rounding up to the nearest millisecond. The consumption plan is the default you can run your functions under. This plan has an execution time limit of 10 min and a scale-limit of 200 instances [
20]. A single instance may process more than one message or request at a time, so there is no limit on the number of concurrent executions. The App Service Plan is another plan you can choose, where your functions run on your dedicated virtual machines (VMs) and the execution time is unlimited. There is also a Premium plan, still in public preview mode, that promises configurable instance sizes, unlimited execution duration, and always warm instances [
21].
3.3. Cloud Functions
Google’s implementation of FaaS only supports Node.js, Python, and GO. Pricing is
$0.40 per million invocations and
$0.009 per GB-hour rounded to the nearest 100 ms. Google also bills CPU usage per second at
$0.036 per GHz-hour and in-out data traffic at
$0.12 per GB. It also includes a free tier of two million executions, 400,000 GB-seconds, 200,000 GHz-seconds of computing time, and 5 GB of internet traffic per month [
22]. Although the previous providers do not mention data-traffic costs when describing FaaS, these costs exist and traffic coming in and out of their respective cloud networks is billed accordingly.
Functions can be configured to use between 128 MB to 2 GB of memory and then CPU is allocated proportionally. A 2 GB memory will be allocated a 2.4 GHz CPU [
23]. Cloud functions are limited to 540 s execution time and 1000 concurrent invocations.
3.4. Use-Cases
FaaS-suggested usages are similar across providers and can be generalized into data-processing and backends. The advertised solutions for AWS Lambda are data real-time file processing, real-time stream processing, data transformations, and backends for Internet-of-Things, mobile, or web applications [
24]. Based on Microsoft’s suggestions, Azure Functions can be used to implement web applications, APIs, microservices, machine learning workflows, data processing pipelines, and real-time processing applications [
25]. Google Cloud Functions are suitable for implementing application backends, real-time data processing systems, and intelligent applications [
26].
This chapter was a walkthrough of the FaaS offers from Amazon, Microsoft, and Google. We learned what the limitations, costs, and use-cases are for function-as-a-service implementations. Web applications are advertised as good candidates for this serverless technology, so the proposed investigation targets Web APIs built within the hardware limitations of FaaS.
4. Experimental Setup
In order to support our investigation, a Web API was built as a monolith and then broken down into microservices and function(s)-as-a-service. The monolith and each microservice were deployed on separate virtual machines.
4.1. Implementation Details
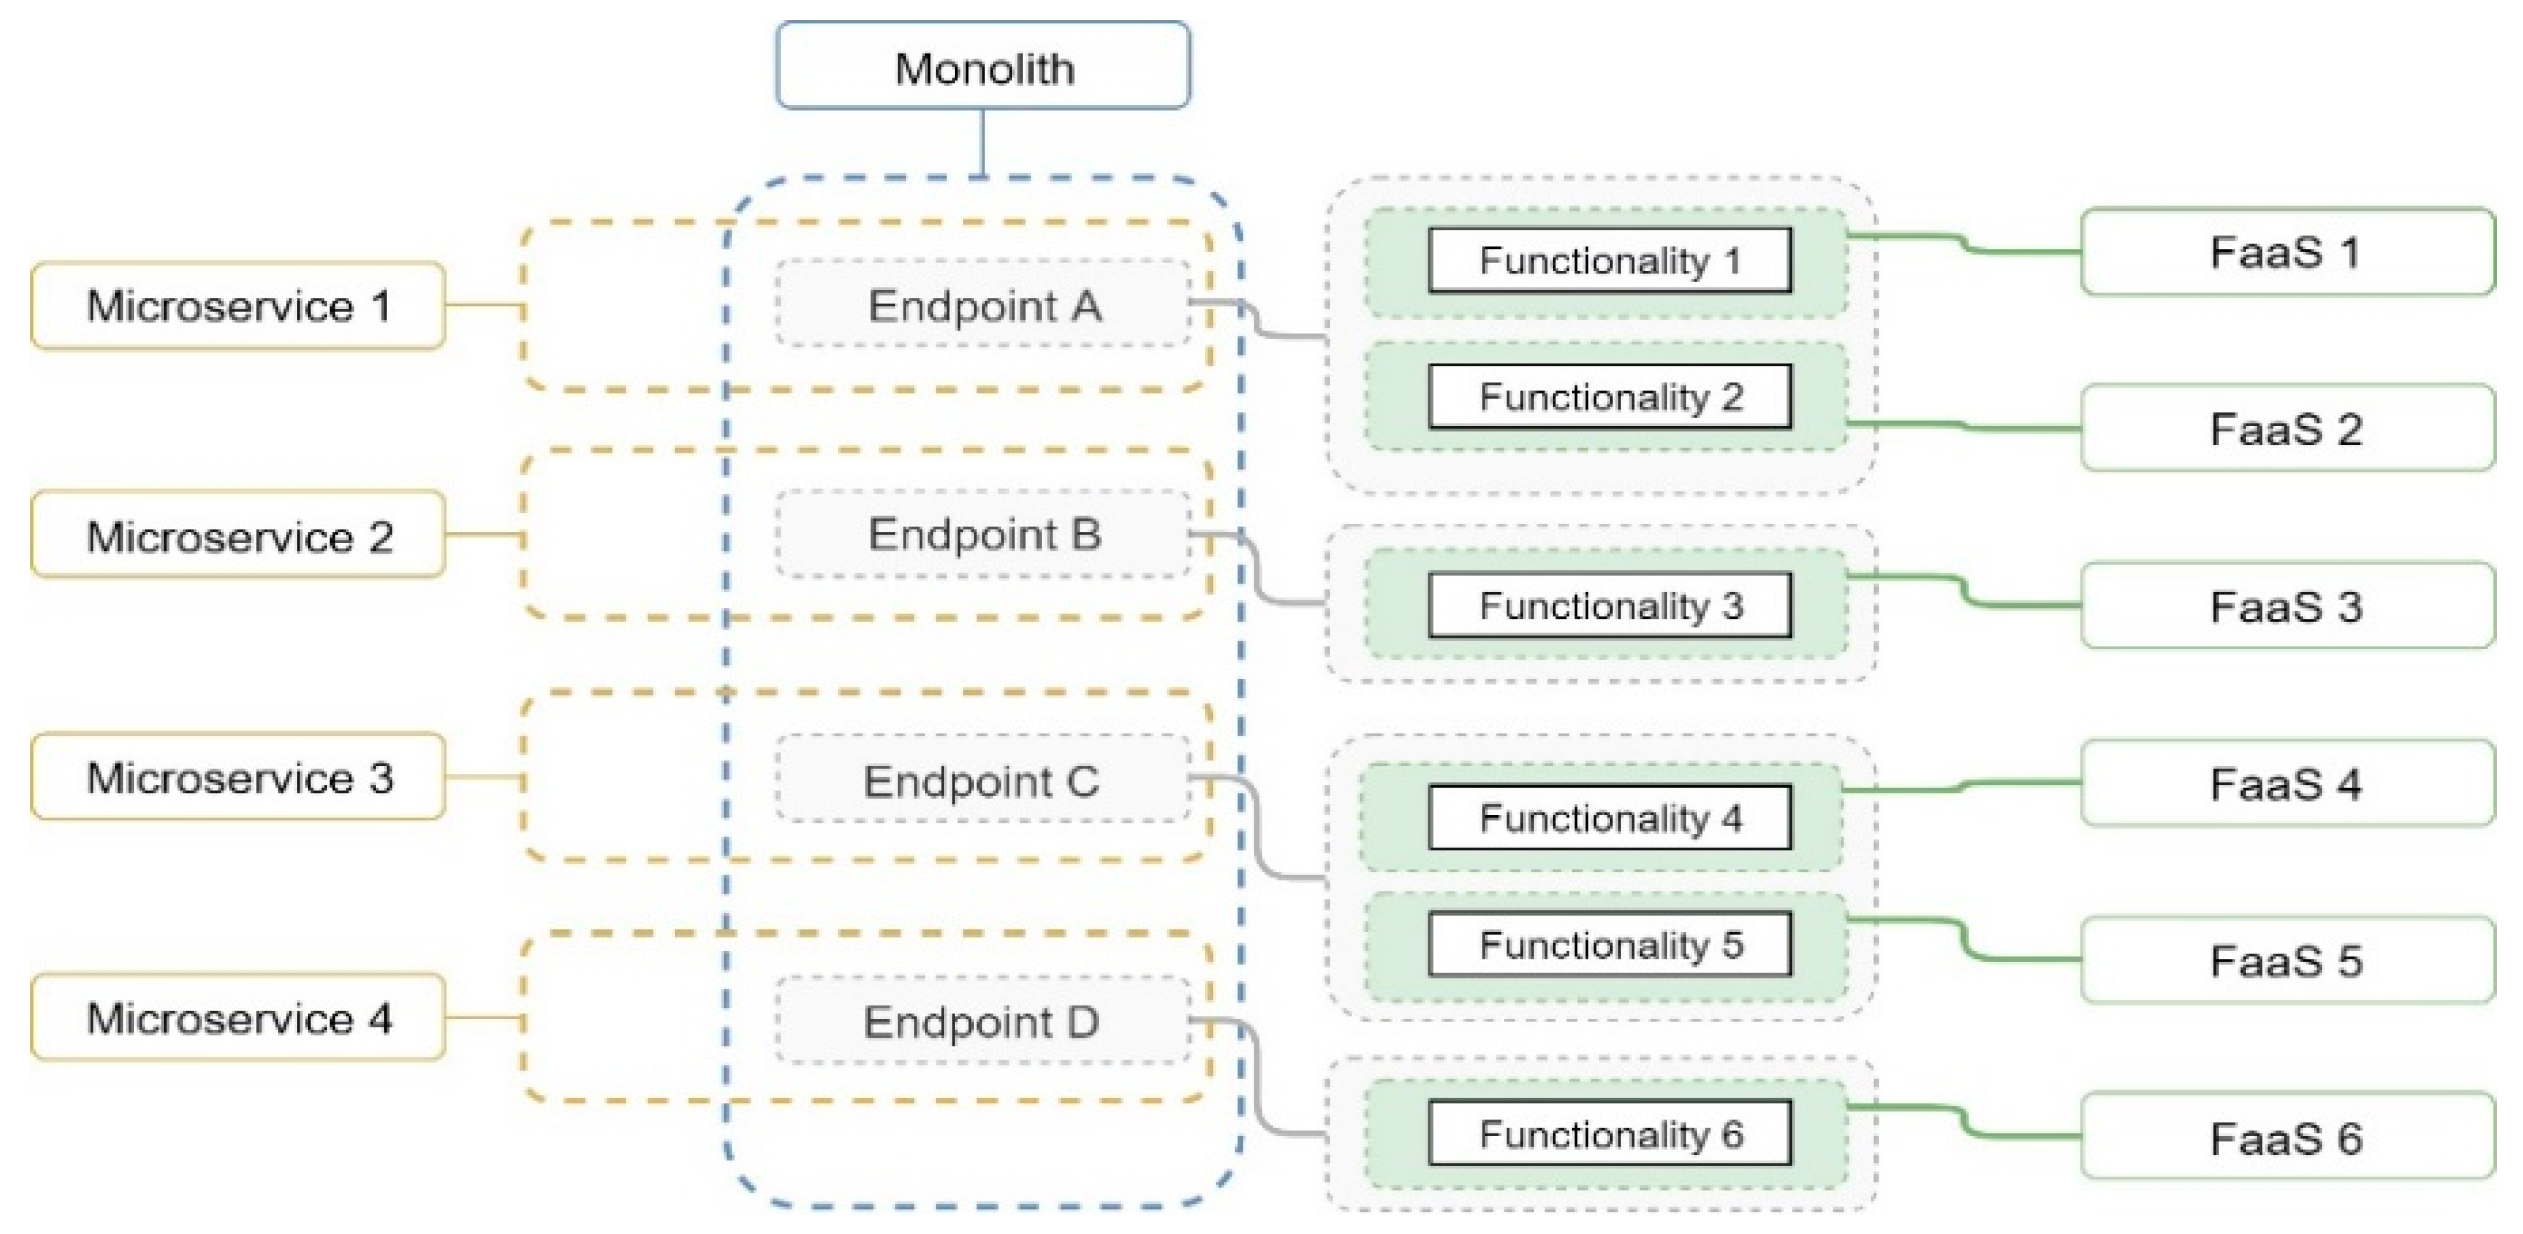
The Web API was built using .NET Core 2.1 with C# and it comprises of four endpoints, covering six functionalities. The distribution of these features within each type of application, visible in
Figure 1, is as follows: (1) monolith encompasses all features into a single application, (2) each of the four endpoints is implemented by a separate microservice, and (3) every functionality is contained into a separate function-as-a-service.
The three types of applications share most of the code while the corresponding entry-points are the only differences between them. The same code is used for business logic, data and storage access, and implicitly the same relational database and file storage. The client facing methods’ signature and input parameter reading are specific-to and different-for each application.
The implemented methods mimic real production functionalities through the operations they employ, such as database read, write and delete, or file upload, read, and write. File handling functionalities are compute-bound and memory-bound, adjustable via the workload provided as file input. Specifically, files consisting of random sequences of characters are traversed in order to find all distinct fixed-length sequences. Memory can be stressed by varying the length of the input files, and the fixed length of sequences that are sought after. CPU can be stressed by modifying the number of input files, as each file is processed on a separate thread.
4.2. Deployment and Configuration
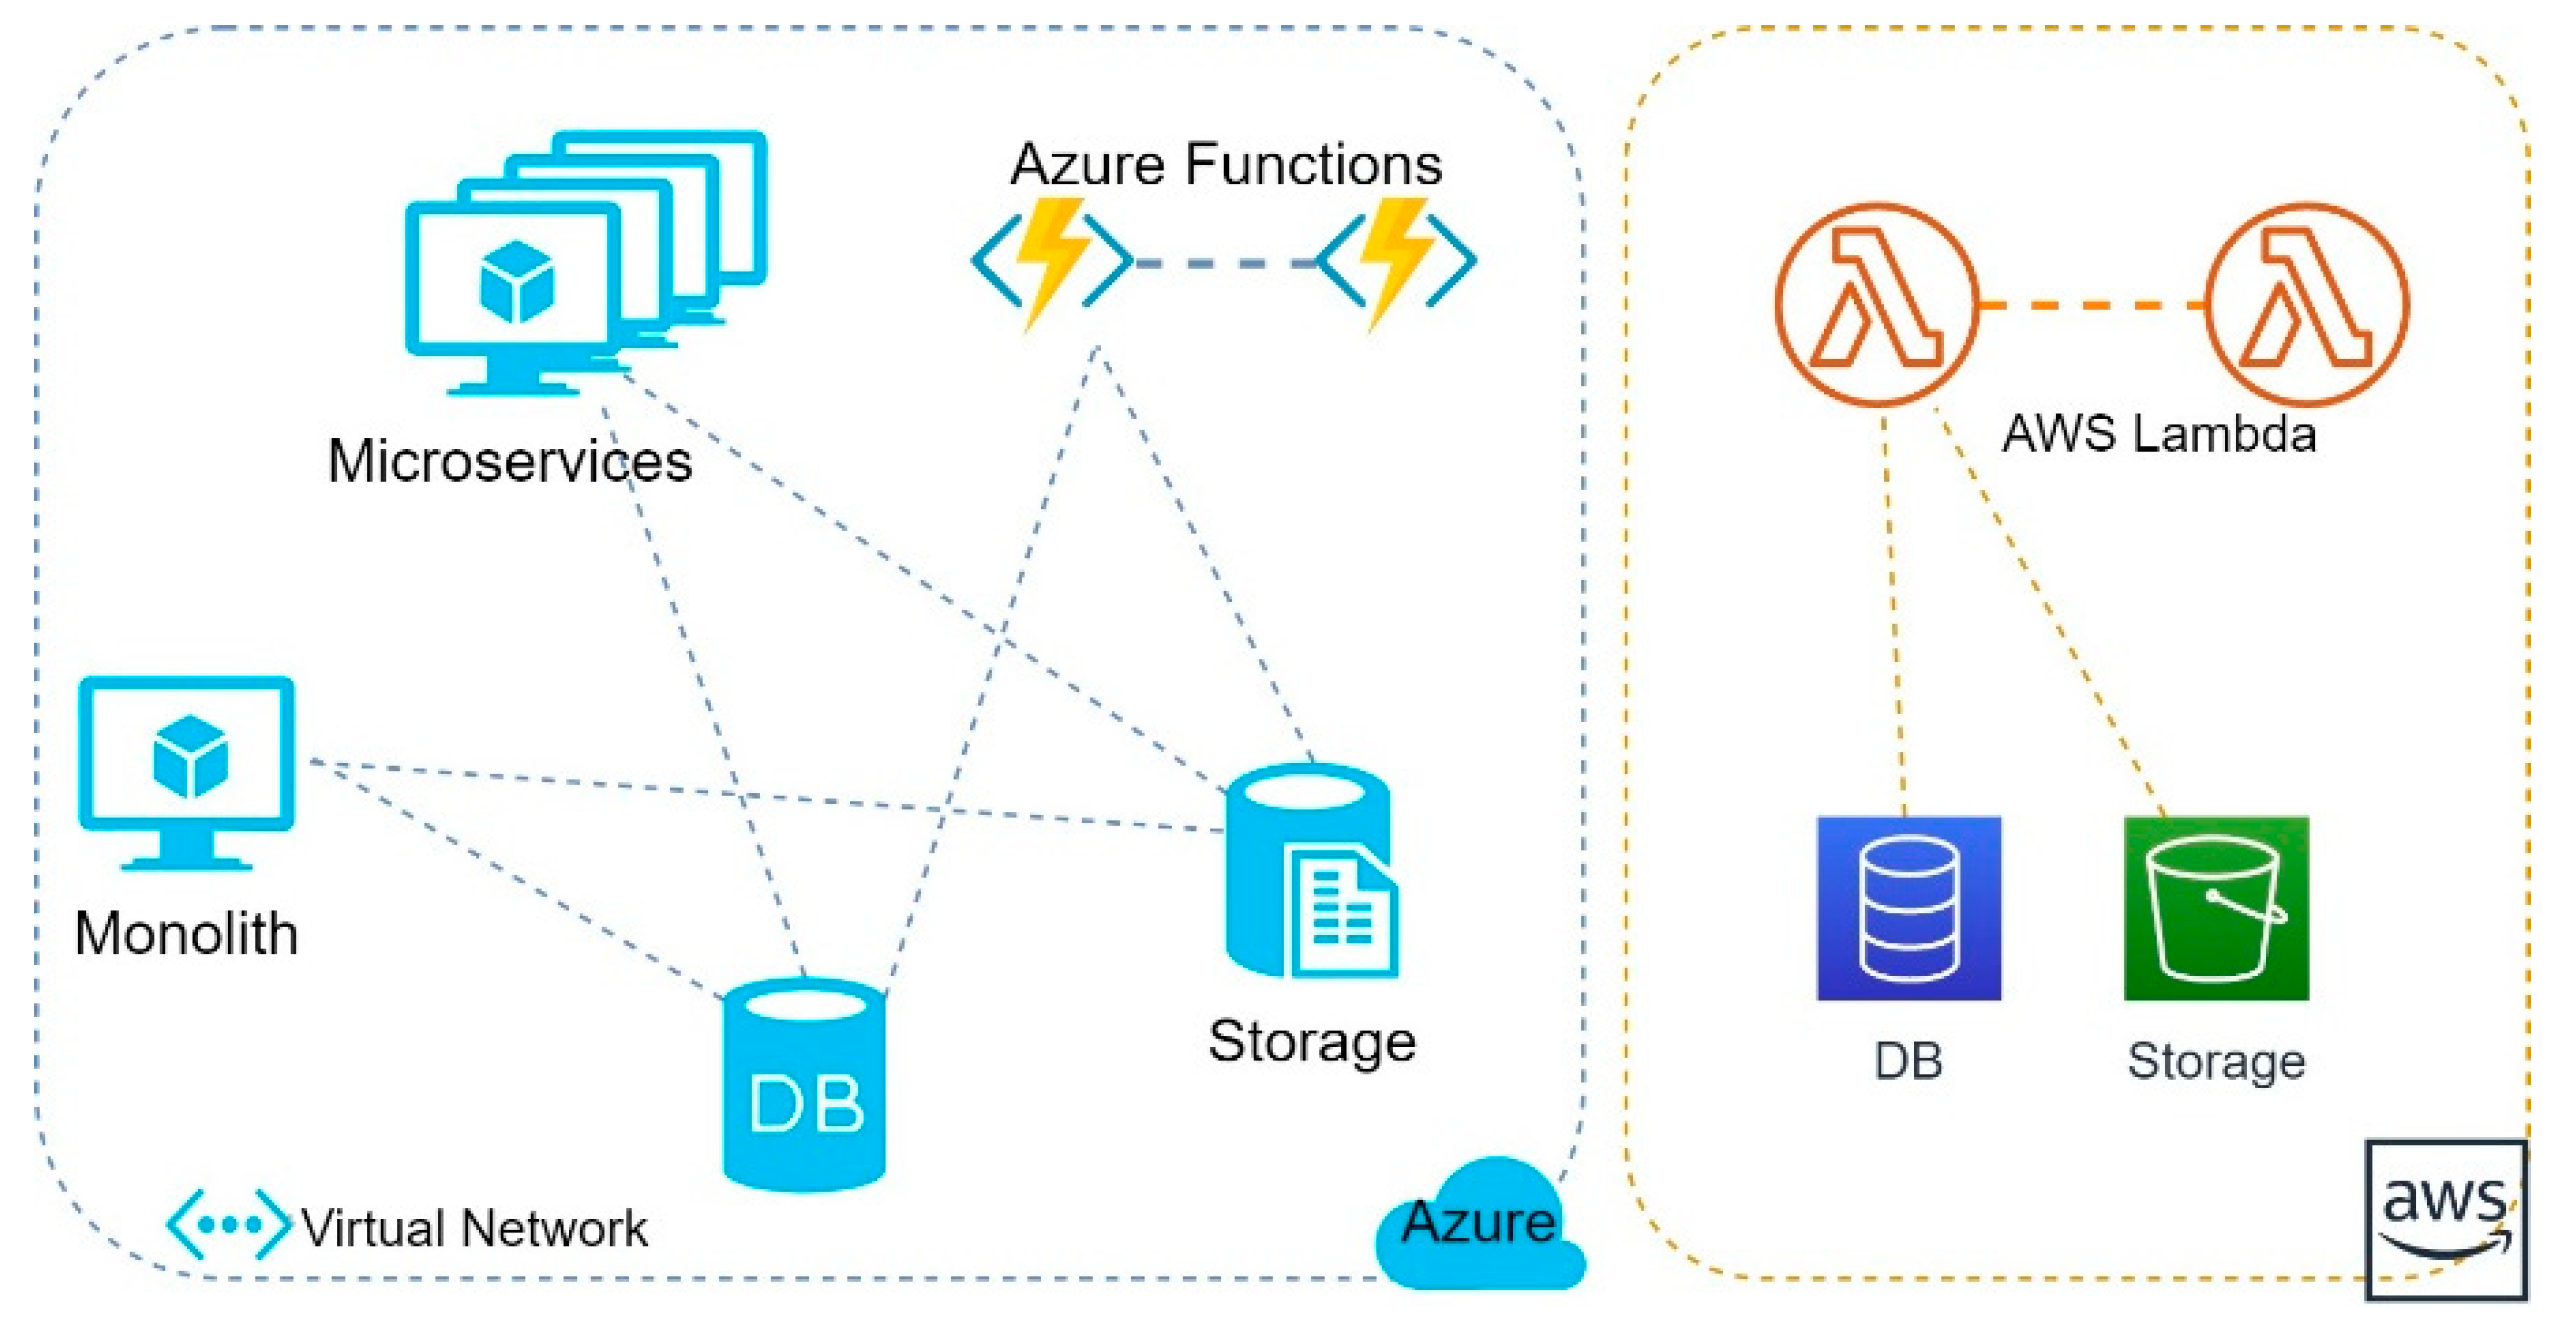
All three applications were deployed into Microsoft Azure, in the same geographical location and virtual network, sharing the same relational database and file storage, as seen in
Figure 2. The FaaS implementation was also deployed into AWS with a corresponding separate database and file storage, in order to answer to Research Question 3.
4.2.1. Monolith and Microservices
Monolith and Microservices were deployed on virtual machines with comparable hardware resources to the Azure Functions. Each instance of a function is provisioned with one virtual CPU and 1.5 GB of RAM [
20] and will handle a single functionality at one time. VM choices, as described in
Table 1, were established based on (1) the number of functionalities and their complexity that each application needs to handle, and (2) the number of Azure Functions in terms of vCPU and memory one could ‘fit’ into that VM, in order to support those functionalities. We refer to the second criteria as FaaS quota in
Table 1. Hence, in the interpretation, a virtual machine has comparable hardware resources when the FaaS quota of vCPU and memory is close in value to the number of supported functionalities.
B-series VMs [
27] were chosen as they provide the necessary level of performance for the workload. Three of the four microservices will each be hosted on the first type of virtual machine, while the fourth microservice will reside on the second type. The latter, more powerful VM type, will host the monolith, as it needs to support all six features.
4.2.2. Function(s)-as-a-Service (FaaS)
Six Azure Functions were deployed using a consumption plan [
20] where each function is allocated one CPU and 1.5 GB of memory. Six additional AWS Lambda functions were also published in the AWS Cloud and configured to use 1.5 GB of memory, to match the hardware resources of the Azure Functions. Both Azure and AWS functions are http-triggered.
4.3. Testing Strategy
Our main approach was to measure response times while varying the number of concurrent users. This was achieved with load tests defined-in and executed-with an Apache Jmeter [
28], from a separate virtual machine in the same virtual network as the application under test. There are some specific features to the Apache Jmeter which characterize test runs worth mentioning:
Scenarios:
The six supported functionalities were chained into different combinations, in order to define four separate use-cases. At any given time during the test-run, each user will execute one of these scenarios, simulating real usage behavior.
Ramp-Up
Is the amount of time it takes to reach the targeted number of concurrent users, starting with no users and gradually generating new ones [
29]. Reducing the ramp-up period can put additional stress on the application under test while also simulating unexpected user growth.
We defined three types of ramp-ups in
Table 2 [
30]. The intention was to simulate an unexpected user growth with the last two ramp-ups, whereas the gradual ramp-up was meant to bring the load up to its target, in a long enough amount of time so as not to upset the overall response times.
Test duration
Test duration was set to 30 min, established through calibration phases, considering: (1) gradual ramp-up should be long enough so as not to put additional stress on the underlying application, and (2) there should be sufficient time left for observations after full load is reached in order to avoid false positives or anomalies.
Limitations
We intentionally avoided exploiting the known limitations of FaaS [
8,
9,
20] because we started with the assumption that the application under test is already within these boundaries, as mentioned in
Section 1. Scenarios, and more precisely, the input workloads, were set-up to be within the CPU and memory configurations of FaaS applications. Each test-run was preceded by a shorter test-run with a smaller load, whose purpose was to trigger the provisioning of multiple FaaS instances in order to reduce startup latency.
Load
Load is the number of users that are simultaneously using the application. The proposed test-runs spawn the targeted number of users linearly and maintain this load, up to the end of the run. Several test phases were defined in
Table 3. The first six test phases are meant to contrast the deployments in the same cloud environment, whereas the remaining phases are to compare FaaS deployments of Amazon and Microsoft. Additionally, some phases were run multiple times to account for the different types of ramp-ups.
5. Experimental Results and Discussion
In this chapter we give answers to the proposed research questions by analyzing the results from the nine test stages defined in
Table 3. We use the testing strategy defined in
Section 4 and run it against the three applications. We compare VM deployments with FaaS by varying the number of concurrent users. We then contrast Microsoft and Amazon’s FaaS offerings, using the same testing strategy and measuring response times. At the end, we compare costs to check for discrepancies that might be deciding factors.
5.1. Virtual Machines versus Serverless Comparison
In this section we looked at Phase 1 to 6, which include all three types of deployments. As displayed in
Table 3, the virtual machine deployments have comparable underlying infrastructure which should give them enough resources to handle load up to a certain point before degrading, when the auto-scaling capabilities of FaaS are apparent.
5.1.1. Predictable User Growth
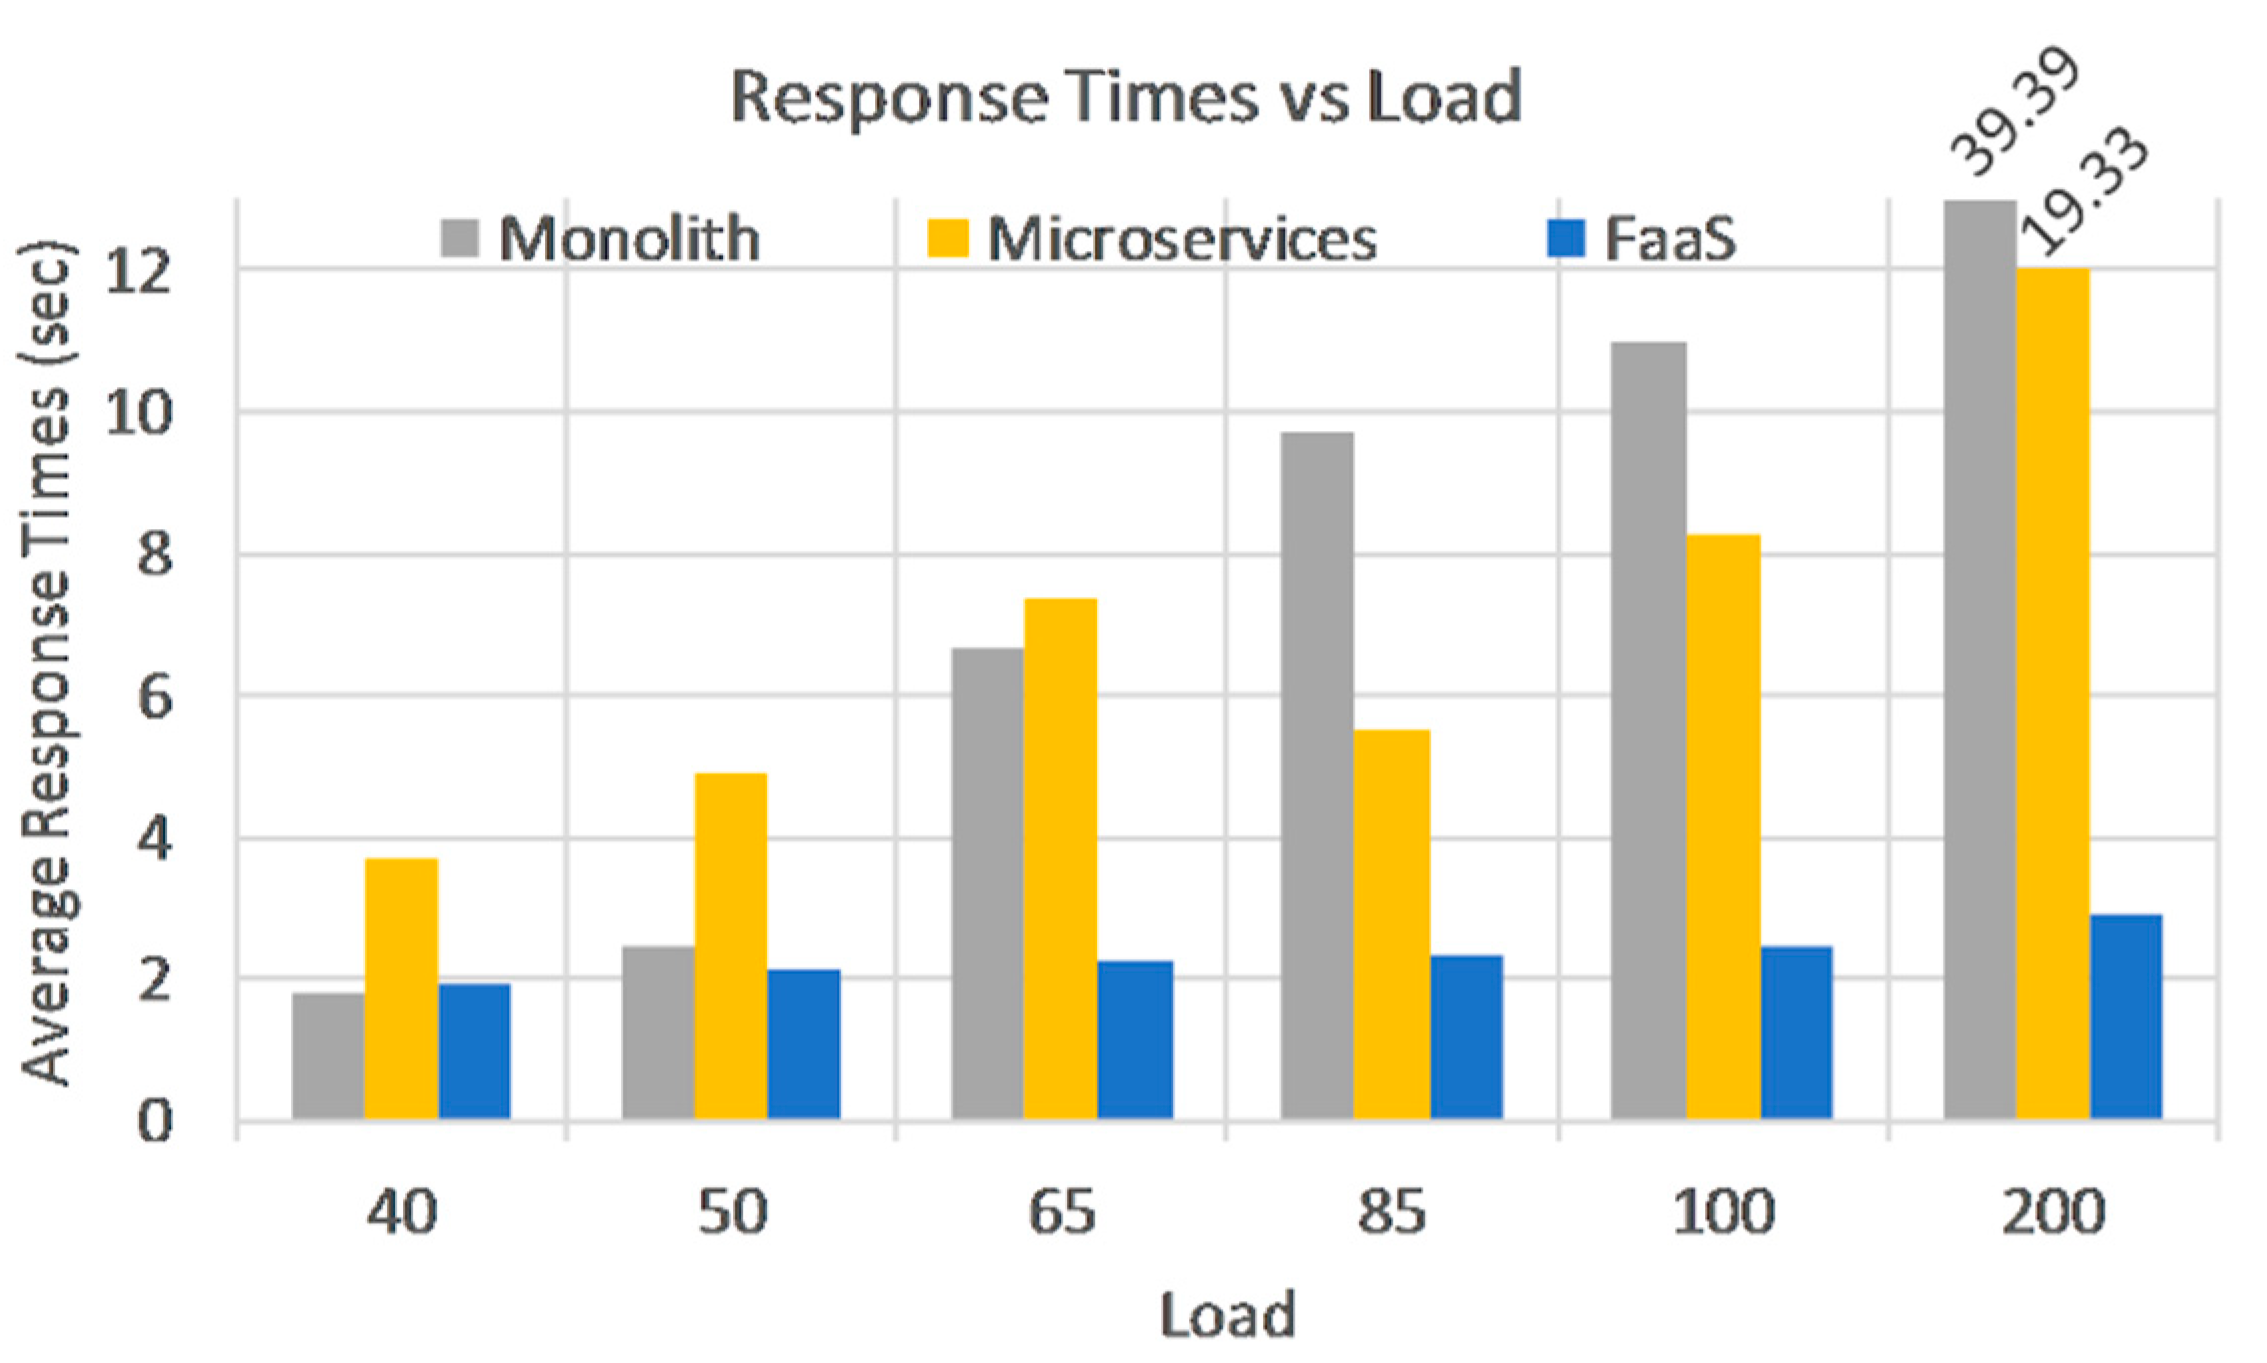
Figure 3 shows us that on smaller loads Monolith performs better, but it degrades faster as load increases, with 66% on average per phase. The better results in the initial phases can be explained by the more powerful underlying virtual machine. Microservices on the other hand don’t perform as well in the first two phases, having a 100% increase compared to Monolith. However, they degrade slower in subsequent phases, 26% on average per phase, due to the load being spread among multiple VMs.
FaaS response times are almost constant when compared to VMs and degrade even slower, at a 6% rate on average. Note that the last phase was not taken into account when discussing degradation rates because VMs were already close to maximum capacity at the previous 100-user phase, so it would not have been a fair comparison anymore. Another aspect we can observe, is that the 50-user load seems to be an upper limit for VM deployments and scenarios, with respect to response time. Anything beyond this value without scaling capabilities puts the VM deployments at a disadvantage.
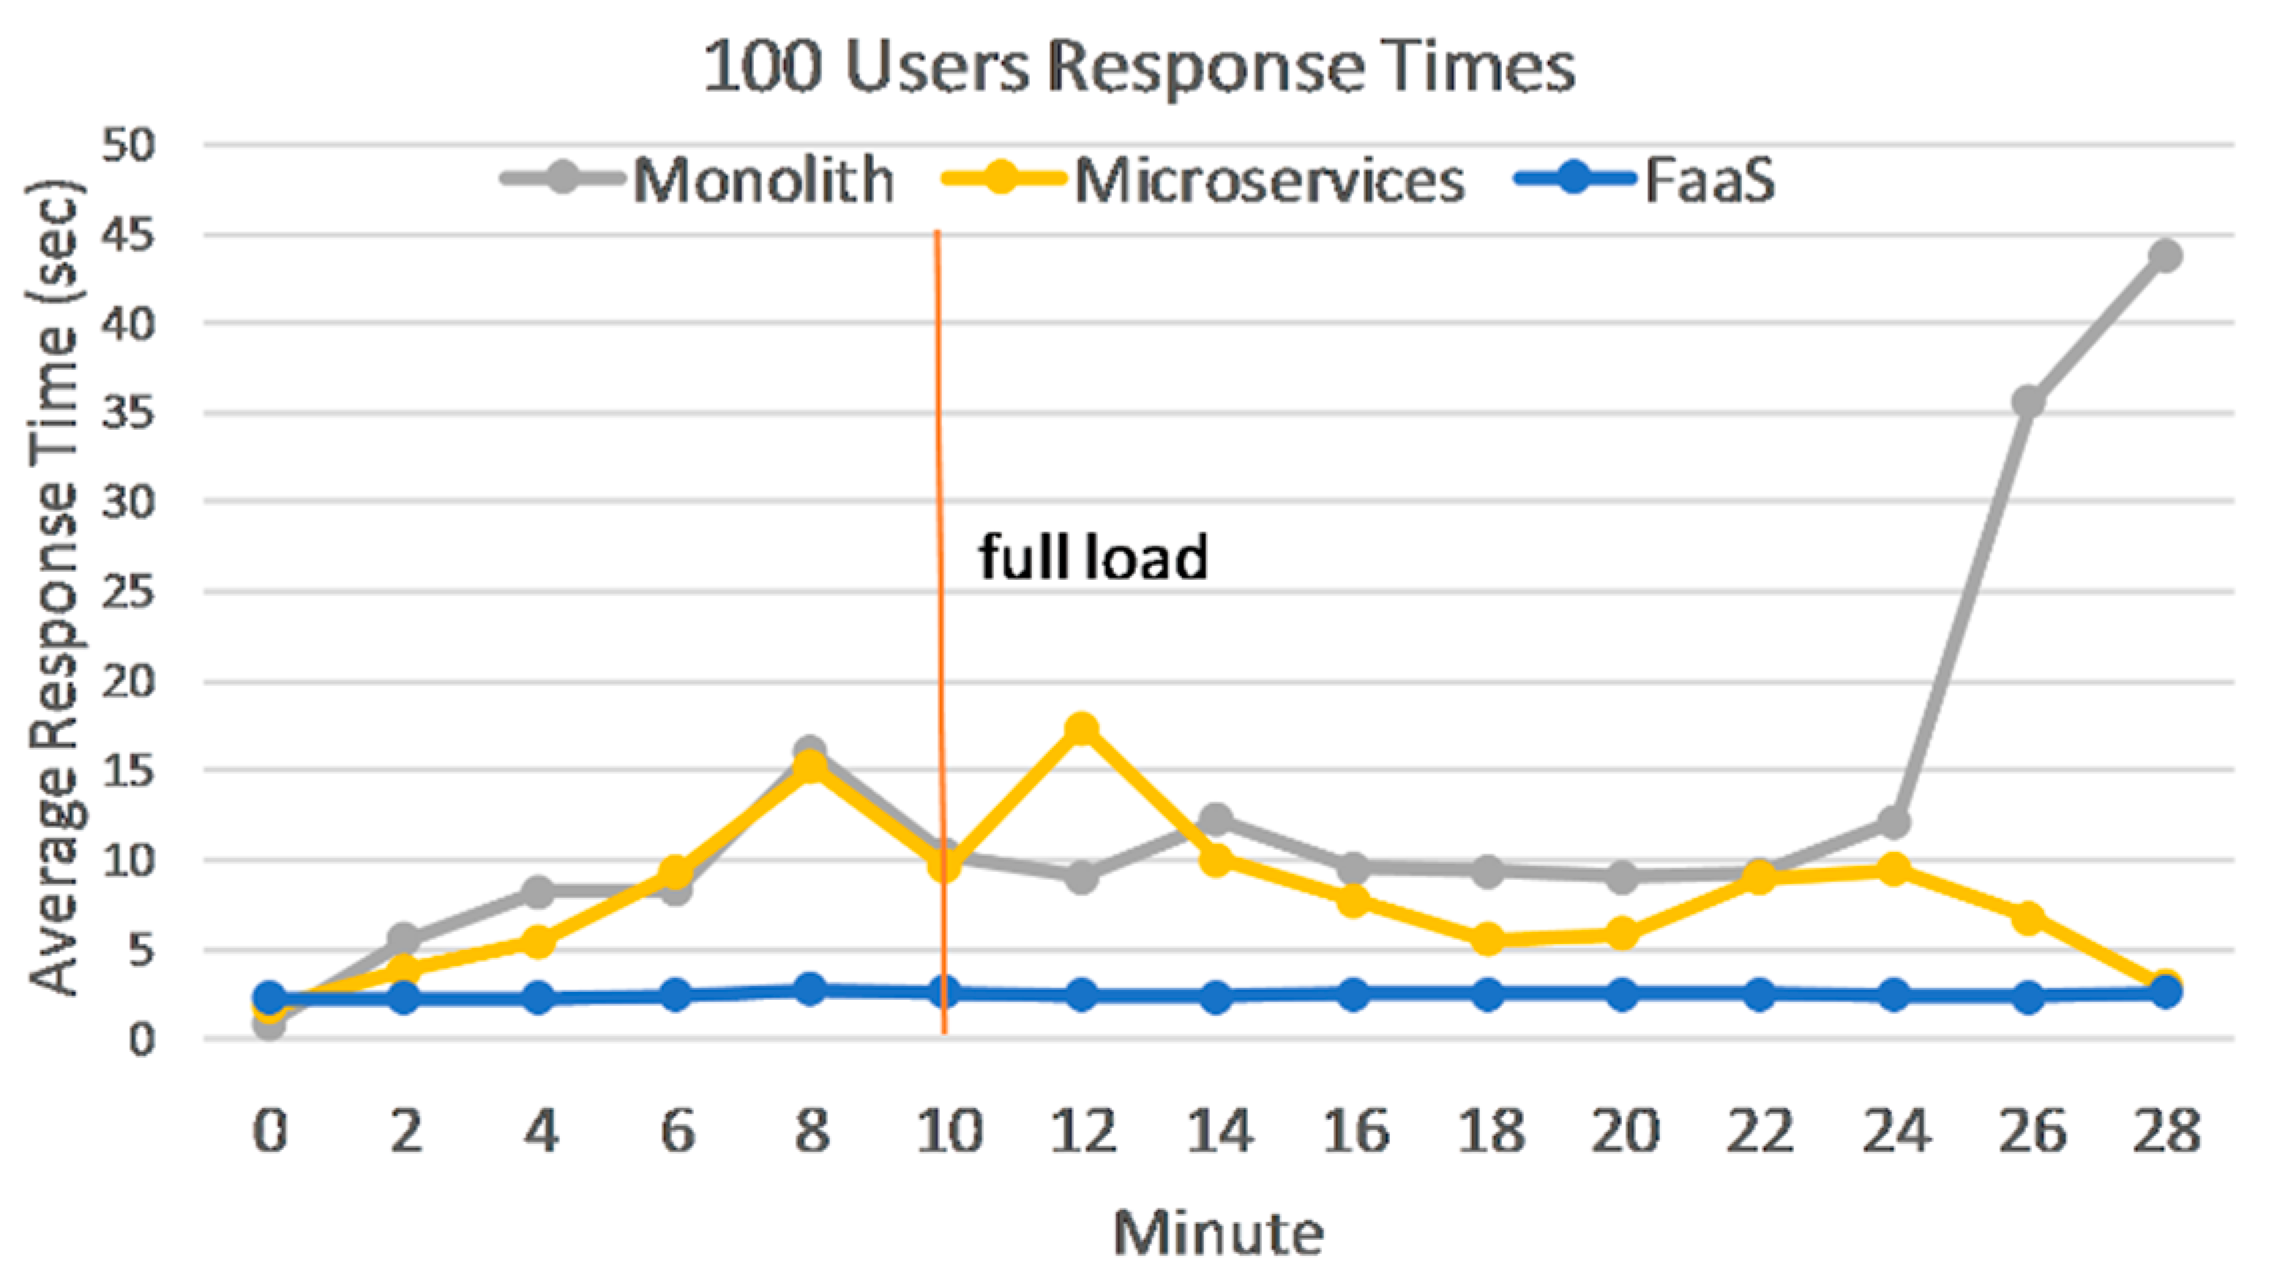
While Phase 1 to 4 show that response times stabilize after full load is reached for all applications, the next two phases bring VMs close to a breaking point, while response times keep growing. This was intended as we wanted to test the limits of our VM deployments before we start seeing errors. A closer look at response times in Phase 5,
Figure 4, shows that after full load is reached, Monolith continues to degrade while Microservices do not. Since a single VM handles all functionalities for the Monolith, once it reaches maximum capacity, all method calls will be affected the same way with increasing response times. Microservices are only partially affected, because not all VMs have reached their maximum capacity, hence the overall response times stabilize on average.
The next, 200-user phase, on the other hand, shows significant degradation on both applications hosted on VMs and a significant error rate on Microservices, close to 25%. FaaS response times stop growing after full load is reached and the overall impact is minimal.
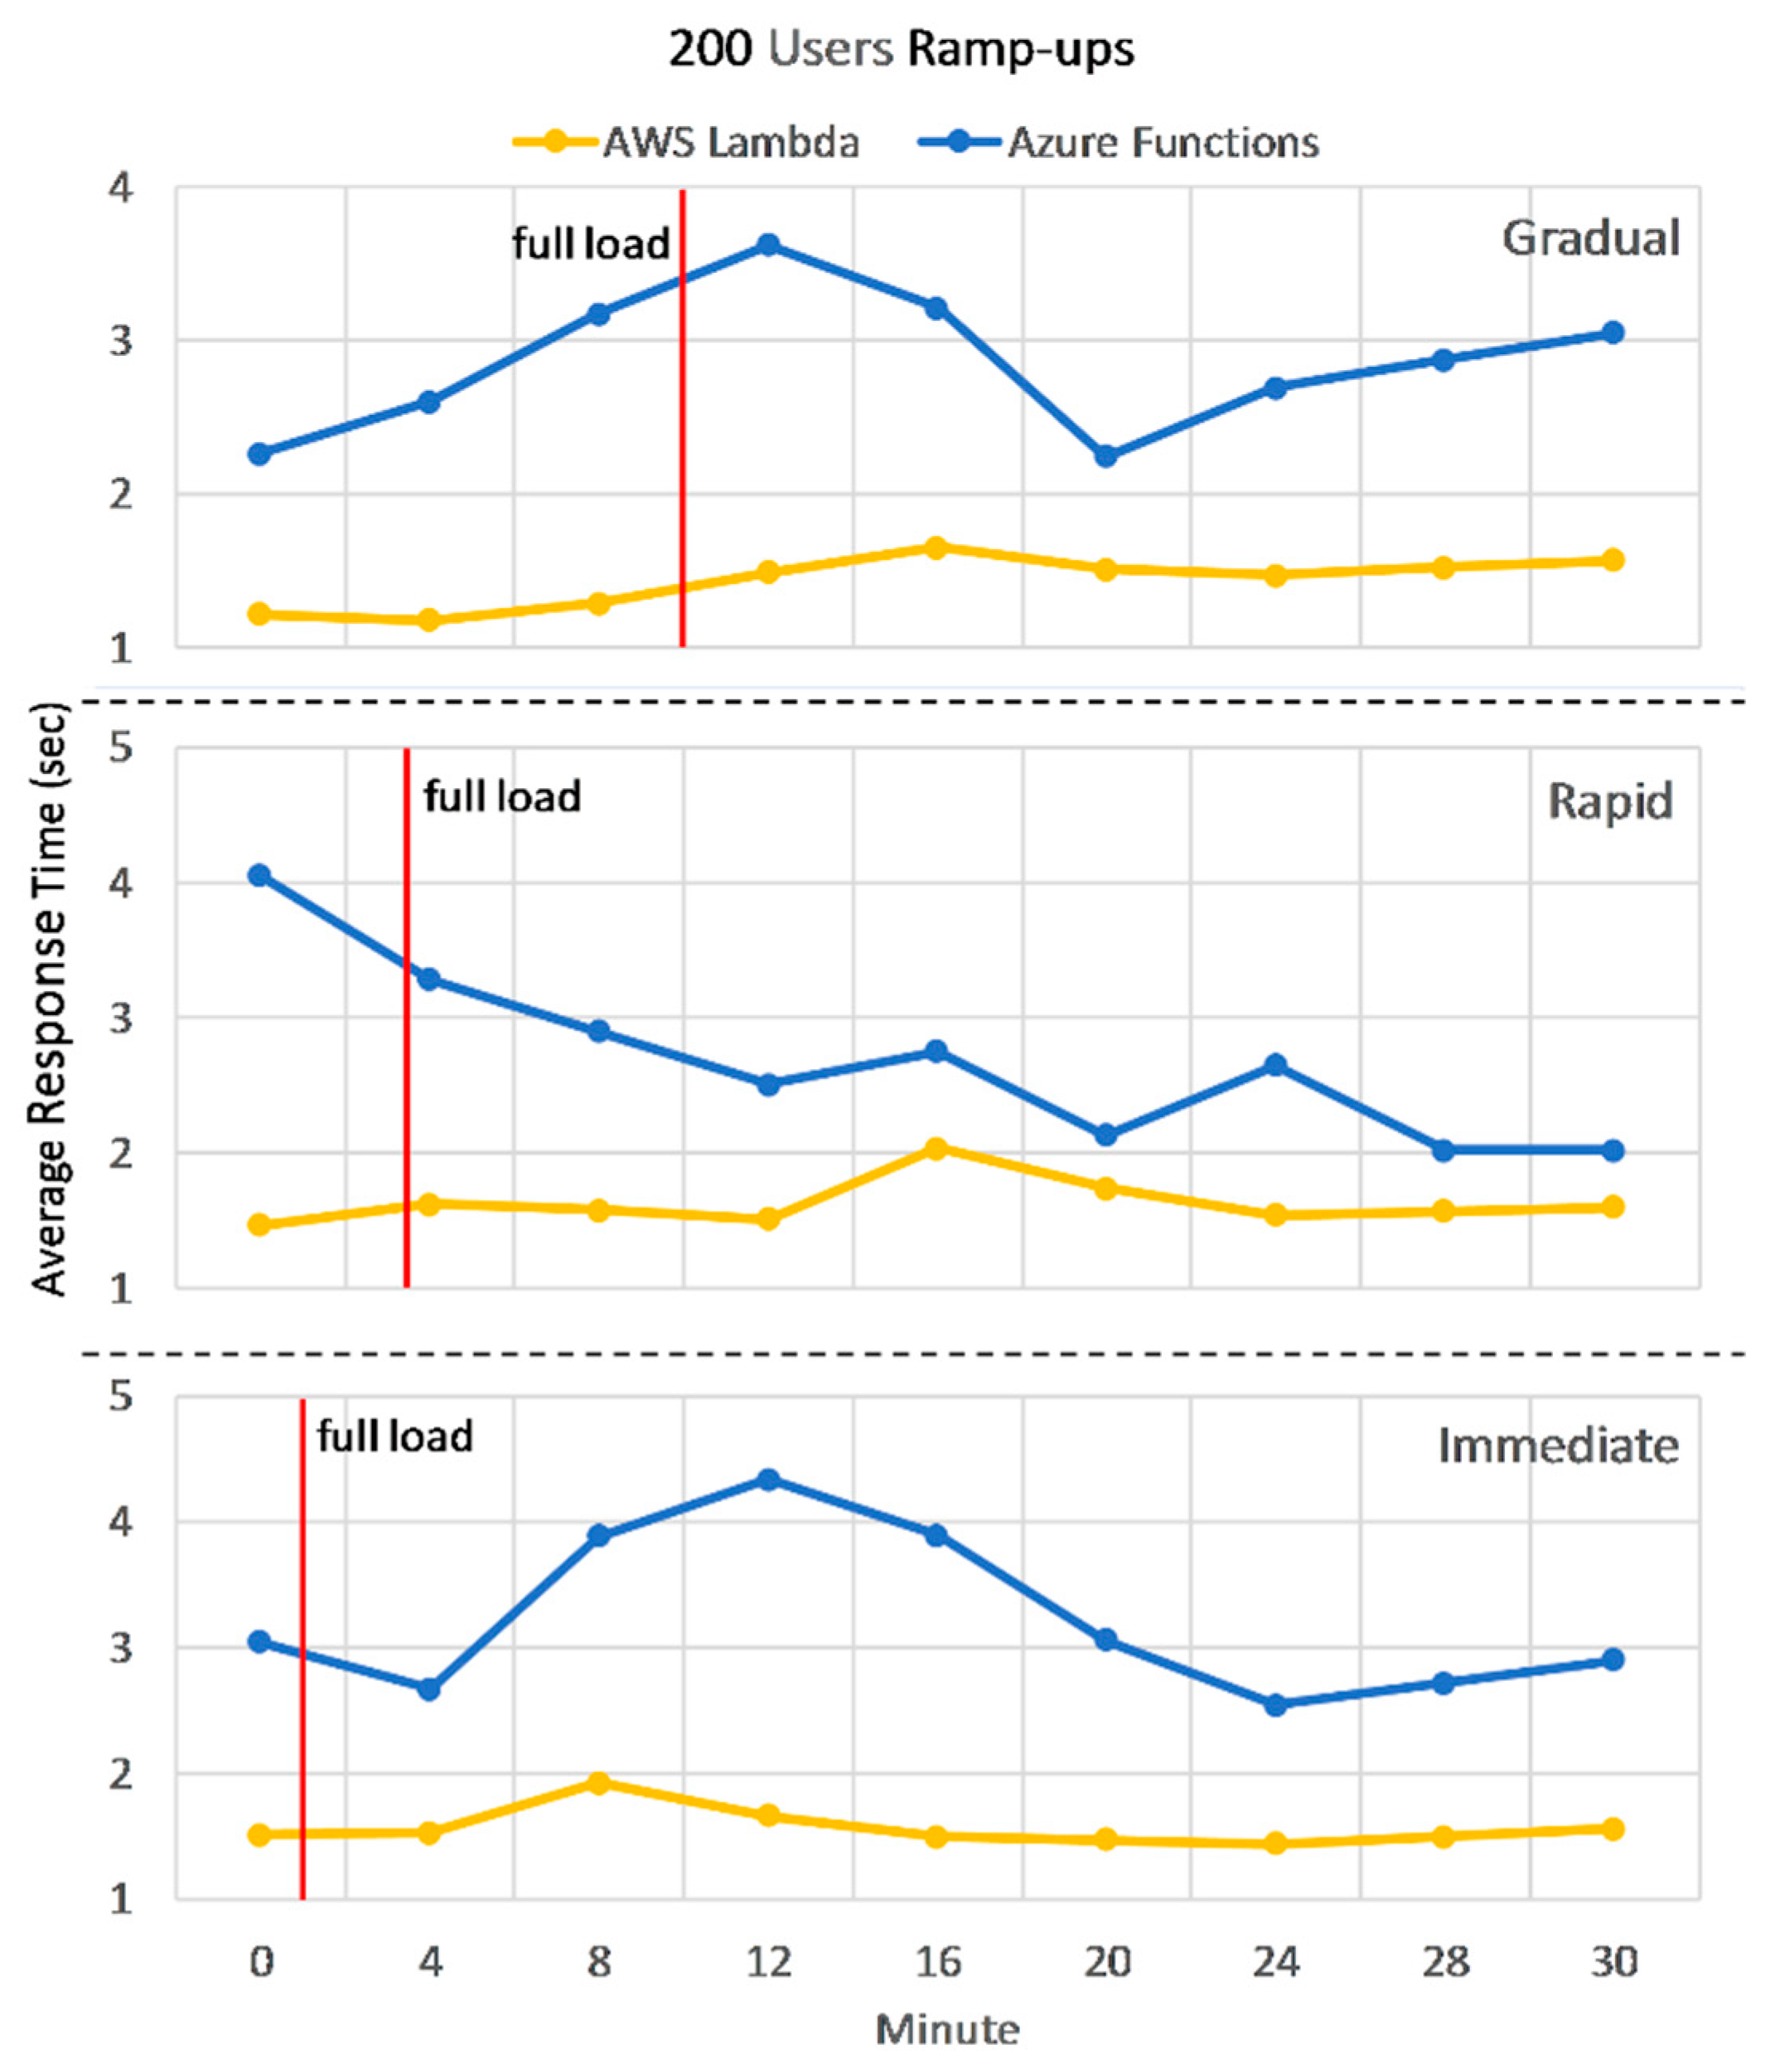
5.1.2. Unexpected User Growth
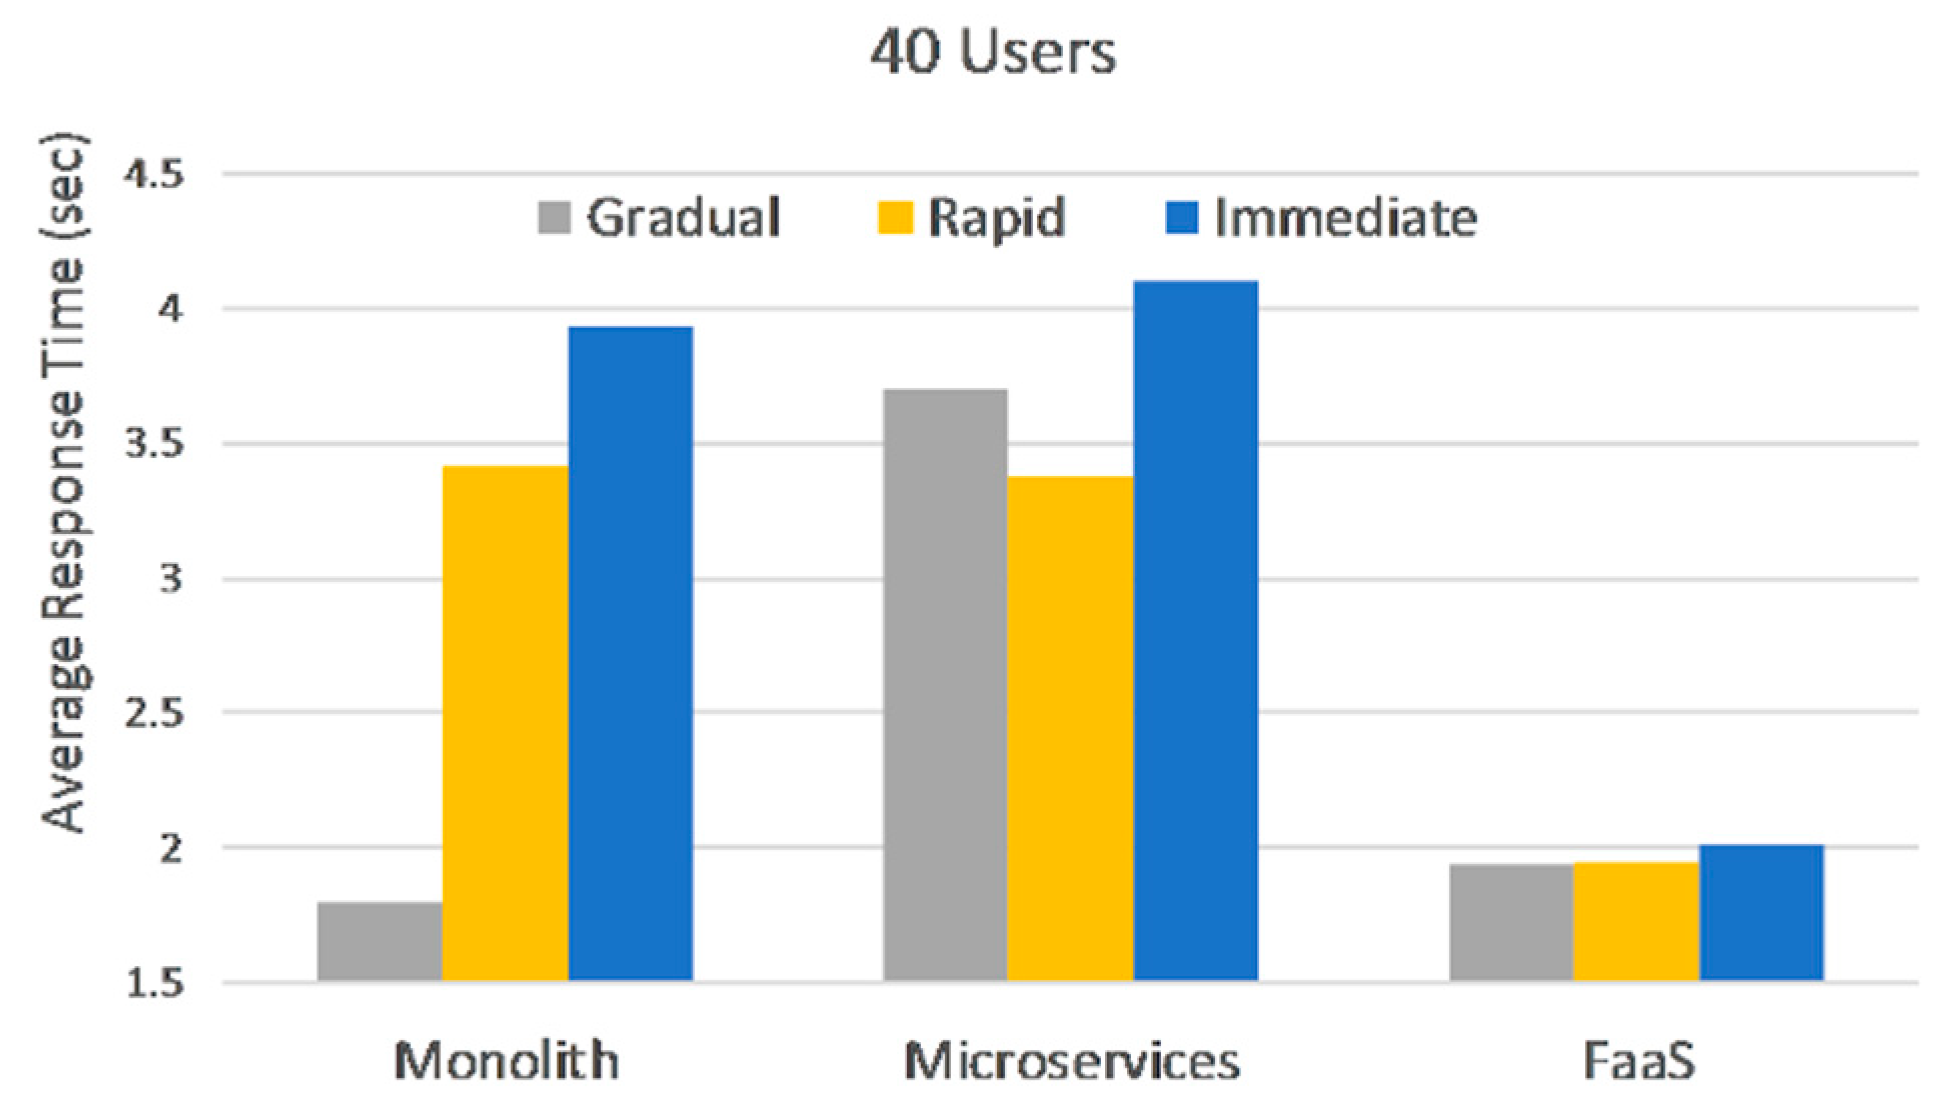
This category simulates load bursts for the 40, 100, and 200 user phases, with a rapid and an immediate ramp-up. Comparing the response times for the same load but different ramp-up in
Figure 5, shows that Microservices and FaaS are hardly affected by an unexpected burst of users in the 40-user phase. Microservices degrade 6% on average between ramp-ups, while FaaS degrade 1.7%. Again, this can be explained by the fact that load is distributed among multiple VMs and instances.
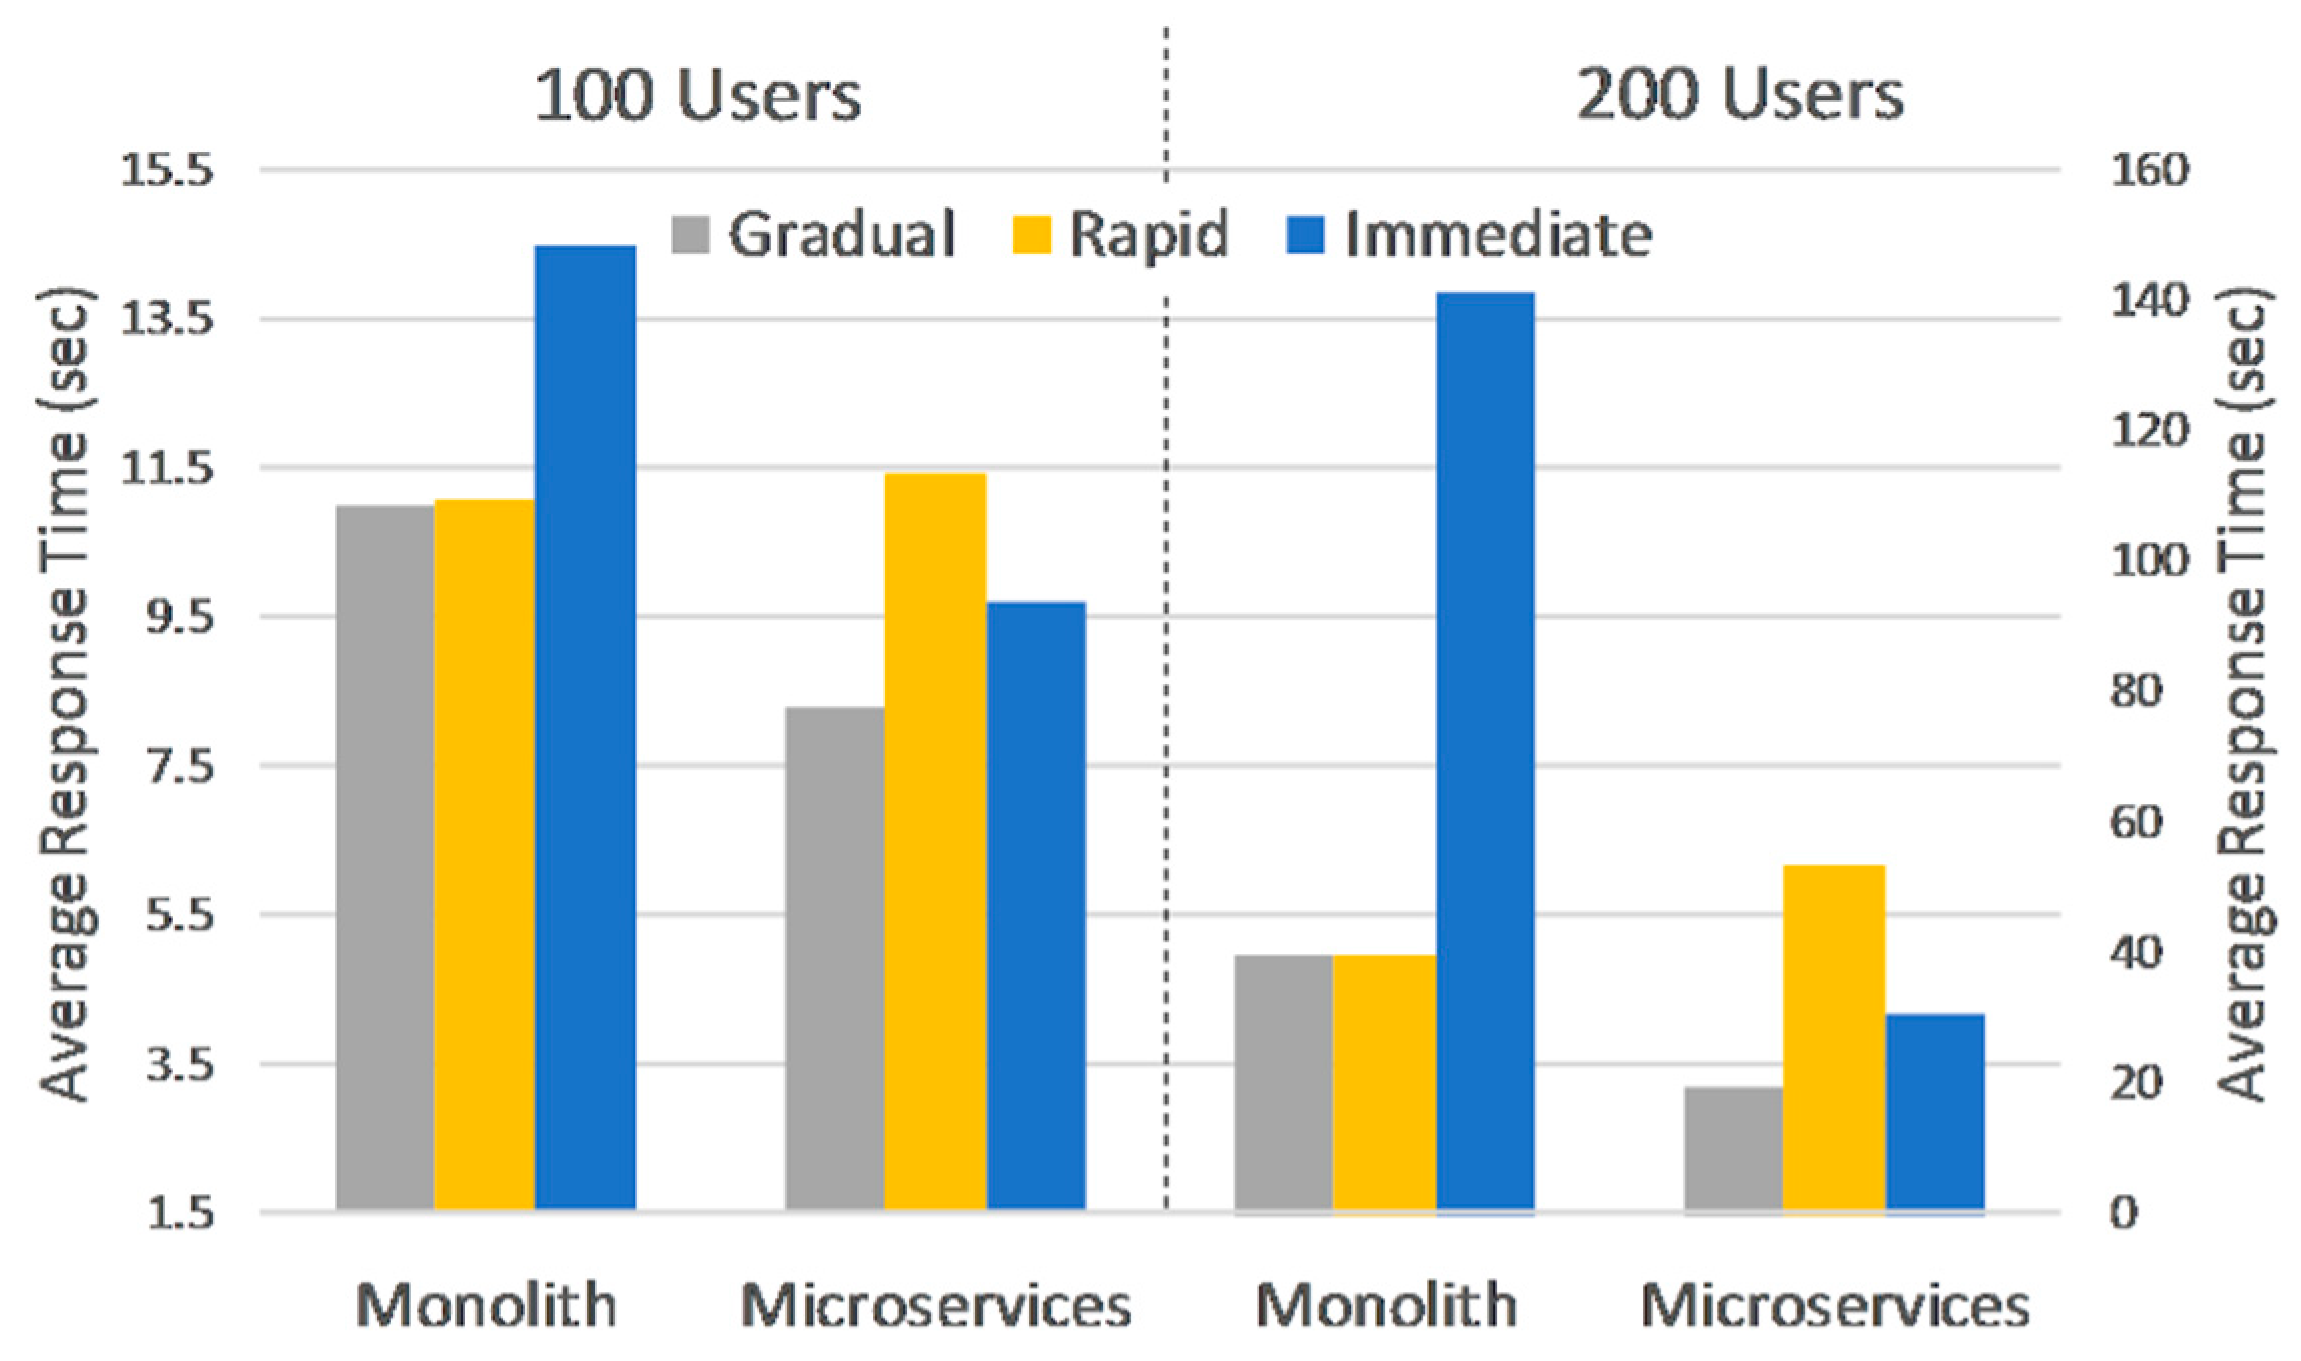
The higher 100 and 200 loads, greatly impact deployments hosted on VMs in terms of overall response times and degradation between ramp-ups. Monolith does not seem to be affected by a change from gradual to rapid ramp-up on the 100-user phase, however response times are already among the highest at this stage. Microservices response times are affected by a change in ramp-up, as seen in
Figure 6. What’s more, a very high error-rate, 25% on average for both 100 and 200 loads, is observed on microservices, explained by the fact that one VM reached full capacity and was unresponsive. The 200-user load puts VMs at 100% resource utilization, greatly affecting response times for Monolith or generating errors for Microservices.
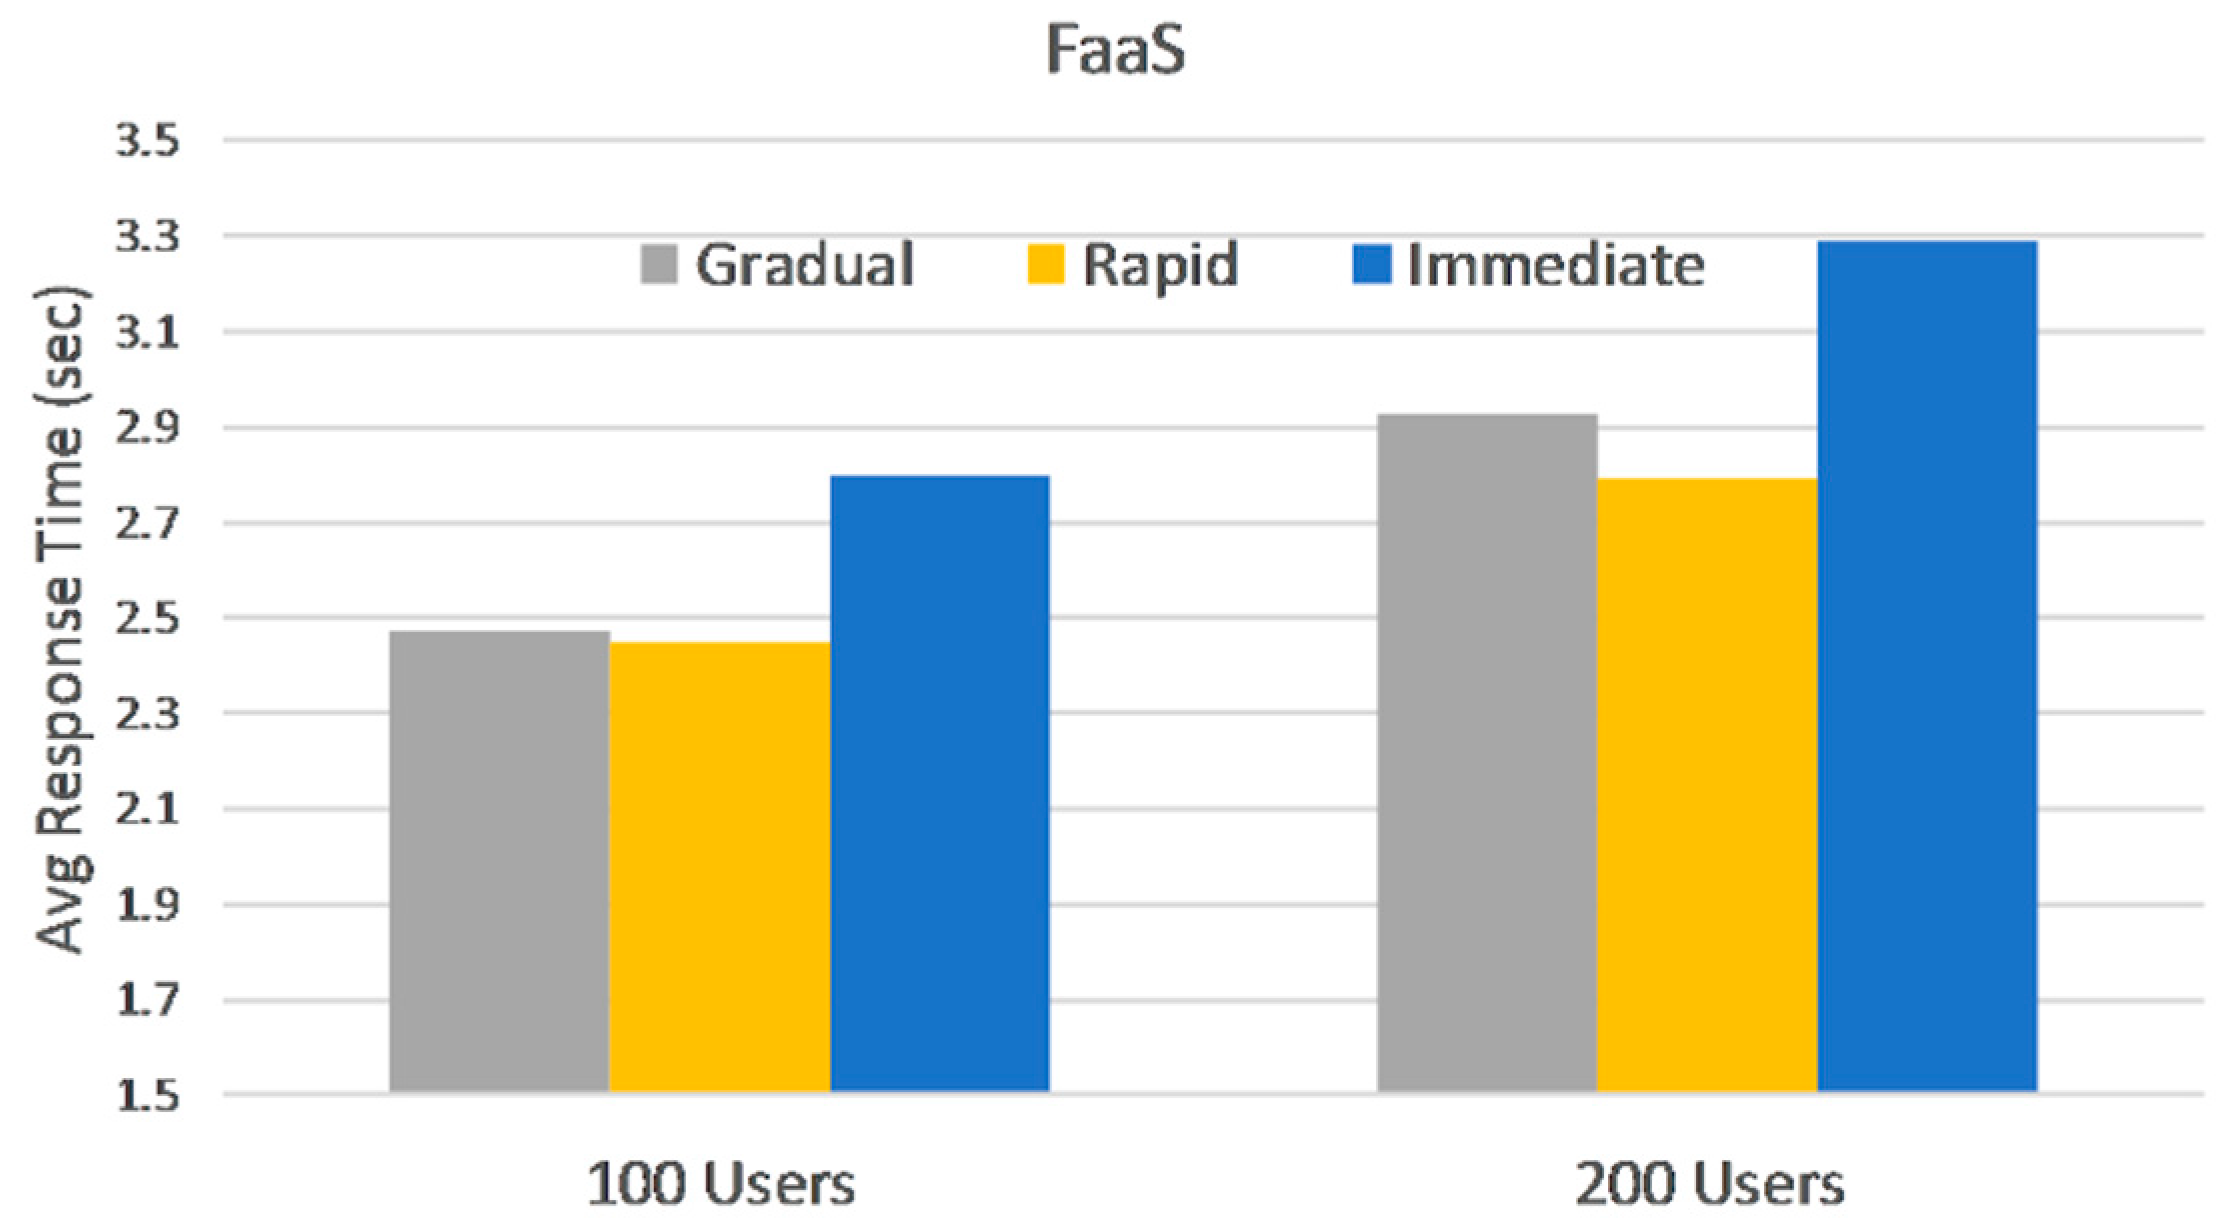
FaaS are affected by user spikes with a 5% degradation on average across all loads and ramp-ups in this section, response times ranging from 2 to 3.3 s, as depicted in
Figure 5 and
Figure 7.
5.1.3. Payload Increase
As described in
Section 4.1, some methods can put additional stress on the applications by changing the value of the input parameters, thus increasing the data size that is to be processed. The 40-user phase and gradual ramp-up were chosen to perform four additional test-runs with incremental payloads, up to three times the initial size. This phase and ramp-up were the least demanding in terms of resources, leaving enough room for additional stress to be added via increased payloads.
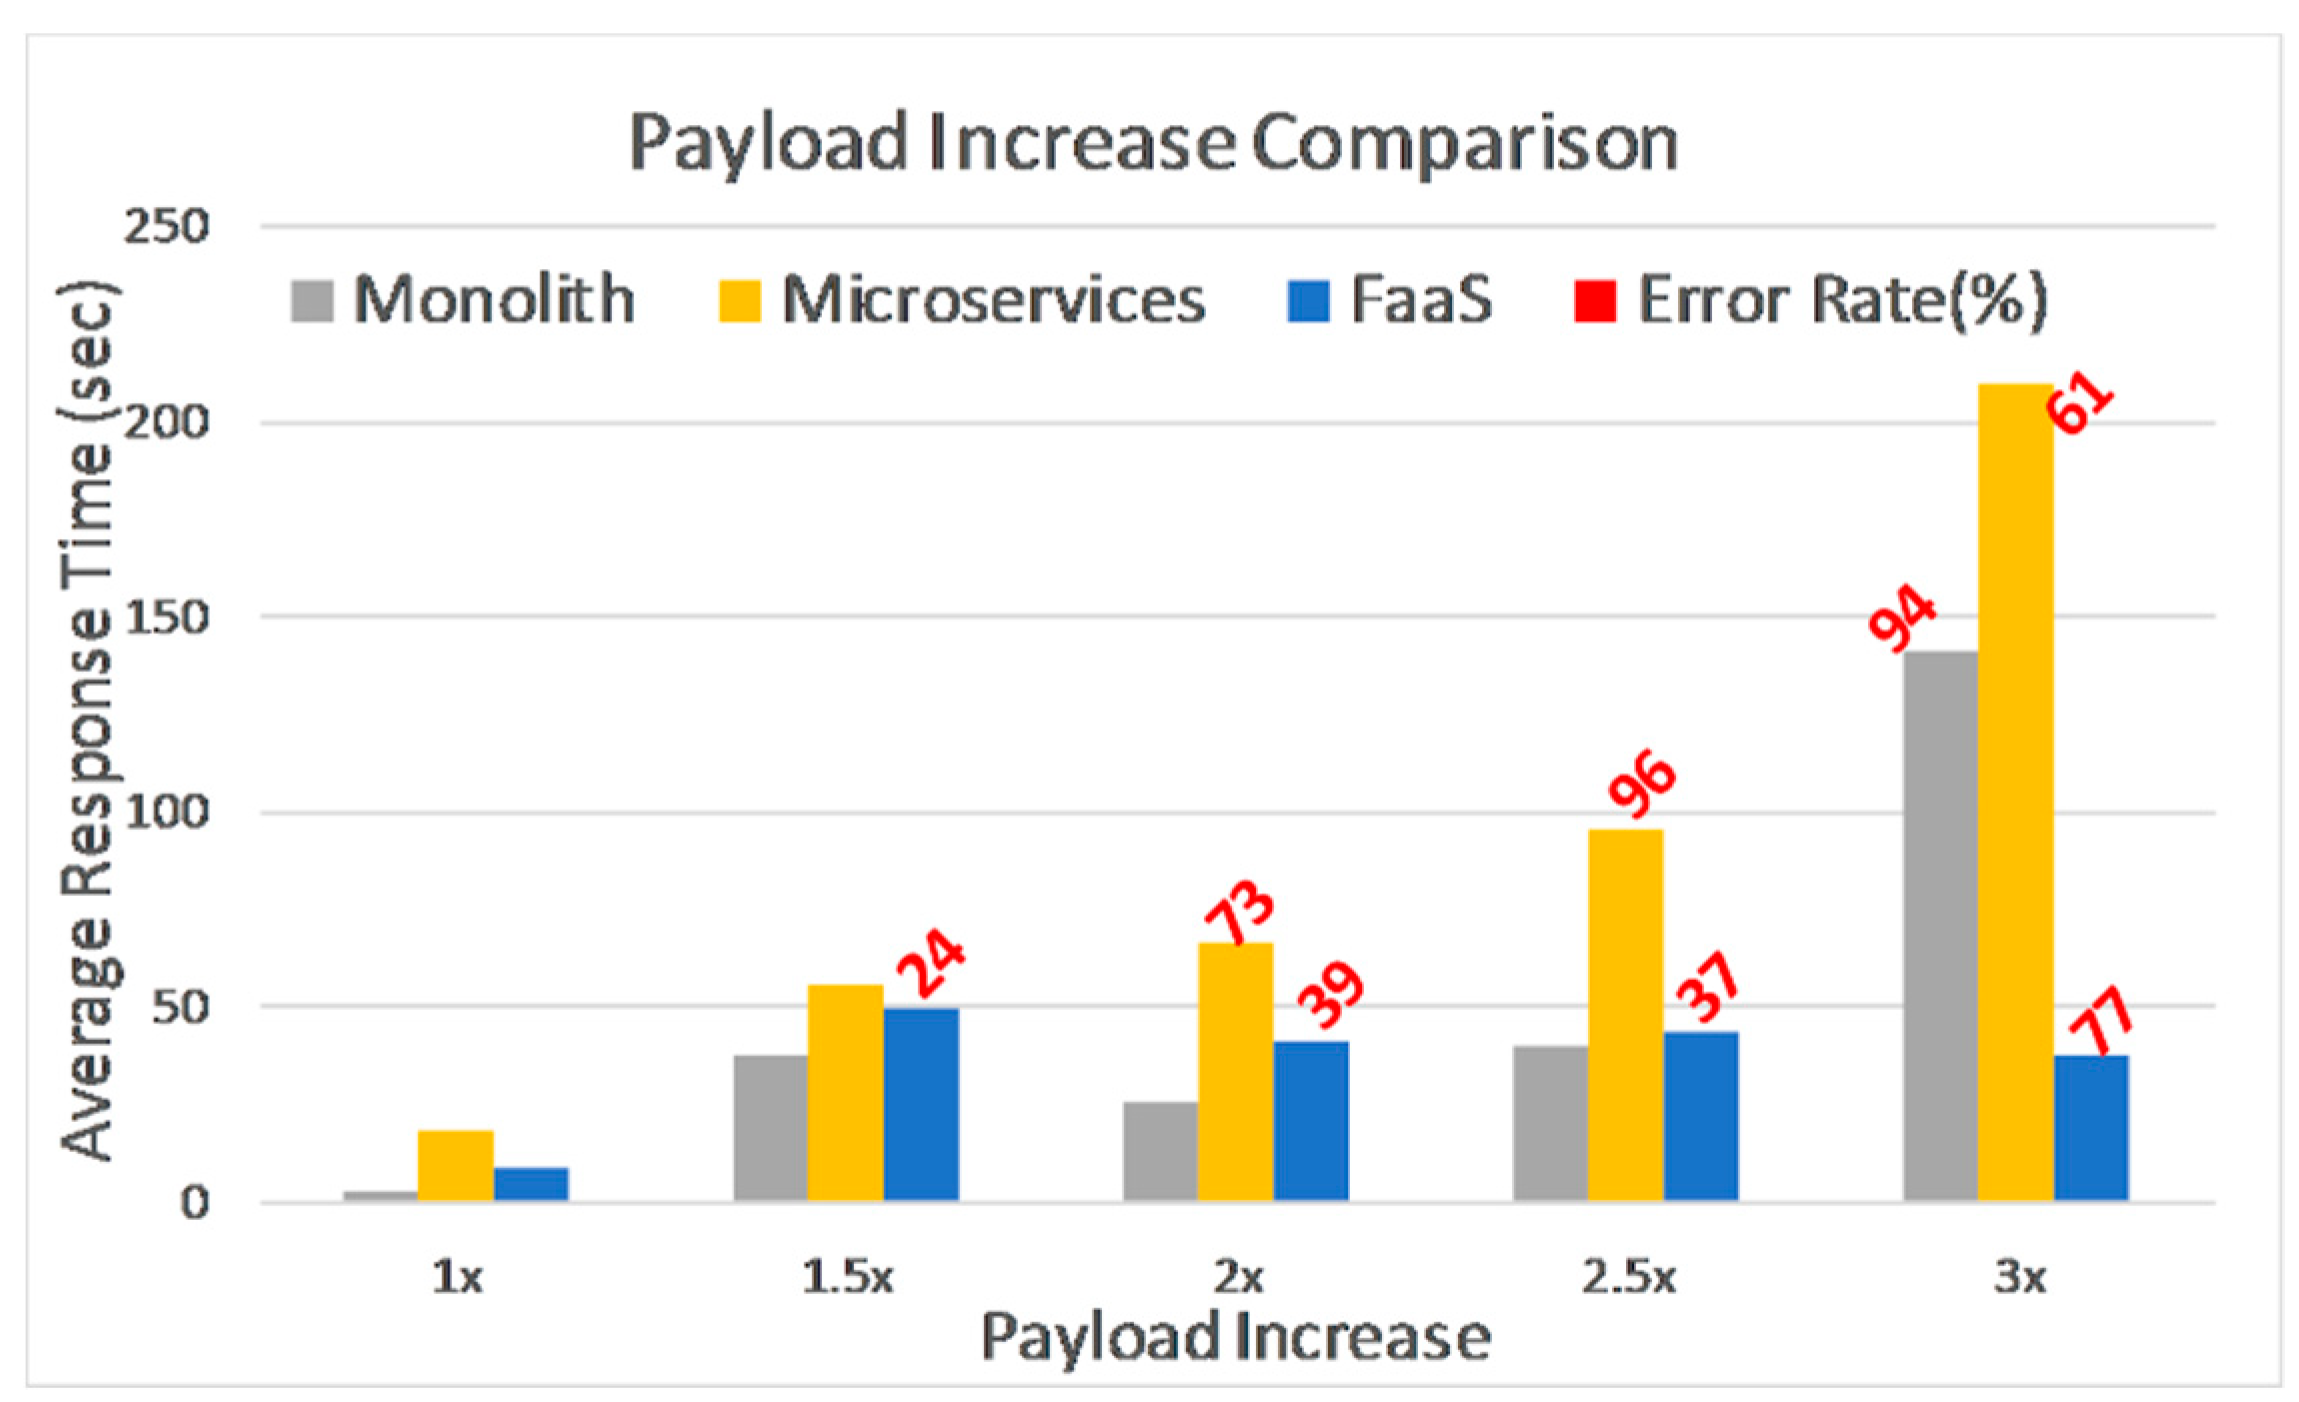
Only some of the implemented methods can influence the amount of hardware resources being used, so in
Figure 8 we take a closer look at response times for those methods alone. One can see that Monolith performs better, while Microservices are the worst, somewhat different than what we have observed so far. FaaS has similar results as Monolith, except for the highest payload, however errors are present for all the additional test-runs, 1.5× to 3×, ranging from 24% to 77%. Microservices have a high error rate as well, starting from when the original payload was doubled. Monolith reaches its breaking point when payload is three times greater than original.
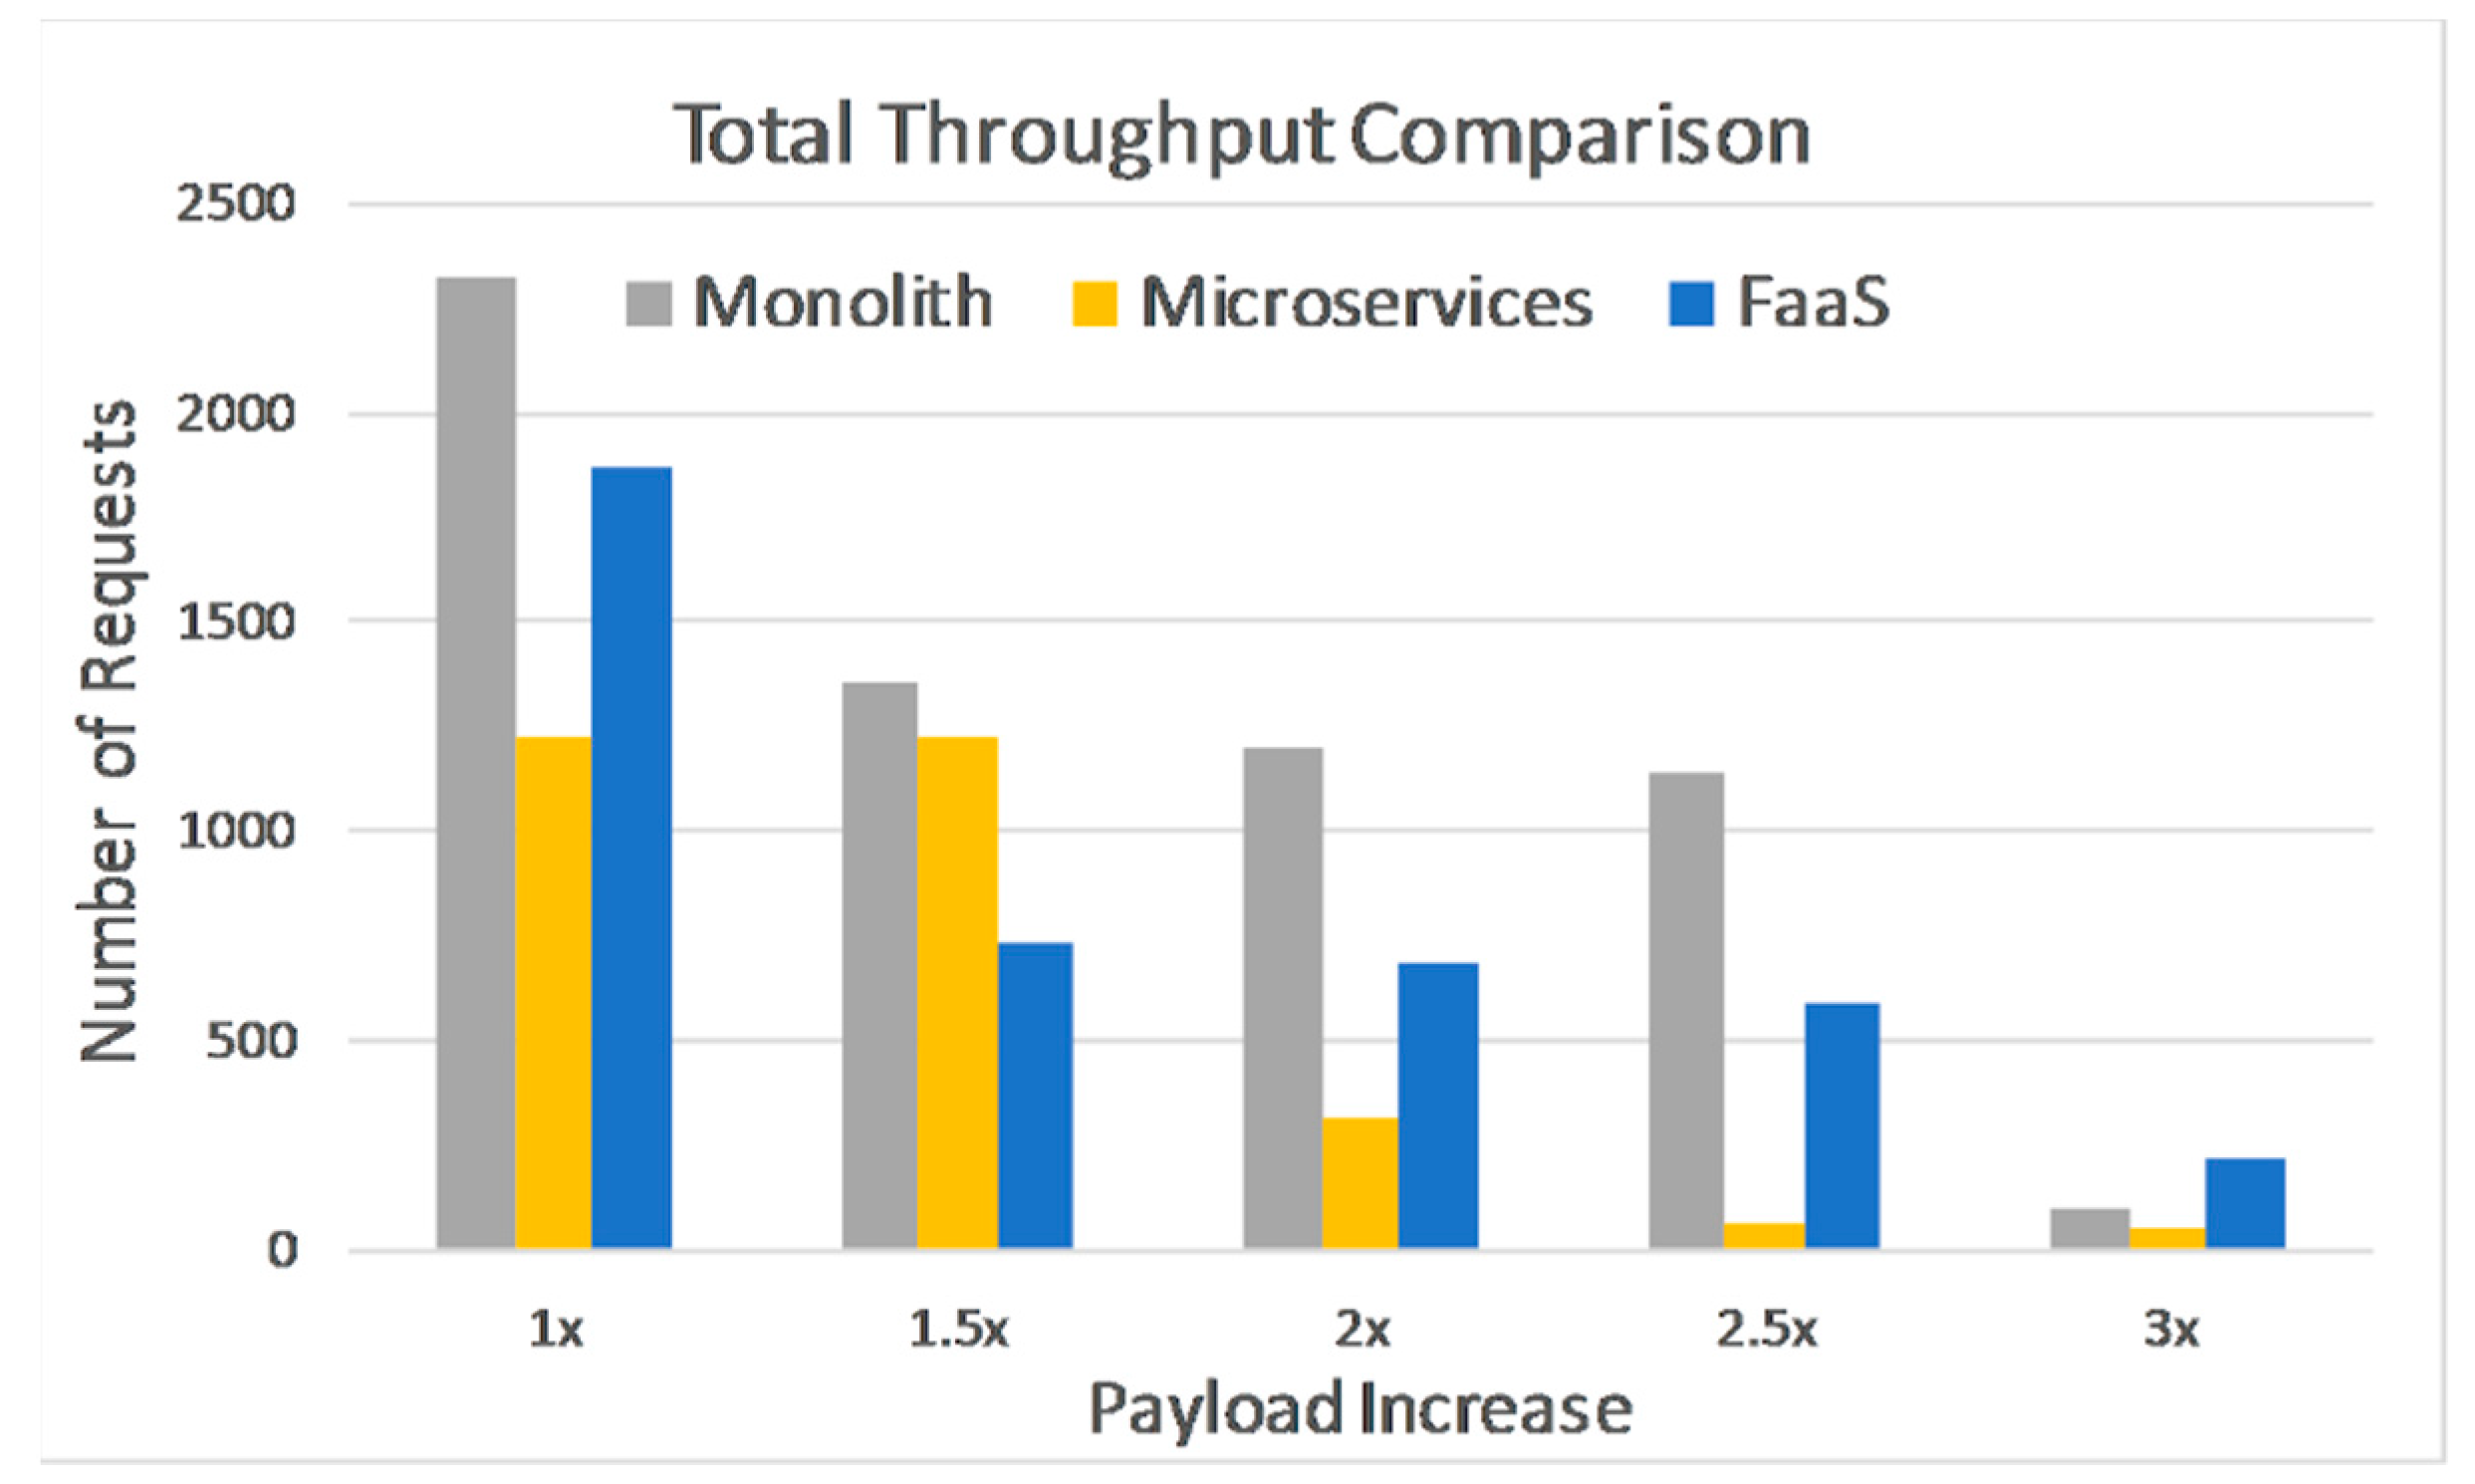
Looking at the total number of requests that were processed in
Figure 9, for the same results as before, we see a similar pattern, namely Monolith is the better performer among the three. Additionally, if we look at FaaS versus Monolith in
Figure 8 and
Figure 9, we notice that although both have similar response times, Monolith can process more requests than FaaS when payload increases, specifically 74% to 93% more, for the 1.5× to 2.5× payloads.
The differences in response times seen in this section are influenced by the amount of memory and CPU available for each request. Since Monolith is deployed on the more powerful VM, its resources are better shared among functionalities. Every request, theoretically, can utilize the whole amount of CPU or memory available at a given time. Microservices, although deployed on VMs, seem to be under provisioned for the workload within these test-runs, specifically after payload is doubled, metrics start to deteriorate. FaaS is, by design, isolated and limited to fixed hardware resources, so it has no way of ‘borrowing’ computing power from other unutilized functionalities or functions.
5.2. Scaling
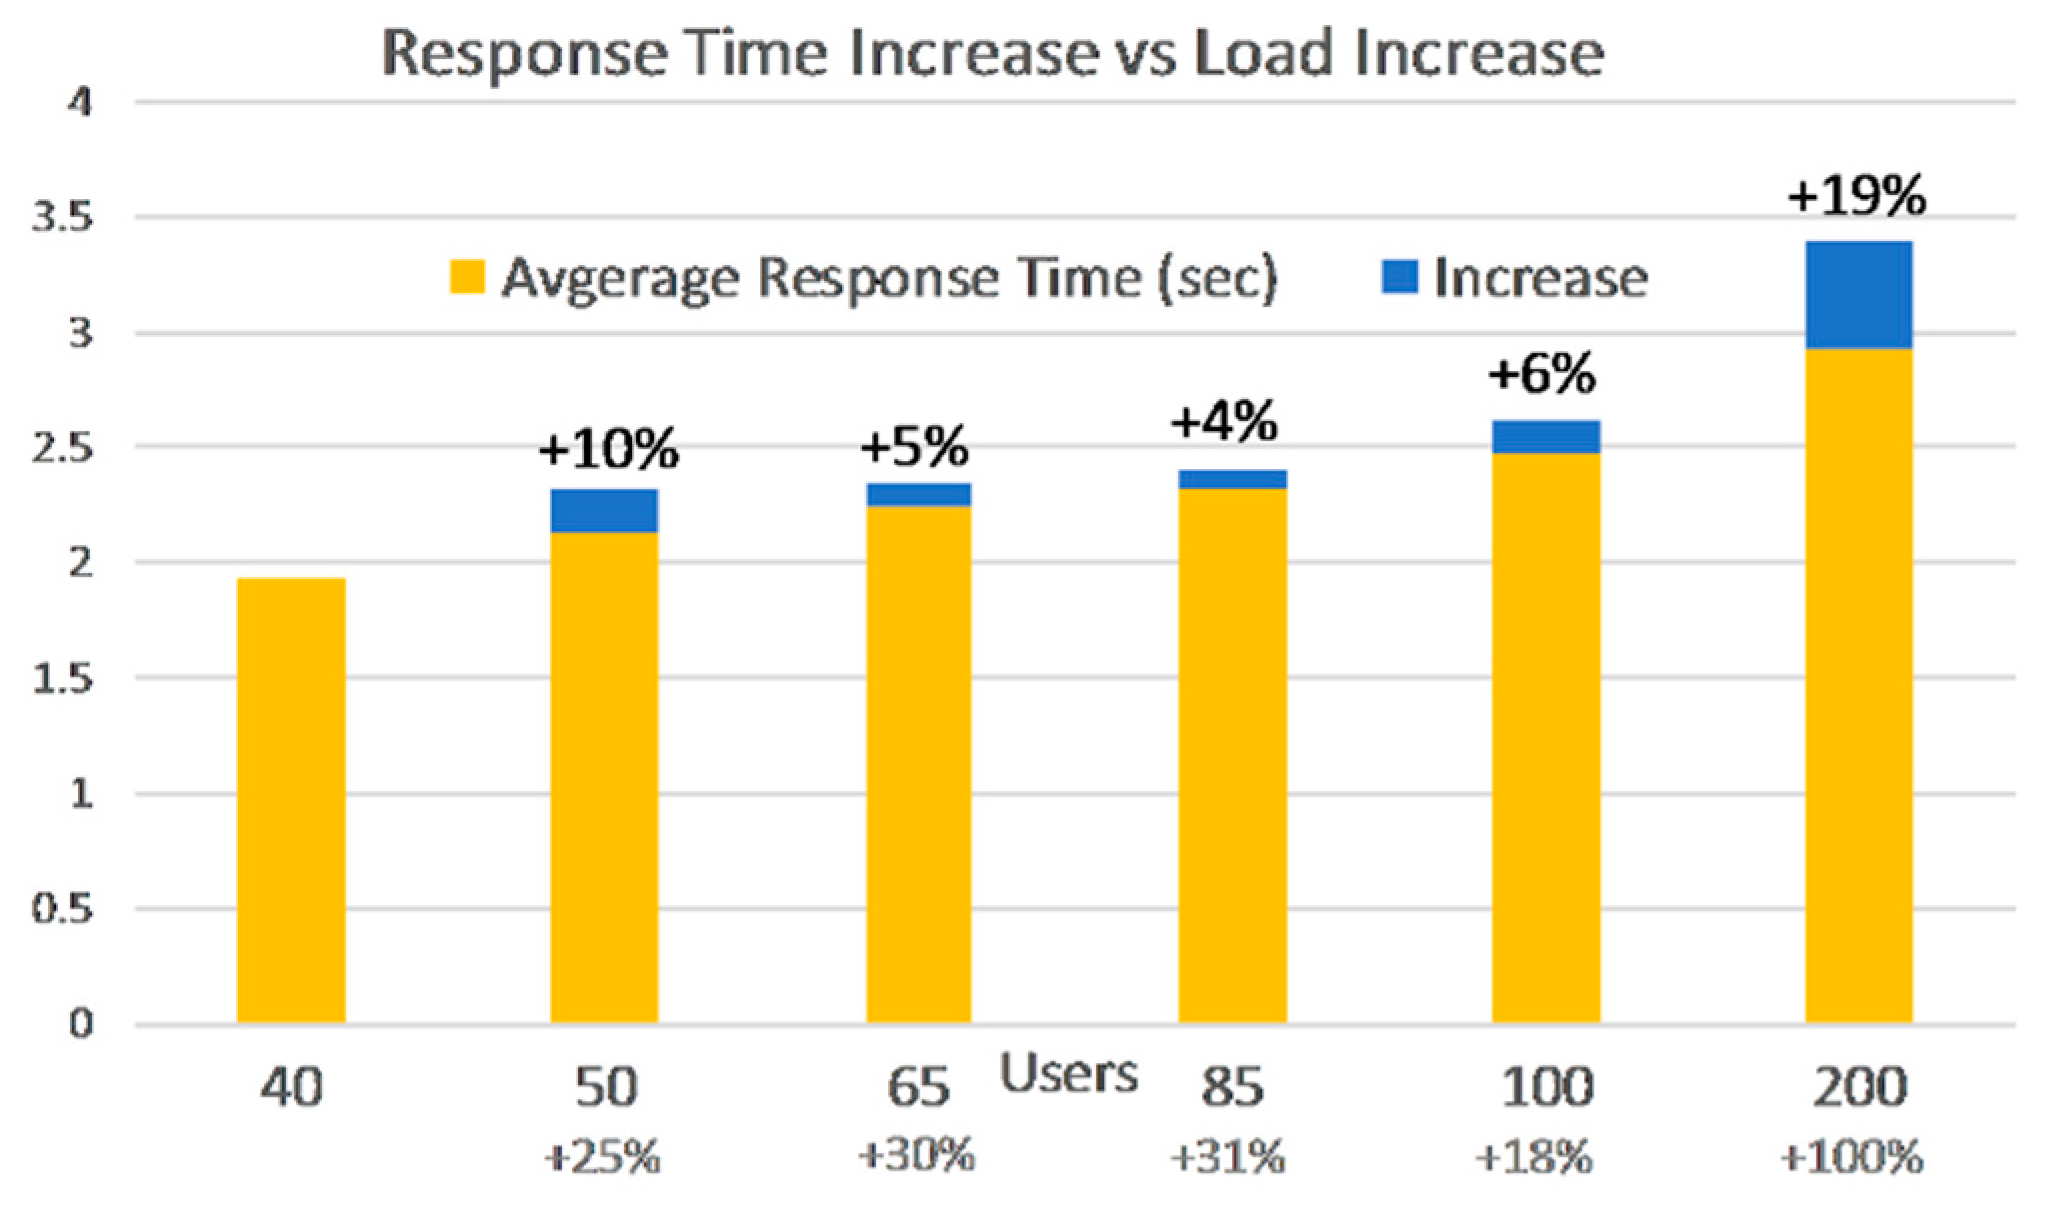
So far, we have seen that FaaS handles load and bursts quite well due to its auto scaling capabilities. In
Figure 10, one can clearly see that higher loads have a small impact on the average response times with a gradual ramp-up. As load increases from one phase to another, response times increase at a much smaller rate.
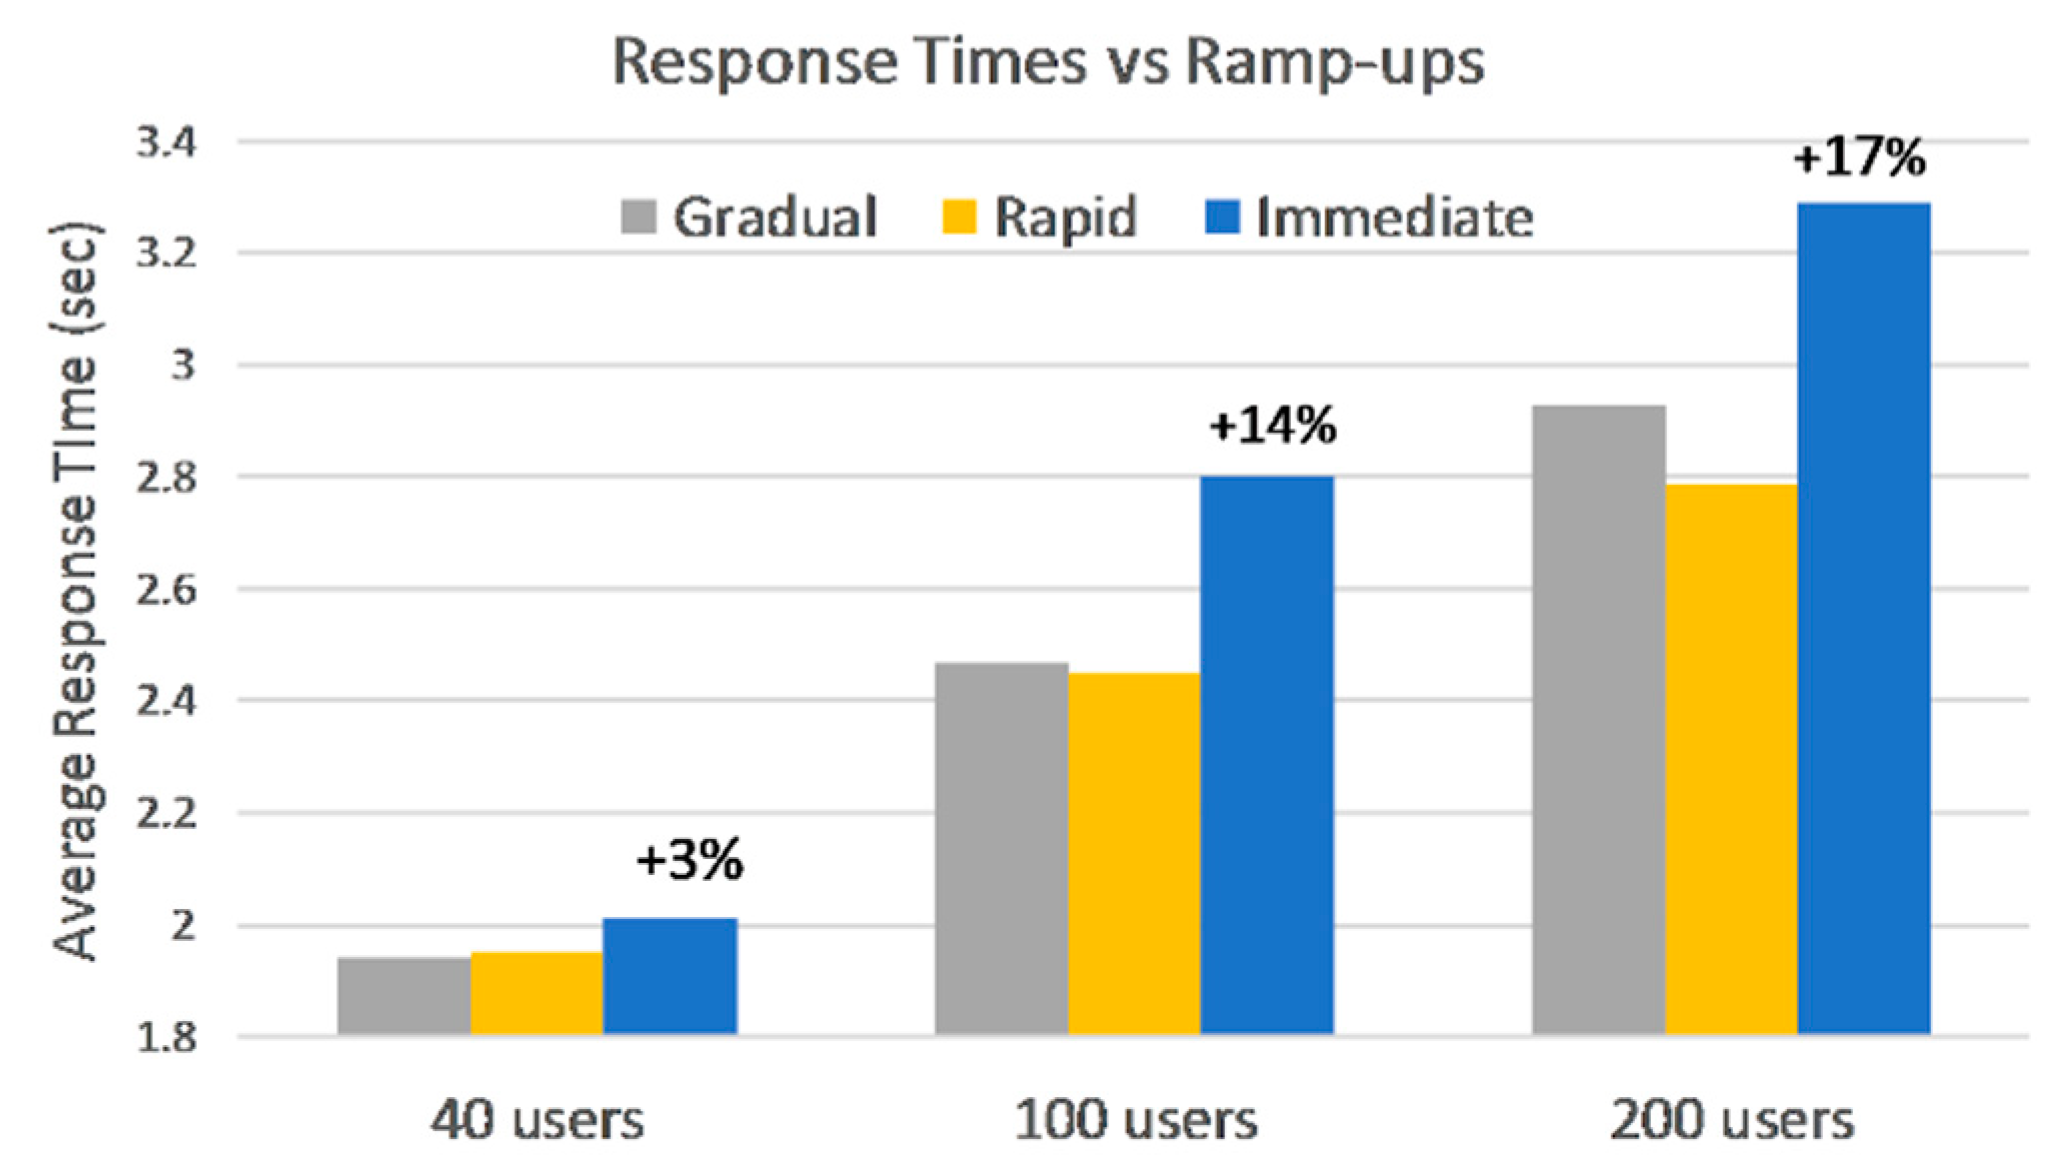
Figure 11 shows that variations in ramp-up have little effect on the average response times between gradual and rapid ramp-up. In the 100 and 200-user loads, the response times for rapid ramp-up decrease. This can be attributed to the auto-scaling behavior, which overprovisions the whole system in order to meet a sudden demand. The immediate ramp-up on the two higher loads affects response times with more than 10 percent increase compared to rapid ramp-up.
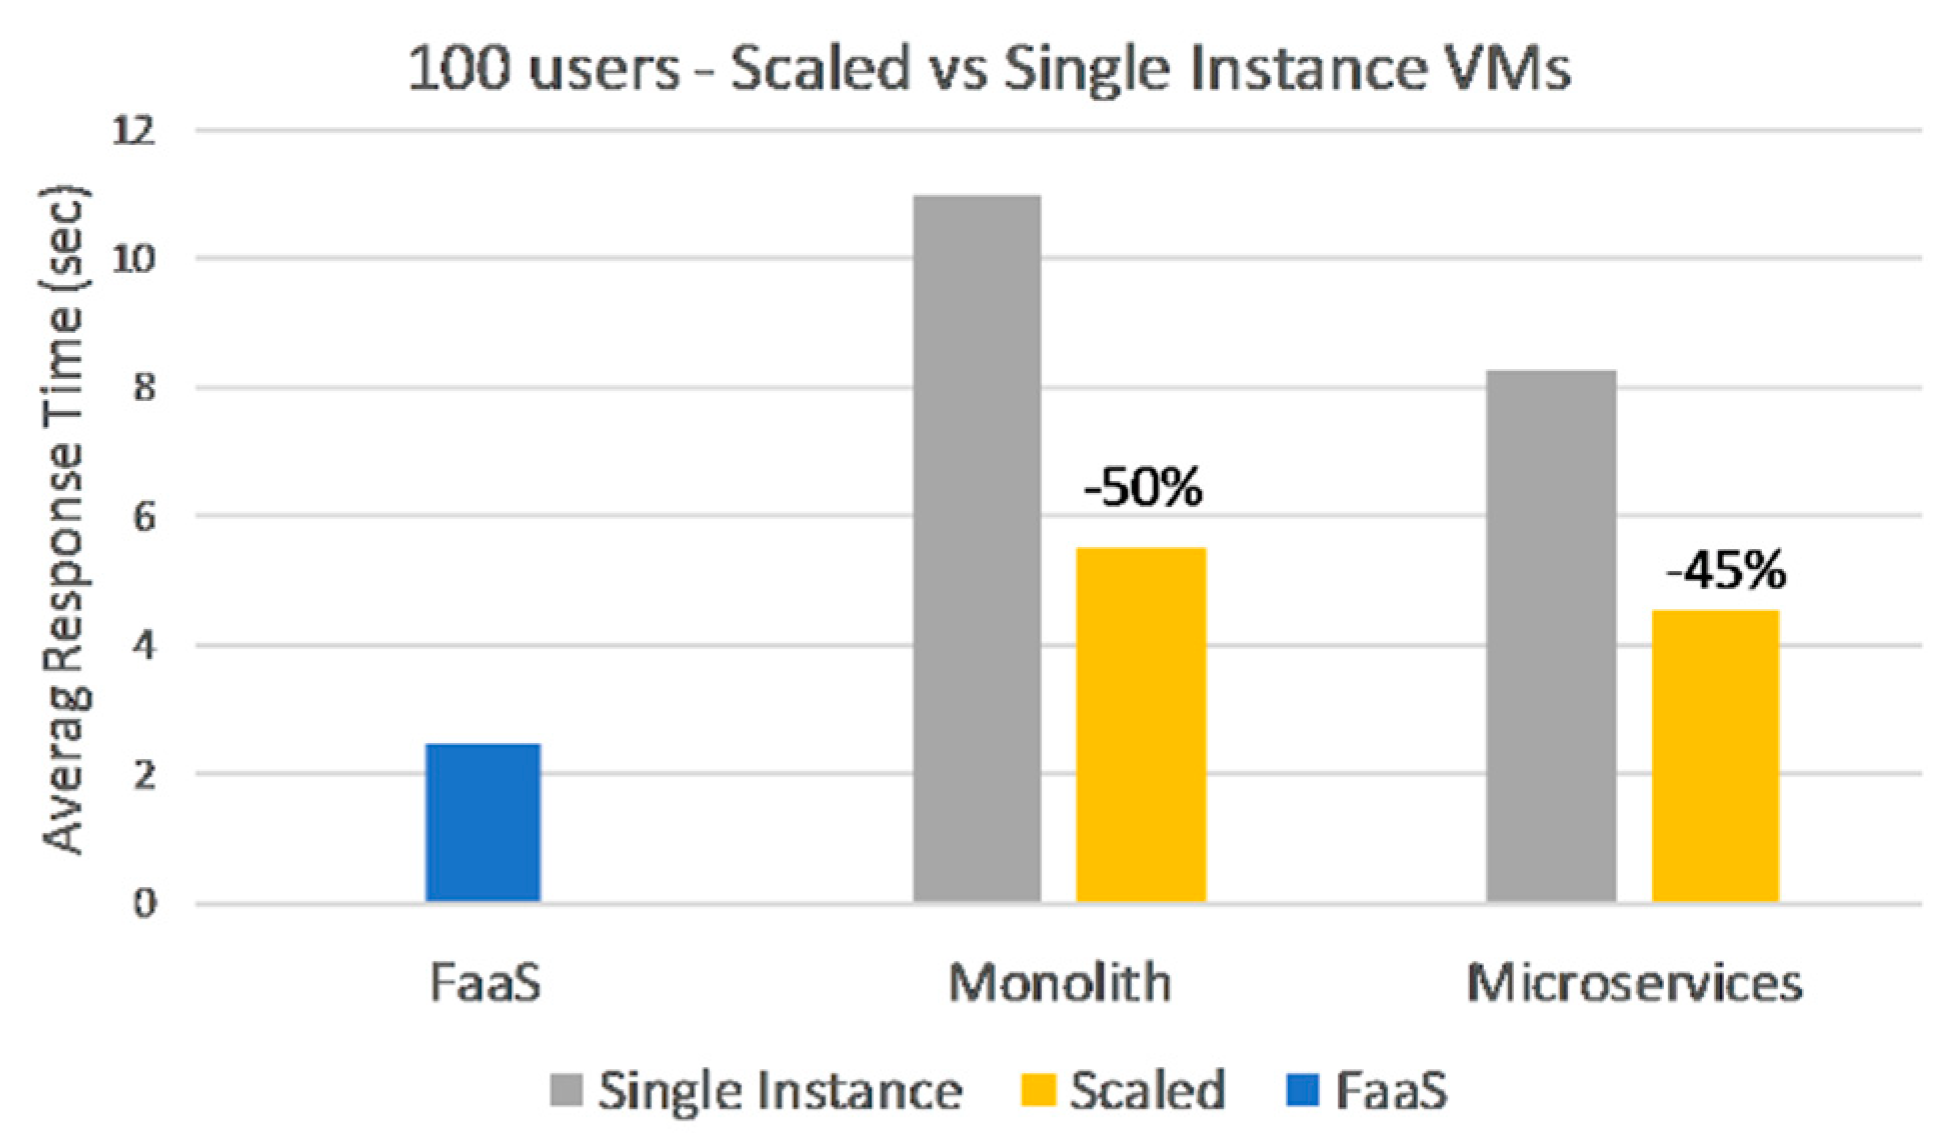
Monolith and Microservices were able to handle smaller and unexpected loads with their provisioning state but could not keep up with the increasing load. However, one cannot really talk about elasticity for the two deployments because their underlying infrastructure was intentionally kept at a single instance per application or service. Dynamic scaling needs to be manually set-up for VMs, and it would need a lot of fine-tuning in order to match the auto-scaling features of FaaS. Trying to match these capabilities using traditional cloud infrastructure would be outside the scope of our investigation. However, in a real-world scenario, a monolithic or microservices architecture should be correctly configured and deployed, with respect to load and traffic. For this reason, we have created additional deployments for the Monolith and Microservices with VMs scaled horizontally. Two or three instances per virtual machine were added, established based on observations from previous phases.
We ran the 100-user phase with a gradual ramp-up against the scaled applications and the results in
Figure 12 show significant improvements, close to 50 percent, over their single instance counterparts.
Figure 3 also illustrated that a 40 or 50-user load gives comparable results between deployments, when VMs are correctly provisioned for the expected load. It is safe to assume that further scaling out the Monolith or Microservices would match the response times of FaaS, even on higher loads.
Section 5.1 and
Section 5.2, were meant to answer Research Question 1 and so far, we have found that predictable user loads can be handled by both VM and FaaS deployments, with comparable response times when properly configured. Unexpected user growth is easily handled by FaaS due to its native auto-scaling capabilities, whereas virtual machines struggle if not properly scaled. Microservices tend to handle load better than Monolith, as load is spread across multiple endpoints.
5.3. AWS Lambda versus Azure Functions Comparison
In this section we look at response times from Amazon and Microsoft function-as-a-service deployments, for all ramp-ups in order to answer to Research Question 3.
5.3.1. With Dependencies
The first phase we compared, AWS Lambda with Azure Functions, was the 200-user phase, with all dependencies in place. Both applications communicated with their own database and cloud storage, within corresponding cloud environments.
The results in
Figure 13 show that AWS Lambda performs better, averaging half the response times of Azure Functions, except for rapid ramp-up, where AWS Lambda is only 32% better on average. Both applications seem to have growth spikes in response times after full load is reached, followed by a stabilization period. Azure Functions seem to catch up towards the end of the test runs, while AWS Lambda has a more linear response across all three ramp-ups.
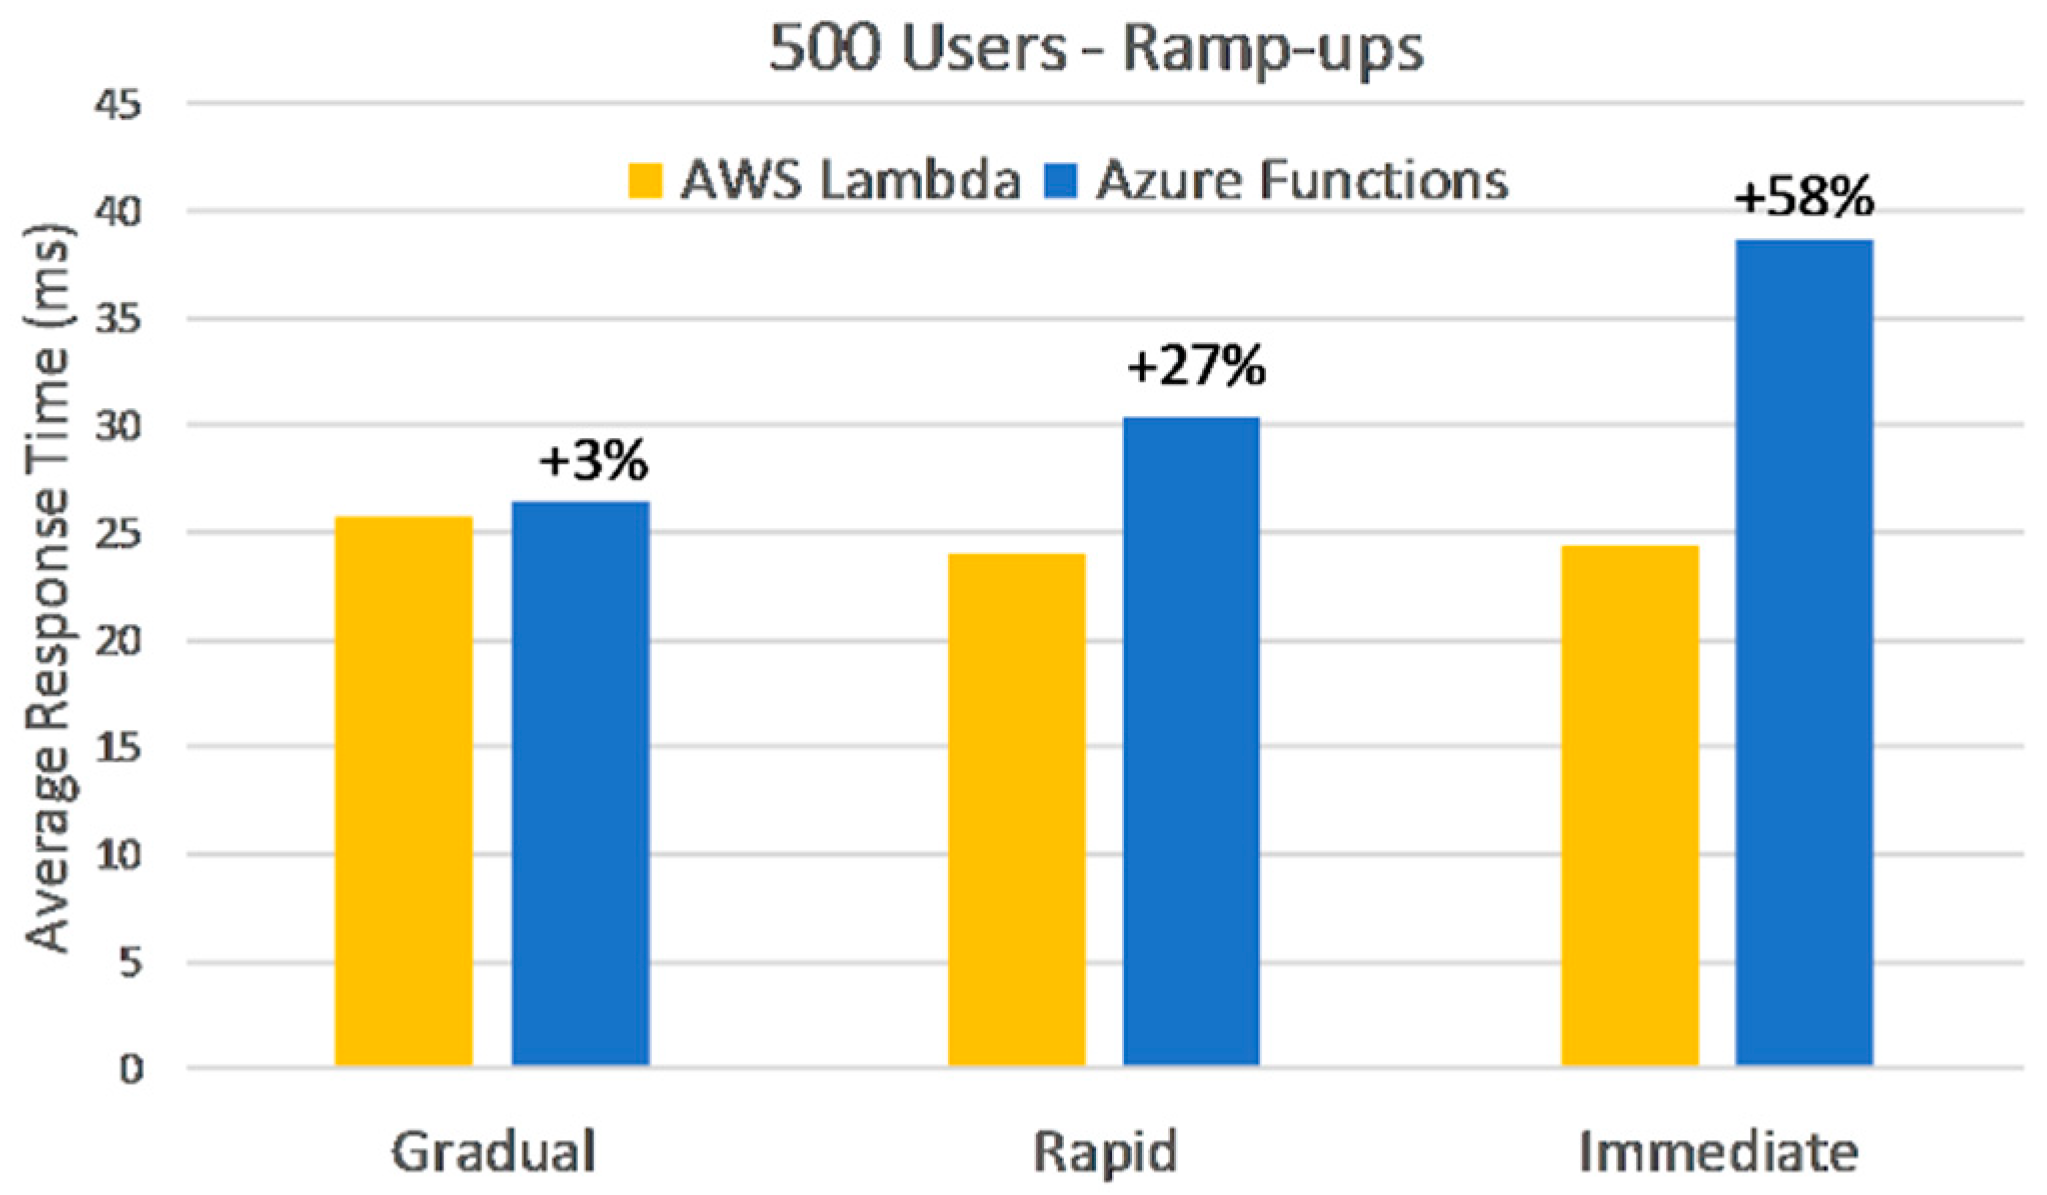
5.3.2. Without Dependencies
This test run compares the two FaaS deployments against the 500-user phase. Additionally, all dependencies to the database or storage have been replaced with dummy data. The reason for this was that external dependencies accounted for the majority of the response time absolute values, so we wanted to eliminate them and see if the discrepancies observed previously still hold. Another change is the shorter test duration, which was modified to ten min. This new duration leaves enough time for observations after full load is reached, considering we are only comparing FaaS deployments at this stage. These deployment changes are valid for all of the remaining test phases.
Figure 14 shows that Azure Functions have comparable response times for gradual ramp-up but are unable to keep up with AWS Lambda when it comes to unexpected user growth, although the biggest difference translates to just 14 milliseconds. More to this, Azure Functions are limited to 200 concurrent instances [
20], so for this 500-user load, we recorded many refused requests: 14%, 18%, and 22% for each respective ramp-up.
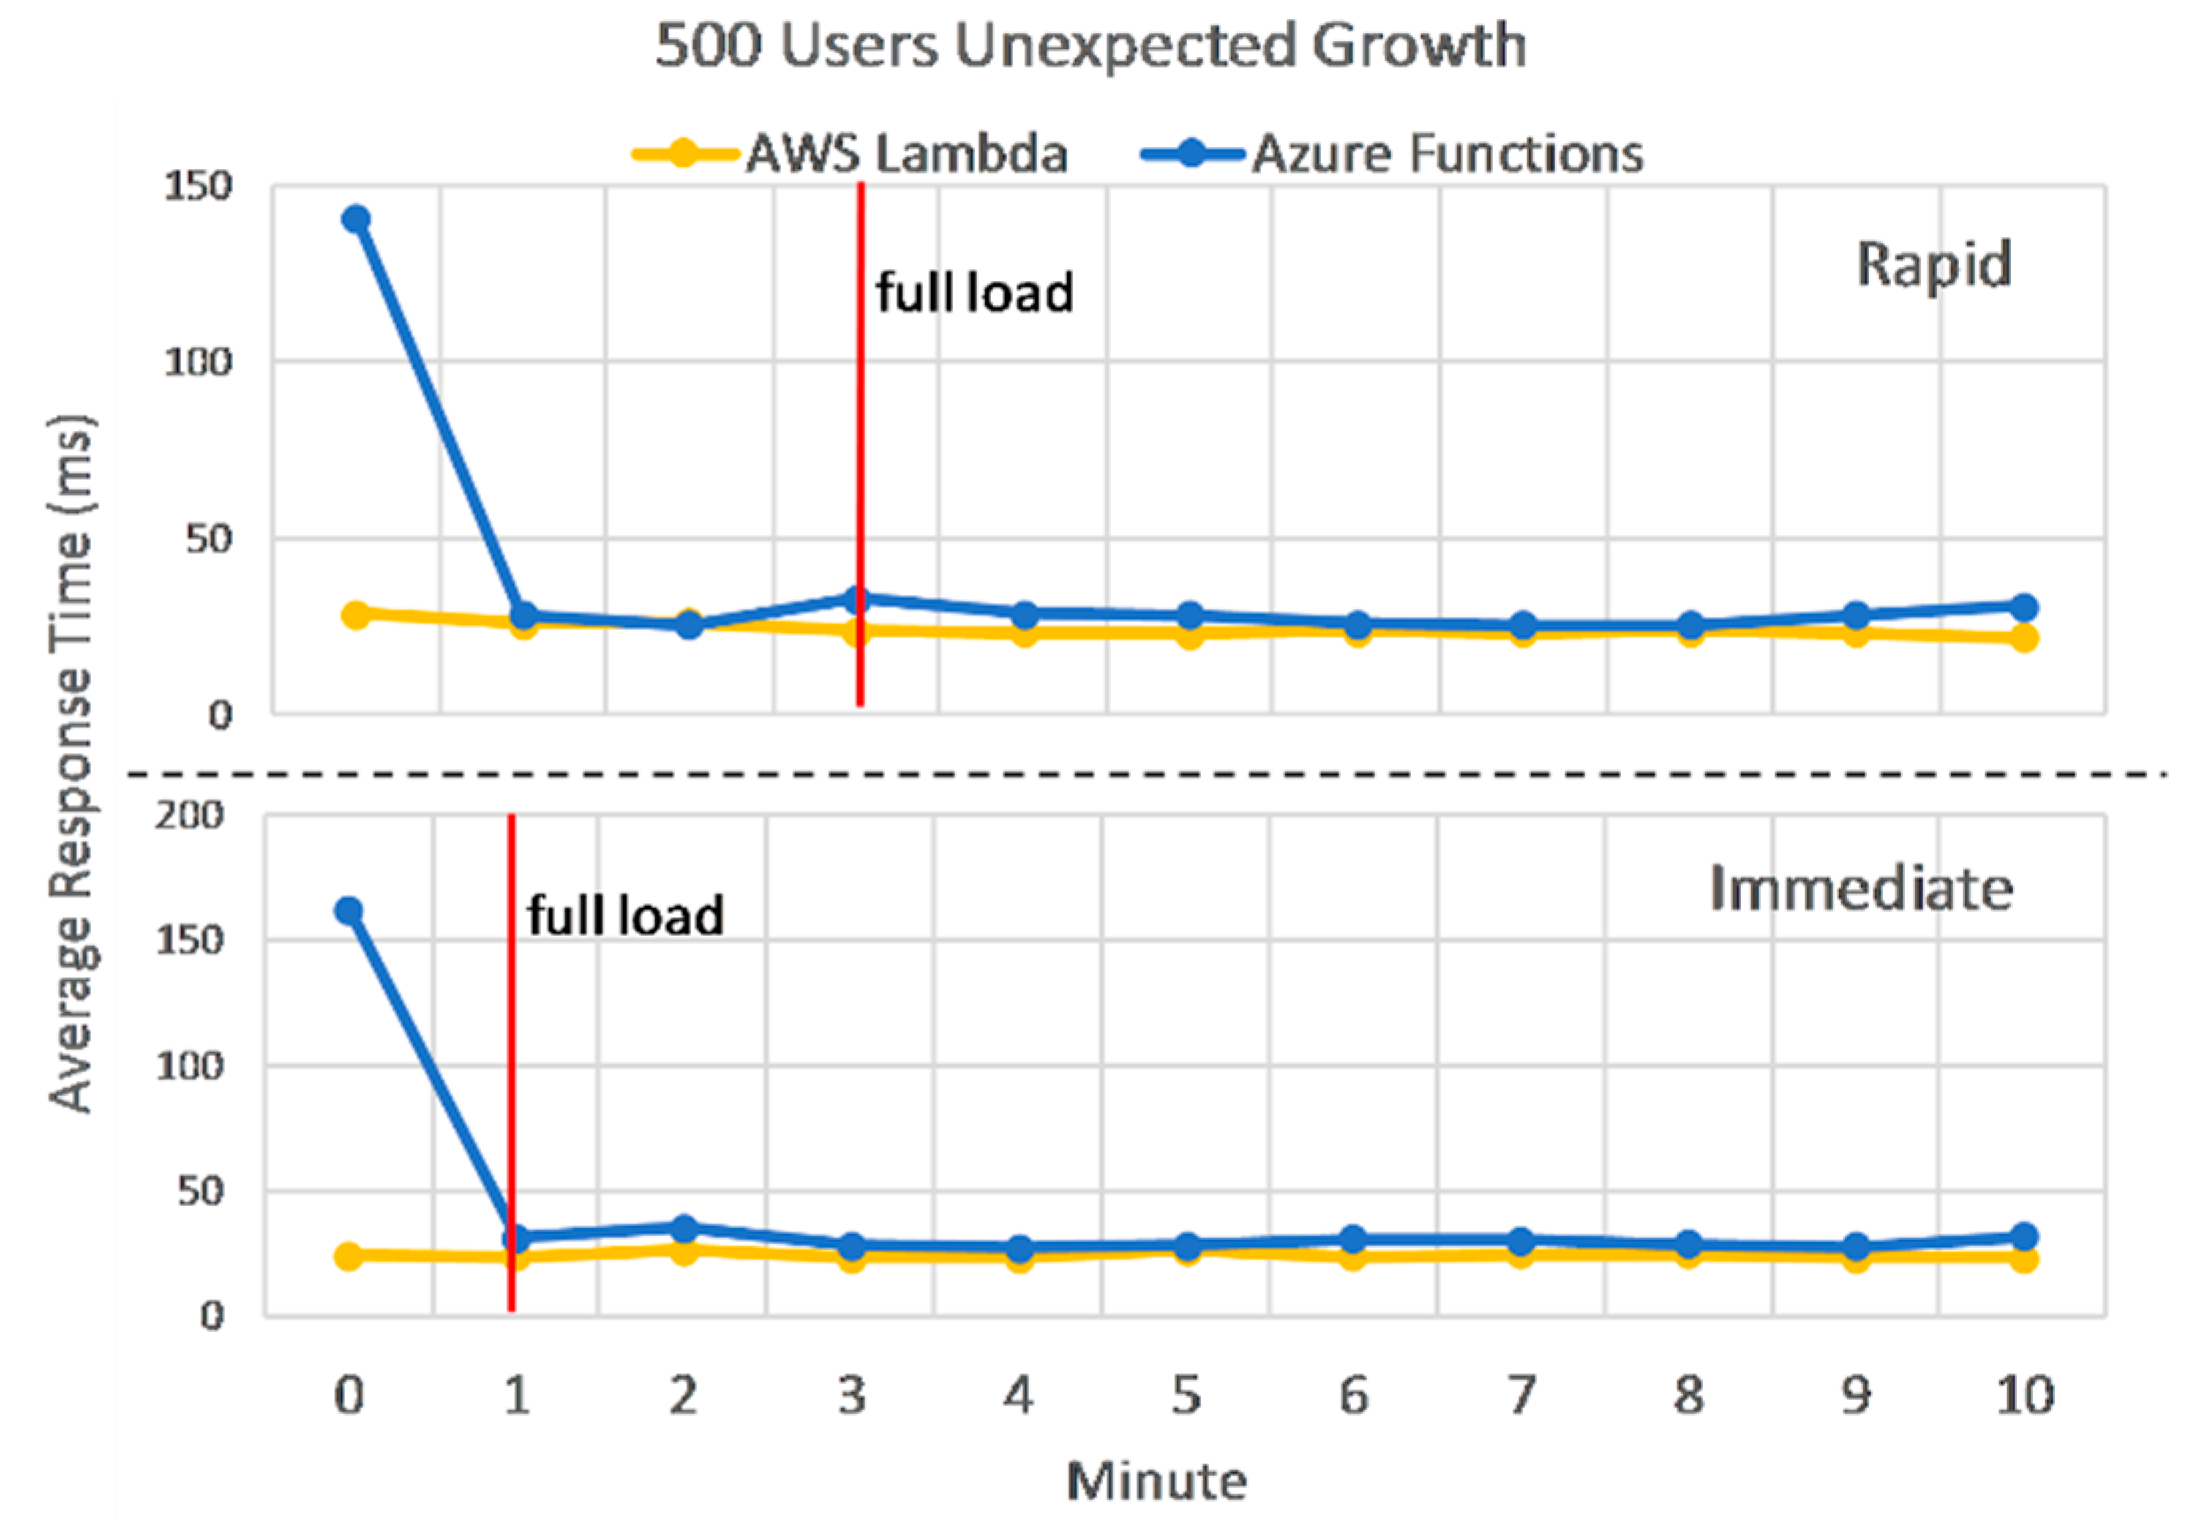
Looking into more detail at the response times before and after full load is reached in
Figure 15, shows us the scaling behavior of the two deployments, for rapid and immediate ramp-up. The two graphs look very similar and illustrate that AWS auto-scaling reacts faster, but when stabilized, the differences are insignificant between the two. Before full load, AWS Lambda performs between one to three times better. However, average response times computed after full load is reached drop to a 20% difference in Lambda’s favor, which represent just five milliseconds.
5.3.3. Concurrency Limits
Concurrency limits essentially limit the number of simultaneous users an FaaS application would be able to support. The default number of allowed concurrent instances are 200 for Azure Functions, and 1000 for AWS Lambda. However, because instances are reused, they should be able to process more concurrent requests than this limit.
In Phase 6 and 7 for Azure Functions, and Phase 8 and 9 for AWS Lambda, we compared response times between loads-matching and loads-surpassing the concurrency limit of each corresponding FaaS deployment across all ramp-ups. The results in
Table 4 show that Azure Functions seem to have better response times when the concurrency limit is surpassed, however the error rate is noticeable. AWS Lambda’ s response times double between the two phases, but the actual difference is 178 milliseconds.
Section 5.3 looks at Amazon and Microsoft’s implementation of FaaS, in order to answer to Research Question 3. Results show us that without dependencies, AWS Lambda is slightly better than Azure Functions, however the actual difference is in the order of tens of milliseconds. When connected to other dependencies, the difference between FaaS deployments is about 50 percent better on average in Amazon’s favor. So, the answer to this question is that there are significant differences between providers when it comes to response times, however FaaS resources account for only a small fraction of these. When deciding between cloud providers with performance in mind, one must consider all infrastructure components, because FaaS alone may not be a deciding factor.
5.4. Costs
Here we estimate costs from
Section 5.1, Phase 1 to 6, to see if there are considerable differences between deployments. VMs have a fixed price per hour and are billed to the second. Function(s)-as-a-service are billed based on memory usage per second and on individual invocations, with a fixed price per one million requests.
As mentioned in
Section 3, AWS Lambda has an identical pricing scheme and free grants, so with respect to consumption and executions, costs should be identical to Azure Functions. Google has similar prices and free grants, but it also bills CPU usage per second. Based on the consumption values in
Table 5, Google’s Cloud Functions run cost would be
$17.28, 8% more expensive than Amazon or Microsoft. So, this current section should answer the costs part of Research Question 3.
VM deployments were up to 12 times cheaper for the test runs, however they had no scaling capabilities, affecting response times. Cost estimation for Phase 5 alone, where VM deployments were scaled out to obtain comparable response times, give smaller differences between them: $1.63 FaaS, $0.312 Monolith, and $0.268 Microservices, which makes VMs only 6 times cheaper, excluding free grants. One must also consider that Microsoft does not bill you for the full 1.5 GB memory allocated to its functions, as in our calculations, it only bills what you use. So, for example, using 30% less memory in Azure Functions, would drop the total cost by 40%. This is a powerful idea for FaaS in general: any performance optimizations you make to your code that reduces resource consumption or the overall response times, will have a direct impact on operation costs.
It is also worth mentioning that there are additional costs, not reflected in our estimations, for different infrastructure artifacts, such as data transfer, load balancer, reserved IP addresses, databases, storage and more, as well as labor costs. Some are VM-specific and would make the price for such a deployment go higher. On the other hand, VMs can be reserved for years in advance reducing the overall cost by as much as 80% [
31]. So, based on the estimations in
Table 5 alone, the answer to Research Question 2 is that costs are significantly less for VMs, however performance is not. The answer for the general case, is that one has do a thorough analysis [
12] before deciding for one deployment or the other, as there are many factors that affect cost.
6. Conclusions
The goal of this paper is to help with better decision-making when deploying a Web API into the cloud, with a focus on the end-user’s perception of performance. Specifically, we compared response times for the same application, deployed as function-as-a-service, and as monolith and microservices on virtual machines. Additionally, we looked at costs to find out if there are significant differences in order to shift the decision in one direction or the other. We started from the assumption that the application’s hardware requirements are within the limits of FaaS and established some test phases where we vary the number of concurrent users.
We found that there are no considerable differences in response times between deployments, when VMs are properly configured with respect to load. This also means that additional effort and money need to be invested in VM deployments in order to match the native capabilities of FaaS.
Usage predictability is an important factor when deciding between deployments, as it can help reduce costs significantly. The presented results show that VM deployments are several times cheaper when properly configured for the expected load. However, our investigation does not account for the maintenance and configuration costs associated with VMs. More to this, FaaS successfully handles unexpected user growth with its built-in features, whereas additional effort would be required to setup VMs to match FaaS’ auto-scaling capabilities. On the other hand, when payload increases, scaling out does not help, and VMs can provide more unused raw power as opposed to FaaS’s fixed memory and CPU configuration. When it comes to cloud providers, response times seem to be better for AWS Lambda. However, in a real situation, multiple other infrastructure components are used, which affect response times and costs. To sum up, one needs to do a thorough analysis before choosing a cloud provider or a type of deployment, as there are many variables to consider affecting performance and costs.


