Article

Conceiving Human Interaction by Visualising Depth Data of Head Pose Changes and Emotion Recognition via Facial Expressions †

by
Grigorios Kalliatakis
1,*,
Alexandros Stergiou
1 and
Nikolaos Vidakis
2
1
School of Computer Science and Electronic Engineering, University of Essex, Colchester CO4 3SQ, UK
2
Department of Informatics Engineering, Technological Educational Institute of Crete, Stauromenos 71410, Heraklion, Crete, Greece
*
Author to whom correspondence should be addressed.
This paper is an extended version of our paper published in proceedings of the 8th Computer Science and Electronic Engineering Conference (CEEC), University of Essex, UK, 28–30 September 2016.
Computers 2017, 6(3), 25; https://doi.org/10.3390/computers6030025
Submission received: 31 May 2017 / Revised: 20 July 2017 / Accepted: 20 July 2017 / Published: 23 July 2017

Abstract

:
Affective computing in general and human activity and intention analysis in particular comprise a rapidly-growing field of research. Head pose and emotion changes present serious challenges when applied to player’s training and ludology experience in serious games, or analysis of customer satisfaction regarding broadcast and web services, or monitoring a driver’s attention. Given the increasing prominence and utility of depth sensors, it is now feasible to perform large-scale collection of three-dimensional (3D) data for subsequent analysis. Discriminative random regression forests were selected in order to rapidly and accurately estimate head pose changes in an unconstrained environment. In order to complete the secondary process of recognising four universal dominant facial expressions (happiness, anger, sadness and surprise), emotion recognition via facial expressions (ERFE) was adopted. After that, a lightweight data exchange format (JavaScript Object Notation (JSON)) is employed, in order to manipulate the data extracted from the two aforementioned settings. Motivated by the need to generate comprehensible visual representations from different sets of data, in this paper, we introduce a system capable of monitoring human activity through head pose and emotion changes, utilising an affordable 3D sensing technology (Microsoft Kinect sensor).

1. Introduction

Affective computing in general and human intention analysis specifically comprise a rapidly-growing field of research, due to the constantly-growing interest in applying automatic human activity analysis to all kinds of multimedia recordings involving people. Applications concerned with human activity analysis include services that support: (a) the study of player’s learning and ludology (borrowing from Latin word “ludus” (game), combined with an English element; the term has historically been used to describe the study of games) experience while playing a serious game; (b) the analysis of customer satisfaction regarding broadcast and web services; and (c) the monitoring of driver’s attention and concentration while commuting. Given the increasing prominence and utility of depth sensors, it is now feasible to perform large-scale collection of three-dimensional (3D) data for subsequent analysis [1,2]. In this work, we focus in particular on recognising head pose and facial expression changes, which can provide a rich source of information that can be used for analysing human activity in several areas of human computer interaction (HCI).
Head pose estimation (HPE) refers to the process of deducting the orientation of a person’s head relative to the view of a camera or to a global coordinate system. Head pose estimation is considered as a key element of human behaviour analysis. Accordingly, it has received extensive coverage in the scientific literature, and a variety of techniques has been reported for precisely computing head pose [3], while depth information can also be integrated [4,5,6].
Facial expression is one of the most dominant, natural and instantaneous means for human beings to communicate their emotions and intentions [7]. The reason for this lies in the ability of the human face to express emotion sooner than people verbalise or even realise their feelings. Humans are able to observe and recognise faces and facial expressions in a scene with little or no effort [8]. However, development of an automated system that performs the task of facial expression recognition (FER) is still regarded as a rather difficult process [9]. Existing approaches in 3D FER can be typically divided into two categories: feature-based and model-based. Feature-based FER methods concentrate on the extraction of facial features directly from the input scan [10,11,12]. On the other hand, model-based approaches normally engage a generic face model as an intermediate for bringing input scans into correspondence by means of registration and/or dislocation [13,14,15].
In computer and information science, visualisation refers to the visual representation of a domain space using graphics, images and animated sequences to present the data structure and dynamic behaviour of large, complex datasets that exhibit systems, events, processes, objects and concepts. Data visualisation is a relatively new field, which not only pairs graphic design with quantitative information, but also studies humans cognitive understanding and interpretation of graphical figures, aiming at conveying data in the most efficient, but accurate and representative way [16]. In addition, visualisations can be used in several distinct ways to help tame the scale and complexity of the data, so that it can be interpreted more easily.
One field that has yet to benefit from data visualisations is human intention understanding. Following Jang et al. [17], human intention can be explicit or implicit in nature. Typically, humans express their intention explicitly through facial expressions, head movements, speech and hand gestures. Interpreting the user’s explicit intention, which contains valuable information, is vital in developing efficient human computer interfaces. In conventional human computer interface (HCI) and human robot interaction (HRI) environments, the user intention such as “copy this file” or “create a folder” can be explicitly conveyed through a keyboard and a computer mouse [18,19], which can be easily interpreted. The process of data visualisation is suitable for externalising the facts and enabling people to understand and manipulate the results at a higher level. Additionally, visualisations can be used in several distinct ways to help tame the scale and complexity of the data so that they can be interpreted effortlessly.
Most facial expression recognition and analysis systems proposed in the literature focus on the analysis of expressions, although without any concern for subsequent interpenetration of human intentions with respect to the task of interest. Similarly, even though head pose changes provide a rich source of information that can be used in several fields of computer vision, there are no references in the literature regarding subsequent analysis of those findings for the task at hand. In the above context, the aim of the present work is to develop a framework capable of analysing human activity from depth data of head pose changes and emotion recognition via facial expressions, by visualising them on the web. Data visualisations can play an important role in conceiving user’s interaction in many applications. One such application is the assessment of the player’s training and ludology experience in the case of serious games such as [20,21]. The main hypothesis, in the context of serious games, is that an educator can intervene in the game characteristics in order to increase the learner’s performance. The underlying assumption is that the educator can easily interpret the activity of all users after the experiments have concluded and act accordingly. Accessible visualisations can play a major part in that kind of assessment by creating encodings of data into visual channels that educators can view and understand comfortably, while they can lead to valuable conclusions regarding the overall experience of users and serious game players.
The remainder of the paper is organized as follows. The next section contains a summary of related work. Section 3 gives an overview of the adopted methods for capturing head pose and emotion changes, alongside a detailed description of our modifications for the experiments. The seven proposed web-based visualisations are presented in Section 4, alongside their implementation details. Finally, Section 5 concludes and describes future research directions.

2. Related Work

A variety of methods has been used to represent detected emotions for research projects, as well as in industry. However, since the results vary based on the included features and the values that they are assigned to, a global representation method would be impracticable. Instead, the analysis produced can be delineated with a large diversity of depiction techniques.
One of the most prominent visualisation methods, with the assumption of a large quantity of experiments performed, is the use of a two-dimensional line chart for a scheme of individual emotions [22]. This chart can show correlations between emotions and some patterns in the data that may be a product of common motifs in the user’s inputs (these can be translated as particular tasks/actions that cause an equivalent human reaction). In addition, the overall emotional state of the user can be monitored with a line chart, as a surge (or equivalently a decline) in the data may show a differentiation from expected values [23]. In this way, not only the dominant mood of the participant can be perceived, but also the way that the user is emotionally affected by activities or events. Furthermore, the use of the line chart has also focused on interpreting real-time data [24] since it can aid in the demonstration of emotion and head position constant data flow.
Another informative visualisation that complements the aforementioned line chart and that can be used in conjunction with it, is the bar chart. This mean of illustration supports a complete view of individual instances and also a general picture to be determined, based on the predicted results [25]. The bar chart allows the demonstration of the most popular emotion in addition to a complementary variable (such as the time that the data were captured or the duration of the experiment). Furthermore, considering this additional variable, the most probable emotion can be found by taking into account the class of the categorised reactions of the users, as well as the classification confidence. Moreover, variations in values signify the possible inconsistencies of the system, alongside examples or learning tasks that may have been more difficult to classify. For example, considering that anger and happiness are completely opposite emotions, using two distinguishing bars for visualising them, the expected results would only be of binary distribution, with only one bar taking values above zero (the same can also be said for head poses, for example up and down).
Regarding the representation of head pose estimations, most illustrations are targeted at displaying the level of accuracy at each prediction and the position where the example was found to occur in a 3D or 2D chart. A good demonstration of this mindset is the use of the perspective-n-point method [26] that “simulates” the view of the user’s head with a hexadecagon shape that can be rotated based on the direction of the head that was determined. However, this graphic is limited to the top view of the user’s head and therefore would only provide useful information in the case of changes in the head pose horizontally. More recent efforts have focused on 3D depiction of the user’s head position based on the pitch, roll and yaw as the axis [27]. These three degrees of freedom allow one to understand the position of the user’s head during experiments. The combination of these three values constitute each a probable input head pose.

3. Overview of Methods for Capturing Head Pose and Emotion Changes

This section discuss the two methods employed in our experiments for recognising head pose and facial expression changes, utilising an affordable 3D sensing technology (Microsoft Kinect sensor). The real-time head pose estimation and facial expression events are separately obtained for different users sitting and moving their head without restriction in front of a Microsoft Kinect sensor for specified intervals. Experimental results on 20 different users show that our modified frameworks can achieve a mean accuracy of 83.95% for head pose changes and 76.58% for emotion changes when validated against manually-constructed ground truth data.

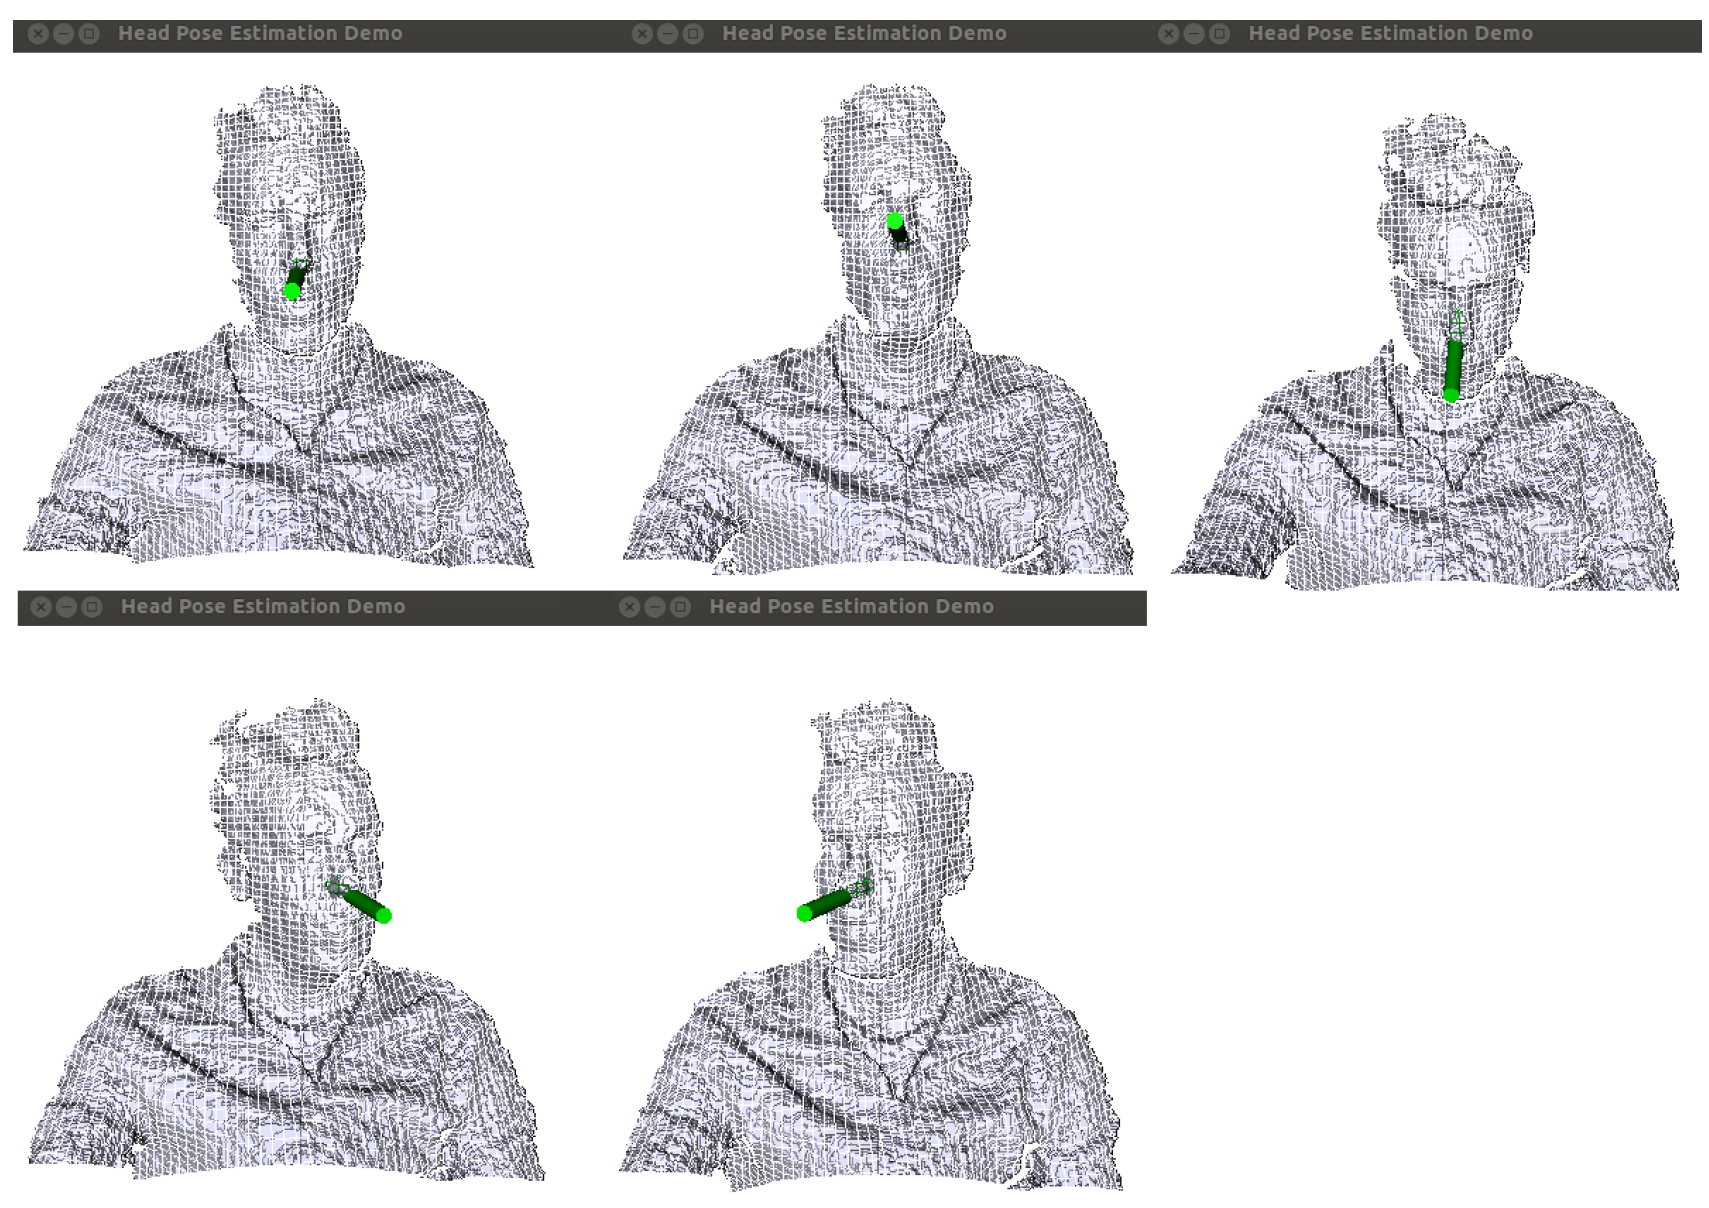
3.1. Estimation of Head Pose Changes

Systems relying on 3D data have demonstrated very good accuracy for the task of head pose estimation, compared to 2D systems that have to overcome ambiguity in real-time applications [28]. 3D head pose information drastically helps to determine the interaction between people and to extract the visual focus of attention [3]. The human head is limited to three degrees of freedom (DOF) in pose, expressed by three angles (pitch, yaw, roll) that describe the orientation with respect to a head-centred frame. Automatic and effective estimation of head pose parameters is challenging for many reasons. Algorithms for head pose estimation must be invariant to changing illumination conditions, to the background scene, to partial occlusions and to inter-person and intra-person variabilities. For performing the set of experiments, we partly followed the approach of Fanelli et al. [29], which is suitable for real-time 3D head pose estimation, considering its robustness to the poor signal-to-noise ratio of current consumer depth cameras like Microsoft Kinect sensor. While several works in the literature contemplate the case where the head is the only object present in the field of view [30], the adopted method concerns depth images where other parts of the body might be visible at the same time and therefore need to be disjointed into image patches either belonging to the head or not. The system is able to perform on a frame-by-frame basis while it runs in real time without the need for initialisation. Forests of randomly-trained trees are less sensitive to over-fitting and generalize better than decision trees independently. In our setup, depth patches are annotated with the class label and a vector:
θ = θ χ , θ υ , θ ζ , θ y a , θ p i , θ r o
containing the offset between the 3D points falling on the patch’s centre and the head centre location, plus the Euler rotation angles describing the head orientation. Randomness is imported in the training process, either in the set of training examples provided to each tree, or in the set of tests usable for optimization at each node, or even in both. When the pair of classification and regression measure is engaged, the aggregation of trees that simultaneously separate test data into positive cases (they represent part of the object of interest) is labelled as discriminative random regression forests (DRRF). This signifies that an extracted patch from a depth image is sent through all trees in the forest. The patch is evaluated at each node according to the stored binary test and passed either to the right or left child until a leaf node is reached [5], at which point it is classified. Only if this classification outcome is positive (head leaf), a Gaussian distribution is recaptured and then used for casting a vote in a multidimensional continuous space, which is stored at the leaf. Figure 1 shows some processed frames regarding two DOFs (pitch and yaw). All calculations are derived from the difference between the exact previous frame and the current frame, at each iteration of the experiment. The green cylinder encodes both the estimated head centre and the direction of the face.
p i t c h D i f f = p i t c h t - 1 - p i t c h t
y a w D i f f = y a w t - 1 - y a w t
u p = p i t c h D i f f > T H R E S H 1
d o w n = p i t c h D i f f < T H R E S H 1
l e f t = y a w D i f f > T H R E S H 2
r i g h t = y a w D i f f < T H R E S H 2
Our aim is to capture all the changes concerning pitch and yaw angles that occur during the experiments. For this reason, given the pitch ( p i t c h t ) and yaw ( y a w t ) intensities of the ongoing streaming frame and the exact previous frame’s pitch ( p i t c h t - 1 ) and yaw ( y a w t - 1 ) intensities, the system operates in three steps as follows: (a) the differences regarding pitch and yaw are calculated by Equations (2) and (3); (b) then, two different threshold values were experimentally set at 4.0 and 3.5 respectively, in order to ignore negligible head movement events in the two DOFs, which do not need to be recorded by our system; (c) finally, the changes with respect to the four different directions are given by Equations (4)–(7). Note that the two threshold values can easily be adapted according to the nature and the setup of the experiment being monitored.

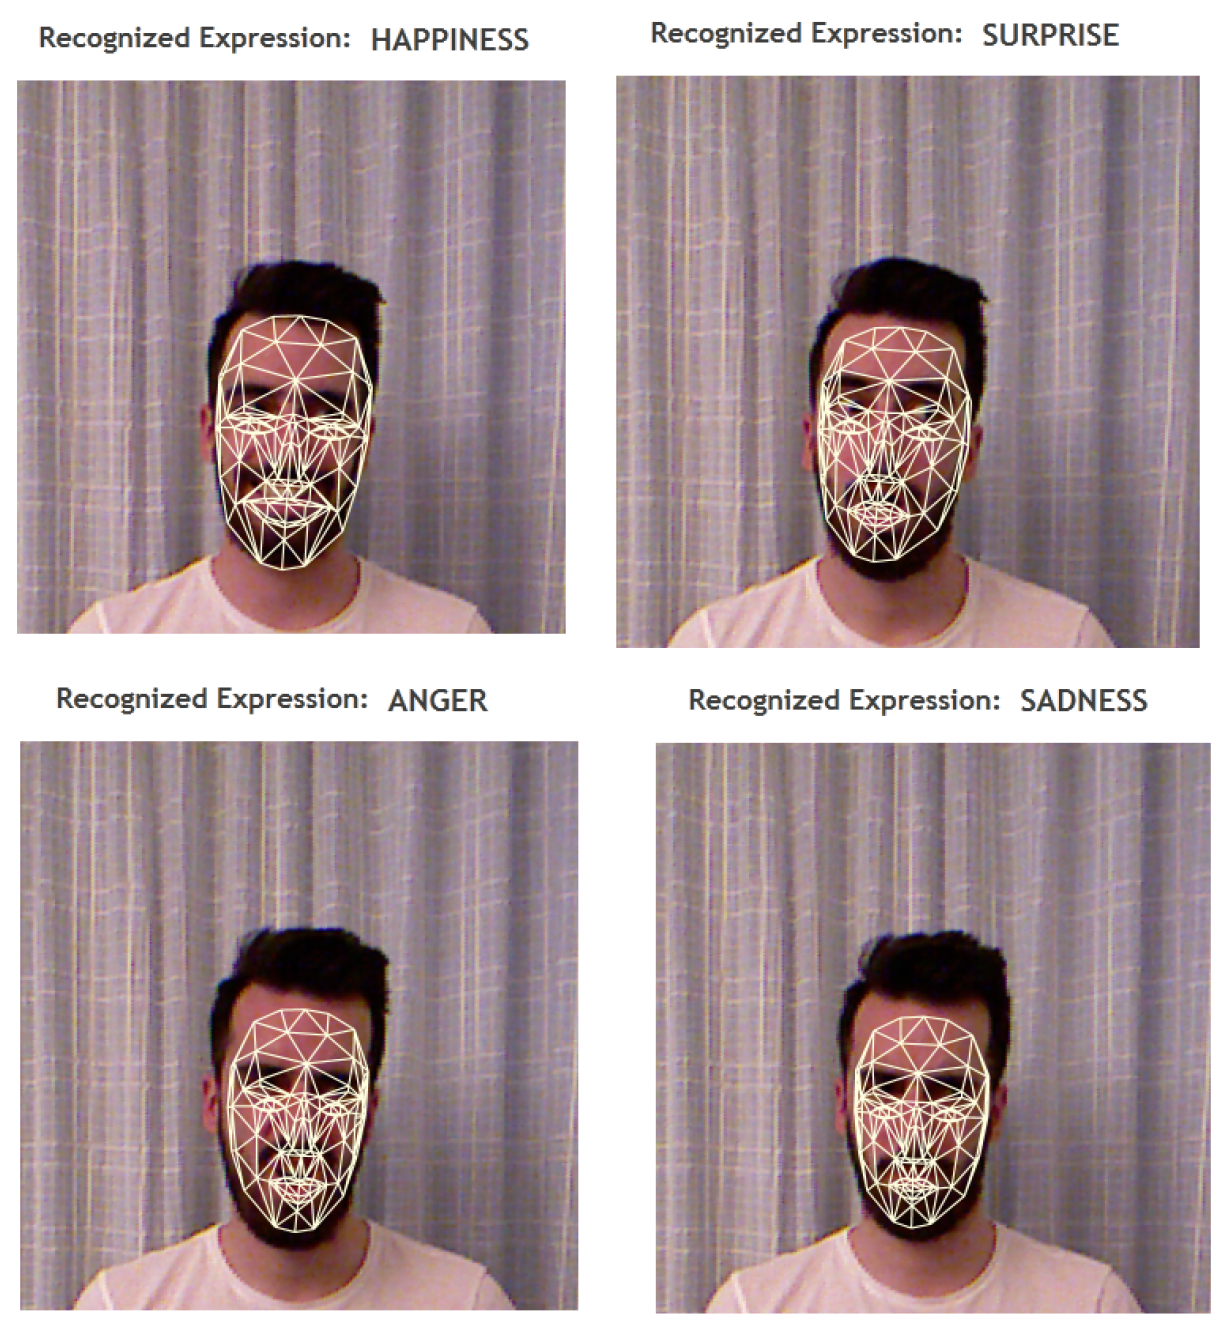
3.2. Emotion Recognition from Facial Expressions

Emotion recognition via facial expressions (ERFE) is a growing research field in computer vision compared to other emotion channels, such as body actions and speech, primarily because superior expressive force and a larger application space is provided. Features that are utilised to classify human affective states are commonly based on local spatial position or dislocation of explicit points and regions of the face. Recognition of facial action units (AUs) is one of the two main streams in facial expression analysis. AUs are anatomically related to the reduction of specific facial muscles, 12 for the upper face and 18 for the lower face [31]. A total of 44 AUs can be derived from the face, and their combinations can compose different facial expressions. In this work, four basic universal expressions are considered: happiness, surprise, sadness and anger. An approach similar to Mao et al. [32] was followed for real-time emotion recognition. Video sequences acquired from the Kinect sensor are regarded as input. The Face Tracking SDK [33], which is included in Kinect’s Windows Developer toolkit, is used for tracking human faces with RGB and depth data captured from the sensor. Face detection and feature extraction is performed on each frame of the stream. Furthermore, facial animation units and 3D positions of semantic facial feature points can be computed by the face-tracking engine, which can lead to the aforementioned emotion recognition via facial expressions. Face tracking results are expressed in terms of the weights of six animation units, which belong to a subset of what is defined in the Candide3 model [34]. Each AU, that is deltas from the neutral shape, is expressed as a numeric weight varying between −1 and +1, and the neutral states of AUs are normally assigned to zero. Utilising Equation (8), the AU’s feature of each frame can be written in the form of a six-element vector:
a ¯ = ( A 1 , A 2 , A 3 , A 4 , A 5 , A 6 )
where A1, A2, A3, A4, A5 and A6 refer to the weights of lip raiser, jaw lower, lip stretcher, brow lower, lip corner depressor and brow raiser, respectively. Boundaries for each AU had to be empirically established in order to associate the vector obtained by the AU feature, as defined by Equation (8), with the four main emotions considered in this paper. For example, (0.3, 0.1, 0.5, 0,−0.8, 0) corresponds to a happy face, which means showing teeth slightly, lip corner raised and stretched partly, and the brows are in the neutral position. Equations (9)–(12) were experimentally formulated for our test sessions. Those equations can be modified in accordance with the nature and the setup of the experiment. An example of all four different recognised emotions for our test sessions is shown in Figure 2.
s a d n e s s = A 6 < 0 A 5 > 0
s u r p r i s e = ( A 2 < 0.25 A 2 > 0.25 ) A 4 < 0
h a p p i n e s s = A 3 > 0.4 A 5 < 0
a n g e r = ( ( A 4 > 0 ( A 2 > 0.25 A 2 < - 0.25 ) ( A 4 > 0 A 5 > 0 ) )

3.3. Data Compilation and Experimental Setup

Regarding the storage of the obtained data, the JavaScript Object Notation (JSON) format was used mainly because of its lightweight nature, convenience in writing and reading and, more importantly, as opposed to other formats such as XML, its suitability in generating and parsing tasks in various Ajax applications as described in [35]. A record in an array was created for each user session, while an extra array was inside it, carrying three variables: time, direction and intensity for each movement that was detected. For facial expressions, a similar array was created, but in this case, only two variables were listed: time and emotion
In contemplation of assessing the validity of our modified versions of head pose estimation and emotion recognition, we performed the following experiments. First, the ground truth data had to be constructed; therefore, one JSON file consisting of 20 different sessions, each one populated with specific movements or facial expressions and their corresponding time, was manually created. Concerning the collection of the actual experimental results, 20 different subjects (each subject indicates a new session) were asked to move their head in explicit directions and time intervals. Regarding the FER framework, an analogous approach was followed, by asking subjects to make specific facial expressions, looking towards the direction of the Kinect sensor. Finally, the obtained results were put against the pre-assembled ground truth data. The experiments are controlled by a number of parameters. Some parameters were fixed intuitively during the establishment stage of the experiments, for example a threshold was set in order to split actual changes of the pose from negligible ones that can occur when a user moves his/her head in an uncontrolled environment. Both methods run at 30 fps on a computer with an Intel Core Duo CPU @3.00 GHz (Intel, Santa Clara, CA, USA).

4. Visualisations on the Web

Although many different approaches have been proposed in the literature to solve the problem of recognising head pose and emotion changes, very few focus on how those data can be presented in order to deliver a useful interpretation effortlessly. To that end, the principal objective of this section is to introduce various efficient and user-friendly web-based visualisations (the code to reproduce the visualisations can be found at https://github.com/GKalliatakis/BringDepthDataAlive) in order to improve the understanding and the analysis of human activity from the captured data of head pose and emotion changes.

4.1. Representative Scenario

To illustrate some of the concepts described thus far and to provide insight into the technical features of our web-based visualisations, we will briefly describe a representative scenario emphasising the effortless data interpretation they present. Our reference scenario is summarised in Exhibit 1.
Exhibit 1: Charlie, who is responsible for teaching young people through educational and training games, wants to organise a session for his students. He also wants to monitor his students’ emotions throughout the whole duration of the session separately from the main game to boost his chances of recognising when his students were facing difficulties or when his students were achieving some goals in the context of the game he had previously designed. However, as he is interested in drawing valuable conclusions regarding the overall ludology experience of the players, he has to analyse those findings.
Motivated by those needs, our system is not only capable of monitoring human activity through head pose changes and emotion recognition, but also can visually depict those data in order to enable educators to understand and manipulate the results at a higher level from the convenience of a website.

4.2. Head Pose

Four different visualisations are established for the desirable web-based data interpretation of head pose changes in Figure 3, Figure 4, Figure 5 and Figure 6. The first one is a 2D scatterplot displaying the head movement of the user over a specified time period. After that, a column visualisation depicting the overall head pose changes grouped by their dominant direction is presented. Finally, an intensity chart and a pie chart for outlining the intensities of head pose changes and their proportions in terms of the dominant direction are shown.

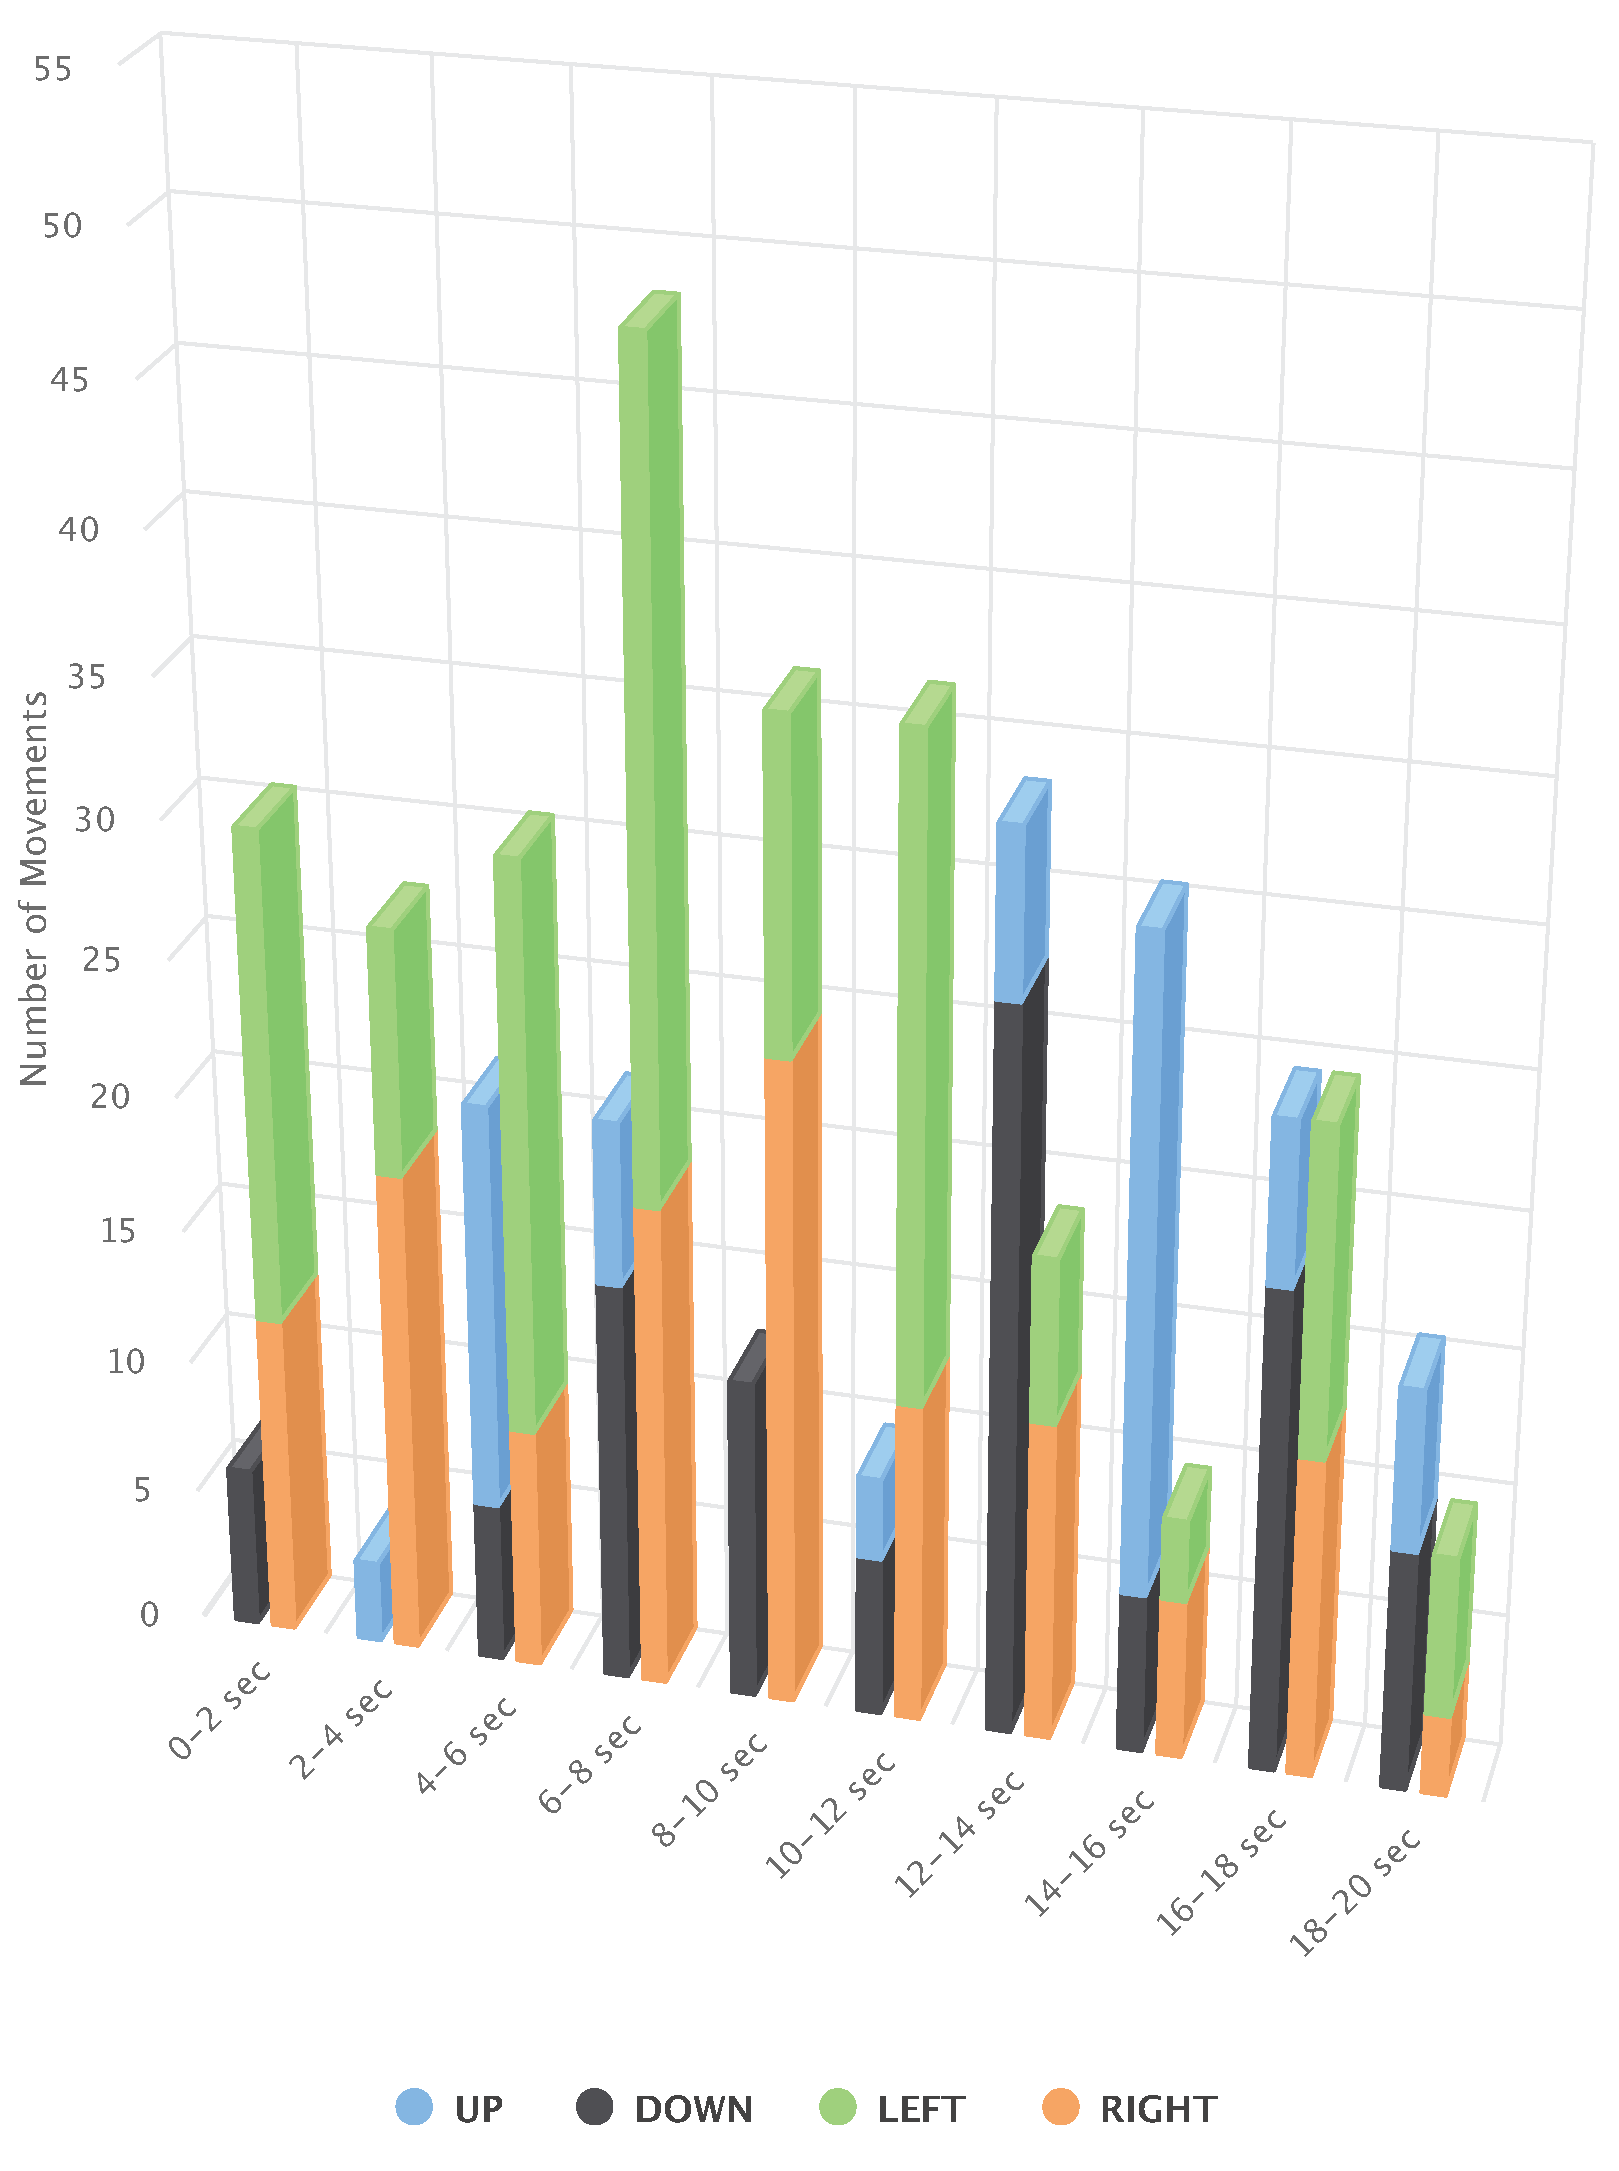
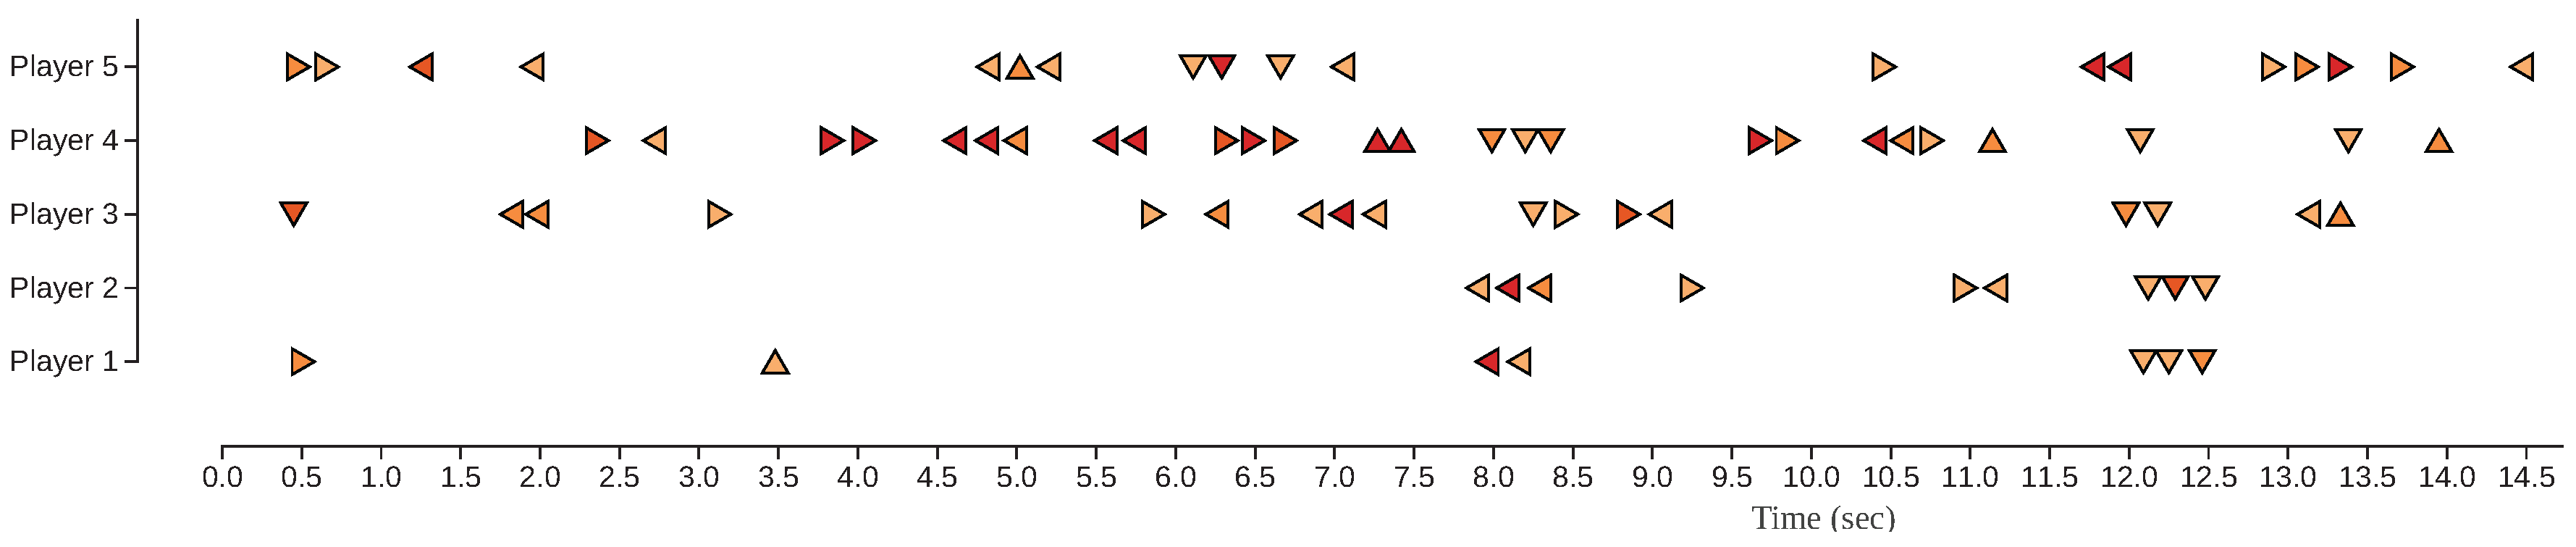
4.2.1. Head Pose Changes across Time

Regarding the two-dimensional scatterplot, the x-axis represents the time scale in seconds during which the tests take place (Figure 3 shows only a zoomed portion of the whole graph), while each label in the y-axis symbolises each different user performing the test. Four different arrows imitate the movement of the human’s head in two DOFs. Furthermore, an additional feature is displayed when the mouse hangs over an arrow, showing the respective time each movement occurred and the intensity, which derives from the difference between the previous and the current frame, as explained in Section 3.1. Apart from those elements, a colour fluctuation is also evident, which serves as an intensity indicator for each movement (the closer to the red colour the arrow is, the higher the intensity of the movement). One can easily examine the motion of the player that way, alongside its intensity, which adds a different dimension to the knowledge gained from the visualisation. The chart clearly shows to Charlie (see the representative scenario) that almost all his students around Seconds 12–14 look down, which could be interpreted as the player being bored with the game at this specific moment. Charlie could then examine the game at the specific moment and enhance it to avoid the students’ feeling of boredom. The full version of this visualisation is available at: http://83.212.117.19/HeadPoseScatterplot/.

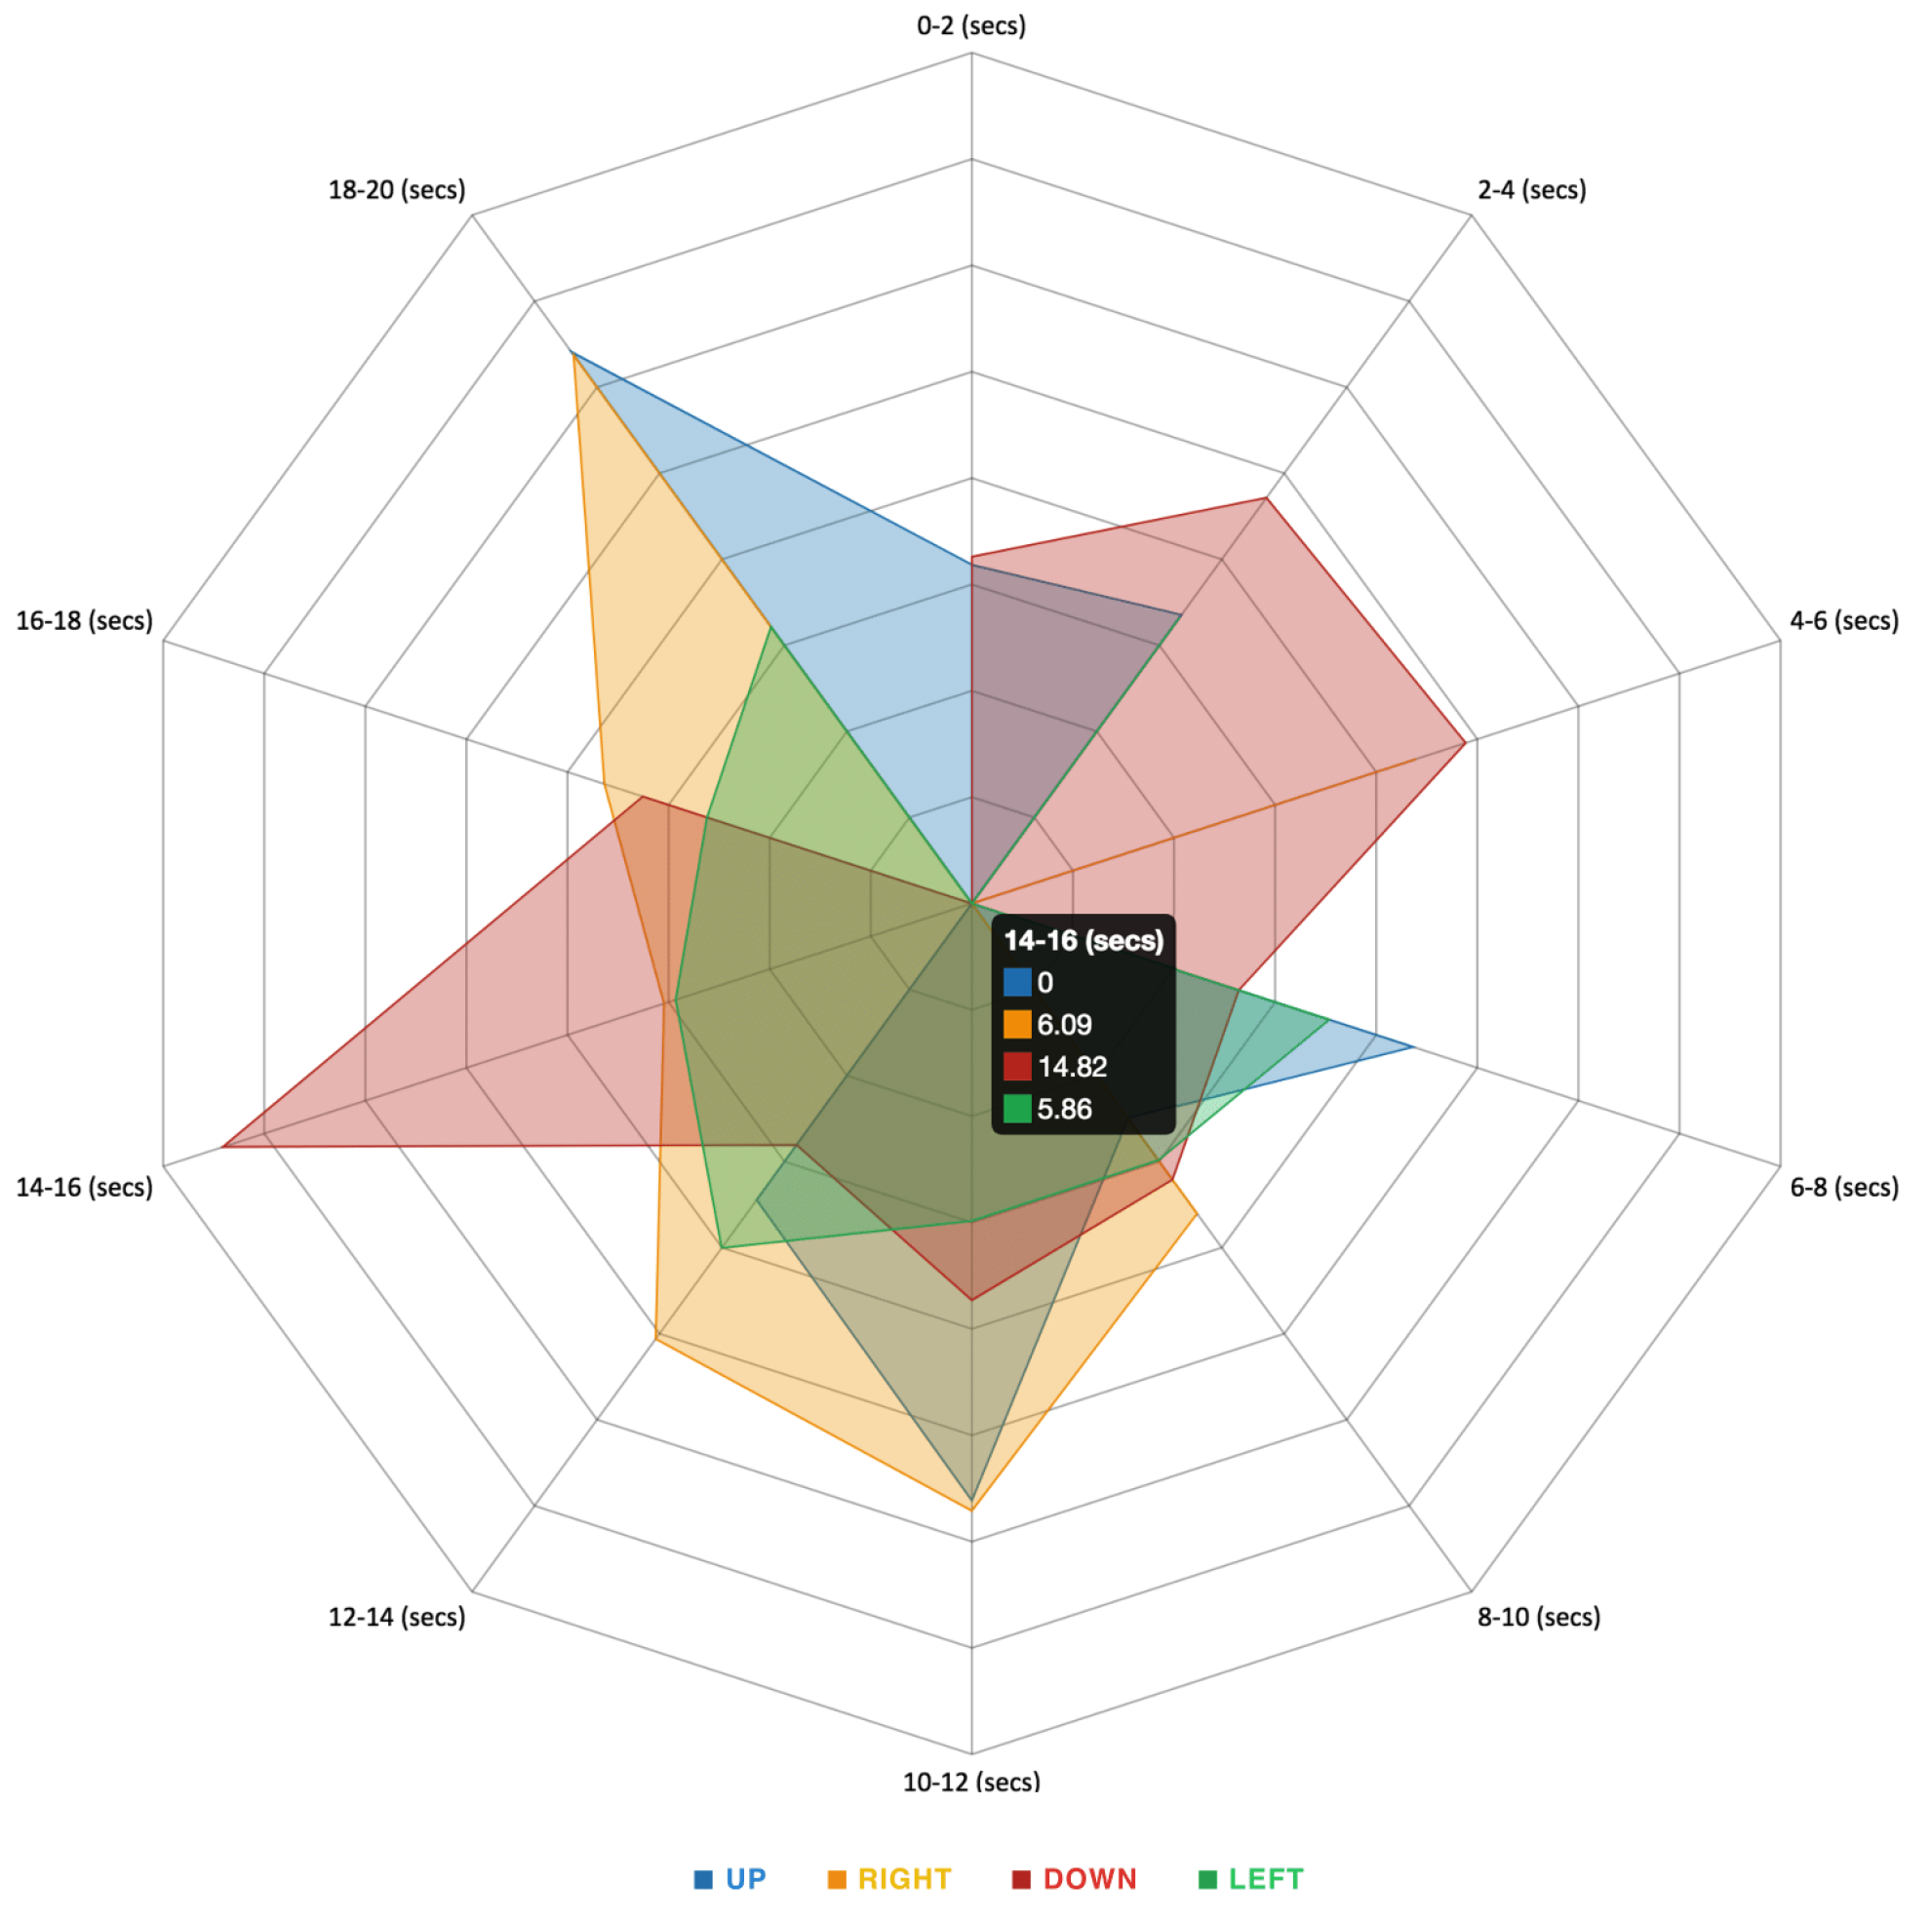
4.2.2. Head Pose Changes Grouped by Direction

The second visualisation consists of a column diagram that illustrates the aggregation of all head movements grouped by direction every two seconds as shown in Figure 4. The four different directions are imitated by four different colours. On one hand, the x-axis represents the time scale, which is divided every two seconds until the end of the test. On the other hand, the y-axis displays the number of movements for all of the users that take part in the tests. Furthermore, when hovering above a column, the number of the corresponding direction summary is displayed. In this fashion, the dominant direction amongst all users every time interval is effortlessly assumed. Moreover, not so evenly-distributed movements (e.g., columns between two and four seconds in Figure 4) can lead to practical conclusions taking into account the nature of the test, as well. Figure 4 confirms that the majority of Charlie’s students look down (finding of visualisation in Figure 3) as the black colour is the dominant colour at the time range of 12–14 s. This second visualisation affirms the assumption of something must be changed around game play time Seconds 12–14 and that Charlie must pay attention to it. The full version of the overall head movement visualisation is available at: http://83.212.117.19/HeadPose3D/.

4.2.3. Intensities of Head Pose Changes

As mentioned before, the duration of the experiment can be an important aspect of the observations, as examples can be over-represented or under-represented in particular times during the tests. For this reason, an additional visualisation technique is used to exhibit any differences and inconsistencies. Considering these requirements, the best approach is to utilise an intensity chart with the construction of a decagon, with each edge representing the different time values of the experiments, as shown in Figure 5.
This grid can display the movements that were classified by the system based on a time interval and also their average intensity at that time. Each edge of the decagon displays the average intensity value found for each class and also represents the average integer value of that class. Therefore, the sides of the shapes created inside the decagon denote the intensity differences between the classes, instead of the average values themselves as in a pie chart. To emphasise further the user-interaction with the page, once the cursor hovers over one of the ten rectangles, a small legend appears holding additional information for the movement that was found. The legend holds the four labels present, as well as the precise intensity of each event in that period (up to the two most important floating points). These rectangles represent the borders (upper and lower values) of the class, and they also demonstrate the variations in the average intensity values between the two neighbouring classes. They are defined as the shape produced by the two halves of two consecutive sides, by the two radius from the centre of the shape to the end-points of the side-half. In the case of missing examples between two observations that are separated by a class with a reasonable amount of information, the class is displayed as a line from the centre of the shape until the related intensity is reached. This is done in order to indicate that there is no relation between the previous and the next class, since no examples between the two values representing the equivalent time-slots are present in the data. The shape, as well as the legend are dynamically generated by the system and therefore can be manipulated if different data are to be used, as well as classes. The visualisation of Figure 5 also illustrates that the majority of Charlie’s students around Second 14 look down. With this specific visualisation, Charlie also easily notices that Seconds 3, 4, 5 and 6 might be subject to further investigation regarding game ludology. The full version of the overall head movement visualisation is available at: http://83.212.117.19/IntensityGrid/.

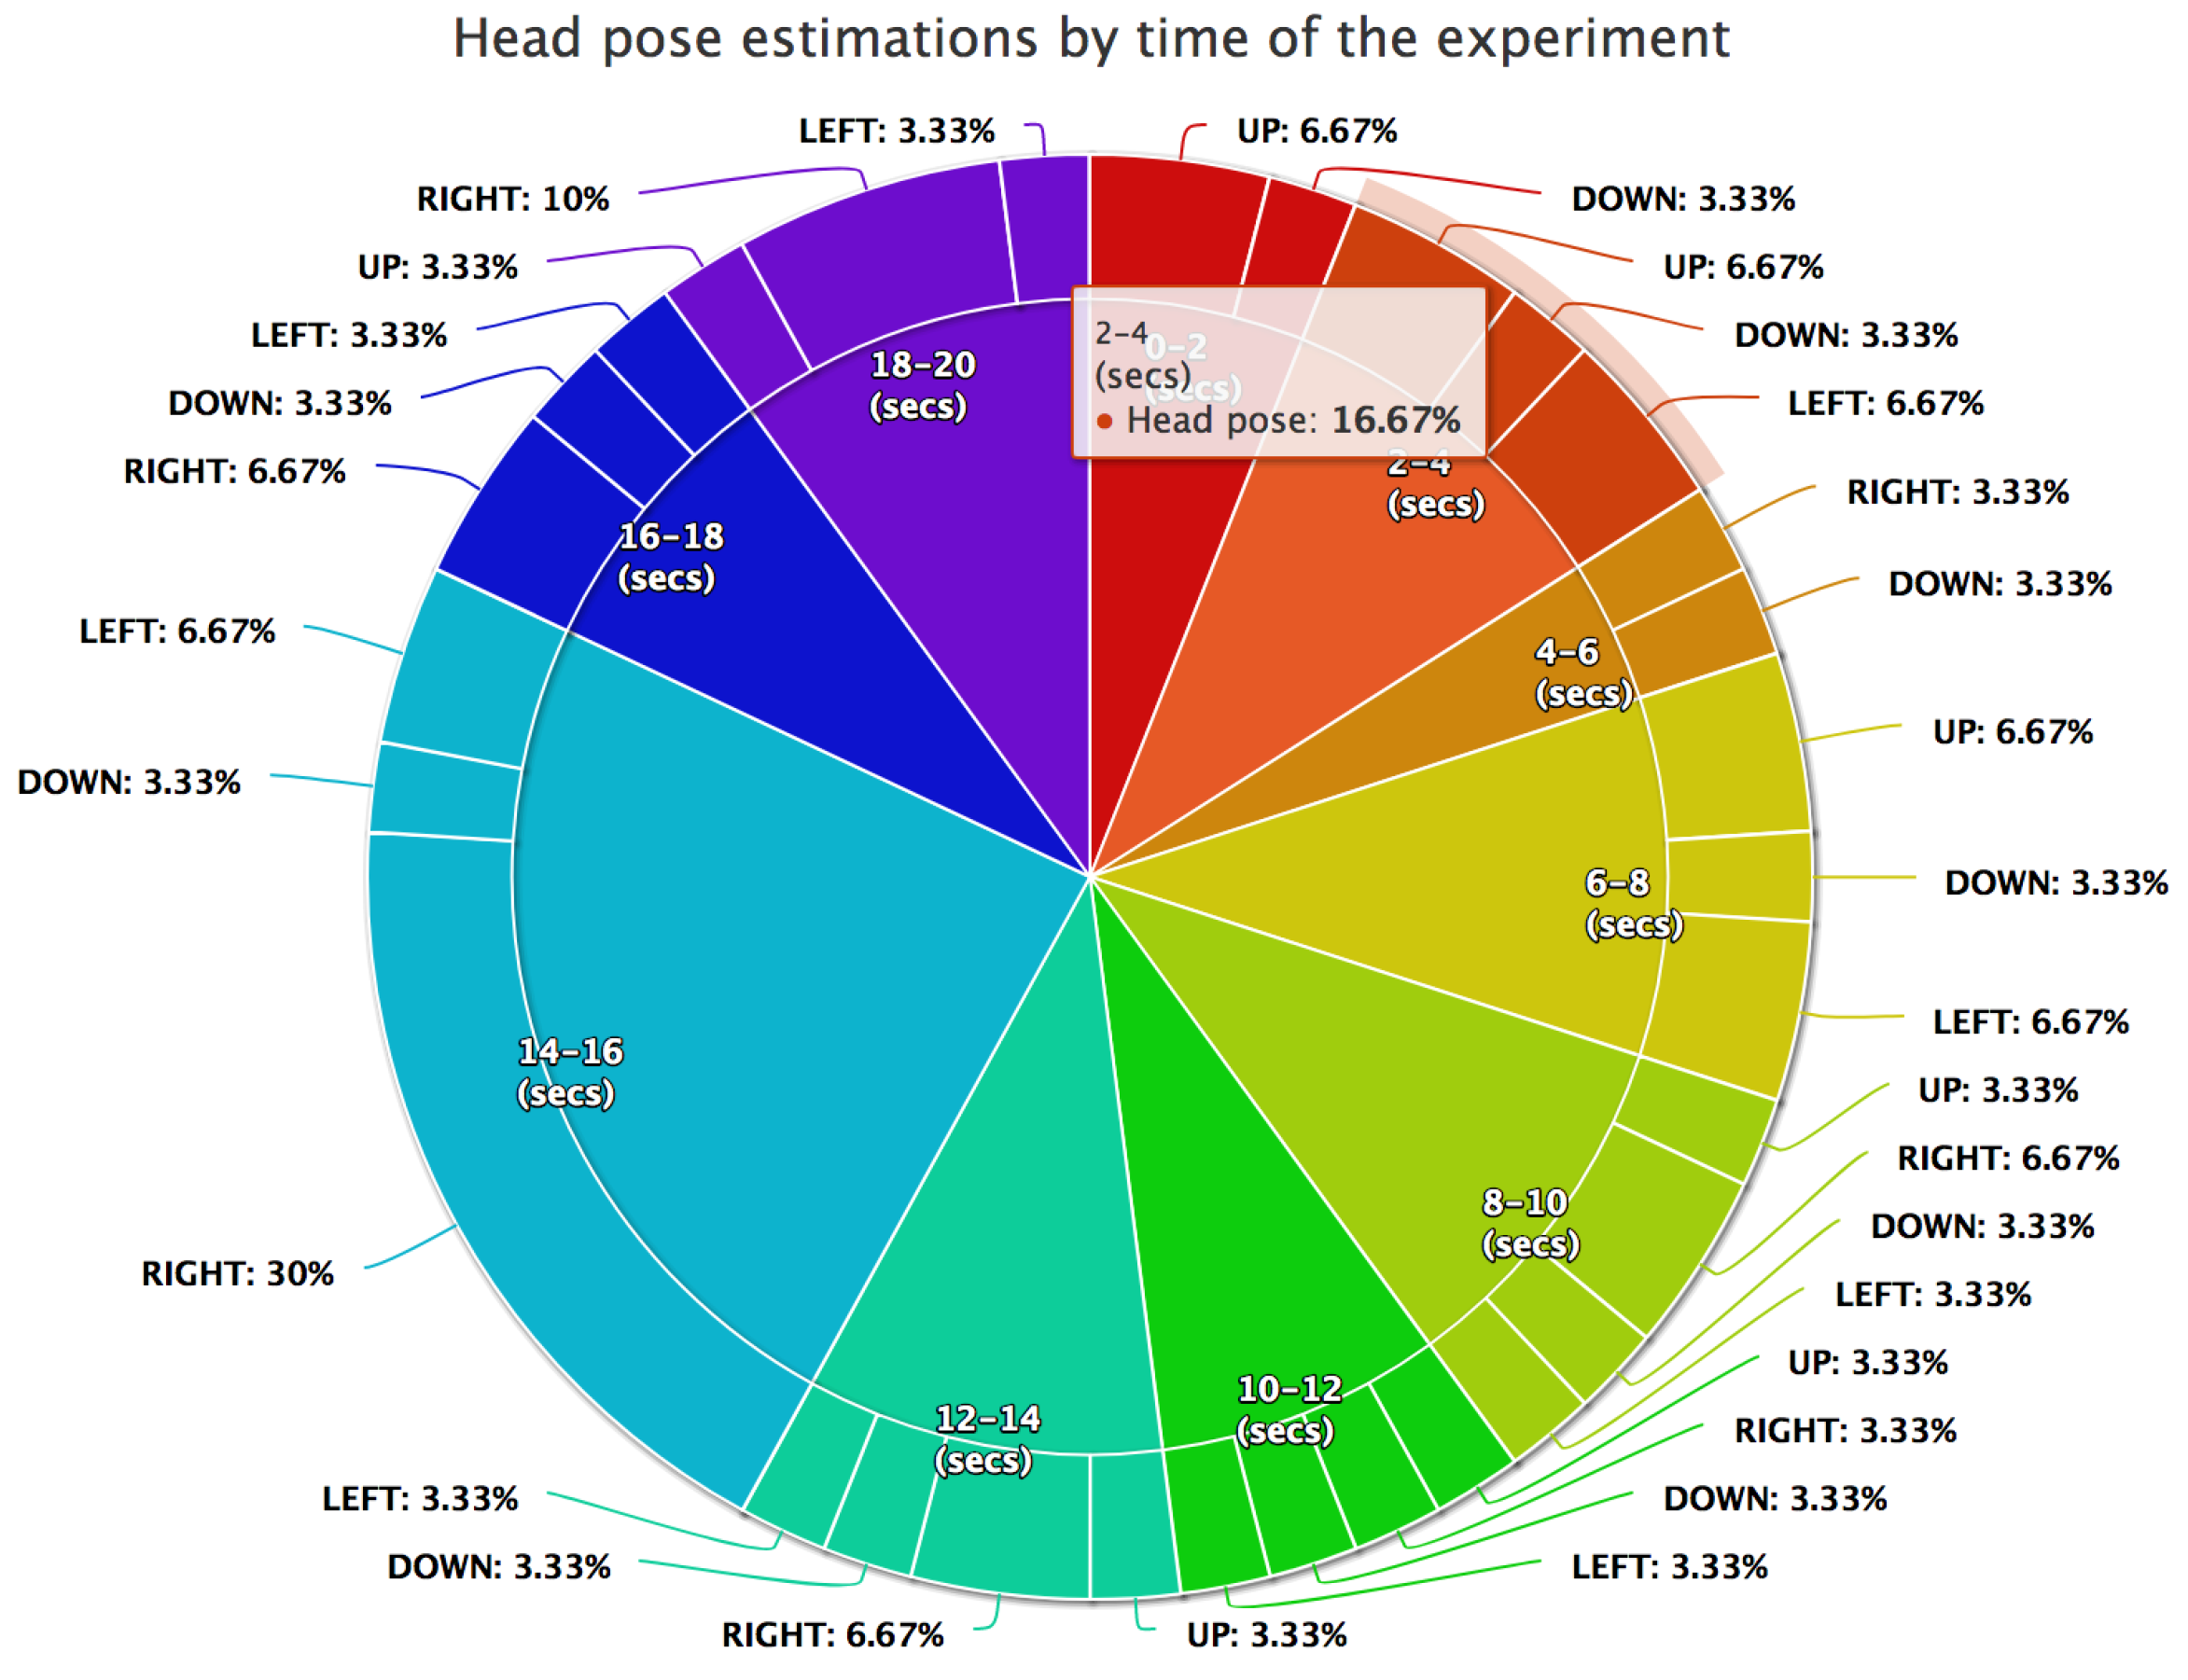
4.2.4. Head Pose Changes Grouped by Proportion of the Direction

Another widely used visualisation is the pie chart. In order to accommodate both attributes of our experiments (time in seconds and the estimated head pose direction), the pie consists of two layers, as shown in Figure 6. This structure allows a broader view of the experiments and the data since a batch of variables is used instead of a single one. The internal circle consists of the time classes as determined in previous illustrations, as well. The information presented to the user at this level is primarily focused on the distribution of the data based on the experiment durations. Durations that are centred around smaller values are expected to hold larger confidence than others with larger time values. Therefore, when analysing the shape produced, the user would prefer to see a high concentration of short time examples. The external circle consists of the recognition directions that each internal time class includes. Furthermore, if experiments do not hold any examples of a head pose, this will be shown in the chart. In addition to examples that were not present in the class, this visualisation can furthermore show over-represented or under-represented examples in a similar way as the emotion detection punch card (Figure 7). With this visualisation, Charlie can easily observe that Seconds 14–16 might be subject to further investigation regarding game ludology. The full version of the overall head movement visualisation is available at: http://83.212.117.19/PieChart/.

4.3. Emotions

The web-based visualisations regarding the recognised emotions via facial expressions is assembled in accordance with head pose changes. For the case of interpreting emotions in the context of various applications, three different visualisations are introduced in Figure 7, Figure 8 and Figure 9. First, a punch card table is presented in order to represent emotion changes across the time intervals of our experiments. After that, a column visualisation depicting the overall facial expression changes grouped by the resulting emotion is presented. Finally, emotions grouped by specific time intervals are illustrated in the form of a class connection circle.

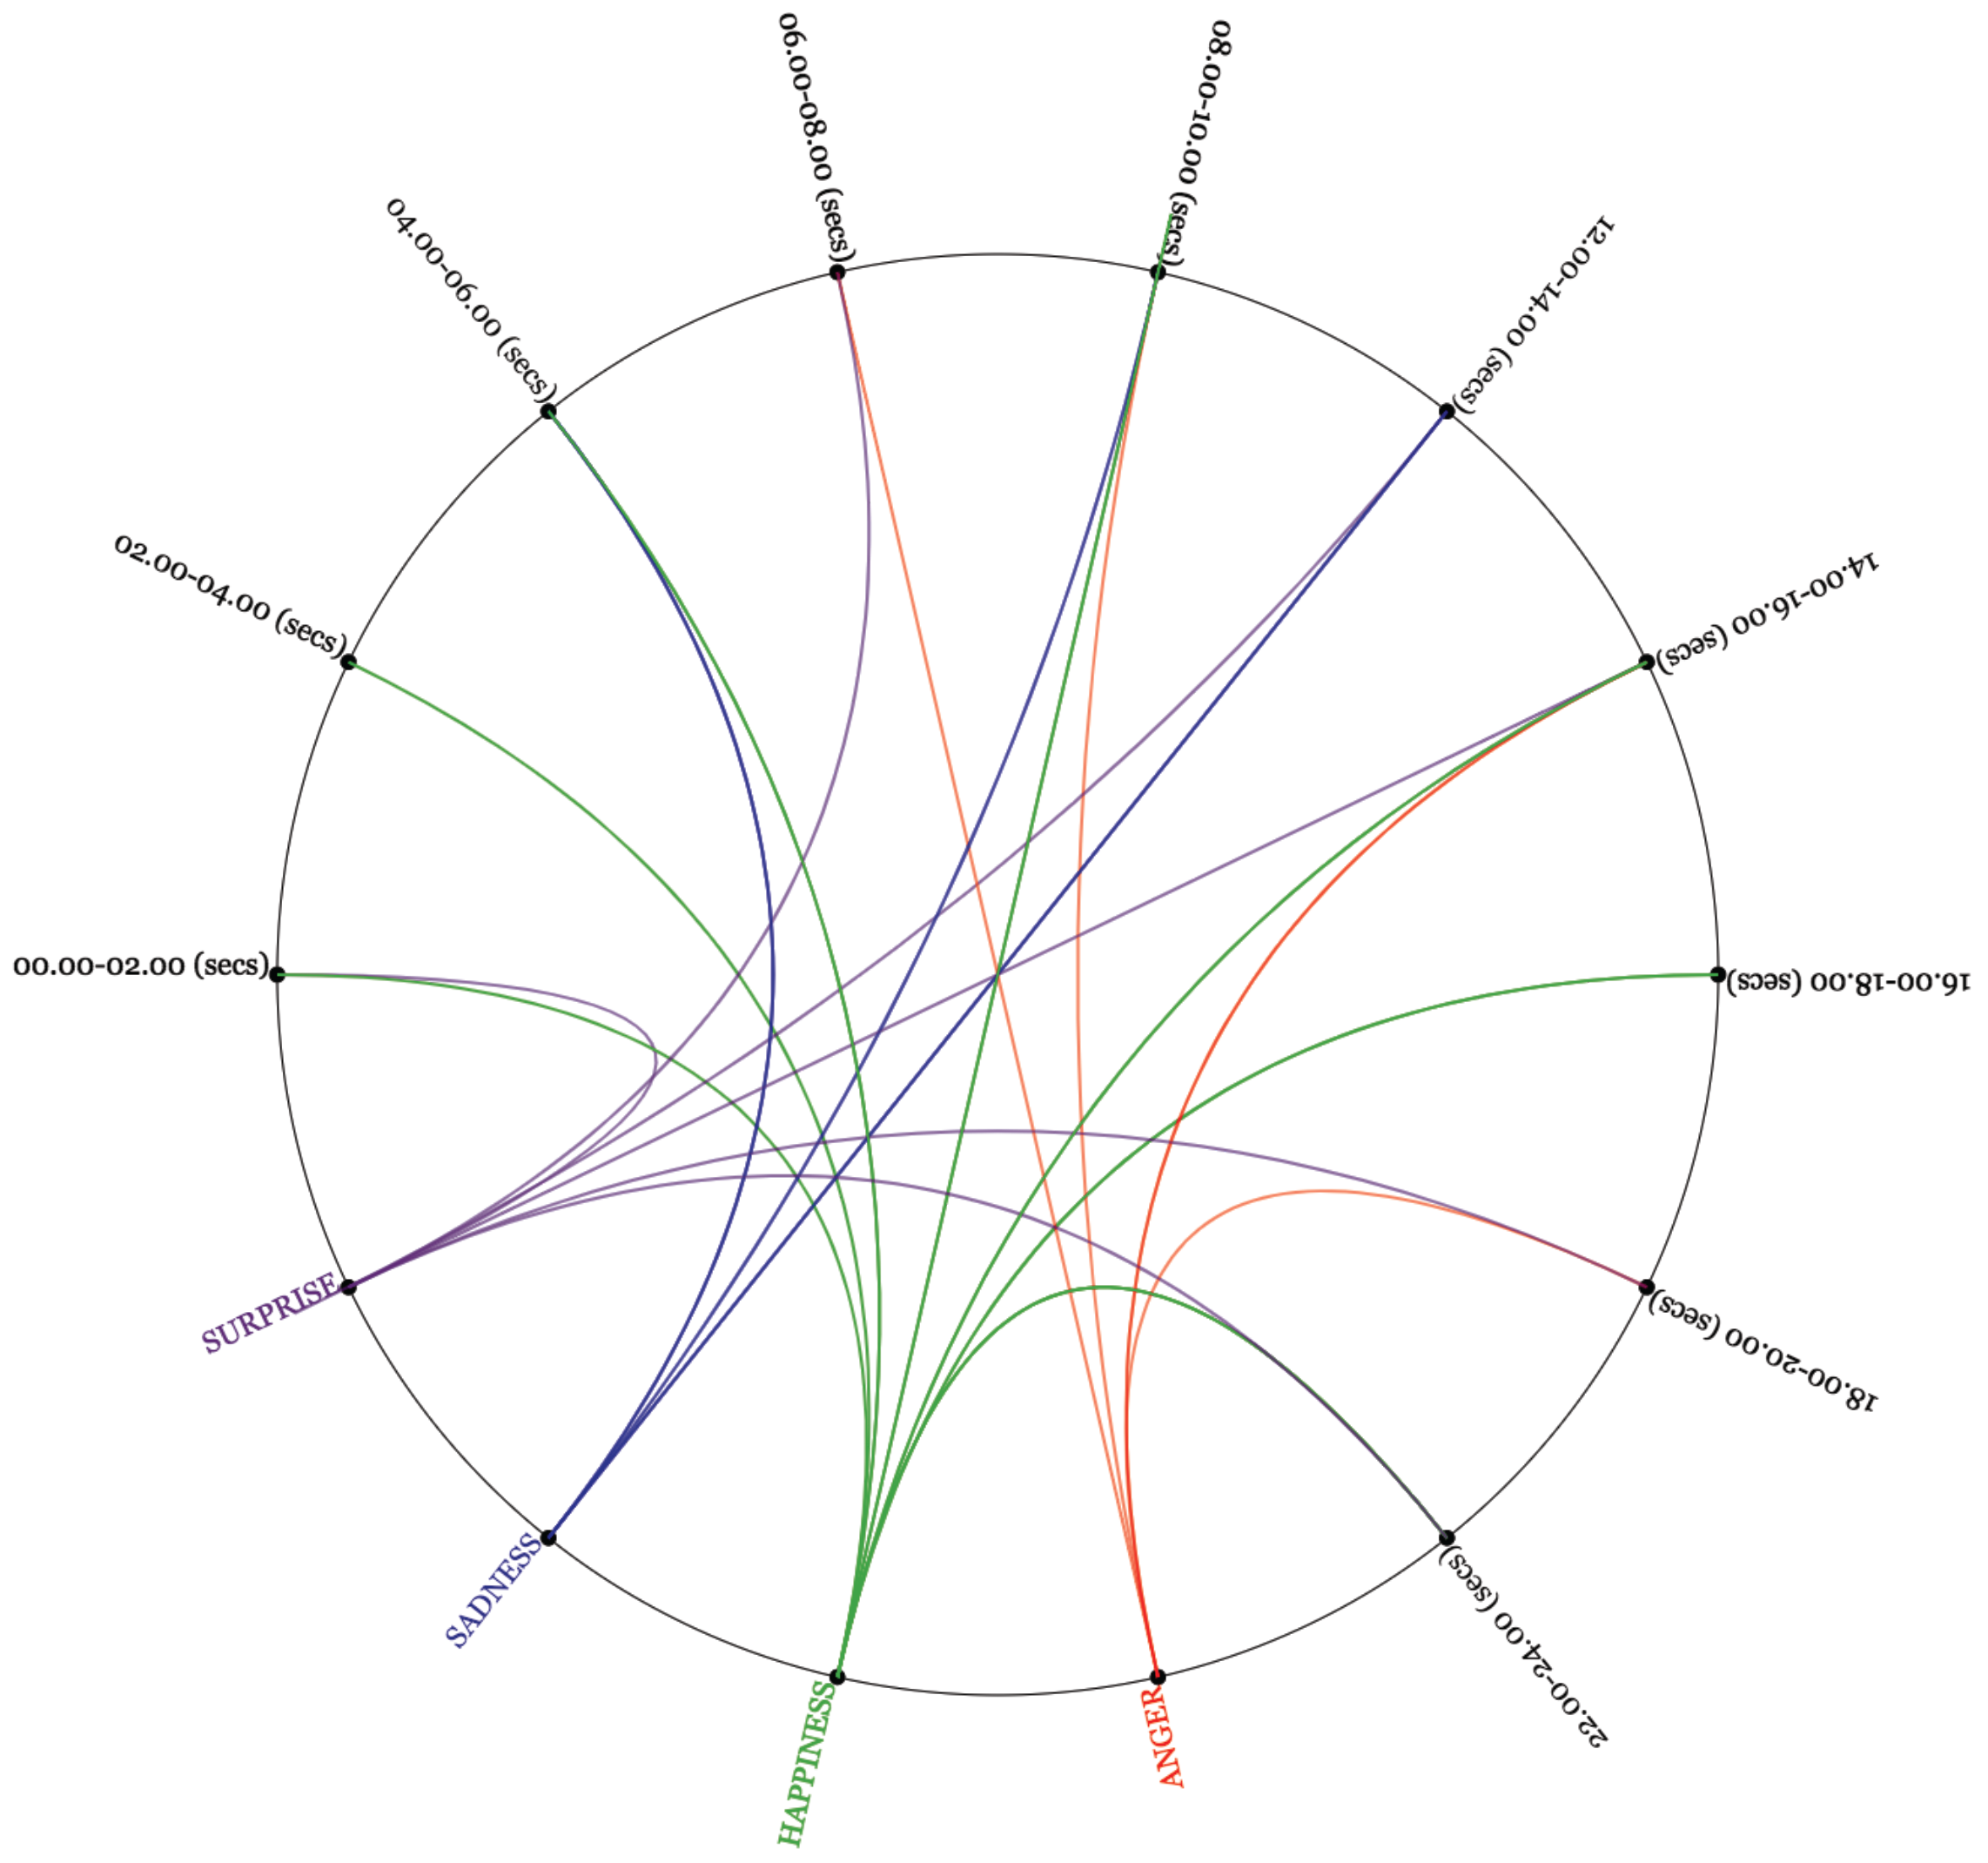
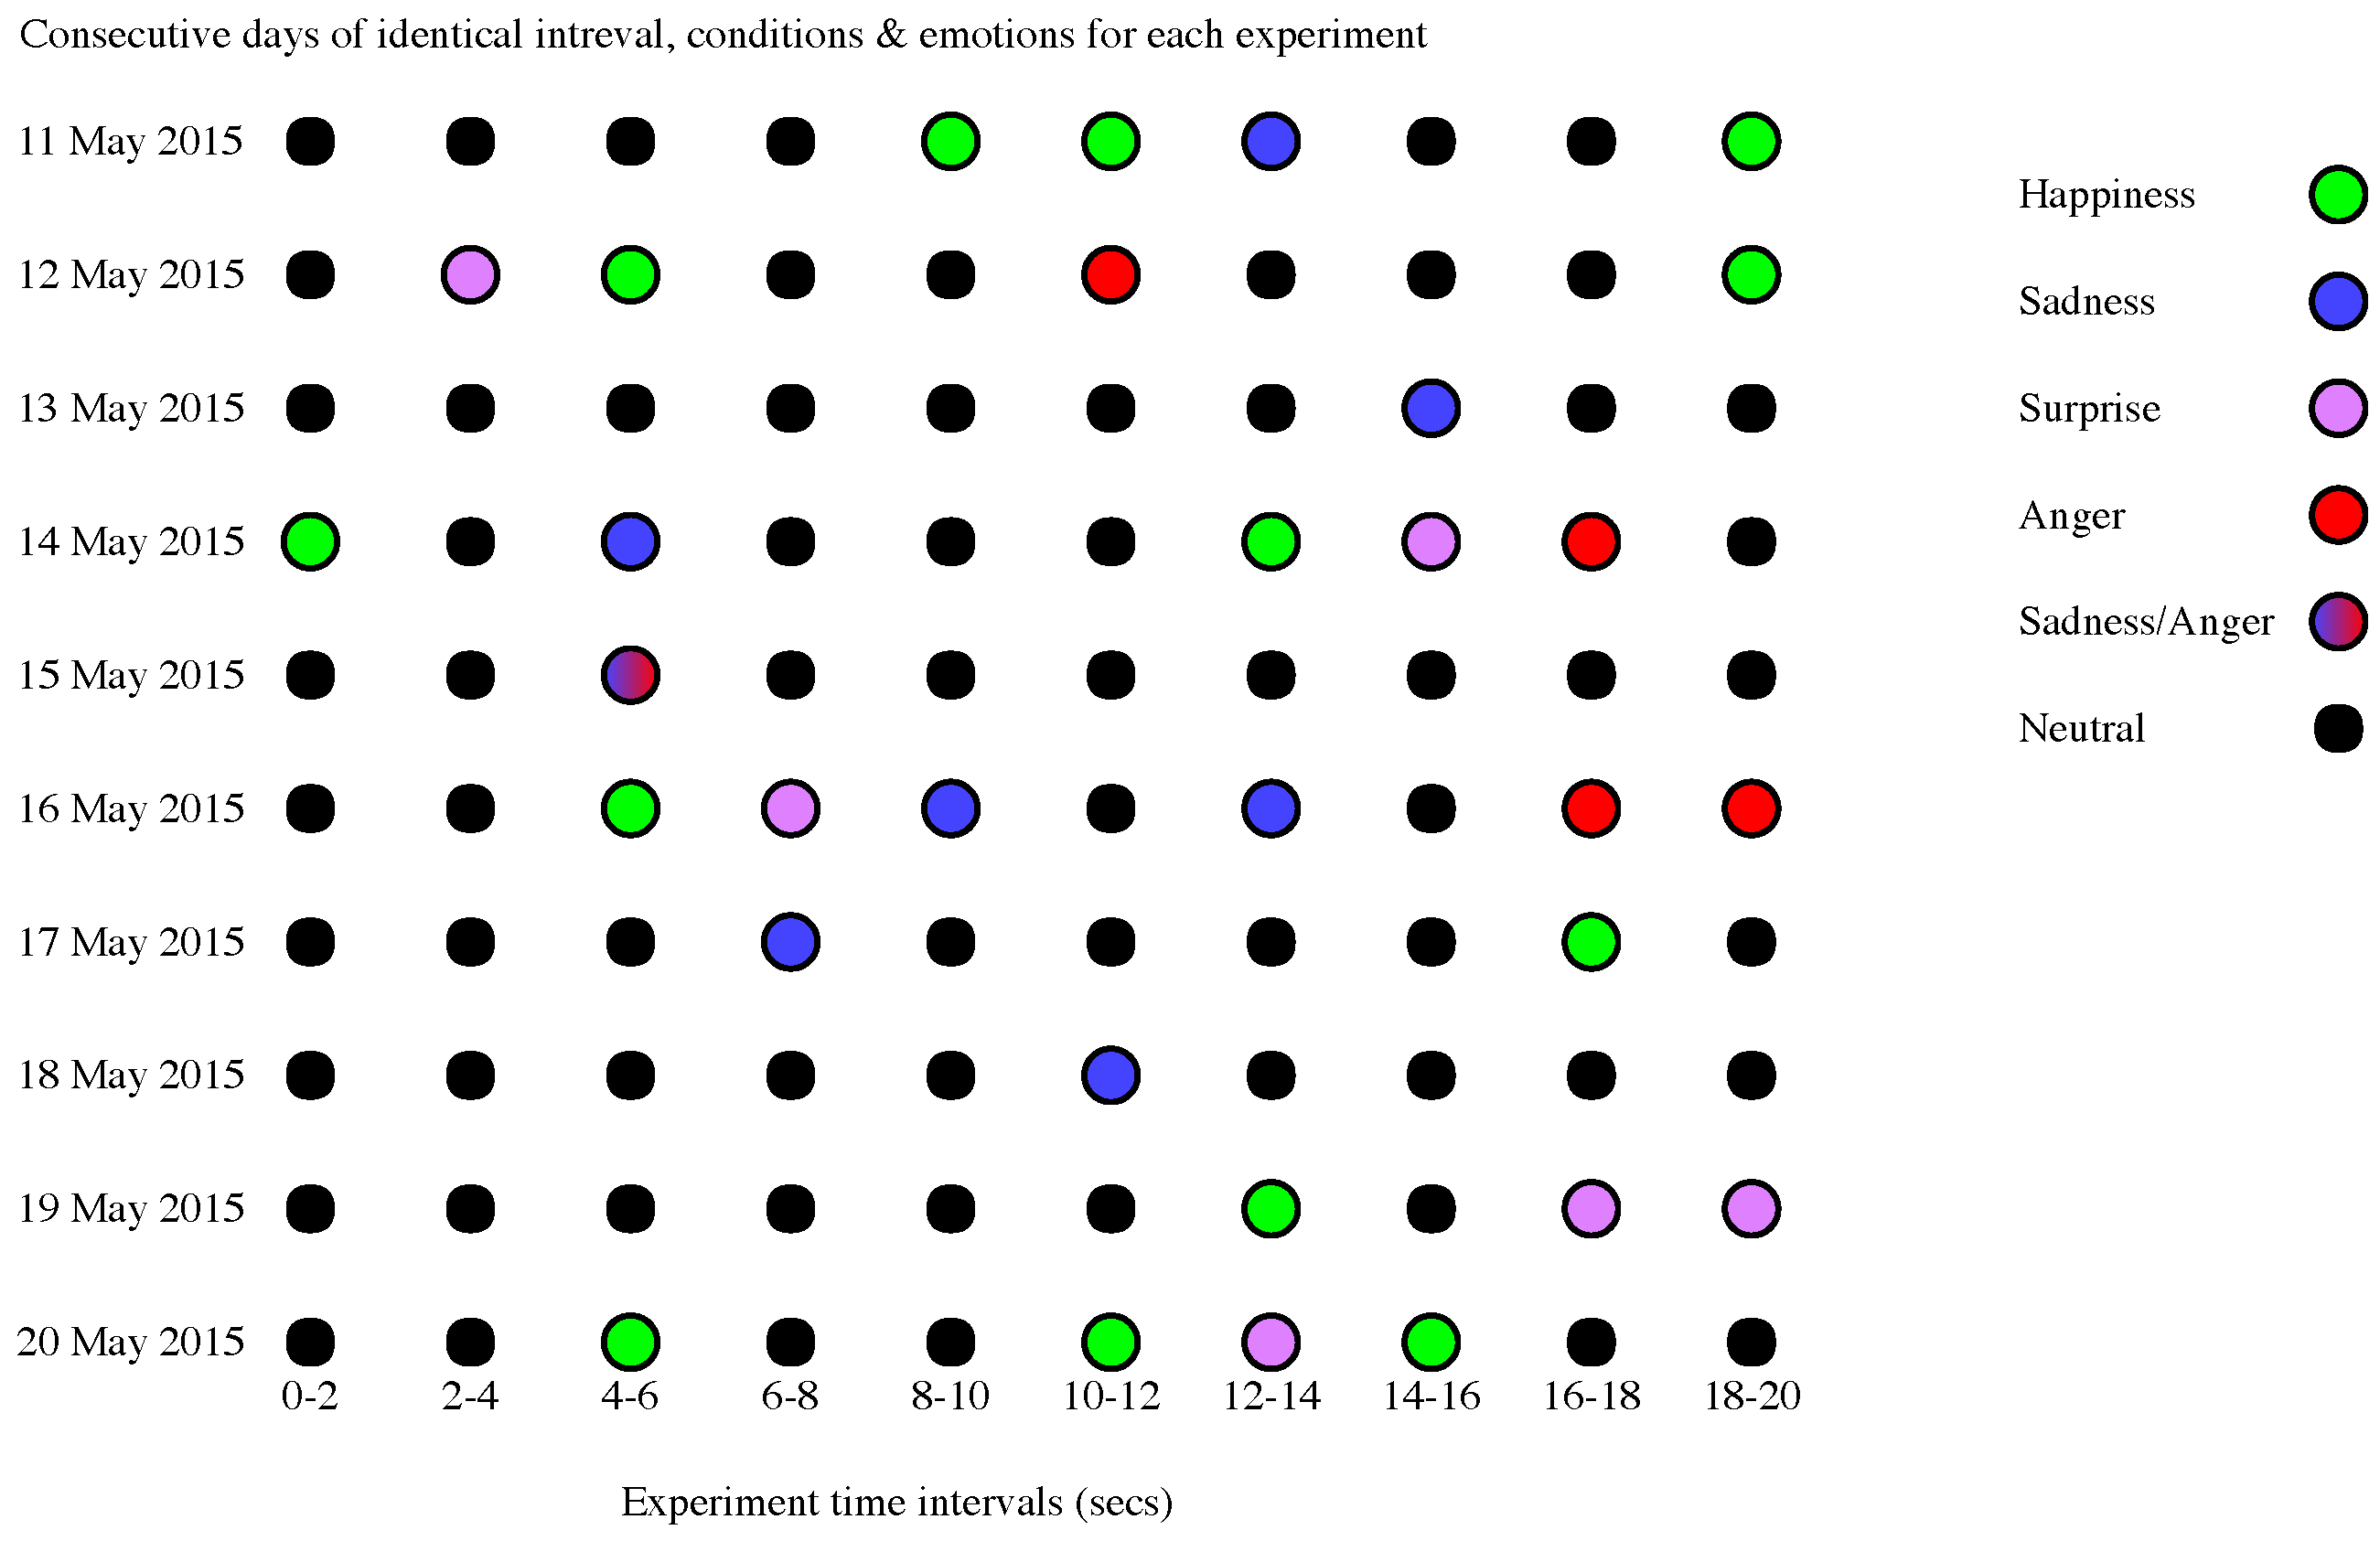
4.3.1. Emotion Changes across Time

A straightforward way of representing the emotions detected by the main system in comparison to the date and duration of the experiment is the use of a two-dimensional punch card. The y-axis of the card is used to set the epoch of each experiment, while the x-axis specifies the duration that the experiment was conducted as time intervals, as shown in Figure 7. This allows the users to find the total number of tests that were carried out on a specified date, but also the order in which these experiments were conducted. The outcomes of the experiments ranged across four main classes (happiness, sadness, surprise and anger) with an additional “combination” class, which was used to represent the recognition of emotions in a pair (sadness and anger). Since this approach utilises the capabilities of data representation in 2D-space, a viewer can furthermore find the times that most observations occurred in the data provided.
The reason behind the choice of the punch card table is the fact that the user’s emotions can be tracked through time, and also, motifs can emerge from the data. For example, by observing the punch card, it can be found which pairs of emotions are probable to occur together or are expected to be found. With the combination of the data about the tasks or actions preformed by the user, possible future emotional reactions can be predicted on related tasks. These patterns can be an essential part of the recognition process in a way that they can show the emotion(s) that can be expected for a user to display at a particular time period and by performing a specific action, taking into account the previous emotion distributions. Furthermore, with respect to the task/event that was carried out by the user during an experiment, emotions that cause a large variation in the emotional state of the person can be interpreted by the system and visualised as how the person reacts to the occasion.
Moreover, if a combination of emotions is detected for a distinct experiment date, the data are shown as a gradient of the two emotions. This is done to distinguish (as is also achieved by the bar chart) the cases in which the method used produces poor correlation results. Therefore, if the recognition process produces a dual emotion class in which the two combinational emotions are not sufficiently related, to a certain degree, it could be interpreted as a poor choice of recognition method. The punch card table visualisation shows that at Second 14, 50%–70% have neutral feelings, 10%–20% feel sad, 10% feel surprised and 10%–20% feel happy. Thus, Charlie’s students show practically very low interest in the game or feel sad about it. Only a small number feels happy. Charlie, by combining knowledge gained from the head pose visualisations and the emotion change visualisations can safely assume that head pose down means very limited interest in the game. These types of knowledge provide Charlie the necessary means to enhance his educational games, i.e., his professional applications. The full version of the emotion changes across time visualisation is available at: http://83.212.117.19/PunchCard/.

4.3.2. Facial Expressions Grouped by Emotion

The second visualisation consists of a column diagram (similar to the one used for head pose changes in Figure 4), which illustrates the aggregation of all facial expressions grouped by the resulting emotions for every two seconds. Figure 8 displays only two emotions, happiness and anger. However, the rest of the recognised emotions can be set visible by clicking the corresponding check-box. The four different emotions are represented by four different colours. On one hand, the x-axis represents the time scale, which is divided every two seconds until the end of the test. On the other hand, the y-axis displays the number of recognised emotions for all of the users that take part in the tests. Furthermore, when hovering above a column, the number of the corresponding emotions’ summary is displayed. Figure 8 shows that Charlie’s students at a game time range of 10–12 s feel angry. The visualisation is not exactly in line with the rest of the visualisations, as it shows negative feelings two seconds before. Nevertheless, the time difference of two seconds is considered minimal, and Charlie can safely draw his assumption about the game, the head pose meaning and the emotions changes while students play his educational game. The full version of the visualisation concerning facial expressions grouped by emotion is available at: http://83.212.117.19/FacialExpression3D/.

4.3.3. Emotions Grouped by Time Intervals

The final depiction method chosen for understanding emotion changes is the class connections circle. Each emotion detected is represented as a point with a distinct colour at the bottom quarter of the shape, while each experiment time is categorised similarly to the previous classes in the other visualisations. To show the recognised emotion during a period of an experiment, a line is drawn between the point that holds the time class in interest and the emotion assigned to it. The final graph produced by the process depicts the association between the durations and the emotions that were recognised at the time of the experiments.
This visualisation was implemented as an additional method for the emotion punch card as the correlation between emotions could not be fully interpreted in that case. By combining these two illustration techniques, a possible user can have a wider view not only of the emotions recognised based on specific time intervals, but also how the emotions and durations of the experiments are correlated. The most essential information piece that can be portrayed in this graph is how different emotion classes coexist with time classes. This allows the user to understand if a particular incident occurring at a specific time (considering the fact that the data come for identical experiments performed on each date) would have a positive or negative effect on the psychology of the person and the way that this will transpire. For example, taking the 06.00–08.00 class, it is clear that the two emotions recorded, are related to negative/unpleasant emotions since the user was identified to be angry and surprised. Through the constant observation of the sentiments and the order they have been conducted in different durations, a general estimation of human reactions can be drawn based on the event to which the person who participated in the example was exposed. In addition, the lines connecting the two points can also be viewed as the links between the durations and the emotions, and if the intensity is required to be shown as well, the line’s colour may be based on a variable that is to be determined in relation to the experiment’s intensity. Figure 9 confirms that the majority of Charlie’s students mostly feel sad at the game time range of 12–14 s. This visualisation affirms the assumption that head pose down represents a negative player-student-user feeling and that something must be changed around game play time Seconds 12–14 in order for Charlie to enhance the user experience. The full version of the emotions grouped by time intervals visualisation is available at: http://83.212.117.19/IntensityCircle/.

5. Conclusions and Future Work

To advance the field of human activity analysis, we need mechanisms capable of externalising the facts and enabling people to manipulate the findings of human activity monitoring tasks at a higher level. In this work, we propose seven different web-based visualisations that can help tame the scale and complexity of the depth data collected for the purpose of monitoring head pose and emotion changes. All visualisations and other data, as well as the source code are publicly available online.
An interesting future direction would be to investigate real-time fusion of the two frameworks, while future works include going beyond basic player monitoring to study if the actions taken by an educator have resulted in further changes in the mood of the players, in the context of a serious game. Another direction would be to to analyse if the aforementioned mood changes would produce different results in the performance of the players. Finally, an evaluation of all different visualisations presented in this article is in our immediate research plans.

Author Contributions

Grigorios Kalliatakis and Nikolaos Vidakis conceived of and designed the experiments. Grigorios Kalliatakis performed the experiments and analysed the results, whereas Alexandros Stergiou contributed to the design and analysis of the proposed visualisations. Grigorios Kalliatakis, Alexandros Stergiou and Nikolaos Vidakis wrote the paper. All authors contributed to the discussion and revision of the manuscript.

Conflicts of Interest

The authors declare no conflict of interest.

References

  1. Kalliatakis, G.; Vidakis, N.; Triantafyllidis, G. Web-based visualisation of head pose and facial expressions changes: Monitoring human activity using depth data. In Proceedings of the 8th Computer Science and Electronic Engineering (CEEC), Colchester, UK, 28–30 September 2016; pp. 48–53. [Google Scholar] [CrossRef]
  2. Kalliatakis, G.; Triantafyllidis, G.; Vidakis, N. Head pose 3D data web-based visualization. In Proceedings of the 20th International Conference on 3D Web Technology (Web3D ’15), Heraklion, Greece, 18–21 June 2015; ACM: New York, NY, USA, 2015; pp. 167–168. [Google Scholar] [CrossRef]
  3. Murphy-Chutorian, E.; Trivedi, M.M. Head Pose Estimation in Computer Vision: A Survey. IEEE Trans. Pattern Anal. Mach. Intell. 2009, 31, 607–626. [Google Scholar] [CrossRef] [PubMed]
  4. Breitenstein, M.D.; Kuettel, D.; Weise, T.; van Gool, L.; Pfister, H. Real-time face pose estimation from single range images. In Proceedings of the 2008 IEEE Conference on Computer Vision and Pattern Recognition, Anchorage, AK, USA, 23–28 June 2008; pp. 1–8. [Google Scholar] [CrossRef]
  5. Fanelli, G.; Gall, J.; Van Gool, L. Real time head pose estimation with random regression forests. In Proceedings of the 2011 IEEE Conference on Computer Vision and Pattern Recognition (CVPR), Colorado Springs, CO, USA, 20–25 June 2011; pp. 617–624. [Google Scholar] [CrossRef]
  6. Padeleris, P.; Zabulis, X.; Argyros, A.A. Head pose estimation on depth data based on Particle Swarm Optimization. In Proceedings of the 2012 IEEE Computer Society Conference on Computer Vision and Pattern Recognition Workshops, Providence, RI, USA, 16–21 June 2012; pp. 42–49. [Google Scholar] [CrossRef]
  7. Wu, Y.; Liu, H.; Zha, H. Modeling facial expression space for recognition. In Proceedings of the 2005 IEEE/RSJ International Conference on Intelligent Robots and Systems, Edmonton, AB, Canada, 2–6 August 2005; pp. 1968–1973. [Google Scholar] [CrossRef]
  8. Anil, J.K.; Li, S.Z. Handbook of Face Recognition; Springer: New York, NY, USA, 2011. [Google Scholar]
  9. Fang, T.; Xi, Z.; Ocegueda, O.; Shah, S.K.; Kakadiaris, I.A. 3D facial expression recognition: A perspective on promises and challenges. In Proceedings of the 2011 IEEE International Conference on Automatic Face & Gesture Recognition and Workshops (FG 2011), Santa Barbara, CA, USA, 21–25 March 2011; pp. 603–610. [Google Scholar]
  10. Xue, M.; Mian, A.; Liu, W.; Li, L. Fully automatic 3D facial expression recognition using local depth features. In Proceedings of the 2014 IEEE Winter Conference Applications of Computer Vision (WACV), Steamboat Springs, CO, USA, 24–26 March 2014; pp. 1096–1103. [Google Scholar]
  11. Azazi, A.; Lutfi, S.L.; Venkat, I. Analysis and evaluation of SURF descriptors for automatic 3D facial expression recognition using different classifiers. In Proceedings of the 2014 Fourth World Congress on Information and Communication Technologies (WICT), Malacca, Malaysia, 8–10 December 2014; pp. 23–28. [Google Scholar]
  12. Kim, B.-K.; Roh, J.; Dong, S.-Y.; Lee, S.-Y. Hierarchical committee of deep convolutional neural networks for robust facial expression recognition. J. Multimodal User Interfaces 2016, 2, 173–189. [Google Scholar] [CrossRef]
  13. Zhen, Q.; Huang, D.; Wang, Y.; Chen, L. Muscular Movement Model-Based Automatic 3D/4D Facial Expression Recognition. IEEE Trans. Multimed. 2016, 18, 1438–1450. [Google Scholar] [CrossRef]
  14. Siddiqi, M.H.; Ali, R.; Khan, A.M.; Kim, E.S.; Kim, G.J.; Lee, S. Facial expression recognition using active contour-based face detection, facial movement-based feature extraction, and non-linear feature selection. Multimed. Syst. 2015, 21, 541–555. [Google Scholar] [CrossRef]
  15. Fang, T.; Zhao, X.; Ocegueda, O.; Shah, S.K.; Kakadiaris, I.A. 3D/4D facial expression analysis: An advanced annotated face model approach. Image Vis. Comput. 2012, 30, 738–749. [Google Scholar] [CrossRef]
  16. Mulrow, E.J. The visual display of quantitative information. Technometrics 2002, 44, 400. [Google Scholar] [CrossRef]
  17. Jang, Y.M.; Mallipeddi, R.; Lee, S.; Kwak, H.W.; Lee, M. Human intention recognition based on eyeball movement pattern and pupil size variation. Neurocomputing 2014, 128, 421–432. [Google Scholar] [CrossRef]
  18. Youn, S.-J.; Oh, K.-W. Intention recognition using a graph representation. World Acad. Sci. Eng. Technol. 2007, 25, 13–18. [Google Scholar]
  19. Vidakis, N.; Vlasopoulos, A.; Kounalakis, T.; Varchalamas, P.; Dimitriou, M.; Kalliatakis, G.; Syntychakis, E.; Christofakis, J.; Triantafyllidis, G. Multimodal desktop interaction: The face-object-gesture-voice example. In Proceedings of the 2013 18th IEEE International Conference on Digital Signal Processing (DSP), Fira, Greece, 1–3 July 2013; pp. 1–8. [Google Scholar]
  20. Vidakis, N.; Syntychakis, E.; Kalafatis, K.; Christinaki, E.; Triantafyllidis, G. Ludic Educational Game Creation Tool: Teaching Schoolers Road Safety. In Proceedings of the 9th International Conference on Universal Access in Human-Computer Interaction, Los Angeles, CA, USA, 2–7 August 2015; Springer: Cham, Switzerland, 2015; pp. 565–576. [Google Scholar]
  21. Vidakis, N.; Christinaki, E.; Serafimidis, I.; Triantafyllidis, G. Combining ludology and narratology in an open authorable framework for educational games for children: The scenario of teaching preschoolers with autism diagnosis. In Proceedings of the International Conference on Universal Access in Human-Computer Interaction, Heraklion, Greece, 22–27 June 2014; Springer: Cham, Switzerland, 2014; pp. 626–636. [Google Scholar]
  22. Schurgin, M.W.; Nelson, J.; Iida, S.; Ohira, H.; Chiao, J.Y.; Franconeri, S.L. Eye movements during emotion recognition in faces. J. Vis. 2014, 14, 14. [Google Scholar] [CrossRef] [PubMed]
  23. Salgado, A. The facial and vocal expression in singers: A cognitive feedback study for improving emotional expression in solo vocal music performance. Electr. Musicol. Rev. 2005, 9. [Google Scholar]
  24. Neidle, C.; Liu, J.; Liu, B.; Peng, X.; Vogler, C.; Metaxas, D. Computer-based tracking, analysis, and visualization of linguistically significant nonmanual events in American Sign Language (ASL). In Proceedings of the LREC Workshop on the Representation and Processing of Sign Languages: Beyond the Manual Channel, Reykjavik, Iceland, 31 May 2014; Volume 5, pp. 127–134. [Google Scholar]
  25. Patwardhan, A. Edge Based Grid Super-Imposition for Crowd Emotion Recognition. Int. Res. J. Eng. Technol. 2016, 3, 459–463. [Google Scholar]
  26. Alioua, N.; Amine, A.; Bensrhair, A.; Rziza, M. Estimating driver head pose using steerable pyramid and probabilistic learning. Int. J. Comput. Vis. Robot. 2015, 5, 347–364. [Google Scholar] [CrossRef]
  27. Vatahska, T.; Bennewitz, M.; Behnke, S. Feature-based head pose estimation from images. In Proceedings of the 2007 7th IEEE-RAS International Conference on Humanoid Robots, Pittsburgh, PA, USA, 29 November–1 December 2007; pp. 330–335. [Google Scholar]
  28. Kalliatakis, G. Towards an Automatic Intelligible Monitoring of Behavioral and Physiological Metrics of User Experience: Head Pose Estimation and Facial Expression Recognition. Master’s Thesis, Department of Applied Informatics and Multimedia, School of Applied Technology, Technological Educational Institute of Creece, Athens, Creece, August 2015. [Google Scholar]
  29. Fanelli, G.; Weise, T.; Gall, J.; Van Gool, L. Real time head pose estimation from consumer depth cameras. In Joint Pattern Recognition Symposium; Springer: Berlin/Heidelberg, Germany, 2011; pp. 101–110. [Google Scholar]
  30. Fanelli, G.; Dantone, M.; Gall, J.; Fossati, A.; Van Gool, L. Random forests for real time 3D face analysis. Int. J. Comput. Vis. 2013, 101, 437. [Google Scholar] [CrossRef]
  31. Tian, Y.-I.; Kanade, T.; Cohn, J.F. Recognizing action units for facial expression analysis. IEEE Trans. Pattern Anal. Mach. Intell. 2001, 23, 97–115. [Google Scholar] [CrossRef] [PubMed]
  32. Mao, Q.-R.; Pan, X.-Y.; Zhan, Y.-Z.; Shen, X.-J. Using Kinect for real-time emotion recognition via facial expressions. Front. Inf. Technol. Electr. Eng. 2015, 16, 272–282. [Google Scholar] [CrossRef]
  33. Microsoft, Face Tracking SDK Documentation. Available online: https://msdn.microsoft.com/en-us/library/jj130970.aspx (accessed on 30 May 2017).
  34. Ahlberg, J. Candide-3-An Updated Parameterised Face. 2001. Available online: http://citeseerx.ist.psu.edu/viewdoc/download?doi=10.1.1.33.5603rep=rep1type=pdf (accessed on 21 July 2017).
  35. Lin, B.; Chen, Y.; Chen, X.; Yu, Y. Comparison between JSON and XML in Applications Based on AJAX. In Proceedings of the 2012 IEEE International Conference on Computer Science and Service System (CSSS), Nanjing, China, 11–13 August 2012; pp. 1174–1177. [Google Scholar]
Figure 1. Some processed frames regarding two DOFs (pitch and yaw), as shown by the main application window for estimating head pose changes. Starting from left to right, the first row of estimations displayed comprises “still”, “up” and “down”. The second row of estimations comprises “left” and “right”, accordingly. The green cylinder encodes both the estimated head center and the direction of the face.
Computers 06 00025 g001
Figure 2. Facial expression recognition (FER) results.
Computers 06 00025 g002
Figure 3. Scatterplot visualisation of head pose changes. Four different arrows imitate the head movement for two DOFs. Colour fluctuation serves as intensity indicators for each movement (the closer to the red colour the arrow is, the higher the intensity of the movement).
Computers 06 00025 g003
Figure 4. Column visualisation of head pose changes.
Computers 06 00025 g004
Figure 5. Intensity chart with time intervals clustered and displayed as labels.
Computers 06 00025 g005
Figure 6. Two-layer pie chart with time intervals clustered and displayed as labels in the centred pie and the recognised head pose population percentages at the external layer.
Computers 06 00025 g006
Figure 7. Punch card table based on the time and date of the experiment.
Computers 06 00025 g007
Figure 8. Column visualisation of two detected emotions, “happiness” and “anger”.
Computers 06 00025 g008
Figure 9. Circular emotion detection results based on the duration of the experiments and segmented to time classes with a fixed class margin of two.
Computers 06 00025 g009

