1. Introduction
Breast cancer is one of the prominent reasons for deaths of women, and according to a 2016 estimate [
1], 61,000 new cases of breast cancer are predicted. If breast cancer [
2] is detected earlier through mammographic screening then the chances of survival are greater than 90%. To diagnosis breast cancer, the digital screening mammography [
3] is extensively utilized by radiologists as the most reliable and cost-effective method. For radiologists, the detection or interpretation of breast masses through digital mammography [
4] is a time-consuming task. Furthermore, the ability of mammography is limited in extremely dense breasts and detection accuracy is as low as 60%–70% [
5]. In this way, the computer-aided diagnosis (CAD) systems are advanced to support radiologists for the identification of benign and malignant masses. In the literature, there are many studies that suggested incorporating the CAD system [
6,
7,
8] into the diagnostic process of screening breast images. This step can increase the performance of routine diagnosis by decreasing inter-observer variation and providing the quantitative support for the clinical decisions. The current paper designates an effort to automatically develop a CAD system for early detection of breast masses by using new features and machine learning techniques to assist radiologists.
The identification of benign and malignant masses in digital mammograms [
9] through a CAD system is one of the most important processes for radiologists due to the analysis of various breast tissue structures. An accurate classification allows medical experts to accurately differentiate [
10,
11] between benign and malignant masses. Unfortunately, the classification step is difficult due to the overlap between dense breast tissue and irregular mass shape. Moreover, the existing classification methods focused on extraction the features with performing pre- or post-processing steps. Therefore, the primary aim of this paper is to develop an improved CAD system for effective diagnosis of breast masses. In the next section, the review and background of this study are discussed in detail.
2. Review and Background
Several computer-aided diagnosis (CAD) systems were developed in the literature to provide a second opinion for the assistance of radiologists. The previous CAD systems were developed based on three main steps such as segmentation, feature extraction and selection, and classification. These steps are well-addressed in the past studies to find the discriminative features for classification of breast masses as benign or malignant. Unfortunately, these steps require a complicated task such as pre- and post-processing steps and depended on critical domain expert knowledge about image processing. Despite these methods, a few CAD systems have also been developed recently by using multilayer deep-learning architecture to overcome these problems. These types of state-of-the-art recent CAD system are briefly described in the following paragraphs.
2.1. Pre- and Post-Processing Methods
A learning-based approach was developed in [
12] to detect malignant masses based on feature extraction and a machine learning classifier. This system was tested on 454 mammograms using a 5-fold-cross validation test. A complex feature set was extracted to define a training dataset for the classifier that can detect only malignant masses. A multi-resolution-based feature extractions technique and support vector machines (SVM) classifier are utilized in [
13] to differentiate between the malignant and benign masses. In that system, it was difficult to define a hard/soft margin and the selection of a kernel for recognition of this problem. Conversely, in [
14], the image enhancement approach was presented to remove background noises using image matting. The authors believe that this improvement method can potentially improve the mammographic classification task. A different approach was utilized in [
15] to classify masses through different shape features such as round, oval, globular and irregular. The authors suggested that the shape and margin characteristics are two major features to distinguish between breast masses. This approach was dependent on accurate extraction of shape features.
Neuro-fuzzy based rules were developed in [
16] to detect abnormal mammogram masses. This system achieved a result of 97% specificity and 76% sensitivity values. A texture-based classification system was developed in [
17] using co-occurrence matrices, wavelet and ridgelet transforms on 120 mammographic region-of-interest (ROI) images. After extracting all these texture features, the informative features are selected using a genetic algorithm (GA) and finally, the features are classified using a Random Forest algorithm. They indicated a 0.90 value for the area under the receiver operating curve (AUC). To detect only micro-calcifications, the CAD system was developed in [
18] by using a dual-tree complex wavelet transform (DT-CWT) and SVM classifier. In [
19], top-hat transform methods were utilized to enhance the micro-calcifications in the wavelet domain. Based on features, the micro-calcifications are detected and they achieved a 92.9% true detection rate. Similarly, top-hat transform techniques were utilized in [
20] to enhance the background and then the texture features are extracted that are further classified using SVM classifier. The authors achieved 92% accuracy with SVM classifier and feature selection methods. In [
21], the pre-processed system using gamma correction is performed and then used morphology operations with SVM. They derived a true positive rate (TP) of 85%, a false positive rate (FP) of 82% and 53 FP calcifications per normal mammogram without calcifications. However, this paper was focused only on detection of calcifications but not classification of benign and malignant masses.
The authors in [
22] utilized a graph-based visual saliency technique to enhance the local contrast of ROI mammograms. Afterwards, the features are computed using 2D Gabor filters in 4 different directions and based on these features, the SVM classifier is used to detect breast mass. To automatically detect masses, the feature-fusion based approach was developed in [
23] using canonical correlation analysis (CCA). In [
24], a hierarchical classification procedure was developed based on the combined linear discriminant analysis (LDA). However in [
25] a set of 349 ROI masses were used to characterize of breast mass by using three classifiers Bayesian, Fisher and SVM.
The genetic algorithm (GA) is mainly used in [
26] to select appropriate features such as intensity, textural, and shape features and afterwards, these features are classified using artificial neural networks (ANNs). Whereas in [
27], the texture regions are extracted and then SVM classifier was used to classify the mass regions with an accuracy of 99%. Fuzzy mega algorithm was developed in [
28] based on inference engine to classify masses and calcifications. They reported an accuracy of 76.67% for nodules and 83.34% for calcifications. In contrast with this approach, the multi-scale texture descriptors are defined [
29] based on a wavelet and gray-level co-occurrence matrix and then most discriminative features are selected using particle swarm optimization (PSO) technique. These selective features are classified using a supervised SVM algorithm 1000 normal and 494 abnormal samples.
A complete CAD system with pre- and post-processing steps was developed in [
30] to detect breast masses. A sensitivity of 98.55% for masses was achieved and a false positive of 0.55 for non-masses was obtained. In [
31], the texture descriptor approach was used with the Ada-DEWNN classifier to recognize benign and malignant masses and achieved an AUC value of 0.92. In contrast with these approaches, a computer-aided diagnosis (CADx) system was developed through histograms of gradient divergence (HGD) descriptor [
32] to predict breast masses. The authors demonstrated that this descriptor is able to detect round-shaped objects such as breast masses. Moreover, this new descriptor was compared with conventional CADx features.
2.2. Deep-Learning Methods
Instead of using these state-of-the-art classifier techniques, there were some CAD classification systems to detect or recognize breast masses, which focused on the deep-learning methods without using pre- and post-processing steps such as image enhancement and feature selection methods. In
Table 1, those CAD systems are briefly described and discussed in detail in the subsequent paragraphs.
A deep learning technique was used in [
33] to classify breast masses. The authors developed this system by using convolution neural network (CNN) and max pooling concepts to recognize the features from image pixels. Also in [
34], the mass or no mass technique was developed using a deep learning classifier. They achieved 85% accuracy in identifying the breast masses without using the image segmentation and pre-processing steps. In that paper, the authors utilized a deep learning technique in an unsupervised fashion that did not require any hand-crafted image features, whereas in [
35], the eight multi-layer-deep learning algorithm was developed to employ three pairs of convolution-max-pooling layers for automatic feature extraction. The authors also utilized convolutional neural network (CNN) with multilayer perceptron (MLP) classifier to predict mammographic malignant masses. The 0.80 AUC was achieved by developing this new deep learning algorithm.
In [
36], a convolutional neural network (CNN) along with the intensity information and a decision mechanism were implemented to classify breast masses. These deep features extracted from different layers illustrate an effective classification performance. A different approach for classification of calcification feature was developed in [
37] using a deep-learning technique around the detected regions from breast masses. In the deep-learning technique, they used a restricted Boltzmann machine (RBM) to classify masses. Results using 9-fold cross validation on a private database of 33 mammograms reached an area under the ROC curve with a value of 0.83. Similarly in [
38], the authors used a hybrid convolutional neural network (CNN) classifier along with an enhancement step to classify 426 benign and 310 malignant breast masses. On this dataset, they obtained 0.82 score for the area under the ROC curve (AUC).
2.3. Approach
In the last few decades, the authors focused more on pre- and post-processing techniques to classify the breast masses from mammograms. The pre-processing steps rely on segmentation or detection of breast masses with contrast enhancement by reducing the background mammogram noises. These methods were outdated, required high computational time and domain expert knowledge. As a post-processing step, the features are extracted and classified using outdated machine learning methods such as NN, SVM, GA, AdaBoost, Naïve Bayes and ensemble classifiers but in general these techniques cannot apply to all types of breast masses. The classification accuracy of breast masses is less than 90% in the past approaches. Despites these facts, the optimal feature extraction or selection is also difficult.
An alternative approach was used via an emerging deep learning concept [
33,
34,
35,
36,
37,
38] that can directly learn features from pixels. The deep learning concept is nowadays used [
39] for many research directions such as computer vision, bioinformatics and image classification tasks. In practice, the deep learning transform input images into features representation into layers. The layers are developed based on the same concept as feature detectors are utilized. Moreover, the deep learning algorithms are used to transfer the input (raw data) pixels into multiple layers for learning the features that are hard to rectify. Recent studies also indicated that the descriptors extracted from CNN are extremely effective for recognition tasks in image processing. A common alternative to training a CNN from scratch is to use a pre-trained model to extract features from a new data set automatically. This method, referred to as transfer learning, is a convenient way of applying deep learning without the need for a huge data set or very long training time.
A literature review suggested that the authors utilized a CNN model for classification of mammographic masses without extracting features. The CNN model is difficult to train on image pixels and therefore in this paper, the invariant features are extracted to provide assistance to deep-learning architecture through a deep belief networks (DBNs) along with softmax linear classifier. In general, the DBNs are generative neural networks (NNs) that stack the restricted Boltzmann Machines (RBMs). It has been experimentally observed that the RBMs are also generated on new data with given joined distribution and also considered more feature-rich and flexible compared to the CNN model. The CNN are a very specific model that is mostly used for very specific tasks and depend on pixels of the image. Also, the CNN model are dependent on low-level input pixels transforming into high-level ones and hard-to-consume representation of pixels. Instead of input pixels to the CNN model, the invariant stronger feature descriptors are submitted to the deep-learning algorithm. The deep-learning algorithm is developed in this study by combing the power of both DBNs and CNN model. As a result, the features are extracted in the form of feature descriptors combine with deep learning concept to effectively classify benign and malignant masses by using softmax classifier. These methodological concepts are detail explained in the coming
Section 3.2.
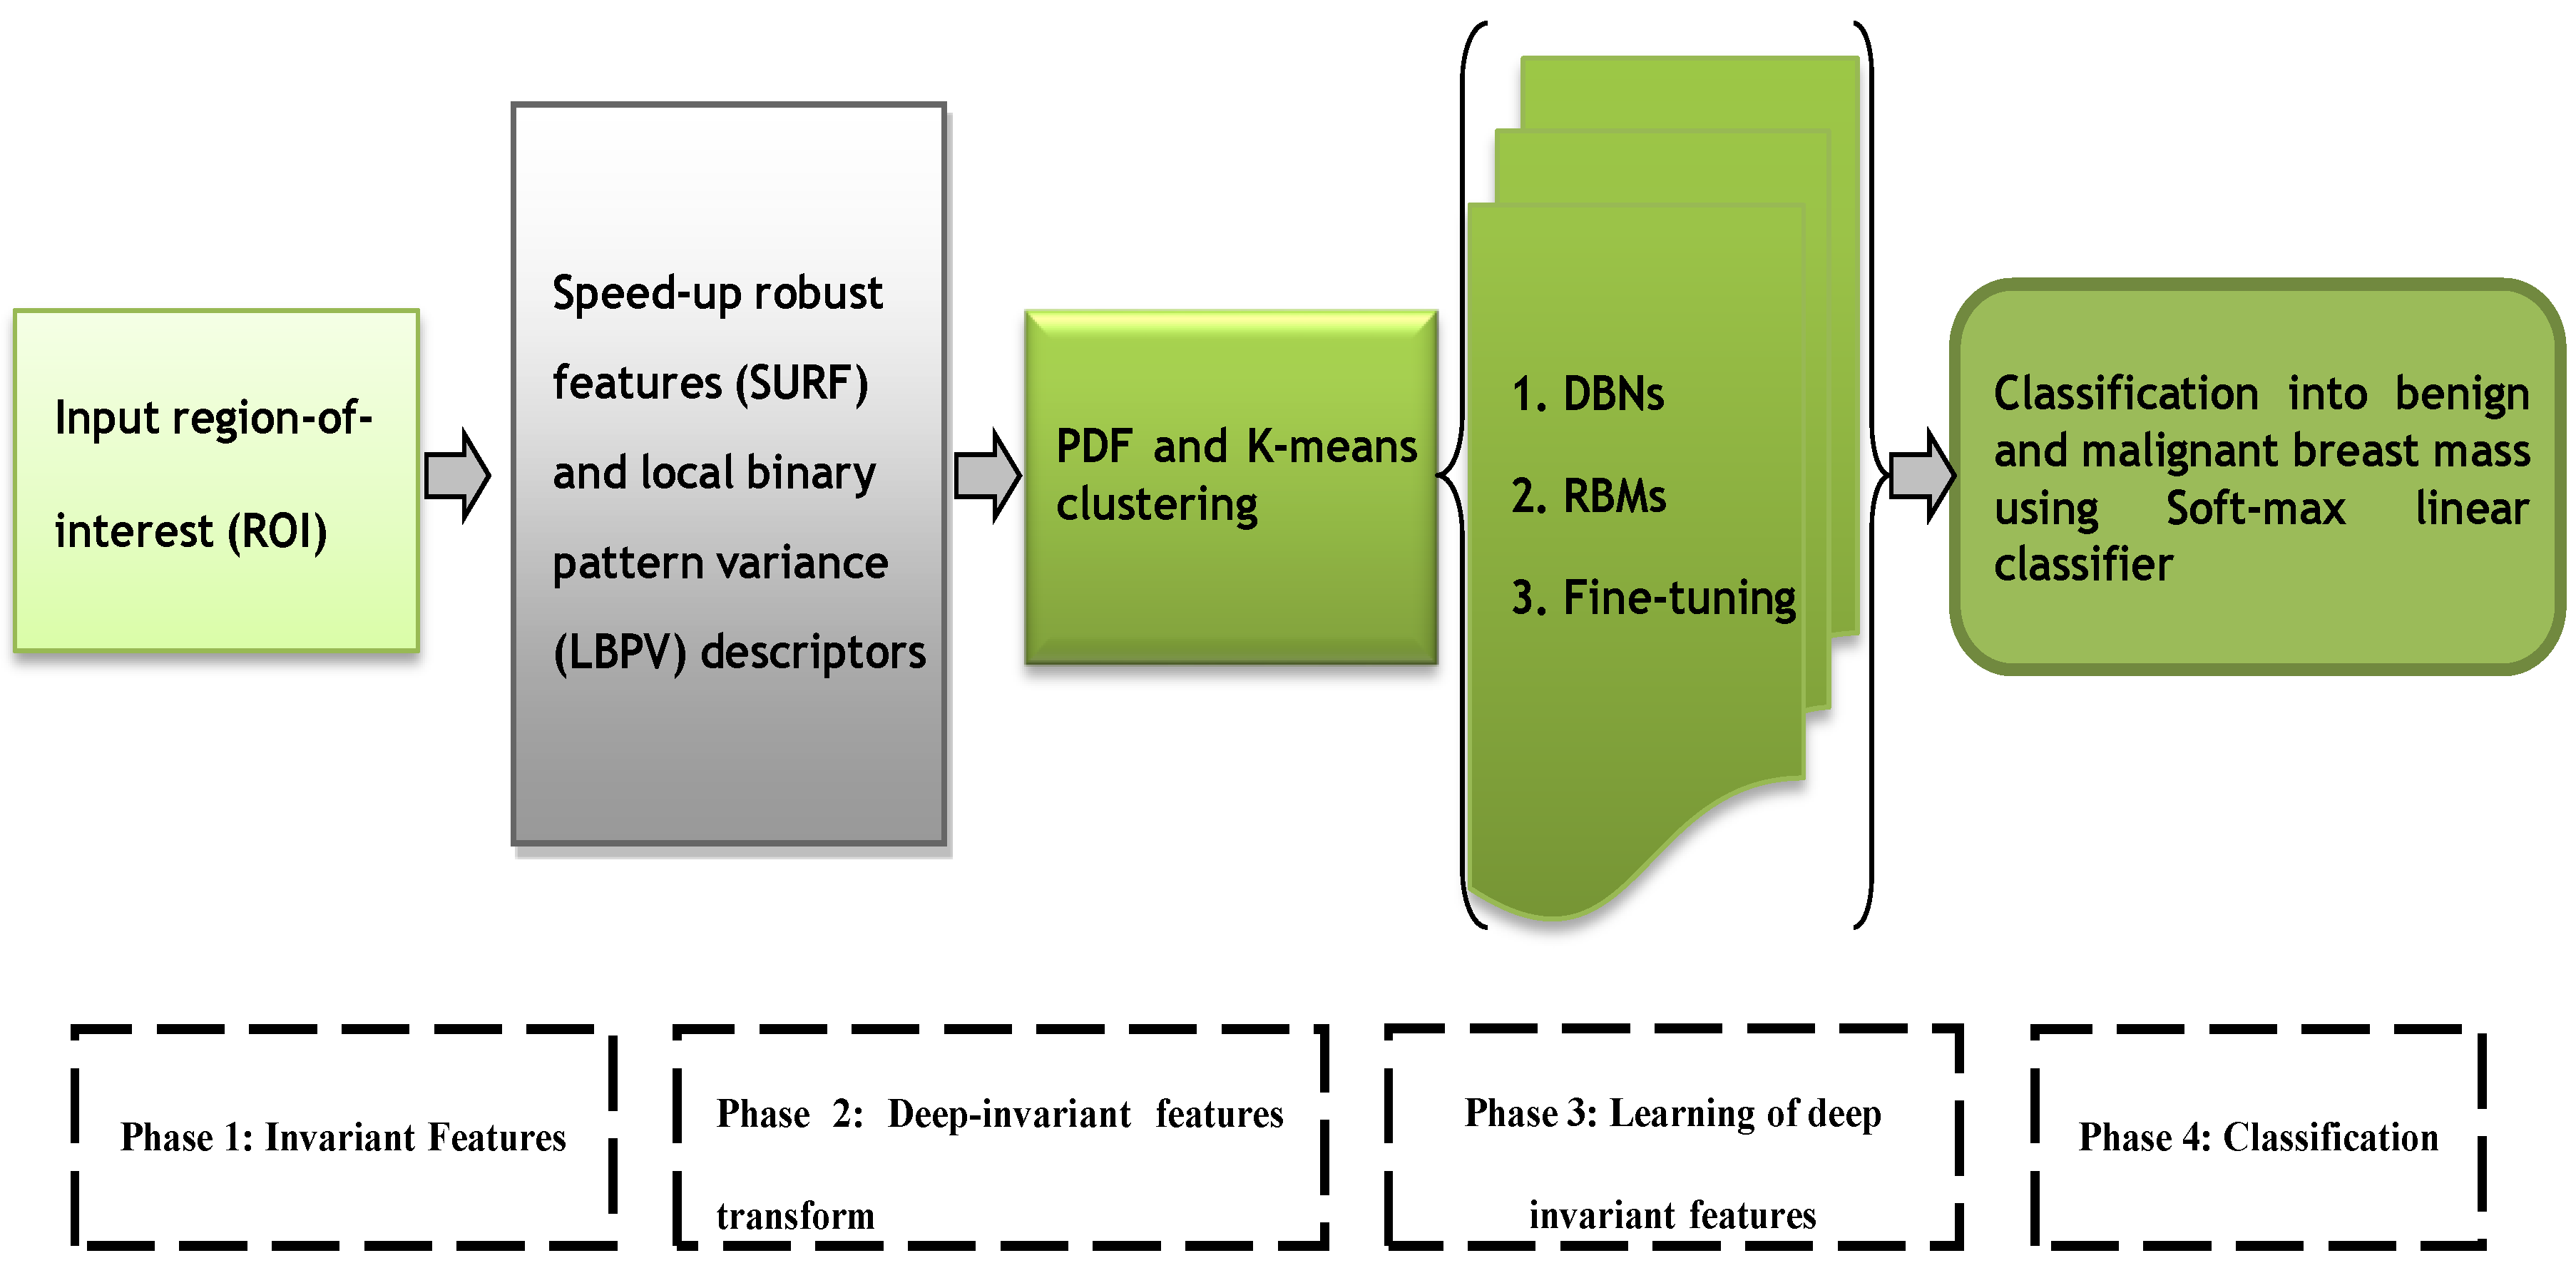
The speed-up robust features (SURF) [
40] and local binary pattern variance (LBPV) [
41] descriptors were extracted in the first phase. In fact, these features have global spatial information, which preserved local texture information. In the second phase, these descriptors are then transformed into invariant features by using
k-means clustering and probability density function schemes. However, in the third phase, the deep invariant features (DIFs) are constructed in supervised and unsupervised fashion through a multilayer deep learning neural network [
42] algorithm. The four-layer architecture of deep-learning algorithm is developed by using three layers from deep belief networks (DBNs) and a fourth layer from softmax linear classifier to predict breast mass. A fine-tuning step is integrated to effectively learn the DIF features and the final decision in the fourth phase is obtained by using the softmax linear classifier. The overall architecture diagram of this proposed DeepCAD system is shown in
Figure 1.
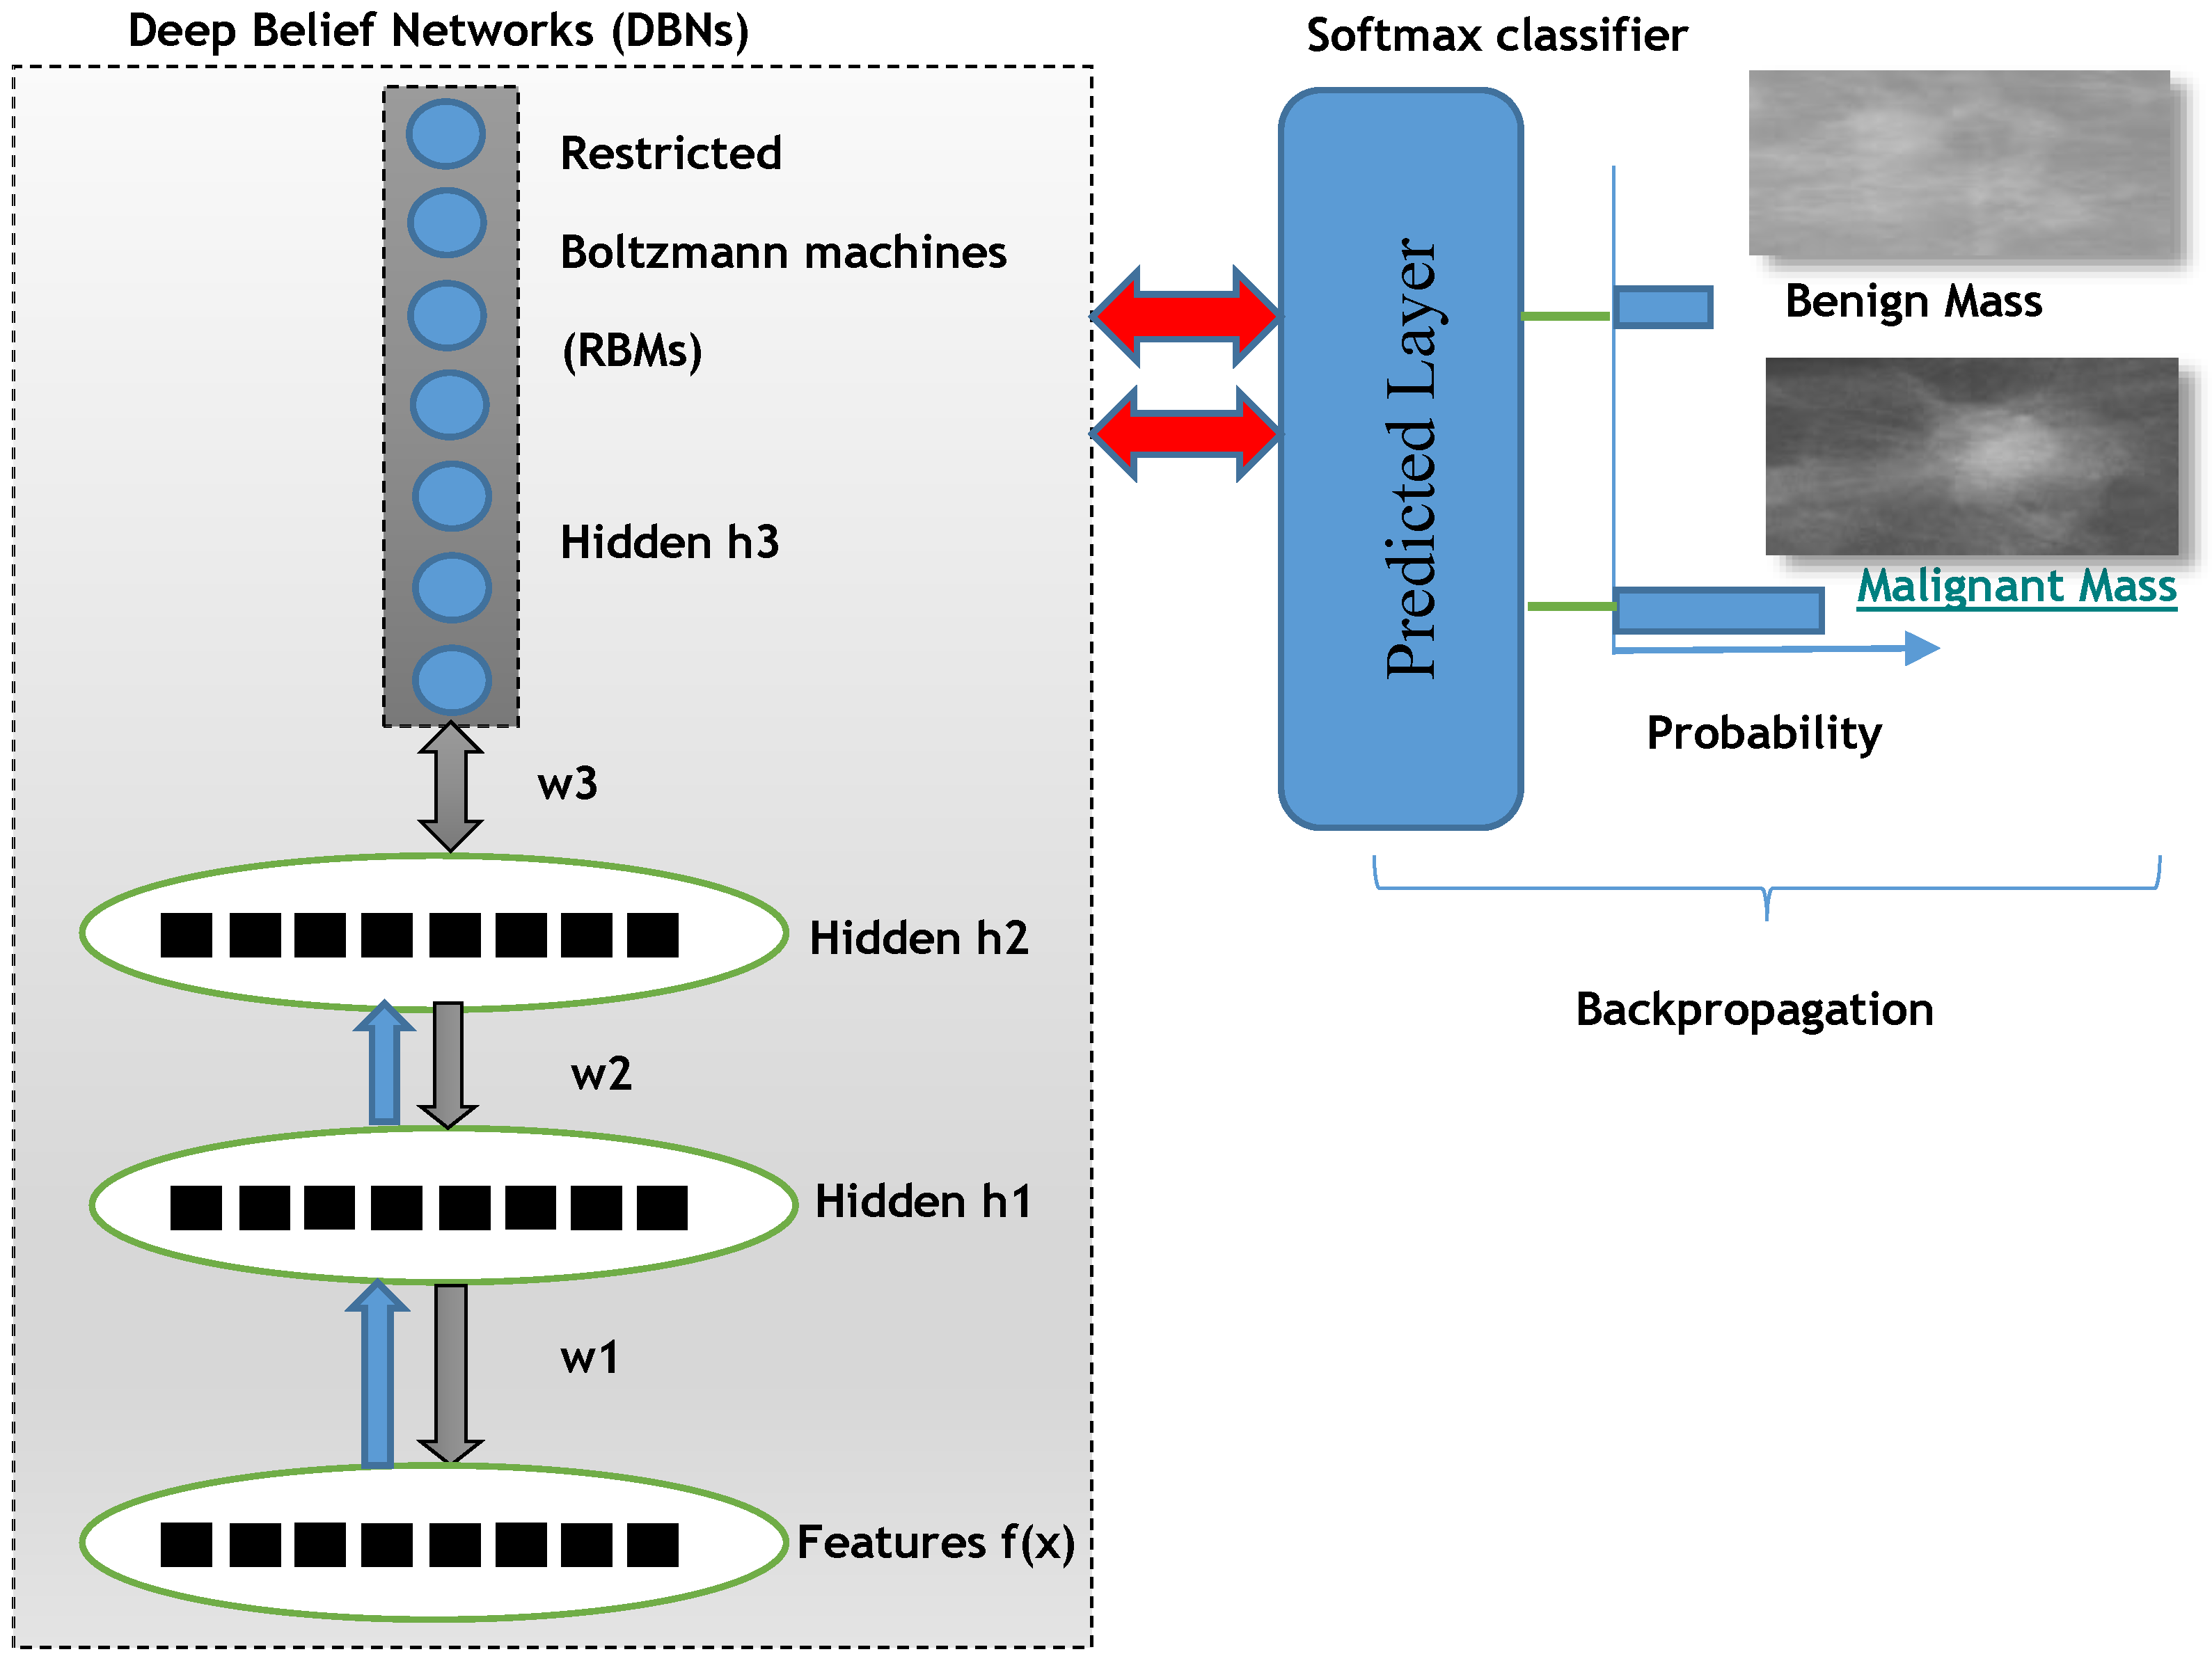
The deep learning algorithms are used to describe the features in distributed fashion organize in different supervised and un-supervised layers. The training of DBNs with RBMs are started by using an unsupervised greedy layer-wise approach on the extracted features from each ROI mammogram images. The first layer is visual, that is, defined as input of features. This unsupervised visible layer is used to construct the second layer by providing training examples. Afterwards, the second layer is trained as an RBM by using the mean activation function of the training example. This step is iterated for the desired number of layers by propagating upward the mean values of the activation function. The fine-tuning step is added to find the parameters of this deep learning algorithm with respect to a supervised training criterion by a softmax linear classifier. The softmax classifier has utilized a linear score function and the cross-entropy loss. The parameters of the linear classifier consist of a weight matrix W and a bias vector b for each class. The DeepCAD system is tested and compared with state-of-the-art classification system on two publically available data sources based on statistical measure such as sensitivity (SN), specificity (SP) and accuracy (ACC).
3. Methodology
The major steps of the proposed DeepCAD system consist of extraction of invariant features, transform to deep invariant features (DIFs), multilayer deep-learning and softmax layer for classification. All these phases are graphically represented by
Figure 1. All these phases are briefly explained in the subsequent sections.
3.1. Selection of Data Set
To test the performance of a DeepCAD system, the 600 mammographic region-of-interest (ROI) images are collected. These images were obtained from two different international sources such as Digital Database for Screening Mammography (DDSM, University of South Florida—USF) [
43,
44] and from the Mammographic Image Analysis Society (mini-MIAS, Royal Marsden Hospital in London) [
45]. The 350 mammogram images were acquired from DDSM dataset and the 250 images were collected from mini-MIAS dataset.
From DDSM dataset, the four mammograms were selected such as Mediolateral-Oblique (MLO) and Cranial-Caudal (CC) projections of the right and left breasts. The spiculated, ill-defined, circumscribed, microlobulated, mixed and obscured type margin cases were utilized according to BIRADS descriptor of the breast mass. In DDSM dataset, the images were represented in the JPEG compression format with very large size due to scanning resolution (between 42 and 100 microns). To un-compress these images, the University of South Florida provided a software that was utilized and then these images were sub-sampled by the average of (8 × 8) pixel values. In total, the 400 ROIs were utilized from DDSM dataset.
The mini-MIAS dataset contained the 322 MLO mammogram view images in which 200 region-of-interests ROIs) were selected. The images had a 200 micron pixel edge with a resolution of 1024 × 1024 pixels. The dataset contained ground truth information such as x and y locations and radius of the abnormality. In case of mini-MIAS dataset, three margin types were used such as spiculated, circumscribed and ill-defined. In DDSM and mini-MIAS datasets, the distribution of benign and malignant masses in different size groups, which are ranging from 5 to 50 mm. For each patient in DDSM and mini-MIAS datasets, an expert radiologist supplied breast tissue density rating from 1 to 4 according to ACR BI-RADS (The American College of Radiology Breast Imaging Reporting and Data System).
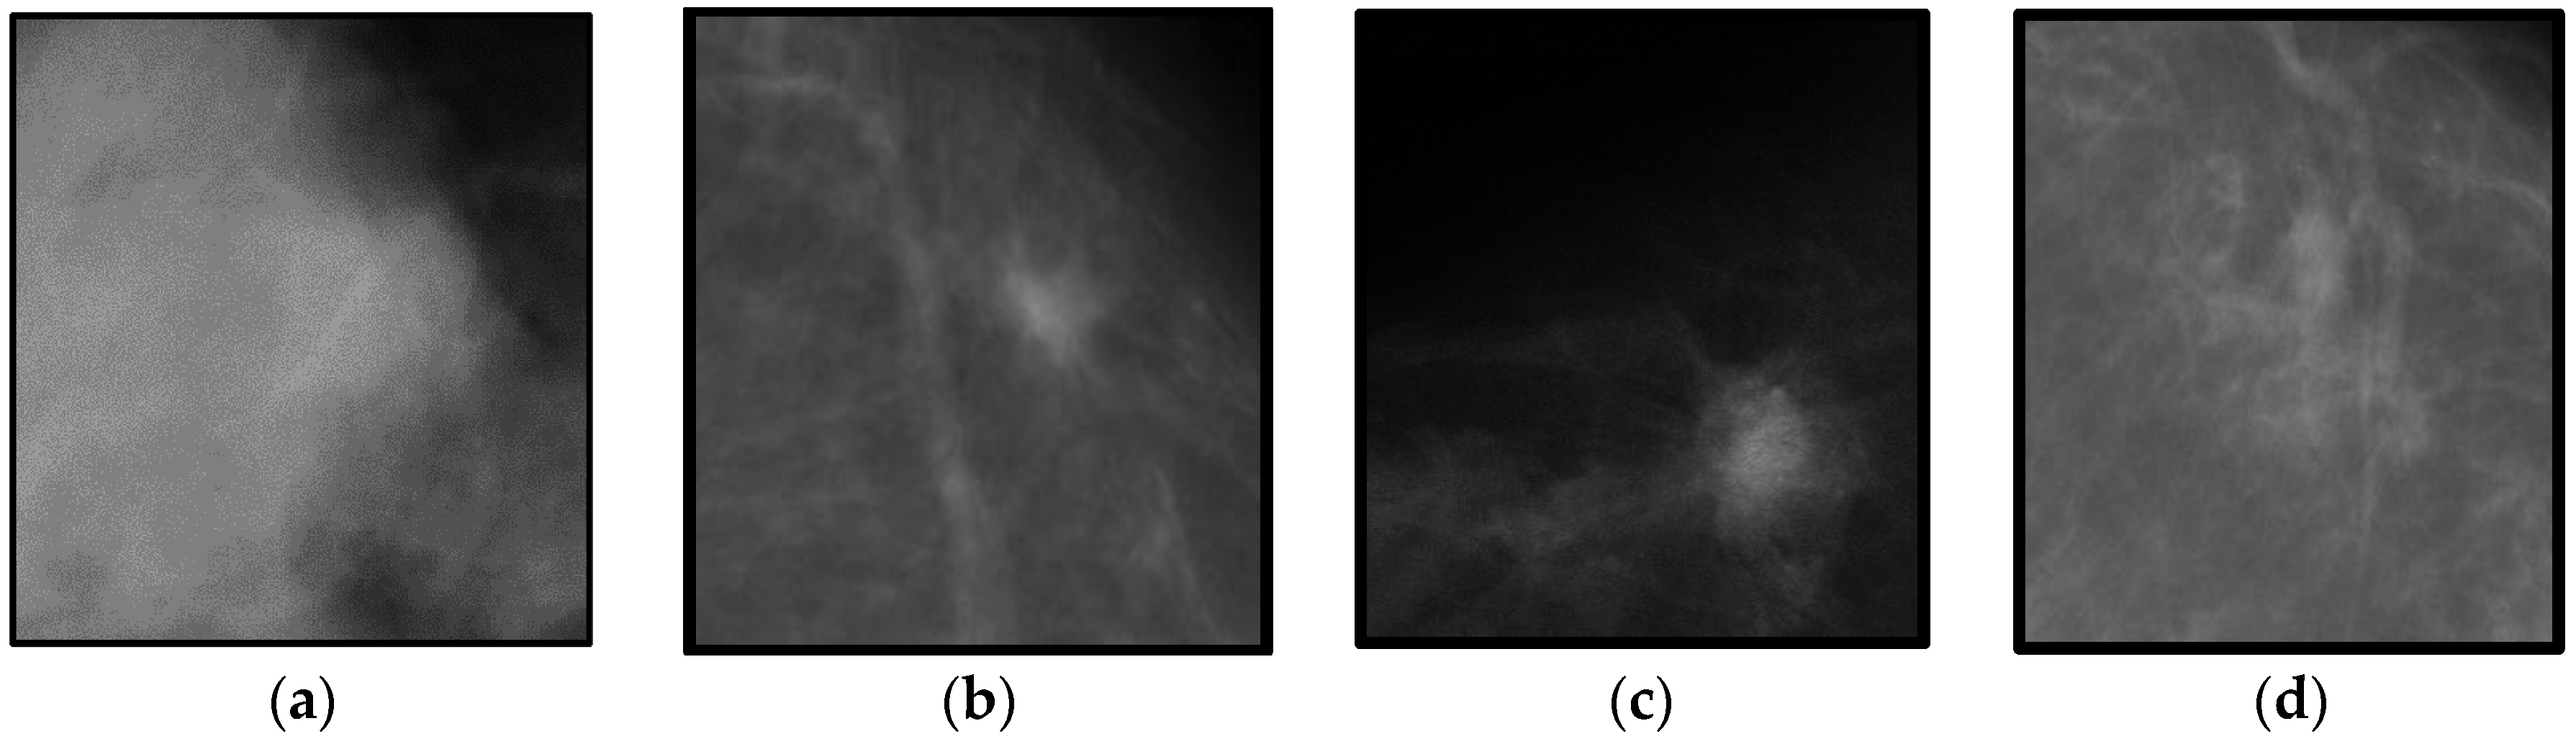
Each selected mammograms were sub-sampled by the average of an 8 × 8 window of pixel values. By combining DDSM and mini-MIAS datasets, a total set of 600 ROIs (i.e., 300 benign masses and 300 malignant masses). The 300 benign and 300 malignant masses were obtained to evaluate the proposed DeepCAD system and to compare the performance with state-of-the-art classification systems. From each image, the region-of-interest (ROI) of size (250 × 250) pixels was extracted by an experienced radiologist. An example of this dataset is shown in
Figure 2.
3.2. Extraction of Invariant Features
To define invariant features, the speed-up robust features (SURF) [
40] and local binary pattern variance (LBPV) [
41] descriptors are extracted from each region-of-interest (ROIs) mammographic mass. Instead of extracting features using convolution operation as done in the state-of-the-art approaches by using deep layers, the deep invariant features are defined in this paper to achieve high classification accuracy that consumed less training time and efforts. This step is explained in the subsequent paragraphs.
The speed-up robust features (SURF) is provided local image pixel impressions by using interest points. The SURF descriptor is used to provide unique features by labeling the intensity distribution of the pixels within the neighborhood of the point of interest. In this paper, a hessian-based blob detector was used to locate the interest points (IPs) from each mammographic ROI images. The detected interest points (IPs) is fragmented into smaller (4 × 4) square sub-regions, and for each one, the Haar wavelet responses are extracted at (5 × 5) regularly spaced points. To achieve a rotational invariance approach, the orientation of each IP need to be calculated and the IP are selected through the maximum determinant of the Hessian matrix in both x and y directions. The radius is fixed i.e., 4S where S indicate the scale of point of interest. The responses are weighted with a Gaussian of σ = 1.2. These values are experimentally determined.
A local binary pattern variance (LBPV) [
40] descriptor was also used to get local invariant features. The simple
LBP approach has main drawback that it loses global spatial information which preserve local texture information. Therefore, the
LBPV method is performed on each mammographic ROI images. The
LBPV proposed an alternate method, which is global rotation invariant matching with Local Binary Pattern texture feature. It is a simple and efficient joint contrast distribution and
LBP method. The
LBPV is a powerful method because it exploits necessary information of special patterns and local contrast. Threshold or boundary values are used for quantization of the
VAR parameter of the images computed for partitioning of total number of distributions into
N bins with equal number of entries and it is defined as:
where
Thresh hold values are used for quantization of the variance of the test images. The histogram of W(;;;) is calculated to describe texture patterns of mammogram ROI images. Moreover, these SURF and LBPV’s histogram features are concatenated in a feature vector of each ROI images.
3.3. Transform to Deep Invariant Features
The SURF and LBPV features are added together into a feature vector. This feature of every ROI breast mass is normalized by using probability-density function. In fact, the zero mean and unit variance methods are executed in this PDF technique to transform this feature vector into normalize form. Afterwards, the simple k-means clustering algorithm is performed to construct a descriptive of numerous similar areas of features. Thus, each descriptive area of features is mapped to a certain class through the clustering process and then these features can be represented by the histogram of the features category.
3.4. Learning Deep Invariant Features
These invariant features (IFs) are classified using supervised and un-supervised deep learning algorithms to form deep invariant features (DIFs). The classification algorithm is used as a deep-learning neural network (DL-NN) [
42] model. The DL-NN algorithm are used to describe the features in distributed fashion organize in different supervised and un-supervised layers. The DL-NN algorithm is based on the idea of representing hierarchical features. This hierarchical features are repeatedly built with a greedy layer-by-layer approach. So, the DL-NN algorithm helps to separate these abstractions and to choice the features that are useful for learning. The DL-NN has many applications in practice such as language modeling and computer vision, image classification and speech recognition.
For deep learning DL-NN algorithms, the three layers from deep belief nets (DBNs) are employed along with a backpropagation optimization step. The DBNs are learned one layer at a time by learning the features that creates the bases for the next layer and so on. There is also fine-tuning step to improve the classification performance of the whole neural network model. This fine-tuning step is applied by using back-propagation error derivate and the final classification decision is performed by adding a softmax linear regression model.
In deep belief networks (DBNs), there are many hidden layers that are densely connected and are stacked together. This DBNs model can be trained using greedy manner that are showed a deep hierarchical representation of the training data. The mathematical representation of DBN to model features and n hidden layers
can be defined as:
The training of DBNs with RBMs started by using an unsupervised greedy layer-wise approach on the extracted invariant features. The first layer is visual that is defined as input of features. This unsupervised visible layer is used to construct the second layer by providing training examples as P(|). Afterwards, the second layer is trained as an RBM by using mean activation function of the training example. This step is iterated for desired number of layers by doing propagation upward the mean values of activation function.
The deep learning can be discriminatively trained (DT) by back-propagating derivatives of a cost function that measures the discrepancy between the target outputs and the actual outputs produced for each training case. The second key element needed is a loss function, which is a differentiable objective that quantifies our unhappiness with the computed class scores.
Intuitively, the correct class must have a higher score than the other classes. When this is the case, the loss should be low, and otherwise the loss should be high. There are many ways to quantify this intuition but, in this case, the cross-entropy loss has chosen that is associated with the softmax classifier. Recall that if it is the array of class scores for a single example (e.g., array of 2 numbers here), then the softmax classifier computes the loss for that example as:
One can see that the softmax classifier interprets every element of lost function as holding the (un-normalized) log probabilities of the two classes. Exponentate these to get (un-normalized) probabilities, and then normalize them to get probabilities. Therefore, the expression inside the log is the normalized probability of the correct class. Note how this expression works: this quantity is always between 0 and 1. When the probability of the correct class is very small (near 0), the loss will go towards (positive) infinity. Conversely, when the correct class probability goes towards 1, the loss will go towards zero because log (1) = 0. Hence, the expression is low when the correct class probability is high, and the opposite happens when the class probability is low.
Finally, the fine-tune step is added to find the parameters of this deep learning algorithm with respect to a supervised training criterion by a softmax linear classifier. The softmax classifier utilized a linear score function and the cross-entropy loss. The parameters of the linear classifier consist of a weight matrix
W and a bias vector
b for each class. The classification output layer softmax is generated by using a logistic regression model in a supervised manner. The softmax allows us to handle the diversity between malignant and benign classes of mammographic masses. The Soft-max function is defined as the input to the function, which results the
K distinct linear functions, and the predicted probability for the
j class given a sample vector
x is:
This can be seen as the composition of K linear functions . Where K represents an index over all classes. So the soft-max function (where denotes the inner product of X and W).
This classification layer is parametrized by a weighted matrix
w and a base vector
b as:
Finally, the layer that predicted the breast mass class is defined as:
The overall proposed deep learning architecture of DeepCAD system is depicted in
Figure 3 to predict benign and malignant masses.
4. Experimental Analysis
The DeepCAD for classification of 600 ROIs (i.e., 300 benign masses and 300 malignant masses) ROIs are used in this study. The detailed description of this dataset is found in
Section 3.1. To evaluate this DeepCAD system, the 10-fold cross validation experiments were performed. The dataset is divided into 40% and 60% training and testing examples from 600 ROI images. The area under the receiver operating curve (AUC) [
46] was employed to calculate the sensitivity and specificity. In addition to that the accuracy statistical measure is also derived to show the performance of proposed Deep-CAD learning system.
The area (AUC) is used under the receiver operating characteristic (ROC) analysis on the test data set in order to investigate the sensitivity (SN) and specificity (SP) and accuracy (ACC) measures. The area under the curve (AUC) is the nearly commonly used index to assess the overall discrimination. The AUC ranges from 0.50 to 1.0, and the greater its value, the higher the classification accuracy. The significance of the proposed DeepCAD system was compared with state-of-the-art deep learning classification algorithms such as CNN-Max-CAD-Qiu [
33] and CNN-CAD-Jiao [
36] using 10-fold cross-validation test on this group.
In order to compare with CNN-Max-CAD-Qiu [
33], the convolutional neural network (CNN) was implemented along with the adaptive feature identification module that is composed of three pairs of convolution-max-pooling layers, which contains 20, 10, and 5 feature maps, respectively. However, in the case of CNN-CAD-Jiao [
36], the CNN model was used to obtain high-level and middle-level features of a test image that were extracted from the fine-tuned network. Then these features were classified by two classifiers in a two-step decision mechanism. The max pooling operation is finally used to take final classification decision. In fact, combining intensity information and deep features automatically extracted by the trained CNN from the original image. Then middle-level and high-level features were extracted from different layers of this network for training two linear SVM classifiers. The CNN-Max-CAD-Qiu and CNN-CAD-Jiao were implemented partially to fulfill the requirements of comparison with the proposed DeepCAD system.
To evaluate the performance of the DeepCAD system, the sensitivity, specificity, classification accuracy and area under the receiver operating characteristics (AUC) curve statistical measures are used. The sensitivity (SN) or true positive rate (TPR), specificity (SP), false positive rate (FPR) and accuracy (AC) metrics are calculated by using the following statistical formulas:
Here TP stands for the true positive cases in detection results, and TN denotes the true negative cases. In addition, FP contains the false positive cases, and FN equals the false negative cases. In the figure of the ROC curve, the ordinate and abscissa were sensitivity and specificity respectively. A larger area under this curve stands for a better classification performance.
To assess the performance level of the DeepCAD system, the discrimination between benign and malignant masses were provided to the classifier. The training and testing datasets are divided into ratios of 60% and 40%. The average accuracy of this classifier is determined by area under the receiver operating characteristics curve (AUC), Sensitivity (SN), Specificity (SP) and Accuracy (ACC). On total of 600 ROI mass regions, the average statistical measures of the DeepCAD system are shown in
Table 2. From this table, it can be observed that, on average, the best classification results of benign masses were obtained such as SN of 91.5%, SP of 84.0%, ACC of 93% and AUC of 0.9, whereas in the case of malignant masses, an SN of 93%, SP of 82.5%, ACC of 91% and AUC of 0.92 values were achieved. Overall, on average, the statistical significant results are obtained by the proposed DeepCAD system such as SN of 92%, SP of 84.2%, ACC of 91% and AUC of 0.91 values. As a result, the proposed Deep-CAD system improved the classification accuracy of malignant versus benign masses. It happens due to the use of new deep invariant features to differentiate between malignant and benign masses.
The performance of the proposed DeepCAD framework is also compared with two state-of-the-art deep-learning classification system, CNN-Max-CAD by Qiu et al. [
33] and CNN-CAD by Jiao et al. [
36] by using 10-fold cross validation test on 420 ROI images. The obtained results were reported in
Table 3. In contrast with DeepCAD system, the features extraction processing is automatic but the training processing will take lots of experts and it is also a time consuming task. Therefore, the DeepCAD system has combined the processing of feature extraction and deep-learning architecture to find a fusion strategy for these features. The proposed framework took full advantage of deep features from the multilayer deep learning algorithm, forming a unified feature extraction structure.
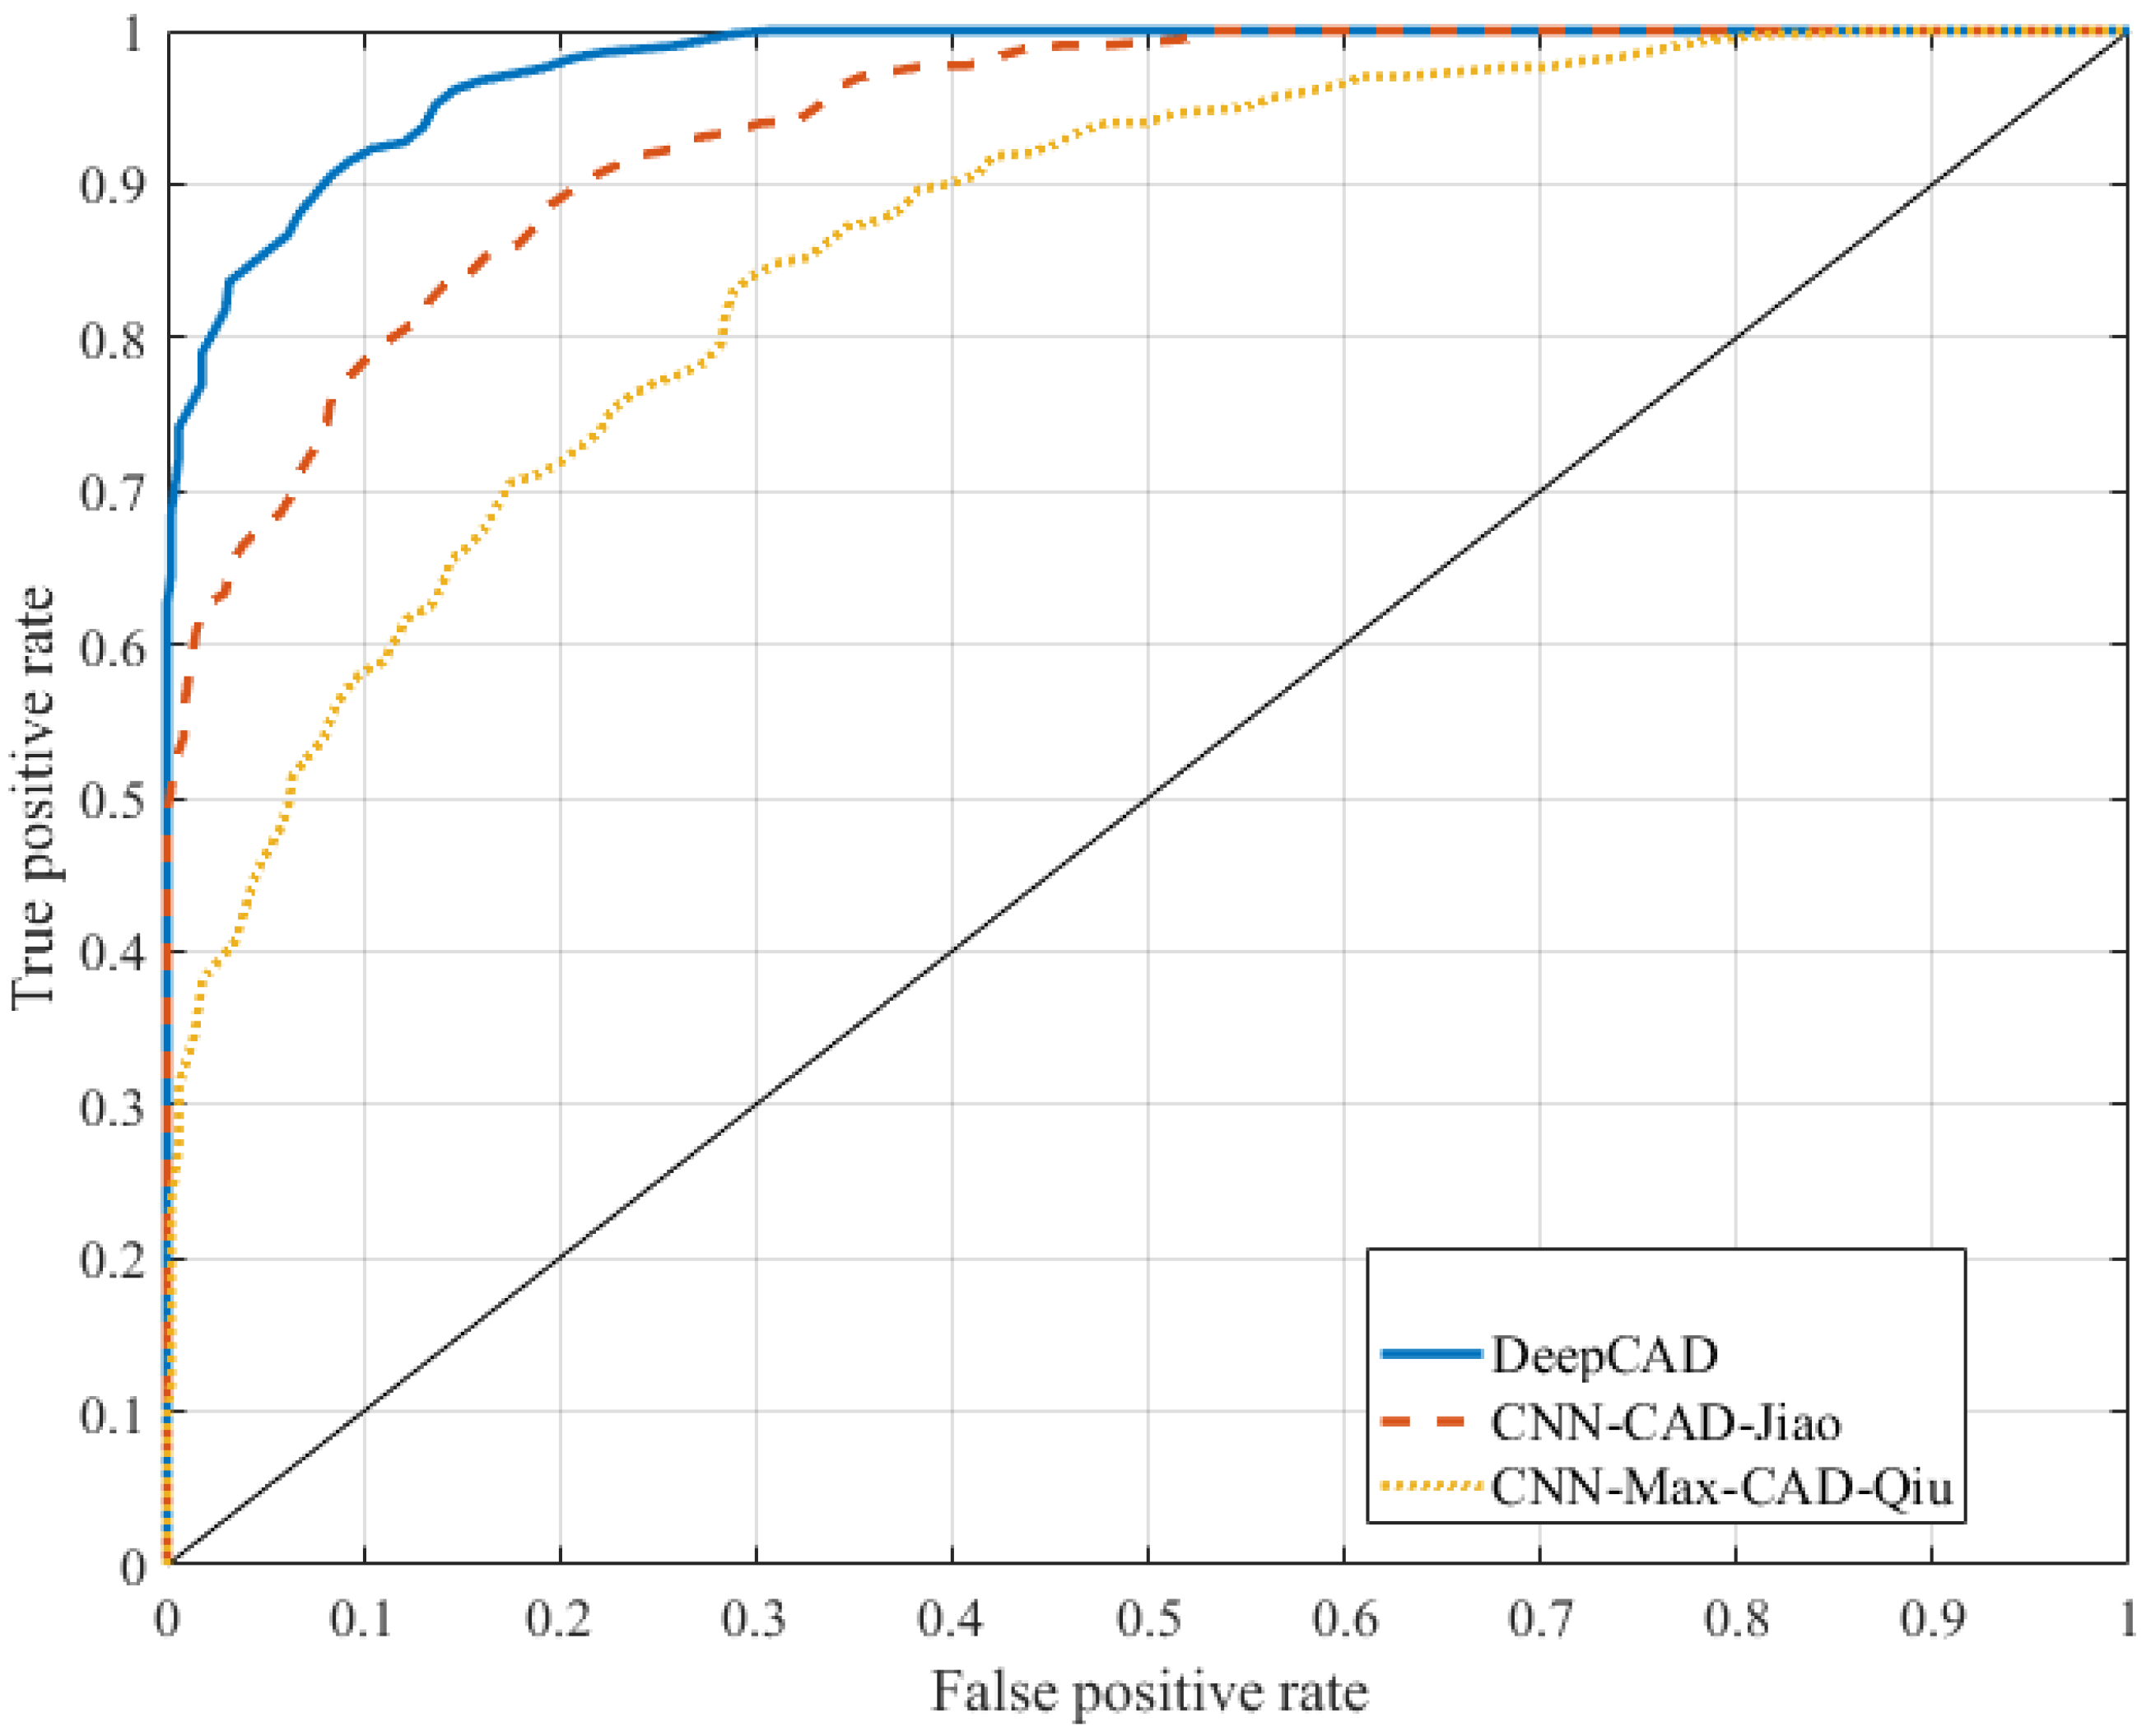
In the case of the CNN-Max-CAD developed by Qiu et al., the statistical values are obtained such as SN of 75%, SP of 80% and AUC of 0.76. However, the classification algorithm by Qiu et al. provided better performance compared to CNN-CAD presented by Jiao et al. The CNN-CAD system was achieved SN of 73%, SP of 70% and AUC of 0.67. The significance results of the DeepCAD system is also displayed in terms of area under the receiving operating characteristic curve (AUC) as shown in
Figure 4. As shown in this figure, the AUC curve of the proposed DeepCAD system has significantly advanced the performance of the differentiation between malignant versus benign masses compared to the other two classifiers, CNN-Max-CAD by Qiu and CNN-CAD by Jiao. An area under the receiver operating curve (AUC) of 0.91 is achieved on average by the DeepCAD system compared to other two systems, due to integration of the deep invariant feature concept.
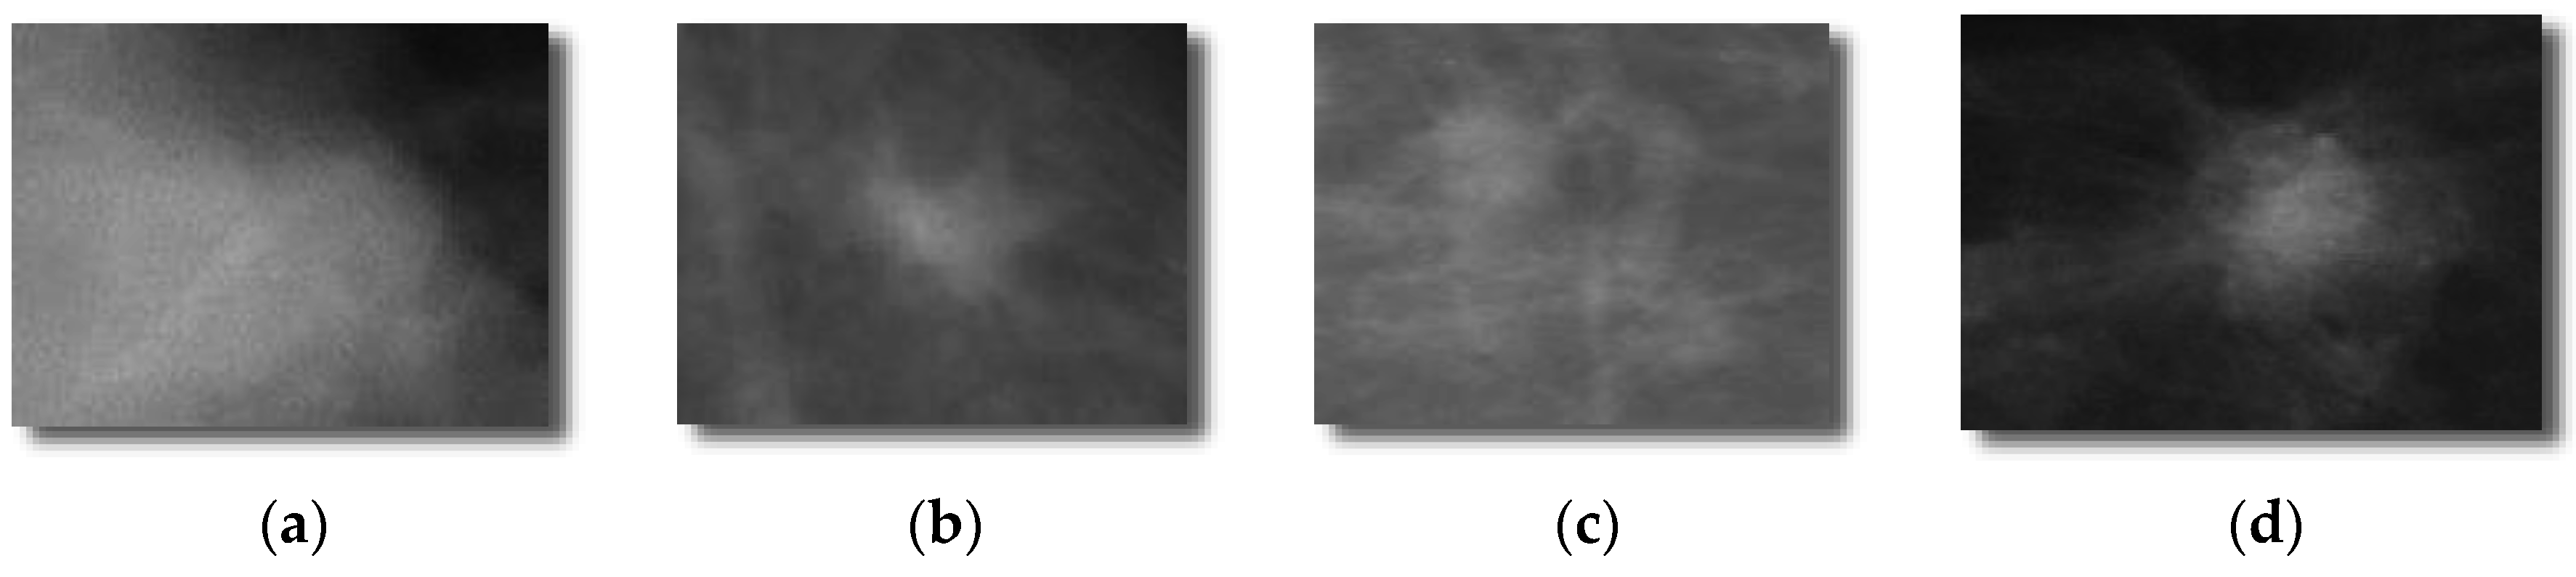
On the other hand, the classification accuracy of the proposed DeepCAD system with the sate-of-the-art classification algorithms such as CNN-Max-CAD-Qiu and CNN-CAD-Jiao by 10-fold cross validation test on the different dataset. This different features dataset is obtained from using masses that are not centered to the region-of-interest (ROI) image. An example of this dataset with un-centered masses are shown in
Figure 5. The significance accuracy is obtained by using DeepCAD system when compared to two other CNN-Max-CAD-Qiu and CNN-CAD-Jiao classification systems. The CNN-Max-CAD-Qiu system is overall better than CNN-CAD-Jiao but less effective than proposed DeepCAD system. The DeepCAD algorithm is performed well due to the fact that it selected most discrimination features, which is getting characteristics to maximize the deep margins. In future studies, the linear structures such as speculated lines and microcalcification features will also be extracted to enhance the classification accuracy.
5. Conclusions
A novel computer-aided diagnosis of a mammographic mass classification framework called DeepCAD is presented in this paper by using deep invariant features (DIFs) and along with a four-layer deep neural network (DNN) multilayer architecture. Instead using direct pixels from images, a particular descriptor was designed to better explain the content of mammographic images by using region-of-interest (ROIs) images. The developed DeepCAD system directly learns these invariant descriptors in supervised and un-supervised fashion to effectively classify benign and malignant masses. It noticed that the previous techniques mostly utilized convolutional neural networks (CNNs) models that were directly learning features from raw image pixels to recognize breast masses. Through experiments, the learning step for the CNN multilayer architecture became very complex and required expert domain knowledge. As a result, the proposed DeepCAD system is capable of learning an invariant feature descriptor that is very easy to learn with a deep learning model. The DeepCAD model is composed of deep belief networks (DBNs) along with a linear activation function and a softmax predicted layer.
A total set of 600 (i.e., 300 benign masses and 300 malignant masses) region-of-interest (ROIs) masses was selected to test and compare the performance of the proposed DeepCAD system. The datasets have been collected from two international sources, DDSM and mini-MIAS. To evaluate its performance, the classification accuracy of proposed DeepCAD system was compared with the state-of-the-art classification algorithms such as CNN-Max-CAD-Qiu and CNN-CAD-Jiao by 10-fold cross validation test. The difference between AUC of DeepCAD and other methods are statistically significant with sensitivity (SE) of 92%, specificity (SP) of 84.2%, accuracy (ACC) of 91% and AUC of 0.91. This accuracy was obtained by using DeepCAD system compared to two other CNN-Max-CAD-Qiu and CNN-CAD-Jiao classification systems. The CNN-Max-CAD-Qiu system is overall better than CNN-CAD-Jiao but less effective than the proposed DeepCAD system. The DeepCAD algorithm performed well due to the fact that it selected the highest-discrimination invariant deep features. Finally, the combination of both representations of features and deep learning architecture resulted in the best descriptor for benign and malignant mass classification, obtaining a 0.91 AUC score. The experimental results indicate that the proposed DeepCAD system is reliable for providing aid to radiologists without the need for explicit design and selection of problem-oriented features.
According to the results obtained for the proposed DeepCAD system, the effectiveness of deep invariant features (DIFs) contributed greatly to the breast mass classification task. In the future, the convolutional neural networks (CNN) and deep-belief networks (DBNs) will be combined as a hybrid model to increase the classification accuracy and to obtain more descriptor features. More breast mass datasets will be added to test the performance of the proposed DeepCAD and also to make this system work for real-time diagnosis procedures. As a result, the proposed strategy is initial and limited due to the dataset, which may result in insufficient training and affect the system robustness. The clinical usage of the proposed DeepCAD system is also underway, which means it might be able to be tested through the dataset provided by the digital mammography DREAM challenge in the future. In addition, this paper utilizes the old digitized screen film mammograms that will be changed in the future to fully digital images to assess the clinical merit of the presented system.


