Article

Towards a Better Understanding of Mobile Banking App Adoption and Use: Integrating Security, Risk, and Trust into UTAUT2

Cyber Security Centre, WMG, Warwick Manufacturing Group, University of Warwick, Coventry CV4 7AL, UK
*
Authors to whom correspondence should be addressed.
Computers 2025, 14(4), 144; https://doi.org/10.3390/computers14040144
Submission received: 10 February 2025 / Revised: 4 April 2025 / Accepted: 8 April 2025 / Published: 10 April 2025
(This article belongs to the Special Issue Multimedia Data and Network Security)

Abstract

:
This paper expands the extended unified theory of acceptance and use of technology (UTAUT2) to include four additional constructs (security, risk, institutional trust, and technology trust), providing a more comprehensive understanding of mobile banking applications (m-banking apps) adoption. It also highlights the significant role of demographic factors in moderating the impact of these constructs, offering practical insights for promoting the use of mobile devices to access and manage banking services. Data were collected using an online survey from 315 mobile banking users and analysed using covariance-based structural equation modelling (CB-SEM). Most constructs of the baseline UTAUT2 were validated in the m-banking context, with the additional constructs confirmed to affect user intention to adopt m-banking apps, except perceived risk. The model explained 79% of the variance in behavioural intention (BI), and 54.7% in use behaviour (UB), achieving higher fit than the baseline UTAUT2. Age, gender, experience, income, and education moderated the impact of perceived security and institutional trust on BI; age, education, and experience moderated technology trust on BI; and age, gender, and experience moderated perceived security on UB. The guarantee of enhanced security, advanced privacy mechanisms, and trust should be considered paramount in future strategies aimed at promoting m-banking app adoption and use. Overall, the paper advances scientific knowledge by providing a more nuanced and comprehensive framework for understanding m-banking app adoption, validating new constructs, and offering practical recommendations for promoting m-banking usage.

1. Introduction

Advancements in mobile technology have led many banks to develop mobile banking applications, commonly known as “m-banking apps”. These apps allow clients to access the same services available at physical bank branches anytime, anywhere [1]. For customers, this translates into greater convenience, lower transaction costs, and improved access to financial services [2]. For banks, m-banking reduces operational and managerial costs [3]. Moreover, by creating apps that are user-friendly, useful, and personalized, banks can strengthen their relationships with customers, who are then more likely to engage with bank services, leading to increased business for the bank [4]. Consequently, m-banking holds significant value for both banks and their customers.
A recent consumer survey report by Entersekt, conducted with 5000 banking consumers across the UK, Norway, Hungary, and Germany, offers valuable insight into consumer behavior regarding the use of m-banking apps, as well as perceptions of banking security and data privacy [5]:
  • 72% of respondents reported using their banking app multiple times per week.
  • 74% stated that they feel secure using their banking app for online banking.
  • 51% expressed concerns about fraud when shopping online.
  • 71% indicated that they prioritise transaction security over user experience.
As mobile banking and online channels continue to be the preferred methods for users accessing their banking services [6], this usage has attracted more attention from cybercriminals and hackers targeting these platforms [7]. In the first half of 2022, fraud resulted in losses of £305.2 million for financial institutions in the UK—an increase of over 4% compared to the same period in 2021 [8]. Mobile devices are increasingly targeted by malware designed to steal sensitive information, such as credit card details and passwords. Android users, in particular, are highly susceptible to these attacks due to the open-source nature of the operating system. Reports indicate that 50% of Android users have been targeted by banking malware [7]. In addition to banking malware, mobile banking users face other risks, including SIM-swap attacks, device cloning, and man-in-the-middle attacks [8]. A recent strain of this threat is a type of banking malware known as “Snowblind”, which specifically affects Android devices [9].
In addition to these vulnerabilities that come with using m-banking apps, financial transactions through online channels are often marked by uncertainty, anonymity, and the absence of human interaction or interpersonal relationships. These factors may inherently create conditions that increase user security risks, creating mistrust in mobile banking within the virtual environment [10]. Therefore, it is crucial to distinguish between the trust of users in the Internet as a medium (technological trust) and their trust in the banks themselves (institutional trust). Users who lack confidence in the security of m-banking apps may ultimately prefer to continue with traditional banking services and methods [11]. Despite the improvements in communication channels, these users may still prefer traditional methods over digital ones [2].
The perception of security and the risks associated with m-banking apps play a crucial role in their adoption for mobile and online financial transactions. Security remains a significant concern for user trust in mobile financial services [12], particularly due to the transfer of sensitive financial information over the internet. To enhance security, it is important to keep devices updated with the latest security patches to prevent the exploitation of known vulnerabilities. Additionally, implementing 2FA and biometric security features can usually further strengthen security measures, especially in the event that devices are lost or stolen; however, some new types of malware like Snowblind can still disable and bypass these security measures [9].
Several studies have examined user perception of trust, risk, and security of online banking, m-banking, and internet banking in general [12,13,14,15,16,17,18,19]. For example, ref. [13] found that perceived security and perceived trust played a key role in improving the adoption of m-banking services in addition to service quality, whereas perceived risk harmed attitudes toward using these services. Others found that perceived security, satisfaction and trust were not statistically significant in terms of their relationship with m-banking adoption intention, with trust mediating the relationships between perceived security and satisfaction [14]. Perceived risk and perceived trust have also been shown to moderate the relationship between behavioural intention and actual usage of mobile banking [20]; however, in another study, the moderating role of perceived trust was not confirmed [21], potentially due to contextual differences.
These studies, however, often lack an examination of how individual differences and characteristics moderate the effects of perceived security, risk, and trust on the adoption of m-banking apps. When such moderating effects are considered, they are frequently anecdotal rather than empirical. For instance, ref. [22] highlighted the significance of cultural moderators (such as collectivism, uncertainty avoidance, short-term orientation, and power distance) in enhancing the explanation of usage behaviour within the UTAUT2 model.
The unified theory of acceptance and use of technology (UTAUT) and its extension (UTAUT2) are primarily applied to explain user adoption behaviours in the early stages of technology acceptance and adoption. UTAUT2 has been applied, validated, and extended across various fields, such as artificial intelligence (AI) technology [23], e-services [24], mobile banking [17], online shopping [25], internet banking [26], smartphones [27], and e-learning [28], enabling the study of technology acceptance in both organisational and consumer contexts. Despite the extensive application and validation of the UTAUT2 model in various settings, there is still a lack of understanding regarding how this model applies specifically to the use and adoption of m-banking apps. This paper seeks to enhance this understanding by first validating constructs of the baseline UTAUT2 in the m-banking context, followed by identifying new constructs that are specific to this context. Namely, from a theoretical perspective, this study contributes by expanding the UTAUT2 model through the integration of the following four additional constructs: security, risk, institutional trust, and technology trust.
There also remains a significant gap in understanding how demographic characteristics influence the adoption of m-banking applications. Previous studies have primarily focused on the direct effects of constructs, such as performance expectancy, effort expectancy, social influence, and facilitating conditions on technology adoption. However, the moderating effects of demographic factors, such as age, sex, income, and education, on these constructs have not been thoroughly examined in the context of m-banking apps. This gap is critical because demographic characteristics can significantly alter user perceptions and behaviours, thereby affecting the overall adoption and usage of m-banking apps. Our study addresses this gap by examining the moderating effects of demographic characteristics on perceived security, perceived risk, and trust, thus providing a more nuanced understanding of the adoption of m-banking. By doing so, the study improves the generalizability and applicability of the UTAUT2 model within the m-banking context. From a practical perspective, the findings can inform future strategies and policies aimed at increasing m-banking usage.
The remainder of this paper is organised as follows. The Section 2 presents a literature review covering related works, the theoretical framework, the conceptual model for the study, and hypothesis formulation. This is followed in Section 3 by an overview of our methodology detailing the data collection procedure. We discuss the results of our work in Section 4 and then provide a discussion of the theoretical and practical implications, limitations, and directions for future research in Section 5.

2. Background

Technological vulnerabilities continue to be major concerns for m-banking app deployment [29,30] regardless of the advances in technology protection and security [31,32]. Adequate information on security measures is therefore necessary to build trust towards m-banking, allowing for appreciation of such systems [18,33], which otherwise may be abandoned in favour of traditional banking.

2.1. Factors Influencing Adoption

Perceived security, perceived risk, and trust have emerged as key determinants of consumer acceptance and usage of m-banking apps [34], alongside numerous other individual characteristics that influence adoption. We discuss these factors in greater detail below.

2.1.1. Security, Risk, and Trust

In one of the earliest studies, ref. [35] carried out an empirical investigation into perceived risk, usage frequency, and brand awareness of mobile banking services, showing risk perception influences individuals’ behavioural intention to use mobile banking services. Similarly, ref. [36] also found that perceived security is the most important factor in mobile and internet banking services. Ref. [37] suggested that trust affects user attitude and perceived risk towards m-banking apps; however, the latter did not affect user intention to use these apps. Similarly, refs. [32,38] revealed that users’ perceived security and trust influence online banking adoption intention. Ref. [39] investigated payment and security perceptions of social commerce and mobile payment platforms, showing trust to affect perceived risk; however, neither trust nor perceived risk had a significant effect on behavioural intention to use mobile payment platforms. In a related study, ref. [33] indicated that security affects trust and use intention of financial technologies.
Many other studies have empirically confirmed the effects of security [19,40,41,42], risk perception [43,44], and trust [17,44,45] on the adoption and use of mobile banking services. For example, one study measured the influence of cyber security factors on intention to use m-banking apps in the UK older generation (55+), concluding that perceived cyber security risk influenced intention to use these applications, whereas perceived cyber security trust and overall security had no effects [40]. Others examined the effect of security and risk on the adoption of electronic banking services in India, showing that security risk played an important role in user intention to adopt and use electronic banking services [45].
This paper provides a more comprehensive framework for understanding the factors that influence the adoption and use of mobile banking services, helping financial institutions develop better strategies to enhance user acceptance and trust. For the first time, security, risk, and trust factors have been integrated into an existing framework to enhance understanding of m-banking adoption and use. This involved formulating hypotheses about how these new constructs (security, risk, and trust) interact with existing constructs within the framework, measuring user perceptions of both old and new constructs, and modeling the relationships between them. The framework was updated to include paths between the new constructs and the existing ones, resulting in a more detailed and context-specific framework for understanding and improving the adoption and use of mobile banking services. We discuss the original framework, the updated framework, and the process of expanding the original framework next. Prior to that, we address individual characteristics that moderate the constructs.

2.1.2. Individual Characteristics

In addition to factors like security, risk, and trust, individual characteristics have been found to play a significant role in adopting mobile banking apps. While some research, such as that by [46], asserts that gender does not influence technology acceptance, other studies present a different perspective [47,48]. Additionally, age, experience, income, and education have all been identified as important influences on technology adoption [49,50].
A recent study by [51] built on earlier research by [52] by incorporating age and gender as moderating factors affecting the relationship between security and the behavioural intention to use m-banking apps among UK consumers. This study revealed that age does moderate the impact of trust, while gender showed no significant relationship with security, trust, or privacy.
This study represents the first attempt to examine how demographic characteristics, such as age, gender, income, and education, as well as additional characteristics, such as experience, moderate perceived security, perceived risk, and trust in the adoption of m-banking apps, offering more nuanced understanding of user behaviour.

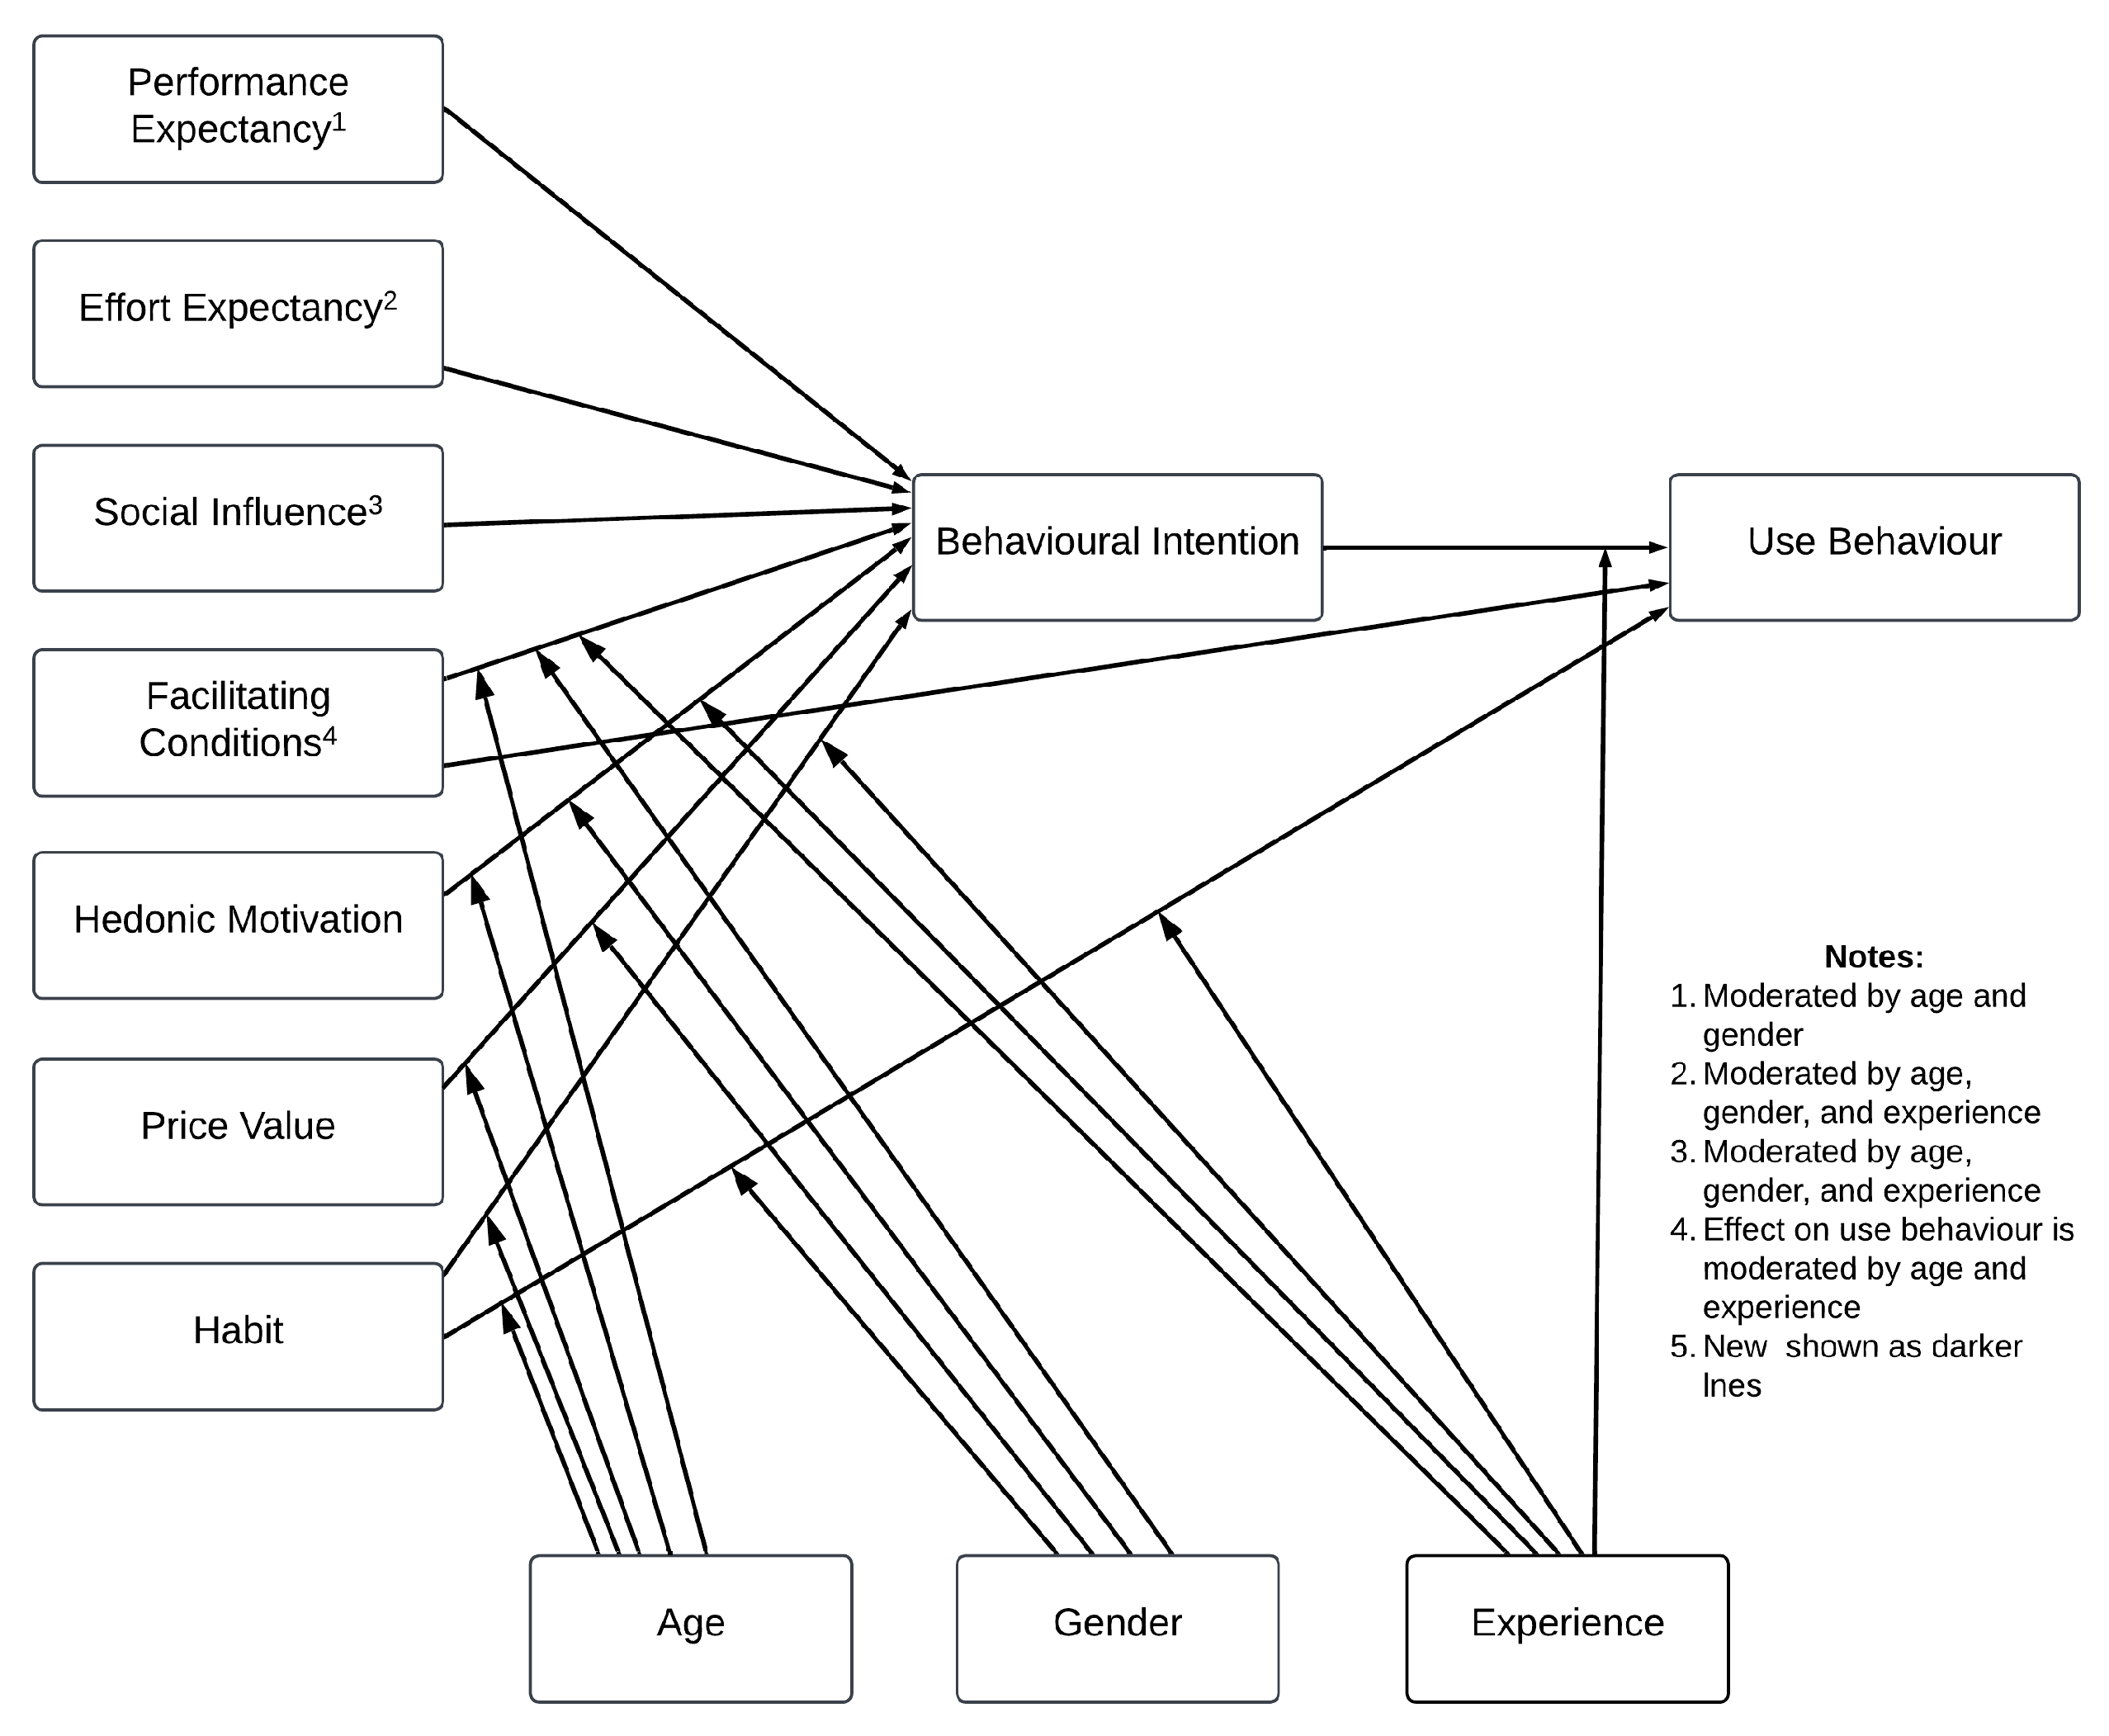
2.2. Theoretical Framework

Technology acceptance is a well-established and widely researched field, encompassing various competing theories and models of adoption. The UTAUT model distilled and highlighted critical factors and contingencies from several leading models, measuring behavioural intention to adopt and use technology within organisational contexts [53]. Since its initial publication, UTAUT has served as a foundational model in numerous studies, receiving diverse applications that have contributed to its enhanced generalisability [54].
The UTAUT2 model builds on the original UTAUT framework by incorporating behavioural and attitudinal factors that influence technology use in non-organisational contexts. This enhancement results in an even greater precision in explaining technology acceptance compared with the original model [54]. Consequently, we have chosen UTAUT2 as the theoretical foundation for this study. Below, we will explain both models in more detail.

UTAUT Models

Traditionally, acceptance of m-banking and its related applications has been predicted using five models [17]: the diffusion of innovation theory (DOI) [55], theory of reasoned action (TRA) [56], theory of planned behaviour (TPB) [57], technology acceptance models (TAM) [58], and theory of perceived risk (TPR) [59]. The empirical revision of these models led [53] to propose the UTAUT, which embraced and reflected all key acceptance factors from the five models except the TPR. Four additional models were also added to UTAUT: the motivational model (MM) [60], the PC utilisation model (MPCU) [61], the social cognitive theory (SCT) [62], as well as the integrated model of technology acceptance and planned behaviour (TAM-TPB) [63].
The UTAUT suggests that the actual use of technology is determined by behavioural intention pertaining to the direct effect of four key constructs: performance expectancy, effort expectancy, social influence, and facilitating conditions. The model accurately predicted system usage and acceptance in an organisational setting and also accounted for other influences as well as interaction terms, such as demographic variables (age, gender, experience) [64]. This made the UTAUT more efficacious in technology acceptance over its counterparts [65].
Notwithstanding the success of UTAUT, it faced its own limitations as the conception was purely based on organisational settings rather than individual consumers [66]. UTAUT also suffered from other shortcomings, such as task–technology fit, technology performance, and user satisfaction, which are pre-requisites for the measurement of technology usage and success [67].
Recognising these shortcomings, UTAUT2 added three new constructs (hedonic motivation, price value, and habit), dropped voluntariness, and proposed new relationships and moderators [54]. For instance, a link was introduced between facilitating conditions and behavioural intentions. UTAUT2 also included a moderated relationship of age, gender, and experience pertaining to the three new constructs integrated.
Figure 1 shows detail constructs and the relationship among the various constructs in UTAUT2.
This research contributes to the existing body of knowledge by enhancing the UTAUT2 model specifically for the mobile banking context. The paper first validates the existing constructs of the UTAUT2 model within the context of mobile banking. This ensures that the baseline factors influencing technology adoption are relevant and reliable for mobile banking services. The study then introduces four additional constructs—security, risk, institutional trust, and technology trust—into the UTAUT2 model. By doing so, it addresses specific factors that are particularly important in the mobile banking context. By expanding the UTAUT2 model with these new constructs, the paper enhances the model’s generalisability and applicability. The updated model can therefore better explain and predict user behaviour and adoption of mobile banking services. The conceptual model for the study is presented below, including justification.

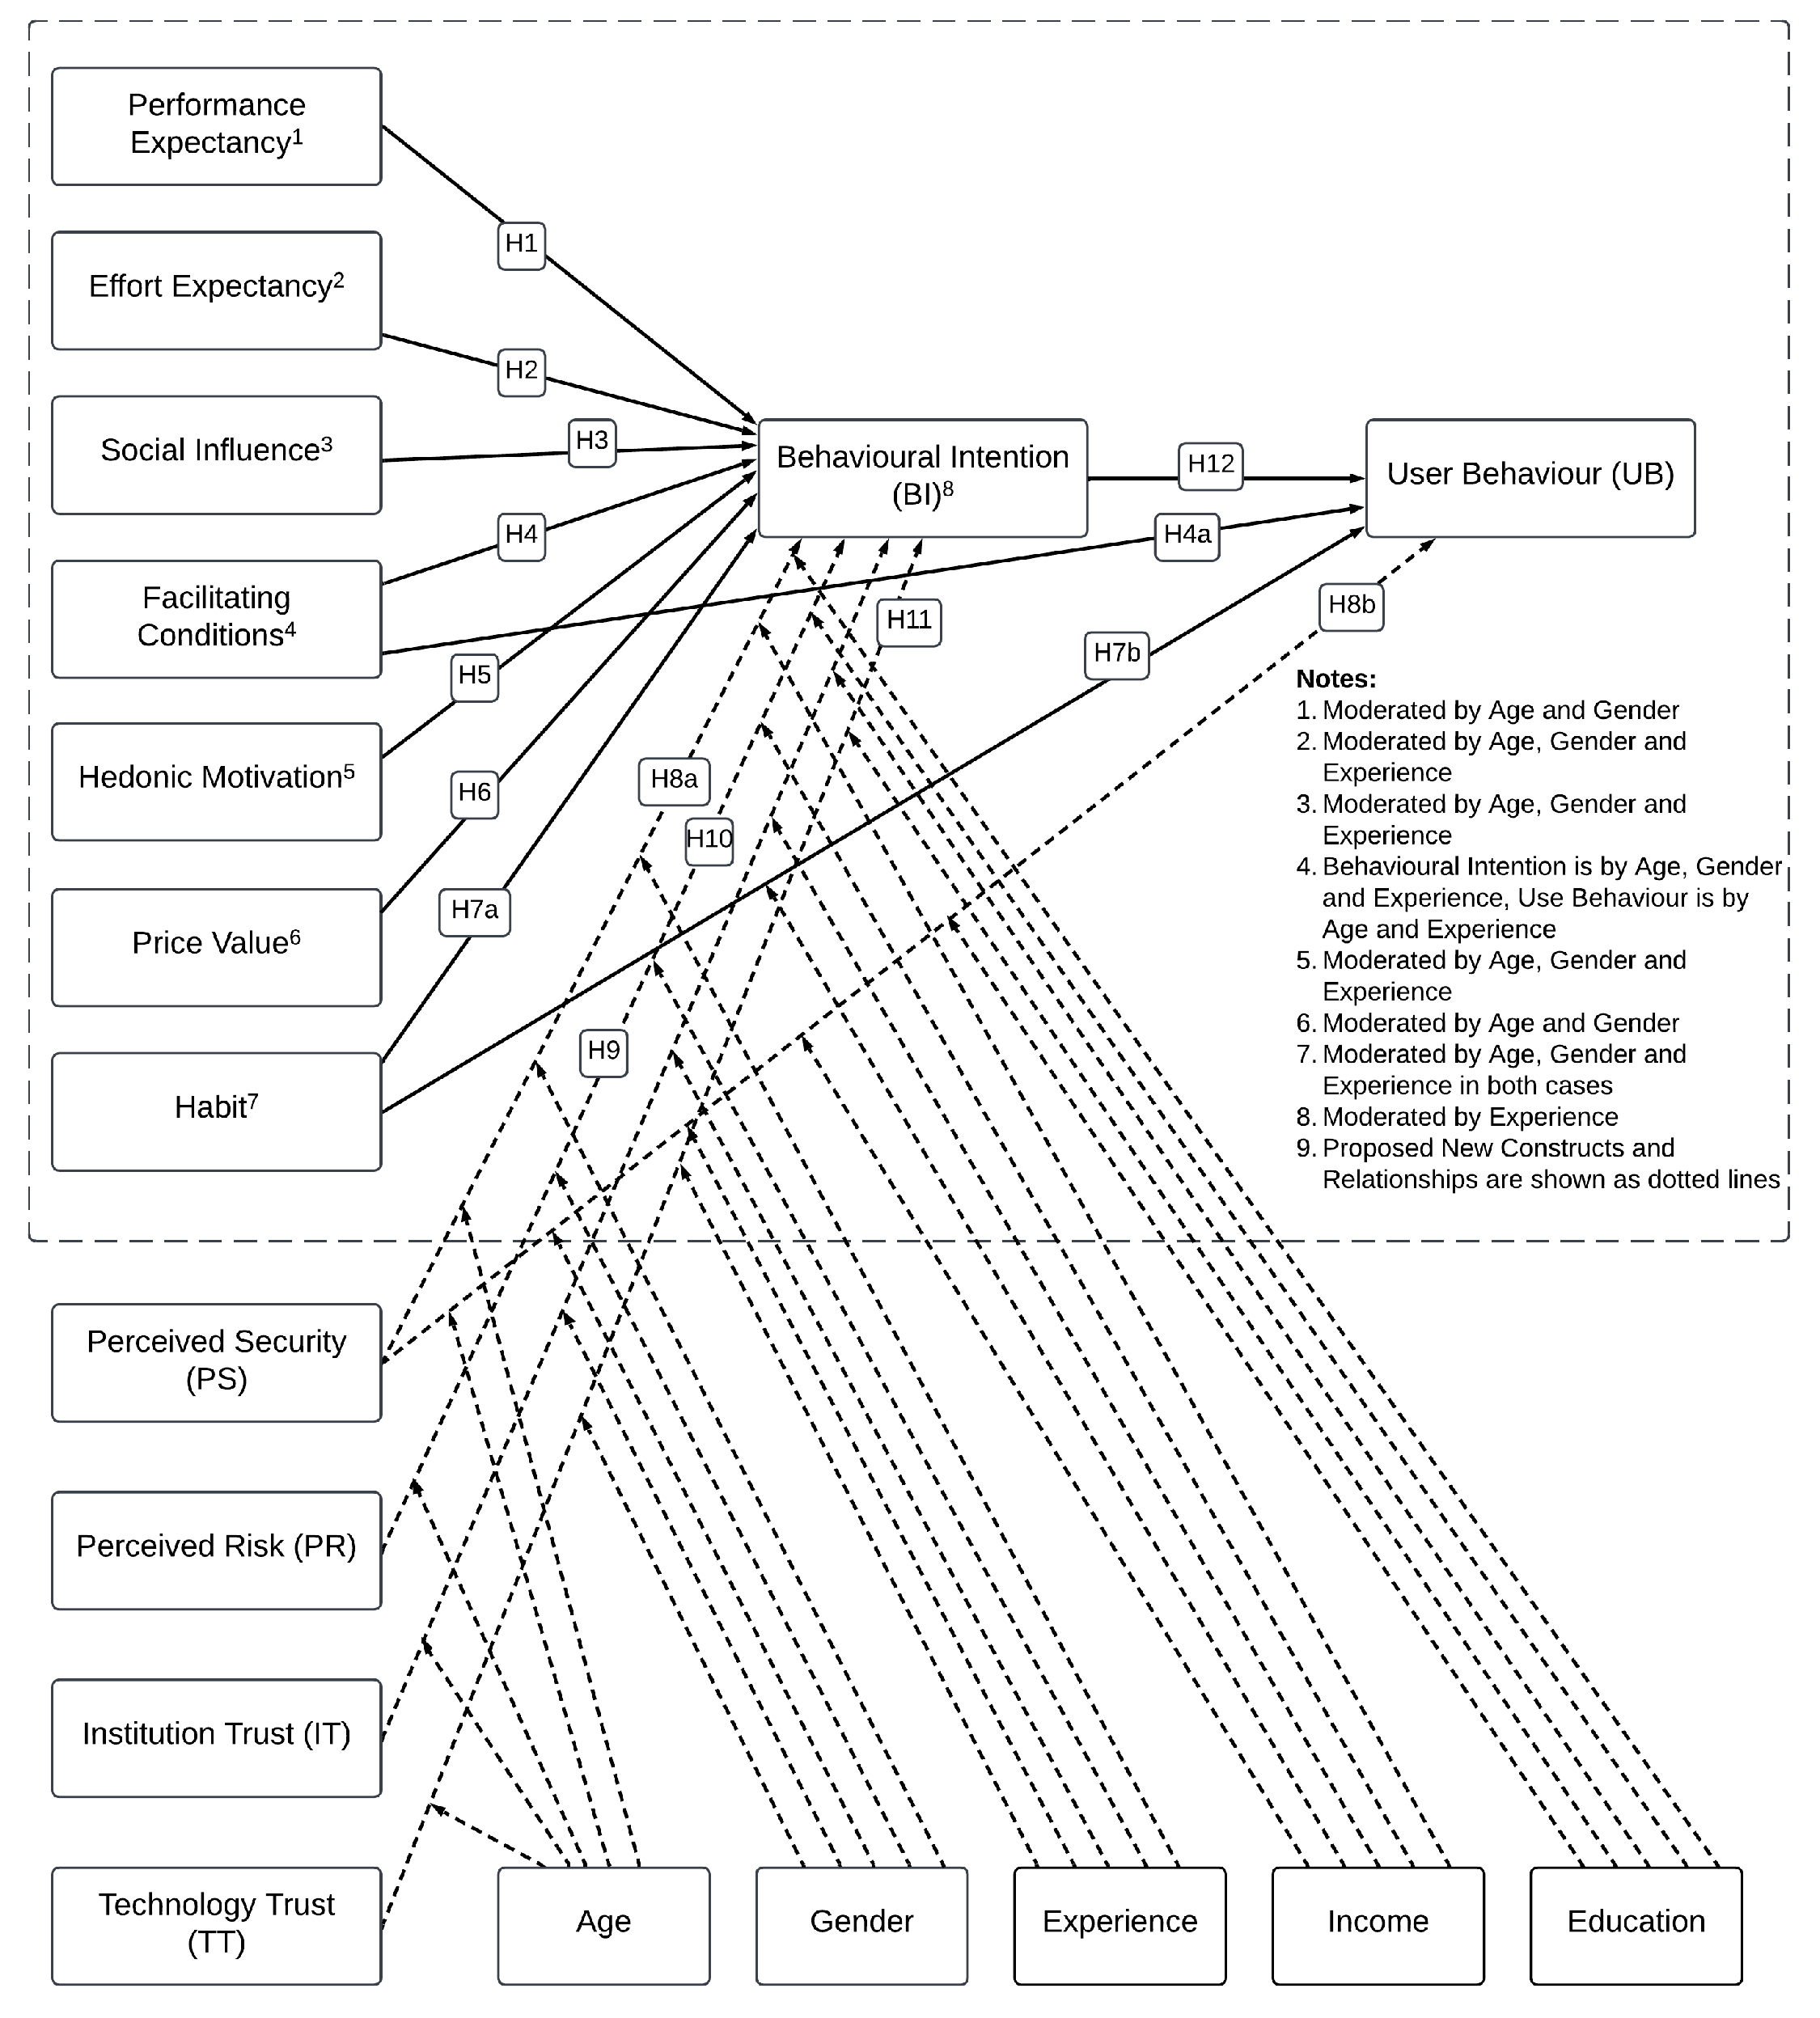
2.3. Conceptual Model for the Study

The conceptual framework for this study uses the UTAUT2 as a theoretical foundation (baseline model), and extends it further with the following four new constructs relevant to the adoption of m-banking apps: perceived security, perceived risk, institutional trust, and technology trust. Moderating effects of various demographic variables and experience are also examined for the added constructs.
UTAUT2 has been chosen due to its superior predictive ability over other models. For example, the TAM theory excludes key factors to explain an individual’s technology acceptance, such as enjoyment, price value, habit, cultural influence, and demographic variables, which in contrast are accounted for in the UTAUT2 model. Moreover, despite being validated in many different applications, UTAUT2 falls short of constructs relevant in high-risk settings, such as the banking sector. The banking industry is particularly vulnerable due to the susceptibility of m-banking apps, third-party breaches, and risks associated with cryptocurrency. Security issues are pressing concerns for mobile banking customers, as mobile access and high connectivity of various devices create new threat exposure for m-banking apps. Because of this, many customers are suspicious of banking apps; thus, gaining user trust becomes critical for m-banking app usage.
Therefore, this study extends the UTAUT2 with perceived security, perceived risk, and trust as being relevant constructs for m-banking app adoption, alongside additional characteristics moderating the relationship with users. Specifically, the research seeks to determine the role of age, gender, income, education, and experience in moderating the effect that perceived security (PS), perceived risk (PR), institutional trust (IT), and technology trust (TT) have on behavioural intention (BI) and—by extension—on user behaviour (UB). Figure 2 demonstrates the proposed conceptual model.
In the rest of this section, the factors of the proposed model are presented in detail and the research hypotheses are formulated.

2.4. Hypotheses Formulation

Several hypotheses have been proposed to explain the adoption of m-banking apps pertaining to the seven constructs from the baseline model (performance expectancy—PE, effort expectancy—EE, social influence—SI, facilitating conditions—FC, hedonic motivation—HM, price value—PV, and habit—HB) and four added constructs relevant for the adoption of m-banking apps (perceived security—PS, perceived risk—PR, institutional trust—IT, and technology trust—TT). Relationships between the following variables were considered: (a) the exogenous variables PE, EE, SI, FC, HM, PV, HB, PS, PR, IT, and TT, and the endogenous variable behavioural intention (BI); and (b) exogenous variables BI, FC, HB, and PS, and the endogenous variable user behaviour (UB). Moderating effects of demographic vaiables (age, gender, income, and education) and experience are also hypothesised for the added constructs. We define these effects and hypotheses below. Figure 3 provides detailed explanation of the hypothesised model.

2.5. Performance Expectancy (PE)

Performance expectancy is defined as “the degree to which an individual believes that using a system will help him or her to attain job performance” [53]. In effect, it is the benefit gained from using a technological innovation or system. This was considered as perceived usefulness in TAM [58], and relative advantage in DOI [55]. Performance expectancy suggests that individual will use computing technology if they believe the outcome of the usage will be positive. This reflects the perception of improvement by using mobile banking app technologies such as the speed of transactions, convenience, ubiquity, and immediacy [50]. Performance expectancy is expected to be one of the most important factors that influence the adoption and use of mobile banking applications [17]. Therefore, the following hypothesis is postulated:
Hypothesis 1.
Performance expectancy will positively influence user behaviour towards adopting mobile banking apps.

2.6. Effort Expectancy (EE)

Effort expectancy is defined as “the degree of ease associated with the use of a system” [53]. In other words, the willingness of users to adopt technology is more likely when little effort is required to effectively use it. This was considered as perceived ease of use in TAM [58], and complexity in DOI [55]. Subsequently, effort expectancy has been validated in many studies that used UTAUT2 as a predictor of adoption and use of technology [54,68]. Mobile banking consumers are more inclined to accept and adopt technology that requires less effort to use. As expected, studies have revealed that there is a positive correlation between perceived ease of use of m-banking apps and consumers initial willingness to use it [54,69,70]. In fact, service ease of use has been identified as the main reason consumers adopted technology [71]. It is assumed in this study that users are more likely to adopt mobile banking app service if it is believed to be easy to use. Therefore, the following hypothesis is proposed:
Hypothesis 2.
Effort expectancy will positively influence user behaviour towards adopting mobile banking apps.

2.7. Social Influence (SI)

Social Influence is “the degree to which an individual perceives that important others believe he or she should use the new system” [53]. This is because of the influence of friends, family, colleagues at work (co-workers), and the broader social networking sites (social media) on user perception and behaviour. TRA and TPB captured this as a subjective norm [56,57], and DOI captured it as image [55]. Social influence includes families, friends, co-workers, traditional media, and social media in general. Social influence has shown to have positive effects on behavioural intentions [54,71]. People are often influenced by others to use technology. Especially in the UK where technology has become part of everyday life, it is expected that friends, family, and social media become influencers of technology usage. Hence, it is hypothesised as follows:
Hypothesis 3.
Social influence has a positive effect on user behaviour towards adopting mobile banking apps.

2.8. Facilitating Conditions (FC)

Facilitating conditions are defined as “the degree to which an individual believes that an organisational and technical infrastructure exists to support the use of technology” [53]. TRA and TPB captured this as perceived behavioural control [56,57], and DOI captured it as compatibility [55]. The use of m-banking apps requires some skills, such as the ability to install native apps, internet use experience, and the ability to use mobile phones or tablets, as well as knowledge on security vulnerabilities. This implies that a user who has access to a set of facilitating conditions—such as demos, video tutorials, manuals on mobile banking, and support chats—will develop a greater intention to use the app [50].
Facilitating conditions, therefore, influence the intention to adopt and use mobile apps; hence, it is hypothesised as follows:
Hypothesis 4 (H4a).
Facilitating conditions will positively influence user behaviour towards adopting mobile banking apps.
Hypothesis 4 (H4b).
Facilitating conditions will positively influence actual use behaviour of mobile banking apps.

2.9. Hedonic Motivation (HM)

Hedonic motivation is the perceived enjoyment, amusement, and pleasure derived from using a technological innovation. Ref. [53] defined this as the “fun or pleasure derived from using technology”. As the enjoyment and entertainment value of mobile banking apps increases, the greater the acceptance of use of the technology by consumers. Hedonic motivation has been found to be associated with strong mobile banking use intention [54,69,70]. These findings and previous studies have accounted for the increase in integrating hedonic motivation for m-banking commerce and applications. Enjoyable experience and fun attached to the use of technology continually encourage mobile banking consumers to use technological-based services such as mobile banking apps. Therefore, the following hypothesis is postulated:
Hypothesis 5.
Hedonic motivation positively influences behavioural intention to adopt mobile banking apps.

2.10. Price Value (PV)

Price value is defined as a user’s cognitive trade-off between the perceived benefits of technology and the monetary cost of using it [54]. Price value is considered positive when the benefits associated with a technology are perceived to be greater than the cost associated with using it. According to [17], services with good price values are more likely to attract consumers. Also, a pivotal relationship has been established between the price of technological services and the adoption of such technology [54]. In the UK, the cost of mobile banking service is minimal or in some cases negligible. This is considered a positive step towards the adoption of mobile banking service. Therefore, the following hypothesis is proposed:
Hypothesis 6.
Price value positively influences behavioural intention to adopt mobile banking apps.

2.11. Habit (HB)

Habit deals with how people perform behaviour automatically due to learning. In effect, habit is considered to be a learned behaviour with a pleasing outcome in response to automatic stimulus [17]. Thus, habit will be created if consumers use technology frequently. Habit has been determined to be a factor in predicting consumer behavioural intention to use m-banking technology in numerous studies [17,54,70,72]. Consumers have been identified as using more technology when they become habituated to its use [72]. In this study, it is anticipated that continuous use of mobile banking apps will be achieved if consumers develop positive habits towards the services. Hence, it is hypothesised as follows:
Hypothesis 7 (H7a).
Habit will have a positive influence on behavioural intention to adopt mobile banking apps.
Hypothesis 7 (H7b).
Habit will have a positive influence on actual use behaviour of mobile banking apps.

2.12. Perceived Security (PS)

Data breaches that may lead to data leakage—including theft by cyber criminals and hackers—have contributed to security being a major concern facing mobile banking. Perceived security is defined as the “degree of belief in a technology or system to transmit sensitive information without breach or leakage” [17]. Undoubtedly, security remains one of the major concerns of consumers in their use of internet banking and electronic commerce platforms [73]. Cyber security vulnerabilities and their attendant challenges have left many to worry about online transactions. Adoption and use of m-banking apps have become a concern to consumers because of possible data breaches and leakage, including theft and damage caused by computer hackers and cyber criminals. While the UTAUT2 did not consider the aspect of security in the acceptance of technology, many other scholars and researchers have listed user security perception as a critical inhibitor of m-banking acceptance and growth of e-banking technology [17,34,74]. Without consumers being convinced of the security of m-banking apps, their trust towards the usage of such systems will be non-existent. Hence, the following hypotheses are assumed:
Hypothesis 8 (H8a).
Perceived security will positively influence behavioural intention to adopt mobile banking apps with age, gender, education, income, and experience as moderators.
Hypothesis 8 (H8b).
Perceived security will positively influence actual use behaviour of mobile banking apps with age, gender, education, income, and experience as moderators.

2.13. Perceived Risk (PR)

Perceived risk rather than perceived privacy is considered a relevant construct in this study, contrary to other studies [70,75] that have argued for perceived privacy as a factor for electronic banking. This study deviates from such studies and, rather, considers perceived risk a critical determining factor of m-banking app adoption. For instance, ref. [17] hypothesised, tested, and found that perceived privacy positively influenced behavioural intention of Lebanese and British consumers to adopt mobile banking. The deviation from perceived privacy to perceived risk stems from the fact that consumers consider the risk of losing money through their mobile banking transactions to be a result of security vulnerabilities [35,76,77], rather than the mere disclosure of their information if that cannot result in the loss of money or cause any substantial damage. Secondly, information disclosure, which perceived privacy seeks to address, is a component of security. Non-information disclosure is a parameter in the security consideration of every system [78]. Additionally, the theory of perceived risk (TPR) considers many facets of risk, including privacy. In TPR, ref. [59] defined perceived risk as the potential for loss in the pursuit of a desired outcome in using technology or electronic service. The review has shown that perceived risk influences people’s trust in the security of a technological innovation [35,79]. Thus, if users perceive a technology to be risky, they will not use it. Therefore, the following hypothesis is proposed:
Hypothesis 9.
Perceived risk will negatively influence behavioural intention to adopt mobile banking apps with age, gender, education, income, and experience as moderators.

2.14. Institutional Trust (IT)

Trust remains a critical antecedent that influences many electronic businesses, including internet banking, mobile banking, and e-commerce [34]. Trust of vendors and sellers in online transactions is very important. Institutional trust is therefore the trust between financial service providers and customers based on customers’ prior experience or a service provider’s good reputation [17,80]. Thus, higher trust in a service provider will lower users’ perceived risk. Therefore, with increased trust in financial institutions and the banking sector, trust in the use of mobile banking applications is expected to increase, and the following hypothesis is anticipated:
Hypothesis 10.
Institutional trust will positively influence behavioural intention to adopt mobile banking apps with age, gender, education, income, and experience as moderators.

2.15. Technological Trust (TT)

The desire of users to make financial transactions using mobile banking applications is influenced by the role technology plays. Technology remains an important precursor in encouraging and facilitating electronic business transactions. However, many users hesitate to transact business through electronic means due to lack of trust in the internet medium [34]. Technological trust is the trust of users in the internet medium or the channel used for banking transactions [81]. Trust is also a subjective disposition to have positive assumptions for the consistent occurrence of an action [82]. Trust of technology has been found to be a critical predictor of behavioural intention to use technology. Technological trust is also considered an important influencer of behavioural intention due to its inverse relationship with perceived risk [17]. Therefore, higher trust in technology will lower the perceived risk and positively affects users’ desire to use m-banking apps, hence the inclusion of trust as a new construct to be tested. Hence, the following hypothesis is proposed:
Hypothesis 11.
Technological trust will positively influence behavioural intention to adopt mobile banking apps with age, gender, education, income, and experience as moderators.

2.16. Behavioural Intention (BI)

Consistent with most technology acceptance models drawing upon psychological theories, which argue that individual behaviour is predictable and influenced by individual intentions [83], both the initial UTAUT and UTAUT2 support the belief and assertion that behavioural intention has substantial influence on technology use [53,54]. Therefore, the following hypothesis is proposed:
Hypothesis 12.
Behavioural intention to adopt mobile banking apps will positively influence actual use behaviour of mobile banking apps.

3. Methodology

3.1. Data Collection

The study employed cross-sectional primary data collection using surveys to examine user perceptions of their experiences with m-banking apps. Since we wanted to test the proposed hypotheses quantitatively, this study used a questionnaire as a means of collecting quantitative responses to enable this analysis. Quantitative approach was deemed appropriate to further understand and evaluate the applicability of the proposed conceptual model in explaining behavioural intention to adopt m-banking apps.
The researchers ensured participants’ confidentiality, maintaining secure data management and obtaining informed consent (written), as informed by [84,85]. Ethical approval was sought from and granted by the University of Warwick. The study adheres to the Declaration of Helsinki.
The online questionnaire (Qualtrics) was distributed through various platforms, including social media in the UK. Whilst this approach ensured that the questionnaire is widely distributed, responses were limited to UK consumers. Several approaches were employed to ensure the study findings are valid and reliable. Three participants were used to pre-test the questionnaire to ensure content validity. A pilot study was conducted using 20 participants to ensure the readability and clarity of the questionnaire items, and also to verify if the collected data answered the questions under investigation by providing face validity [86]. The pilot study also ensured the conclusion and information obtained was credible for construct validity. The pilot study resulted in the removal of two questions under the construct of perceived security and the modification of two other questions.
The study adopted non-probability convenience sampling. The overall consideration in selecting this sampling technique included the following: (a) the size of the study population, (b) the extent of ease of access to the study respondents, and (c) the homogeneity of the population. The convenience sampling also enabled data collection from potential study participants who were readily available. By using convenience sampling, any UK banking consumer was eligible to participate in the study without exception. Many researchers have adopted this approach before [17,19,39].

3.2. Measurements of the Latent Variables

Table 1 shows the variables and associated measurement items, showing where all the items under each construct were sourced from. Among 13 variables, two served as the outcome variable (IB and UB), with IB gauging the intention to use m-banking apps and UB indicating the actual use behaviour. The baseline UTAUT2 model also used a 7-point Likert scale (1 = Strongly Disagree, 2 = Disagree, 3 = Somewhat disagree, 4 = Neither Disagree nor Agree, 5 = Somewhat Agree, 6 = Agree and 7 = Strongly Agree) [54] for enabling results comparison, as well as to optimise overall reliability [87]. UB was measured with multiple-choice questions about the frequency of mobile banking usage, with the following options provided: (i) have not used; (ii) once a month; (iii) once a week; (iv) multiple times a week.
The initial model consisted of 12 constructs and 38 indicators. These constructs are PE, EE, SI, FC, HM, HB, PV, PS, PR, IT, TT, and BI. All constructs consisted of three indicators each, except EE and FC, which were measured with four indicators. Ideally, items under each construct should not be less than 3 to meet the model explanation as per the original UTAUT2 model. More items can be added depending on the field of application of the model and the relevance of the item questions. Later we added the additional construct of UB, which was measured with one indicator for practical reasons, following the practice of earlier studies [88].

3.3. Data Analysis

This study adopted covariance-based structural equation modelling (CB-SEM) using the analysis of moment structures (AMOS version 26). SEM is a statistical technique that allows simultaneous testing and estimation of hypothesised relationships within a conceptual framework [89].
Two popular methods dominate SEM in practice: covariance-based SEM (CB-SEM) and partial least squares SEM (PLS-SEM, also called PLS path modeling). PIL has been introduced as a “causal–predictive” approach to SEM [90], which focuses on explaining the variance in the model’s dependent variables [91], whereas CB-SEM has been identified as one of the most suitable techniques for elaborating concepts and theories without the need to resort to multiple statistical methods [92]. CB-SEM is therefore used in this study to confirm (or reject) theories and their underlying hypotheses relevant for behavioural intention to adopt m-banking apps, as enunciated and proposed earlier. The decision to adopt CB-SEM for this study was also based on its appropriateness and applicability in situations where there is the occurrence of transition between exogenous (dependent) and endogenous (independent) variables, as in the case of behavioural intentions [93].
The two-step approach was used to investigate relationships in the proposed conceptual model, as advocated by [94]. Firstly, confirmatory factor analysis (CFA) was employed to test fitness of the measurement model, followed by evaluating validity and reliability of its constructs using [95]’s recommendations. This analysis involved the examining of reliabilities of the individual items (indicator reliability), reliability of each latent variable, internal consistency (Cronbach alpha and composite reliability), construct validity (loading and cross-loading), convergent validity (average variance extracted, AVE), and discriminant validity (Fornell–Larcker criterion and cross-loading). Reliability and validity hmust be achieved in the measurement model before the structural model can be tested.
The follow-up structural model analysis involved testing relationships between the following: (a) the exogenous variables PE, EE, SI, FC, HM, HB, PV, PS, PR, IT, and TT, and the endogenous variable BI; and (b) exogenous variables BI, FC, HB, and PS, and the endogenous variable UB. The regression model building adopted the stepwise procedure using hierarchical regression model as recommended by [96]. Four models were run separately to examine BI. Namely, Model 1 considered the constructs of the baseline UTAUT2 (PE, EE, SI, FC, HM, PV, and HB) to test the direct effects on BI. In Model 2, the UTAUT2 constructs were run with the new constructs (PS, PR, IT, and TT). Model 3 combined the baseline constructs of UTAUT2, the new constructs, and the following moderators: Age (AGE), gender (GEN), experience (EXP), income (INC), and education (EDU). Lastly, the interaction terms were introduced in Model 4. Similarly, four models were run separately to examine UB. Namely, Model 1 considered the constructs of the baseline UTAUT2 (FC, HB, and BI) to test the direct effects on UB. In Model 2, the UTAUT2 constructs were run with the new construct (PS). Model 3 combined the baseline constructs of UTAUT2, the new construct (PS), and the following moderators: Age (AGE), gender (GEN), experience (EXP), income (INC), and education (EDU). Lastly, the interaction terms were introduced in Model 4. The demographic characteristics of the study were also analysed at the onset using descriptive statistics. We present results in the next section.

4. Results

4.1. Descriptive Analysis

Data were screened for duplicate responses and missing data, of which none were detected. Screening for relevance further showed three respondents indicated they have never used m-banking apps. These were therefore removed, as the study aims to measure the experiences of m-banking users. Consequently, 315 valid responses were retained for the final data analysis.
Table 2 shows descriptive statistics and results for normality tests of items for all the constructs except UB. The school of thought is that the interesting check for normality should be on the residuals. We report the frequency of use and experience as part of the demographic characteristic data (see Table 3). Nonetheless, the mean for the UB is 3.48, and the standard deviation (SD) is 1.29.
The mean response for all the construct indicators was above 4. The mean value ranges from 4.23 (HB3) to 6.39 (FC2). This indicates that the majority of participants expressed generally positive responses to the factors in this study. A test of normality was conducted to examine whether the data are normally distributed and accurate for data analysis. The absolute kurtosis value ranges from 0.03 (HM1) to 10.169 (PE1), and absolute skewness value ranges from 0.193 (PR2) to 3.291 (PE1). The maximum kurtosis value was 10.169 10 , and the maximum skewness value was 3.291 3 . When utilising SEM, the rule of thumb suggests absolute kurtosis value of |±10| and skewness value of |±3| are considered appropriate [97,98]. This means that all 38 data items in the dataset met the criteria for normal distribution. Kolmogorov–Smirnova (KS) and Shapiro–Wilk (SW) tests were conducted to examine the sample distribution for possible response bias. Although SW test is more appropriate for samples less than 50, it can be run for higher values as well. The rule of thumb is that if the data are less than 50, then SW alone is enough. However, for larger samples, both SW and KS can be run in comparison. Both tests were statistically significant, indicating no non-response bias was present [99].
As shown in Table 3, a close distribution of gender was observed. Also, the age distribution indicates that the respondents were predominantly young, aged 16–44 years (more than 90%). This possibly explains the greater levels of m-banking experience recorded in this study. More than 85% of the respondents reported m-banking usage experience of two or more years. In order to better understand the use of technology in a population-based study, the participation of the older generation is valuable. However, a majority youthful participants, who often have an affinity towards technology, facilitates understanding of m-banking use intentions [17]. Majority (61.91%) indicated master’s degree education qualification.

4.2. Analysis of Measurement Model

By employing the maximum likelihood method, the model’s parameters were estimated using covariance metrics, as recommended by [100]. As depicted in Table 4, all the values obtained met their corresponding recommendations, indicating a satisfactory model fit. Results for the structural model are also given for comparison.
Having achieved good fitness, the model was then assessed for its reliability and construct validity (convergent and discriminant). Namely, composite reliability (CR) and Cronbach’s alpha were used to assess internal consistency; average variance extracted (AVE) was used to assess convergent validity; and Fornell–Lacker criterion and cross-loading of indicator were used to assess discriminant validity. Kaiser–Meyer–Olkin (KMO) measure of sampling adequacy and Bartlett’s test of sphericity were also used to measure suitability of the data for factor analysis (FA) and examine the correlation therein.
Table 5 shows the values of CR, Cronbach’s alpha, average variance extracted (AVE), factor loadings, KMO and Bartlett’s test for every construct.
  • CR values need to exceed the recommended level of 0.7 to ensure adequate or sufficient internal consistency [100]; similarly, a large Cronbach’s alpha (>0.7) suggests high internal consistency, meaning that the test is measuring one attribute.
  • Convergent validity confirms the reflective nature of each construct by its own indicators, ensuring that multiple-item factors are unidimensional [89] and that unreliable indicators are eliminated [101]. To ensure convergent validity, AVE should exceed 0.5 [102], in addition to being smaller than the CR.
  • Discriminant validity ensures that the latent constructs used for measuring the causal relationships under study are truly distinct from one another, eliminating risk of multicollinearity [89]. Discriminant validity of the construct is achieved when the square root of the AVE is greater than the correlation between the constructs, which is a method known as the Fornell–Lacker criterion [103].
  • The discriminant validity can be further evaluated by using cross-loadings. Cross-loading indicates that the item measures several factors. This item could be the source of multicollinearity between the factors, which is not desirable, as distinct factors are required. To establish discriminant validity at the item level, there should be a high correlation between items of the same construct and a very weak correlation between items of a different construct. A “cross-loading” item is an item that loads at 0.32 or higher on two or more factors. However, the rule of thumb suggests that a cross factor loading of not more than 0.7 is acceptable for discriminant validity [103]. By looking at cross-loading, the factor loading indicators on the assigned construct have to be higher than all loading of other constructs with the condition that the cut-off value of factor loading is higher than 0.7.
  • KMO can be used to assess sampling adequacy, referring to how strongly an item is correlated with other items in the EFA correlation matrix. KMO ranges from 0 to 1, with a correlation above 0.6 indicating sample adequacy for analysing the EFA output (Netemeyer et al., 1991 [104], Bearden et al., 2003 [105]). On the other hand, Bartlett’s test of sphericity (Bartlett 1950 [106]) indicates the item correlation matrix is not an identity matrix, providing a chi-square output that must be significant (p < 0.05) for factor analysis to be suitable. When both measures are satisfactory, researchers can move forward with exploratory factor analysis (EFA).
Bivariate correlations were further used to assess the possibility of multicollinearity among the exogenous constructs. Correlation value greater than 0.7 would suggest the presence of collinearity [107]. Additional test of multicollinearity involved computing the variance inflation factor (VIF). VIF values less than 3 are required to avoid the presence of multicollinearity [100].
As shown in Table 5, KMO is greater than 0.60 and Bartlett’s test of sphericity is significant (p < 0.05), allowing for conducing EFA. All factor loadings exceeded 0.7. Furthermore, the AVE values for all constructs were above 0.5, and both the CR and Cronbach’s alpha for each latent construct surpassed 0.7. Table 5 further displays that the square root of AVE is greater than the correlations with other constructs, indicating robust discriminant validity [103]. Additionally, the results confirmed that each item in the model had higher loadings on its respective parent construct compared to other constructs, thus establishing strong discriminant validity. The minimum correlation value was 0.704, and the highest VIF was 2.793, suggesting multicollinearity was not present in the sample data (see Table 6).
To ensure that we do not have artificially inflated correlations, we also examined whether the data suffered from common method variance (CMV) problem, which is “systematic error variance shared among variables measured with and introduced as a function of the same method and/or source”. CMV was evaluated using [108]’s recommended approach. The method factor computed was below 0.2, indicating common method bias is not a concern. Post hoc estimation of CMV was also assessed based on validated approaches [109,110]. A conservative estimate of the second-smallest positive correlation value (0.2) was deducted from all correlations. A re-run of the analysis showed no significant difference between original correlation values and the adjusted correlation estimates, suggesting no concern over CMV.
Having achieved good reliability and validity of the measurement model, there is enough evidence of statistically distinct constructs to test the structural model next.

4.3. Analysis of Structural Model

The results show that the baseline model (Model 1) only weakly predicted the intention to use m-banking apps BI (R2 = 41.5 % ). When adding the new constructs (Model 2), the extended model explained 43 % of the variance in BI. Model predictive power further improved with added moderators (Model 3) and interaction terms (Model 4), explaining 59 % and 79 % variance in BI, respectively. When predicting the user behaviour UB, the extended model including PS also performed better than the baseline model including FC, HB, and BI alone, with 32.1 % of the variance explained compared to 15.9 % . When adding moderators and interaction terms, the variance in UB also was quite good at 39.7 % and 54.7 % , respectively.
Figure 4 shows detailed results of the final structural model, including interaction terms (Model 4), which we will discuss next with respect to hypothesized relationships.

4.3.1. Hypothesis Testing

As shown in Table 7, five constructs of the baseline UTAUT2 were significant predictors of behavioural intention BI to adopt m-banking apps (EE: β = 0.124, p < 0.05; FC: β = 0.113, p < 0.01; HM: β = 0.132, p < 0.05; PV: β = 0.236, p < 0.001; HB: β = 0.141, p < 0.05), whereas three constructs were significant predictors of user behaviour UB (BI: β = 0.432, p < 0.01; FC: β = 0.288, p < 0.001; HB: β = 0.354, p < 0.01). Therefore, five out of seven hypothesized relationships of the baseline model were confirmed, and the following hypotheses were supported:
  • H2 which posited a positive impact of EE on BI;
  • H4 which posited a positive impact of both FC on BI and UB;
  • H5 which posited a positive impact of HM on BI;
  • H6 which posited a positive impact of PV on BI;
  • H7 which posited a positive impact of HB on both BI and UB.
This is highlighted in Table 7.
To the contrary of what was anticipated, Hypothesis 1 (H1), which proposed a relationship between PE and BI, and Hypothesis 3 (H3), which posited a positive impact of SI on BI, did not yield statistical significance (PE: β = −0.024, p = 0.468; SI: β = −0.094, p = 0.484). Overall, however, the results confirmed the applicability and validity of UTAUT2 as a theoretical base in predicting users’ behavioural intention and use behaviour of m-banking apps.
The four added constructs were used to examine BI, and PS was also used to examine UB. These constructs were shown to influence behavioural intention BI to adopt m-banking apps (PS: β = 0.332, p < 0.001; IT: β = 0.181, p < 0.01; TT: β = 0.218, p < 0.001), except perceived risk (PR: β = −0.071, p = 0.226). PS also influenced the user behaviour UB (PR: β = 0.191, p < 0.05). The majority of the hypotheses with regard to the extended constructs were therefore supported. Specifically, three out of four hypothesized relationships of the extended model were confirmed, and the following hypotheses were supported:
  • H8, which posited a positive impact of PS on both BI and UB;
  • H10, which posited a positive impact of IT on BI;
  • H11, which posited a positive impact of TT on BI.

4.3.2. Moderating Effects

The Moderating effects for behavioural intention (BI) and use behaviour (UB) are shown in Table 8 and Table 9, respectively. Significant path coefficients were found with all higher-order interaction terms, such as PS x GEN, IT x GEN, TT x AGE, TT x EDU, PS x GEN x INC, IT x GEN x INC, PS x AGE x EXP, TT x AGE x EXP, PS x GEN x AGE x INC, IT x GEN x AGE x INC, TT x GEN x AGE x INC, PS x GEN x AGE x EXP, IT x GEN x AGE x EXP, TT x AGE x EDU x EXP, PS x GEN x AGE x EDU x INC x EXP, and IT x GEN x AGE x EDU x INC x EXP when predicting BI (see Table 8); PS x AGE x EXP and PS x GEN x AGE x EXP when predicting UB (see Table 9).
The results confirmed hypothesised moderating effects, as follows:
  • Age, gender, experience, income, and education moderated the relationship between PS and BI ( β = 2.767 , p > 0.05), and between IT and BI ( β = −1.718, p > 0.01), which supported H8 and H10. For PS, the effect was stronger for younger men, particularly with high income and high education in early stages of experience with m-banking adoption; whereas for IT, the effect was stronger for older women, particularly with high income and education in later stages of experience.
  • Age, education, and experience moderated the relationship between TT and BI ( β = −1.523, p > 0.01), such that the effect was stronger for older people with high education in later stages of experience. This confirmed H11.
  • Age, gender, and experience moderated the relationship between PS and UB ( β = 2.344, p > 0.001), such that he effect was stronger for younger men in early stages of experience. This confirmed H8.
Overall, all hypotheses for moderating effect were supported except H9, which posited a negative impact of PR on BI with age, gender, education, income, and experience moderating the relationship. However, since PR was found not to support all three levels of model building (i.e., was not significant in Model 2, Model 3, and Model 4), it was therefore excluded from the investigation of higher-order interaction terms altogether.

5. Discussion

Our paper contributes to IS by presenting a unique theoretical model that extends UTAUT2 with four new constructs relevant for explaining intention and technology use of m-banking apps: perceived security, perceived risk, and trust (institutional and technological). We show that UTAUT2 is a powerful framework in and of itself, but when extended with relevant constructs, it can improve understanding of consumer use of technology such as that of m-banking apps. The model therefore extends the applicability of UTAUT2 in this particular context.
The behavioural intention to adopt m-banking apps was influenced by effort expectancy, facilitating condition, hedonic motivation, price value, habit, perceived security, and both types of trust. Unexpectedly, performance expectancy, social influence, and perceived risk were not significant. Also, use behaviour of m-banking apps was influenced by behavioural intention, facilitating condition, habit, and perceived security. Theoretically, these results differ from that of the UTAUT2 model, in that two relationships were not supported (PE and SI), and some of the constructs were more critical than anticipated. The results further show that the majority of the study respondents expressed positive responses to the constructs measured in this study, which supports earlier findings of [17].
The final model explained 79 % and 54 % in variance of behaviour intention and use behaviour. This is substantial, compared with baseline UTAUT2 that explained 74 % and 52 % of variance in intention and technology use, respectively [54]. The model was re-run with significant variables alone to observe the change in R2. The results show that R2 reduced by less than 2 % . The majority of the significant variables in this study also achieved medium to large effect sizes. This makes the proposed model superior to the original UTAUT2 in explaining user technology behaviour pertaining to m-banking apps.

5.1. Perceived Security

Perceived security predicted behavioural intention and use behaviour of m-banking apps. In fact, perceived security was found to be the most significant factor and contributed the most to the variance in behavioural intention. The findings support many other earlier studies that have also found security as a major determining factor in m-banking adoption [17,32,111,112]; however, they contradict results of [19]. Expectedly, younger men with a high level of education and income at the early stages of m-banking adoption showed a stronger perception of security. Security remains a big concern and barrier to m-banking apps due to the possibility of data breach and cyber-attacks. Although the mass adoption of m-banking apps may be somewhat dependent on the overall security perception irrespective of the actual security controls implemented, reinforcement of IT infrastructure and control mechanisms is crucial in ensuring the highest form of security in m-banking apps to allay customers fears.

5.2. Perceived Risk

The increasing trend in cyber-attacks, data compromises, and data breaches [113] were expected to affect users’ risk perception of mobile financial transactions. Contrary to expectations, perceived risk was not found to be a significant predictor of behavioural intention to adopt m-banking apps. Whilst this finding is consistent with previous studies [37,39], it is at odds with many others that found perceived risk to be an important factor for m-banking use intention [35,43,44]. Perhaps the introduction of General Data Protection Regulations (GDPR) in 2018 has effectively mitigated risk concerns of banking consumers. GDPR has brought strict controls and compliance to privacy measures, and institutions that fail to comply are faced with the prospect of heavy fines/sanctions.

5.3. Trust

Trust remains one of the most important factors in online transactions. Both institutional and technological trust were found to be significant predictors of m-banking app behavioural intention. These results confirmed previous findings [17,32,33,37,43,68]. However, others did not find trust to be a significant factor for behavioural intention to adopt technology [39,44,112]. The effect of institutional trust was stronger for older women, particularly with high income and education in later stages of experience, whereas the effect of technological trust was stronger for older people with high education in later stages of experience. This is not surprising given older people who have had long-time experience trust the technologies to deliver on their expectation. Young people tend to have trust issues with technologies due to security concerns. As the study of [16] reveals, trust in the use of mobile banking apps is lower in young people compared to older people. This calls for the need to ensure mobile banking apps are less complicated in design, provide adequate clarity, and ensure maximum security to attract young people.
Overall, the results show the need for adequate management of customer security concerns and protecting the security of m-banking apps at all times. Also, detailed user-friendly reports on security implementations and improvements, such as two factor authentication, could be regularly disseminated. This is because trust has emerged as a significant factor for m-banking app adoption, demonstrating user disposition towards m-banking technology. Also, the delicate nature of mobile financial transactions could account for the undeniable effects of trust.

5.4. Validated Constructs

The model validated five constructs of the UTAUT2 model when predicting behaviour intention, which are effort expectancy, facilitating condition, hedonic motivation, price value, and habits. The influence of two other constructs (performance expectancy and social influence) was not confirmed. Similarly, the influence on use technology was validated for all three constructs of UTAUT2, namely behavioural intention, facilitating condition, and habit.

5.4.1. Effort Expectancy

The influence of effort expectancy was confirmed in earlier research [17,54,68], but it remains debatable, as others found evidence to the contrary [50,88]. Effort expectancy could be influential due to increasing digital familiarity among UK customers. However, for users who are not well acquainted with a particular technology system, the influence of effort expectancy may be limited. Banking institutions and policy makers should therefore design user-friendly interfaces and develop banking applications that are adaptive to different devices and sizes.

5.4.2. Facilitating Condition

Facilitating conditions were found to be a significant predictor of behavioural intention and use behaviour, confirming previous results [54,68]. The use of mobile banking apps is dependent on technological infrastructure, resources, and support systems. Access to smartphones or other devices and reliable internet connections are key requirements for using mobile banking technology. Despite these resource requirements, it is also important that support be available to consumers when they encounter problems during the use of mobile banking apps. Mobile banking apps, like many others technologies, may become unresponsive during usage, or customers may encounter other problems; therefore, constant online customer support should exist to resolve whatever problem a user may face while using mobile banking technologies. This explains why UK consumers consider facilitating conditions to be an important factor when deciding whether to adopt mobile banking apps. Banks should therefore continue to provide user support services; to that end, they may want to consider 24-h customer service support, as well as investing in chat-bot technologies that provide tailor-made responses to customer inquiries.

5.4.3. Hedonic Motivation

Hedonic motivation was found to be a factor that influences the adoption of m-banking apps. This suggests that English consumers do not view m-banking apps as merely a practical service, but also that these applications bring them fun and enjoyment, which is consistent with previous research [50,54,68]. The result is, however, contrary to findings in [17], where consumers in the UK did not consider hedonic motivation to be an important consideration in their decision to use mobile banking apps. The result obtained in this study is, nevertheless, not surprising, given that mobile banking apps are used via entertainment equipment (mobile phones). Another contributing factor to this finding could be the respondent population, the majority of whom are young (aged 15–24 years) and mid-age people (25–44 years). This subset of the population enjoys using technology for the fun associated with it, and as such may consider mobile banking apps fun to use. In this regard, mobile banking app developers could make such applications more fun to use, perhaps by incorporating gamification technologies that could attract and engage young people’s attention.

5.4.4. Price Value

Price value was observed to be a significant predictor of behavioural intention, confirming findings in [17,54]. Others, however, found the evidence to the contrary [50], which could be attributed to the low cost or absence of cost associated with the use of m-banking apps in the UK. Even though the cost associated with the use of mobile banking apps in the UK is generally low or non-existent, consumers considered price value to be an important determinant in their decision to adopt and use such apps. This finding suggests that banking institutions may find it beneficial to continue to reduce the costs associated with mobile banking apps, including the reduction of fees and charges associated with the use of mobile banking apps and electronic transactions. Public education and awareness on the cost-effectiveness of the use of mobile banking apps could also be enhanced by banking institutions to encourage consumers to adopt such technologies, which ultimately reduces the operational cost of banks.

5.4.5. Habit

Habit was considered the second most important factor influencing behavioural intention and use behaviour of m-banking apps, in line with earlier research [17,54,68]. This result could be attributed to the established role of technology in the UK banking sector, which has made online transactions a daily routine for many users. The implication is that the use of mobile banking apps has become habitual among UK consumers. This also means that mobile banking app usage has become part of the daily activities of UK consumers. This finding suggests that mobile banking usage isuseful to consumers, and they will continue to use such services when available. However, banking policy makers and mobile banking app innovators and developers may want to consider further encouraging continuous use of such innovations by providing constant support to consumers and encouraging them to use of mobile banking apps, for example, by running promotions and reward systems for frequent use of their mobile banking platforms.

5.4.6. Performance Expectancy and Social Influence

Conversely, performance expectancy and social influence emerged as non-significant predictors of m-banking app adoption intention. This confirms an earlier study by [17], which reported that British consumers do not consider performance expectancy to be an important factor that influences their adoption behaviour. Clearly, the decision to use technology in itself demonstrates usefulness. Perhaps more features and services could be introduced into the apps to make them more beneficial. Regarding social influence, the findings were consistent with previous studies [17,50]. Communication regarding financial information is always kept private, which probably explains the findings. People do not often discuss their financial transactions with others—even if they are family, friends, or colleagues—and this could explain why social influence is not considered an important factor in determining adoption of mobile banking technologies among UK consumers. Also, in advanced countries such as the UK, banking innovations have become common, and the population is largely technology savvy; hence, it may not be a frequent occurence for people to influence others with respect to the use of technology that could make their lives simpler. People are largely aware of the benefits of the adoption and use of technology, as the findings have shown. The overall implication is that UK consumers do not consider the opinions of their family members, friends, or co-workers to be important when it comes to the use of m-banking apps, and they are largely not susceptible to such opinions.

6. Conclusions and Future Work

6.1. Conclusions

M-banking apps have gained popularity within the digital space and have revolutionised the banking industry, offering s number of benefits. Users, however, may remain distrustful of the security of these applications due to an increasing trend of cyber security compromises, including rising numbers of cyber-attacks and data breaches associated with online financial transactions. Security has therefore become an important consideration in m-banking app development and use.
Most constructs of the baseline UTAUT2 structure were validated. Effort expectancy, facilitating conditions, hedonic motivation, price value, and habit were found to influence behavioural intention to adopt m-banking apps. Similarly, facilitating conditions, habit, and behavioural intention influenced m-banking use behaviour. Unexpectedly, the effects of performance expectancy and social influence were not confirmed in this study. In terms of the extended constructs, perceived security, institutional trust, and technological trust were confirmed to influence users’ intentions to adopt and use m-banking apps. Perceived risk, however, was not confirmed as a significant predictor.
The current study further revealed that in the context of m-banking apps, the effects of security, institution trust, and technological trust are complex. First, the impact of perceived security on behavioural intention is moderated by gender, age, experience, income, and education. Second, the effect of perceived security on use behaviour is moderated by age, gender, and experience. Third, the impact of institutional trust on behavioural intention is moderated by gender, age, experience, income, and education. Finally, the effect of technological trust on behavioural intention is moderated by age, education, and experience. Overall, the study confirmed the important role of security in influencing m-banking app use, as perceived security was found to be the most important factor that predicted user behavioural intention and use behaviour of m-banking apps.

6.2. Main Contribution and Advancement of Research

Many scholars, including [54], have stressed the need and importance of broadening the generalisability and applicability of UTAUT2 in a different context and dissimilar group to that of the original study settings. The study has effectively achieved this by supporting the applicability of the UTAUT2 theory in an m-banking app use context, affirming its predictive validity. The literature on technology adoption as well as acceptance models and theories has, therefore, been enhanced and greatly expanded through this study.
The major theoretical contribution of this study is in modifying UTAUT2 for the m-banking app adoption and use context. By doing so, the generalisability of the UTAUT2 is extended from a technology acceptance and use context to a more specific context for m-banking apps. The UTAUT2 has been validated and applied in many technological settings, where performance expectancy has been the main driver of technology acceptance and use. In the specific case of m-banking apps, other important drivers come into play. Factors such as security, privacy, risk, and trust are important drivers in online financial transactions. Security is a critical determinant of behavioural intention of m-banking apps, with even more important implications for mobile banking use.
The study also contributed to addressing a noteworthy gap in extant m-banking app literature, particularly on the extension of UTAUT2 with institutional trust and technological trust. Trust remains a critical variable in online financial transactions, and its addition remarkably improved the explanatory power of UTAUT2 in achieving a good model fit. The study further delineated how individual characteristics and differences, such as gender, age, experience, income, and education, jointly moderate the effect of security on behavioural intention and use behaviour, as well as trust on behavioural intention.

6.3. Managerial and Practical Implications

The findings of this study have several managerial and practical implications for the UK financial sector, as well as for countries with similar cultural settings with respect to user-perceived security of m-banking apps. The study has demonstrated the importance of institutional and technological trust, and how both types of trust influence users’ behaviour in adopting m-banking apps. Enhanced security, advanced privacy mechanisms, and trust should therefore be considered paramount in future strategies aimed at promoting mobile banking adoption and use of technology. Improving security and privacy of m-banking apps will lead to increased adoption and use, ultimately reducing branch transactions and associated costs.
It is also recommended for mobile apps developers, software engineers, and computer programmers to integrate major security features into the development of banking apps to curtail data breaches and cyber security vulnerabilities. Institutional trust can be improved by improving brand image, e.g., through celebrity endorsement, displaying positive reviews about institutions’ services, etc. Similarly, technological trust can be improved by integrating features that portray the app as trustworthy and credible. Several measures can be taken to improve credibility and trust, such as showing logos on “established security institutions” in the form of third-party endorsements, letting users control their privacy settings, and giving users a real-world feel by showing an “About Us” page.

6.4. Limitations and Directions for Future Research

Convenience sampling used to collect data places limitations in terms of generalizability of a study’s results. A more representative sampling approach, such as a clustering and random sampling approach, could be adopted in the future to help avoid sampling biases.
The sample in this study may not be fully representative of the broader population of mobile banking users for the following reasons:
  • Non-probability convenience sampling: This method involves selecting participants who are readily available and willing to participate, rather than using random sampling techniques.
  • Homogeneity and accessibility: While the study considered the homogeneity of the population and ease of access to respondents, it did not ensure that all relevant subgroups of the population were proportionately represented.
  • Demographic representation: The study did not specify whether key demographic characteristics of the sample matched those of the overall population of mobile banking users.
The complexity of the model proposed made it difficult for a sub-analysis of users’ responses based on the category of banks used. By categories, we refer to to m-banking apps developed by traditional banks (e.g., Barclays, HSBC, Santander, NatWest, etc.) versus those developed by purely digital banks (e.g., Monzo, Monese, Starling, etc.). This distinction is important because customers of these two groups have different banking experiences, such that those in the traditional banks have access to branches to make transactions, whereas digital banks are purely online and branchless. It would therefore be interesting to explore how customers of these two categories perceive the security of the m-banking apps given their different experiences.
The study did not have enough respondents aged 45+; ultimately, this may have affected the observations made, though initial observations indicate that the older generation has less trust in the security of m-banking apps. Again, the older generation, particularly those over 55 years, are likely to be less comfortable with adopting m-banking apps because of the generation gap; hence, further research focusing primarily on this demographic is necessary to understand attitudes of this age group towards m-banking apps.
Finally, future research could arrive at a better understanding of the user-perceived security of m-banking apps by integrating cultural dimensions. Integration of Hofstede’s cultural dimensions could be an interesting extension, considering the UK has a diverse cultural population, comprising people originally from typical collectivist and individualist cultural settings.

Author Contributions

Conceptualization, R.A.; methodology, R.A.; validation, H.S.L. and E.T.; formal analysis, R.A., H.S.L. and E.T.; investigation, R.A.; data curation, R.A.; writing—original draft preparation, E.T.; writing—review and editing, R.A., H.S.L. and E.T.; visualization, H.S.L.; supervision, H.S.L.; project administration, E.T. All authors have read and agreed to the published version of the manuscript.

Funding

This research received no external funding.

Data Availability Statement

The data that support the findings of this study are available from the corresponding author, [E.T.], upon reasonable request.

Conflicts of Interest

The authors declare no conflicts of interest.

References

  1. Shankar, A.; Rishi, B. Convenience matter in mobile banking adoption intention? Australas. Mark. J. 2020, 28, 273–285. [Google Scholar] [CrossRef]
  2. Zhu, Q.; Lyu, Z.; Long, Y.; Wachenheim, C.J. Adoption of mobile banking in rural China: Impact of information dissemination channel. Socio-Econ. Plan. Sci. 2022, 83, 101011. [Google Scholar] [CrossRef]
  3. Jebarajakirthy, C.; Shankar, A. Impact of online convenience on mobile banking adoption intention: A moderated mediation approach. J. Retail. Consum. Serv. 2021, 58, 102323. [Google Scholar] [CrossRef]
  4. Karjaluoto, H.; Shaikh, A.A.; Saarijärvi, H.; Saraniemi, S. How perceived value drives the use of mobile financial services apps. Int. J. Inf. Manag. 2019, 47, 252–261. [Google Scholar] [CrossRef]
  5. Entersekt. Fighting Back Against Mobile Banking and Payments Fraud in Europe. Entersekt Blog. 2022. pp. 1–12. Available online: https://www.entersekt.com/resources/blog/tpost/s6kn87x601-fighting-mobile-banking-and-online-payme (accessed on 1 April 2025).
  6. To, A.T.; Trinh, T.H.M. Understanding behavioral intention to use mobile wallets in vietnam: Extending the tam model with trust and enjoyment. Cogent Bus. Manag. 2021, 8, 1891661. [Google Scholar] [CrossRef]
  7. Nokia. Threat Intelligence Report. Nokia. 2023. pp. 1–12. Available online: https://www.nokia.com/networks/security-portfolio/threat-intelligence-report/ (accessed on 1 April 2025).
  8. UKFinance. 2023 Half Year Fraud Report. UKFinance. 2023. pp. 1–12. Available online: https://www.ukfinance.org.uk/policy-and-guidance/reports-and-publications/2023-half-year-fraud-report (accessed on 1 April 2025).
  9. Irwin, K. New ‘Snowblind’ Banking Malware Targets Android Users with Linux Kernel Exploit. PCMag 2024, pp. 1–12. Available online: https://uk.pcmag.com/security/152989/new-snowblind-banking-malware-targets-android-users-with-linux-kernel-exploit (accessed on 1 April 2025).
  10. Alnajim, A.M.; Habib, S.; Islam, M.; AlRawashdeh, H.S.; Wasim, M. Exploring cybersecurity education and training techniques: A comprehensive review of traditional, virtual reality, and augmented reality approaches. Symmetry 2023, 15, 2175. [Google Scholar] [CrossRef]
  11. Ramli, Y.; Harwani, Y.; Soelton, M.; Hariani, S.; Usman, F.; Rohman, F. The implication of trust that influences customers’ intention to use mobile banking. J. Asian Financ. Econ. Bus. 2021, 8, 353–361. [Google Scholar] [CrossRef]
  12. Kumar, S.; Yukita, A.L.K. Millennials behavioral intention in using mobile banking: Integrating perceived risk and trust into tam (a survey in jawa barat). In International Conference on Business and Engineering Management (ICONBEM 2021); Atlantis Press: Dordrecht, The Netherlands, 2021; pp. 210–217. [Google Scholar] [CrossRef]
  13. Almaiah, M.A.; Al-Otaibi, S.; Shishakly, R.; Hassan, L.; Lutfi, A.; Alrawad, M.; Qatawneh, M.; Alghanam, O.A. Investigating the role of perceived risk, perceived security and perceived trust on smart m-banking application using sem. Sustainability 2023, 15, 9908. [Google Scholar] [CrossRef]
  14. Abdennebi, H.B. M-banking adoption from the developing countries perspective: A mediated model. Digit. Bus. 2023, 3, 100065. [Google Scholar] [CrossRef]
  15. Obaid, T. Predicting mobile banking adoption: An integration of tam and tpb with trust and perceived risk. Financ. Internet Q. 2021, 17, 35–46. [Google Scholar] [CrossRef]
  16. Merhi, M.; Hone, K.; Tarhini, A.; Ameen, N. An empirical examination of the moderating role of age and gender in consumer mobile banking use: A cross-national, quantitative study. J. Enterp. Inf. Manag. 2021, 34, 1144–1168. [Google Scholar] [CrossRef]
  17. Merhi, M.; Hone, K.; Tarhini, A. A cross-cultural study of the intention to use mobile banking between lebanese and british consumers: Extending utaut2 with security, privacy and trust. Technol. Soc. 2019, 59, 101151. [Google Scholar] [CrossRef]
  18. Mutahar, A.M.; Daud, N.M.; Ramayah, T.; Isaac, O.; Aldholay, A.H. The effect of awareness and perceived risk on the technology acceptance model (tam): Mobile banking in yemen. Int. J. Serv. Stand. 2018, 12, 180–204. [Google Scholar] [CrossRef]
  19. Lim, S.H.; Kim, D.J.; Hur, Y.; Park, K. An empirical study of the impacts of perceived security and knowledge on continuous intention to use mobile fintech payment services. Int. J. Hum.-Comput. Interact. 2019, 35, 886–898. [Google Scholar] [CrossRef]
  20. Kumar, R.; Singh, R.; Kumar, K.; Khan, S.; Corvello, V. How does perceived risk and trust affect mobile banking adoption? empirical evidence from india. Sustainability 2023, 15, 4053. [Google Scholar] [CrossRef]
  21. Tian, Y.; Chan, T.J.; Suki, N.M.; Kasim, M.A. Moderating role of perceived trust and perceived service quality on consumers’ use behavior of alipay e-wallet system: The perspectives of technology acceptance model and theory of planned behavior. Hum. Behav. Emerg. Technol. 2023, 2023, 5276406. [Google Scholar] [CrossRef]
  22. Jadil, Y.; Rana, N.P.; Dwivedi, Y.K. A meta-analysis of the UTAUT model in the mobile banking literature: The moderating role of sample size and culture. J. Bus. Res. 2021, 132, 354–372. [Google Scholar] [CrossRef]
  23. Lin, R.-R.; Zheng, Y.; Lee, J.-C. Artificial intelligence-based pre-implementation interventions in users’ continuance intention to use mobile banking. Int. J. Mob. Commun. 2023, 21, 518–540. [Google Scholar] [CrossRef]
  24. Tang, J.W.; Tsai, P.H. Exploring critical determinants influencing businesses’ continuous usage of mobile payment in post-pandemic era: Based on the UTAUT2 perspective. Technol. Soc. 2024, 77, 102554. [Google Scholar] [CrossRef]
  25. Zhang, M.; Hassan, H.; Migin, M.W. Exploring the consumers’ purchase intention on online community group buying platform during pandemic. Sustainability 2023, 15, 2433. [Google Scholar] [CrossRef]
  26. Kimiagari, S.; Baei, F. Promoting e-banking actual usage: Mix of technology acceptance model and technology-organisation-environment framework. Enterp. Inf. Syst. 2022, 16, 1894356. [Google Scholar] [CrossRef]
  27. Ahmed, M.S.; Everett, J.; Turnbull, W. Extracting best set of factors that affect students’ adoption of smartphone for university education: Empirical evidence from utaut-2 model. J. Manag. Econ. Ind. Organ. 2017, 1, 51–64. [Google Scholar] [CrossRef]
  28. El-Masri, M.; Tarhini, A. Factors affecting the adoption of e-learning systems in qatar and USA: Extending the unified theory of acceptance and use of technology 2 (utaut2). Educ. Technol. Res. Dev. 2017, 65, 743–763. [Google Scholar] [CrossRef]
  29. Rehman, Z.U.; Shaikh, F.A. Critical factors influencing the behavioral intention of consumers towards mobile banking in malaysia. Eng. Technol. Appl. Sci. Res. 2020, 10, 5265–5269. [Google Scholar] [CrossRef]
  30. Prabhakaran, S.; Vasantha, D.S.; Sarika, P. Effect of social influence on intention to use mobile wallet with the mediating effect of promotional benefits. J. Xi’An Univ. Archit. Technol. 2020, 12, 3003–3019. [Google Scholar]
  31. Win, N.N.; Aung, P.P.; Phyo, M.T. Factors influencing behavioral intention to use and use behavior of mobile banking in myanmar using a model based on unified acceptance theory. Hum. Behav. Dev. Soc. 2021, 22. [Google Scholar]
  32. Tham, J.; Ab Yazid, M.S.; Khatibi, A.A.; Azam, S.F. Internet and data security–understanding customer perception on trusting virtual banking security in malaysia. Eur. J. Soc. Sci. Stud. 2017. Available online: https://oapub.org/soc/index.php/EJSSS/article/view/199 (accessed on 1 April 2025).
  33. Stewart, H.; Jürjens, J. Data security and consumer trust in fintech innovation in germany. Inf. Comput. Secur. 2018, 26, 109–128. [Google Scholar] [CrossRef]
  34. Apau, R.; Koranteng, F.N.; Gyamfi, S.A. Cyber-crime and its effects on e-commerce technologies. J. Inf. 2019, 5, 39–59. [Google Scholar] [CrossRef]
  35. Chen, C. Perceived risk, usage frequency of mobile banking services. Manag. Serv. Qual. Int. J. 2013, 23, 410–436. [Google Scholar] [CrossRef]
  36. Chand, K.; Tiwari, R.; Gupta, A.; Taneja, S.; Özen, E. How does perceived security influence mobile wallet users’ behavior? A SEM investigation. Manag. Financ. 2025, 51, 146–165. [Google Scholar] [CrossRef]
  37. Nguyen, G.D.; Dao, T.H.T. Factors influencing continuance intention to use mobile banking: An extended expectation-confirmation model with moderating role of trust. Humanit. Soc. Sci. Commun. 2024, 11, 1–14. [Google Scholar] [CrossRef]
  38. Pentina, I.; Zhang, L.; Bata, H.; Chen, Y. Exploring privacy paradox in information-sensitive mobile app adoption: A cross-cultural comparison. Comput. Hum. Behav. 2016, 65, 409–419. [Google Scholar] [CrossRef]
  39. Williams, M.D. Social commerce and the mobile platform: Payment and security perceptions of potential users. Comput. Hum. Behav. 2021, 115, 105557. [Google Scholar] [CrossRef]
  40. Hanif, Y.; Lallie, H.S. Security factors on the intention to use mobile banking applications in the uk older generation (55+). A mixed-method study using modified utaut and mtam-with perceived cyber security, risk, and trust. Technol. Soc. 2021, 67, 101693. [Google Scholar] [CrossRef]
  41. Rahi, S.; Abd. Ghani, M. The role of utaut, doi, perceived technology security and game elements in internet banking adoption. World J. Sci. Technol. Sustain. Dev. 2018, 15, 338–356. [Google Scholar] [CrossRef]
  42. Singh, S.; Srivastava, R. Understanding the intention to use mobile banking by existing online banking customers: An empirical study. J. Financ. Serv. Mark. 2020, 25, 86–96. [Google Scholar] [CrossRef]
  43. Namahoot, K.S.; Laohavichien, T. Assessing the intentions to use internet banking: The role of perceived risk and trust as mediating factors. Int. J. Bank Mark. 2018, 36, 256–276. [Google Scholar] [CrossRef]
  44. Alonso-Dos-Santos, M.; Soto-Fuentes, Y.; Valderrama-Palma, V. Determinants of mobile banking users’ loyalty. J. Promot. Manag. 2020, 26, 615–633. [Google Scholar] [CrossRef]
  45. Chauhan, V.; Yadav, R.; Choudhary, V. Adoption of electronic banking services in india: An extension of utaut2 model. J. Financ. Serv. Mark. 2022, 27, 27–40. [Google Scholar] [CrossRef]
  46. Arenas Gaitán, J.; Peral Peral, B.; Ángeles Ramón Jerónimo, M. Elderly and internet banking: An application of UTAUT2. J. Internet Bank. Commer. 2015, 20, 1–23. [Google Scholar]
  47. Wang, X. Exploring the relationship among technology acceptance, learner engagement, and critical thinking. Educ. Inf. Technol. 2021, 26, 13375–13390. [Google Scholar] [CrossRef]
  48. Chawla, D.; Joshi, H. The moderating effect of demographic variables on mobile banking adoption: An empirical investigation. Glob. Bus. Rev. 2018, 19, S90–S113. [Google Scholar] [CrossRef]
  49. Liébana-Cabanillas, F.; Sánchez-Fernández, J.; Muñoz-Leiva, F. Antecedents of the adoption of the new mobile payment systems: The moderating effect of age. Comput. Hum. Behav. 2014, 35, 464–478. [Google Scholar] [CrossRef]
  50. Sharma, N. A digital cohort analysis of consumers’ mobile banking app experience. Int. J. Consum. Stud. 2024, 48, e12989. [Google Scholar] [CrossRef]
  51. Merhi, M. Investigating the Factors Driving Consumers’ Intention to Use Mobile Banking; Springer: Berlin/Heidelberg, Germany, 2021. [Google Scholar] [CrossRef]
  52. Merhi, M. A systematic review of the behavior intention on mobile banking. Semant. Sch. 2019, 7, 2024112. [Google Scholar] [CrossRef]
  53. Venkatesh, V.; Morris, M.G.; Davis, G.B.; Davis, F.D. User acceptance of information technology: Toward a unified view. Mis Q. 2003, 27, 425–478. [Google Scholar] [CrossRef]
  54. Venkatesh, V.; Thong, J.Y.; Xu, X. Consumer acceptance and use of information technology: Extending the unified theory of acceptance and use of technology. Mis Q. 2012, 36, 157–178. [Google Scholar] [CrossRef]
  55. Rogers, E. Diffusion of Innovations; The Free Press: New York, NY, USA, 1995. [Google Scholar]
  56. Fishbein, M.; Ajzen, I. Belief, Attitude, Intention, and Behavior: An Introduction to Theory and Research; Addison-Wesley: Boston, MA, USA, 1977. [Google Scholar]
  57. Ajzen, I. The theory of planned behaviour. Organ. Behav. Hum. Decis. Process. 1991, 50, 179–211. [Google Scholar] [CrossRef]
  58. Davis, F.D. Perceived usefulness, perceived ease of use, and user acceptance of information technology. Mis Q. 1989, 13, 319–340. [Google Scholar] [CrossRef]
  59. Featherman, M.S.; Pavlou, P.A. Predicting e-services adoption: A perceived risk facets perspective. Int. J. Hum.-Comput. Stud. 2003, 59, 451–474. [Google Scholar] [CrossRef]
  60. Davis, F.D.; Bagozzi, R.P.; Warshaw, P.R. Extrinsic and intrinsic motivation to use computers in the workplace 1. J. Appl. Soc. Psychol. 1992, 22, 1111–1132. [Google Scholar] [CrossRef]
  61. Thompson, R.L.; Higgins, C.A.; Howell, J.M. Personal computing: Toward a conceptual model of utilization. Mis Q. 1991, 15, 125–143. [Google Scholar] [CrossRef]
  62. Bandura, A. Social Foundations of Thought and Action; SAGE: Englewood Cliffs, NJ, USA, 1986; p. 2. [Google Scholar] [CrossRef]
  63. Taylor, S.; Todd, P.A. Understanding information technology usage: A test of competing models. Inf. Syst. Res. 1995, 6, 144–176. [Google Scholar] [CrossRef]
  64. Venkatesh, V.; Brown, S.A.; Bala, H. Bridging the qualitative-quantitative divide: Guidelines for conducting mixed methods research in information systems. Mis Q. 2013, 37, 21–54. [Google Scholar] [CrossRef]
  65. Venkatesh, V.; Zhang, X. Unified theory of acceptance and use of technology: US vs. China. J. Glob. Inf. Technol. Manag. 2010, 13, 5–27. [Google Scholar] [CrossRef]
  66. Negahban, A.; Chung, C.-H. Discovering determinants of users perception of mobile device functionality fit. Comput. Hum. Behav. 2014, 35, 75–84. [Google Scholar] [CrossRef]
  67. Montesdioca, G.P.Z.; Maçada, A.C.G. Measuring user satisfaction with information security practices. Comput. Secur. 2015, 48, 267–280. [Google Scholar] [CrossRef]
  68. Alalwan, A.A.; Dwivedi, Y.K.; Rana, N.P. Factors influencing adoption of mobile banking by jordanian bank customers: Extending utaut2 with trust. Int. J. Inf. Manag. 2017, 37, 99–110. [Google Scholar] [CrossRef]
  69. Aboelmaged, M.G.; Gebba, T.R. Mobile banking adoption: An examination of technology acceptance model and theory of planned behavior. Int. J. Bus. Res. Dev. 2013, 2, 35–50. [Google Scholar] [CrossRef]
  70. Raza, S.A.; Umer, A.; Shah, N. New determinants of ease of use and perceived usefulness for mobile banking adoption. Int. J. Electron. Cust. Relatsh. Manag. 2017, 11, 44–65. [Google Scholar] [CrossRef]
  71. Akturan, U.; Tezcan, N. Mobile banking adoption of the youth market: Perceptions and intentions. Mark. Intell. Plan. 2012, 30, 444–459. [Google Scholar] [CrossRef]
  72. Oliveira, T.; Thomas, M.; Baptista, G.; Campos, F. Mobile payment: Understanding the determinants of customer adoption and intention to recommend the technology. Comput. Hum. Behav. 2016, 61, 404–414. [Google Scholar] [CrossRef]
  73. Wazid, M.; Zeadally, S.; Das, A.K. Mobile banking: Evolution and threats: Malware threats and security solutions. IEEE Consum. Electron. Mag. 2019, 8, 56–60. [Google Scholar] [CrossRef]
  74. Saibaba, S. Examining the determinants of mobile banking app continuance intention in India: An extension of the IS success model. J. Internet Commer. 2024, 23, 50–89. [Google Scholar] [CrossRef]
  75. Mullan, J.; Bradley, L.; Loane, S. Bank adoption of mobile banking: Stakeholder perspective. Int. J. Bank Mark. 2017, 35, 1154–1174. [Google Scholar] [CrossRef]
  76. Aggarwal, A.; Sharma, R.; Singh, P. Will I virtually try and buy?—exploring the adoption of virtual fitting rooms through the lens of perceived value, risk, and consumer characteristics. Int. Rev. Retail. Distrib. Consum. Res. 2025, 2025, 1–32. [Google Scholar] [CrossRef]
  77. Martins, C.; Oliveira, T.; Popovič, A. Understanding the internet banking adoption: A unified theory of acceptance and use of technology and perceived risk application. Int. J. Inf. Manag. 2014, 34, 1–13. [Google Scholar] [CrossRef]
  78. Du, T.; Agami, A. Examining young users’ security perceptions of mobile banking: A qualitative study on users’ insights about mobile banking. Umeå Sch. Bus. Econ. 2017, 1–30. [Google Scholar] [CrossRef]
  79. Roy, S.K.; Balaji, M.; Kesharwani, A.; Sekhon, H. Predicting internet banking adoption in india: A perceived risk perspective. J. Strateg. Mark. 2017, 25, 418–438. [Google Scholar] [CrossRef]
  80. Roopnarain, M.; Mwapwele, S.D. Factors influencing the adoption and usage of blockchain in e-commerce: A systematic literature review. Afr. J. Sci. Technol. Innov. Dev. 2025, 2025, 1–14. [Google Scholar] [CrossRef]
  81. Apau, R.; Koranteng, F.N. Impact of cybercrime and trust on the use of e-commerce technologies: An application of the theory of planned behavior. Int. J. Cyber Criminol. 2019, 13, 228–254. [Google Scholar]
  82. Al-Sharafi, A.; Arshah, R.A.; Alajmi, Q.; Herzallah, A.; Qasem, Y. The influence of perceived trust on understanding banks’ customers behavior to accept internet banking services. Indian J. Sci. Technol. 2018, 11, 1–9. [Google Scholar] [CrossRef]
  83. Fachrudin, K.A.; Amin, S.I.M.; Ab Hamid, S.N.; Latifah, S.; Lubis, M.A. Which UTAUT Elements Drive Mobile Banking Adoption in Indonesia, Despite Security and Trust Concerns? J. Ecohumanism 2025, 4, 682–693. [Google Scholar] [CrossRef]
  84. Resnik, D. The Ethics of Research with Human Subjects: Protecting People, Advancing Science, Promoting Trust; Springer: Berlin/Heidelberg, Germany, 2018. [Google Scholar] [CrossRef]
  85. O’Sullivan, L.; Feeney, L.; Crowley, R.K.; Sukumar, P.; McAuliffe, E.; Doran, P. An evaluation of the process of informed consent: Views from research participants and staff. Trials 2021, 22, 544. [Google Scholar] [CrossRef]
  86. Brace, I. Questionnaire Design: How to Plan, Structure and Write Survey Material for Effective Market Research; Kogan Page Publishers: London, UK, 2018. [Google Scholar]
  87. Preston, C.C.; Colman, A.M. Optimal number of response categories in rating scales: Reliability, validity, discriminating power, and respondent preferences. Acta Psychol. 2000, 104, 1–15. [Google Scholar] [CrossRef]
  88. Im, I.; Hong, S.; Kang, M.S. An international comparison of technology adoption: Testing the utaut model. Inf. Manag. 2011, 48, 1–8. [Google Scholar] [CrossRef]
  89. Gefen, D.; Straub, D.; Boudreau, M.-C. Structural equation modeling and regression: Guidelines for research practice. Commun. Assoc. Inf. Syst. 2000, 4, 7. [Google Scholar] [CrossRef]
  90. Jöreskog, K.G.; Sörbom, D. Recent developments in structural equation modeling. J. Mark. Res. 1982, 19, 404–416. [Google Scholar] [CrossRef]
  91. Chin, W.; Cheah, J.-H.; Liu, Y.; Ting, H.; Lim, X.-J.; Cham, T.H. Demystifying the role of causal-predictive modeling using partial least squares structural equation modeling in information systems research. Ind. Manag. Data Syst. 2020, 120, 2161–2209. [Google Scholar] [CrossRef]
  92. Tabachnick, B.G.; Fidell, L.S.; Ullman, J.B. Using Multivariate Statistics; Pearson: Boston, MA, USA, 2013; Volume 6. [Google Scholar]
  93. Wang, J.; Wang, X. Structural Equation Modeling: Applications Using Mplus; John Wiley & Sons: Hoboken, NJ, USA, 2019. [Google Scholar] [CrossRef]
  94. Anderson, J.C.; Gerbing, D.W. Structural equation modeling in practice: A review and recommended two-step approach. Psychol. Bull. 1988, 103, 411. [Google Scholar] [CrossRef]
  95. Coltman, T.; Devinney, T.M.; Midgley, D.F.; Venaik, S. Formative versus reflective measurement models: Two applications of formative measurement. J. Bus. Res. 2008, 61, 1250–1262. [Google Scholar] [CrossRef]
  96. Pezzullo, J.C. Biostatistics for Dummies; John Wiley & Sons: Hoboken, NJ, USA, 2013. [Google Scholar]
  97. Kline, R.B. Principles and Practice of Structural Equation Modeling; Guilford Publications: New York, NY, USA, 2023. [Google Scholar]
  98. Brown, T.A. Confirmatory Factor Analysis for Applied Research; Guilford Publications: New York, NY, USA, 2015. [Google Scholar]
  99. Ryans, A.B. Estimating consumer preferences for a new durable brand in an established product class. J. Mark. Res. 1974, 11, 434–443. [Google Scholar] [CrossRef]
  100. Hair, J.F., Jr.; Sarstedt, M.; Matthews, L.M.; Ringle, C.M. Identifying and treating unobserved heterogeneity with fimix-pls: Part i—Method. Eur. Bus. Rev. 2016, 28, 63–76. [Google Scholar] [CrossRef]
  101. Bollen, K.A. A new incremental fit index for general structural equation models. Sociol. Methods Res. 1989, 17, 303–316. [Google Scholar] [CrossRef]
  102. Wixom, B.H.; Watson, H.J. An empirical investigation of the factors affecting data warehousing success. Mis Q. 2001, 25, 17–41. [Google Scholar] [CrossRef]
  103. Fornell, C.; Larcker, D.F. Evaluating structural equation models with unobservable variables and measurement error. J. Mark. Res. 1981, 18, 39–50. [Google Scholar] [CrossRef]
  104. Netemeyer, R.G.; Durvasula, S.; Lichtenstein, D.R. A cross-national assessment of the reliability and validity of the CETSCALE. J. Mark. Res. 1991, 28, 320–327. [Google Scholar] [CrossRef]
  105. Bearden, W.O.; Carlson, J.P.; Hardesty, D.M. Using invoice price information to frame advertised offers. J. Bus. Res. 2003, 56, 355–366. [Google Scholar] [CrossRef]
  106. Bartlett, M.S. Tests of significance in factor analysis. Br. J. Psychol. 1950, 3, 77–85. [Google Scholar] [CrossRef]
  107. Tomaschek, F.; Hendrix, P.; Baayen, R.H. Strategies for addressing collinearity in multivariate linguistic data. J. Phon. 2018, 71, 249–267. [Google Scholar] [CrossRef]
  108. Liang, H.; Saraf, N.; Hu, Q.; Xue, Y. Assimilation of enterprise systems: The effect of institutional pressures and the mediating role of top management. Mis Q. 2007, 31, 59–87. [Google Scholar] [CrossRef]
  109. Malhotra, N.K.; Kim, S.S.; Patil, A. Common method variance in is research: A comparison of alternative approaches and a reanalysis of past research. Manag. Sci. 2006, 52, 1865–1883. [Google Scholar] [CrossRef]
  110. Lindell, M.K.; Whitney, D.J. Accounting for common method variance in cross-sectional research designs. J. Appl. Psychol. 2001, 86, 114. [Google Scholar] [CrossRef] [PubMed]
  111. Patel, K.J.; Patel, H.J. Adoption of internet banking services in gujarat: An extension of tam with perceived security and social influence. Int. J. Bank Mark. 2018, 36, 147–169. [Google Scholar] [CrossRef]
  112. Shareef, M.A.; Baabdullah, A.; Dutta, S.; Kumar, V.; Dwivedi, Y.K. Consumer adoption of mobile banking services: An empirical examination of factors according to adoption stages. J. Retail. Consum. Serv. 2018, 43, 54–67. [Google Scholar] [CrossRef]
  113. Wiafe, I.; Koranteng, F.N.; Obeng, E.N.; Assyne, N.; Wiafe, A.; Gulliver, S.R. Artificial intelligence for cybersecurity: A systematic mapping of literature. IEEE Access 2020, 8, 146598–146612. [Google Scholar] [CrossRef]
Figure 1. Original UTAUT2 model [54].
Computers 14 00144 g001
Figure 2. Proposed conceptual model for the study.
Computers 14 00144 g002
Figure 3. Hypothesised model.
Computers 14 00144 g003
Figure 4. Final structural model results. * p < 0.05, ** p < 0.01, *** p < 0.001. Bold lines indicate statistically significant relationships. Dashed lines indicate non-significant relationships.
Computers 14 00144 g004
Table 1. Survey Variables and Associated Measurement Items.
ConstructIndicatorsIndicators Text
Performance Expectancy (PE)PE1I find mobile banking apps useful in my daily life [53,64]
PE2Using mobile banking apps help me accomplish tasks more quickly
PE3Using mobile banking apps increase my productivity
Effort Expectancy (EE)EE1Learning how to use mobile banking apps is easy for me
EE2My interaction with mobile banking apps is clear and understandable
EE3I find mobile banking apps easy to use
EE4It is easy for me to become skilful at using mobile banking apps
Social Influence (SI)SI1People who are important to me think I should use mobile banking apps
SI2People who influence my behaviour think that I should use mobile banking apps
SI3People whose opinions that I value prefer that I use mobile banking apps
Facilitating Conditions (FC)FC1I have the resources necessary to use mobile banking apps
FC3I have the knowledge necessary to use mobile banking apps
FC3Mobile banking apps are compatible with other technologies I use
FC4I can get help from others when I have difficulties using mobile banking apps
Hedonic Motivation (HM)HM1Using mobile banking apps is fun [54]
HM2Using mobile banking apps is enjoyable
HM3Using mobile banking apps is very entertaining
Habit (HB)HB1The use of mobile banking apps has become a habit for me
HB2I am addicted to using mobile banking apps
HB3I must use mobile banking apps
Price Value (PV)PV1Mobile banking apps I use are reasonably priced
PV2Mobile banking apps I use are good value for the money
PV3At the current price, the mobile banking apps I use provide good value
Perceived Security (PS) PS1I perceive mobile banking apps as secure [48]
PS2Mobile banking apps have rigorous security controls
PS3I believe that transactions through mobile banking apps are protected and secured [17]
Perceived Risk (PR)PR1The chances of losing money if I use mobile banking apps are high [59]
PR2Internet hackers (criminals) might take control of my account if I use mobile
banking apps
PR3On the whole, considering all sorts of factors, it would be risky if I use mobile
banking apps
Institutional Trust (IT)IT1I trust the banks’ privacy protection to the users [48]
IT2I feel assured that banks have the legal and technological structures to protect my transactions [17]
IT3I trust the banks’ system will perform well and thus process my transaction correctly
Technological Trust (TT)TT1I believe that mobile banking apps are trustworthy
TT2Even if not monitored, I trust mobile banking apps to do the right job
TT3I trust that information concerning my mobile transactions will not be known to others [48]
Behavioural Intention (BI)BI1I intend to use mobile banking apps in the future [53,54]
BI2I will always try to use mobile banking apps in my daily life
BI3I plan to continue to use mobile banking apps frequently
Usage Behaviour (UB)UBWhat is your actual frequency of use of mobile banking apps? (i) Have not used;
(ii) once a month; (iii) once a week; (iv) multiple times a week [88]
Table 2. Results showing normality test of items.
ItemsMinMaxMeanSDSkewnessKurtosisK-SDfSig.S-WDfSig.
PE1176.381.205−3.29110.1660.30931500.5143150
PE2076.071.67−2.4485.2230.34831500.5783150
PE3075.841.542−1.8823.3350.3131500.8253150
EE1176.071.036−2.2718.770.25631500.8183150
EE2176.011.085−1.8625.0910.27531500.8613150
EE3176.041.082−1.6083.9060.24231500.8843150
EE4176.041.286−2.245.7050.30131500.893150
SI1175.021.607−0.881−0.220.19531500.8943150
SI2174.771.586−0.419−0.8250.19731500.9023150
SI3174.671.614−0.39−0.8380.17731500.9163150
FC1276.221.007−1.7383.4450.26331500.8333150
FC2176.390.89−3.30210.1690.27331500.5833150
FC3276.050.991−1.6723.5840.31631500.8533150
FC4175.471.474−1.2551.060.30631500.8213150
HM1175.021.532−0.8950.030.17831500.9023150
HM2175.181.495−0.9510.3610.23631500.8683150
HM3174.31.565−0.465−0.3840.18831500.9273150
HB1175.561.398−1.4381.7940.30431500.8043150
HB2174.381.7830.279−1.1320.21631500.9093150
HB3174.231.89−0.407−1.0420.17931500.9013150
PV1174.981.711−0.849−0.2550.2331500.8833150
PV2175.41.366−0.8120.0920.22431500.883150
PV3175.331.469−0.9130.3040.26431500.8683150
PS1175.511.324−1.5132.4060.26531500.8023150
PS2175.281.427−1.3421.7480.22931500.8323150
PS3175.511.303−1.4582.3690.25431500.8143150
PR1174.261.6380.565−0.8240.21431500.8973150
PR2174.651.6870.193−0.9580.16631500.9293150
PR3174.881.4851.1310.5340.25931500.8333150
IT1175.251.46−1.41.6960.24831500.8143150
IT2175.381.252−1.5412.6540.25731500.8953150
IT3175.61.088−1.5383.5580.28431500.8043150
TT1175.371.264−1.5242.6560.25831500.8043150
TT2174.531.663−0.409−1.0170.19331500.9053150
TT3175.161.409−1.0070.8930.22431500.8753150
BI1476.370.88−0.9721.1780.28531500.8483150
BI2175.851.265−1.4482.1570.28131500.8023150
BI3176.021.235−2.0524.6780.30431500.8113150
Notes: K-S: Kolmogorov–Smirnova; S-W: Shapiro–Wilk.
Table 3. Demographic characteristics of the respondents.
DemographicValueFrequencyPercentageCum.
GenderFemale14445.7145.71
Male17154.29100
Age (years)16–244514.2914.29
25–4424377.1491.43
45–6461.993.33
65–74123.8197.14
75 and above92.86100
EducationGCSE (Level 1–2)61.91.9
Bachelors (Level 6)8727.6229.52
Masters (Level 7)19561.9191.43
PhD (Level 8)247.6299.05
Others30.95100
OccupationAcademic/Teacher123.813.81
Clerical/Administrative154.768.57
Computer Technician/Engineering3310.4819.05
Executive/Manager278.5727.62
Retired154.7632.38
Self-employed/own company154.7637.14
Service/Customer Support154.7641.9
Student (college/university)18358.1100
Income (Annual)less than 30007222.8622.86
3000–10,0006620.9543.81
10,001–15,000632063.81
15,001–20,0004213.3377.14
20,001–25,000185.7182.85
25,001 and above5417.15100
Usage of Mobile Banking AppMultiple times a week19561.961.9
Once a week7523.8185.71
Once a month4514.29100
Up to one year4514.2914.29
Experience in using mobile banking app2–4 years14445.7160
More than 4 years12640100
Table 4. Fit indices summary for the measurement and structural model.
Fit IndexRecommended ValuesMeasurement ModelStructural Model
Fit Index Degree of Freedom (df)N/A610N/A
X2/df<52.2752.076
Goodness-Of-Fit Index (GFI)>0.900.9781
Adjusted Goodness-Of-Fit Index (AGFI)>0.800.9010.997
Comparative Fit Index (CFI)>0.900.9111
Root Mean Square Residuals (RMSR)<0.080.0010.001
Root Mean Square Error of Approximation (RMSEA)<0.080.0170
Normed Fit Index (NFI)>0.900.6691
Parsimony Normed Fit Index (PNFI)>0.600.8680.718
Table 5. Findings from confirmatory factor analysis.
Constructs and IndicatorsFactor LoadingsVariance (%)KMOBartlett’s Test of SphericityCronbach’s Alpha ( α )CRAVE
Performance Expectancy (PE) 0.706325.497 *00.8050.8910.733
PE10.85572.903
PE20.87915.664
PE30.82611.433
Effort Expectancy (EE) 0.75569.741 *00.8330.8920.673
EE10.72267.357
EE20.87915.896
EE30.87611.753
EE40.7954.994
Social Influence (SI) 0.722886.804 *00.9310.9610.881
SI10.89687.959
SI20.9619.437
SI30.9552.605
Facilitating Conditions (FC) 0.671218.841 *00.7590.8120.524
FC10.78851.775
FC20.83119.976
FC30.74117.628
FC40.70410.62
Hedonic Motivation (HM) 0.702513.774 *00.8680.9220.792
HM10.91579.349
HM20.92114.4
HM30.8336.251
Habit (HB) 0.64136.668 *00.7950.7810.563
HB10.77755.69
HB20.86430.002
HB30.83514.308
Price Value (PV) 0.672237.266 *00.7450.8610.674
PV10.76267.225
PV20.85519.691
PV30.8413.084
Perceived Security (PS) 0.747550.724 *00.8920.9320.821
PS10.89682.323
PS20.9179.859
PS30.9097.818
Perceived Risk (PR) 0.733491.538 *00.8750.9230.802
PR10.87980.151
PR20.91511.598
PR30.8928.251
Institutional Trust (IT) 0.668490.611 *00.8530.9220.783
IT10.85378.454
IT20.93615.016
IT30.8666.53
Technological Trust (TT) 0.694309.124 *00.7910.8810.721
TT10.86171.699
TT20.80317.038
TT30.87611.263
Behavioural Intention (BI) 0.624290.988 *00.7520.8620.683
BI10.78967.696
BI20.88822.896
BI30.8769.408
Table 6. Discriminant validity test and collinearity assessment.
AVEVIFUBPEEESIFCHMHBPVPSPRITTTBIGENAGEEDUINCEXP
UBN/AN/AN/A
PE0.7331.5420.0090.856
EE0.6732.1030.0320.547 **0.82
SI0.8811.539−0.050.252 **0.353 **0.939
FC0.5241.9260.050.309 **0.565 **0.263 **0.724
HM0.7921.78−0.0470.261 **0.440 **0.432 **0.476 **0.889
HB0.8631.7230.1030.215 **0.256 **0.429 **0.113 *0.406 **0.75
PV0.6741.252−0.157 **−0.0920.0750.154 **0.170 **0.0850.167 **0.821
PS0.8212.793−0.020.199 **0.327 **0.386 **0.253 **0.243 **0.370 **0.321 **0.901
PR0.8021.4960.061−0.026−0.088− 0.126 *−0.076−0.0730.085−0.163 **−0.473 **0.896
IT0.7832.2490.0440.153 **0.354 **0.216 **0.258 **0.260 **0.266 **0.251 **0.658 **−0.271 **0.885
TT0.7212.1340.0230.139 *0.226 **0.274 **0.261 **0.209 **0.337 **0.305 **0.597 **−0.259 **0.701 **0.849
BI0.6831.234−0.0150.275 **0.444 **0.326 **0.227 **0.380 **0.417 **0.211 **0.512 **−0.135 *0.499 **0.416 **0.826
GENN/A1.1410.0490.027−0.039−0.0880.116 *−0.111 *−0.161 **−0.091−0.103−0.006−0.216 **−0.106−0.131 *N/A
AGEN/A1.24−0.223 **−0.07−0.0110.02−0.118 *0.034−0.0450.050.032−0.081−0.096−0.210 **0.044−0.08N/A
EDUN/A1.1460.119 *0.157 **0.039−0.0090.02−0.0820.011−0.157 **0.0030.078−0.165 **−0.173 **0.0780.0660.004N/A
INCN/A1.1540.249 **0.1070.0550.0590.026−0.0070.088−0.1030.007−0.074−0.073−0.0040.0810.127 *0.215 **0.066N/A
EXPN/A1.1180.116 *0.0660.154 **−0.0730.170 **0.0790.070.0310.0360.0420.074−0.0260.0870.0370.146 **0.0410.122 *N/A
Notes: * p < 0.05, ** p < 0.01, Factor Correlation Matrix with AVE on the diagonal; AVE: Average Variance Extracted; VIF: Variance Inflation Factor; PE: Performance Expectancy; EE: Effort Expectancy; SI: Social Influence; FC: Facilitating Condition; HM: Hedonic Motivation; HB: Habit; PV: Price Value; PS: Perceived Security; PR: Perceived Risk; IT: Institutional Trust; TT: Technological Trust; BI: Behavioural Intention; UB: Use Behaviour; GEN: Gender; EDU: Education; INC: Income; EXP: Experience.
Table 7. Significance of path coefficient.
RelationshipHypothesisT StatisticCoefficientp ValuesResults
PE → BIH10.727−0.0240.468Not Supported
EE → BIH24.9810.124 *0.021Supported
SI → BIH30.701−0.0940.484Not Supported
FC → BIH4(a)−1.7310.113 **0.005Supported
FC → UBH4(b)1.0610.288 ***0Supported
HM → BIH52.5010.132 *0.013Supported
PV → BIH63.060.263 ***0Supported
HB → BIH7(a)4.2180.141 *0.031Supported
HB → UBH7(b)2.2430.354 **0.006Supported
PS → BIH8(a)3.6620.332 ***0Supported
PS → UBH8(b)−0.8660.191 *0.048Supported
PR → BIH91.213−0.0710.226Not Supported
IT → BIH103.2230.181 **0.001Supported
TT → BIH112.4230.218 ***0Supported
BI → UBH12−0.8480.432 **0.007Supported
* means the observed effect is statistically significant at p < 0.05. ** means the observed effect is statistically significant at p < 0.01. *** means the observed effect is statistically significant at p < 0.001.
Table 8. Moderating effect of behavioural intention.
UTAUT2Model 1Model 2Model 3Model 4
B S.E B S.E B S.E B S.E
PE0.0410.0570.0330.0530.0130.053−0.0240.052
EE0.33 ***0.0660.266 ***0.0620.26 ***0.0620.124 *0.064
SI0.0390.056−0.0140.053−0.0120.053−0.0940.052
FC−0.1060.0610.148 **0.0570.155 **0.0590.113 **0.061
HM0.151 **0.060.17 **0.0560.188 **0.0570.132 *0.056
HB0.233 ***0.0550.123 *0.0550.108 *0.0560.263 ***0.054
PV0.15 **0.0490.0560.0470.176 **0.0480.141 *0.052
UTAUT2 + PS + PR + IT + TT
PS 0.255 ***0.070.21 **0.0710.332 ***0.055
PR 0.0630.0520.0620.052−0.0710.09
IT 0.273 **0.070.159 ***0.0560.181 **0.071
TT 0.193 **0.060.259 ***0.0640.218 ***0.09
Moderators
Gender −0.0060.046−0.0330.045
Age 0.0510.0470.0680.053
Education 0.133 **0.0460.0570.075
Income 0.0620.0460.0320.047
Experience 0.010.0450.0130.046
Interaction Terms
PS x GEN −0.207 *0.107
IT x GEN 0.209 *0.093
TT x AGE 1.498 *0.053
TT x EDU 1.321 **0.034
PS x GEN x INC −0.362 ***0.106
IT x GEN x INC 0.401 ***0.085
PS x AGE x EXP −1.866 *0.455
TT x AGE x EXP −1.766 *0.855
PS x GEN x AGE x INC −2.188 **0.809
IT x GEN x AGE x INC 1.373 **0.54
TT x GEN x AGE x INC 0.4330.67
PS x GEN x AGE x EXP 2.498 **0.985
IT x GEN x AGE x EXP −2.187 *1.1
TT x AGE x EDU x EXP −1.523 **0.056
PS x GEN x AGE x EDU x INC x EXP 2.767 *1.14
IT x GEN x AGE x EDU x INC x EXP −1.718 **0.637
Model Summary
F21.851 *** 23.294 *** 16.785 *** 8.539 ***
R20.415 0.43 0.59 0.79
Adjusted R20.415 0.42 0.59 0.78
* means the observed effect is statistically significant at p < 0.05. ** means the observed effect is statistically significant at p < 0.01. *** means the observed effect is statistically significant at p < 0.001.
Table 9. Moderating effects for use behavioural intention.
UTAUT2Model 1Model 2Model 3Model 4
B S.E B S.E B S.E B S.E
FC0.162 **0.059−0.0590.068−0.202 **0.0560.288 ***0.056
HB0.142 *0.0630.223 *0.0630.108 *0.0590.354 **0.06
BI0.158 *0.0690.010.0630.0760.0640.191 *0.067
UTAUT2 + PS 0.165 *0.0530.321 ***0.0710.432 **0.055
Moderators
Gender −0.0210.055−0.0190.055
Age −0.298 ***0.055−0.283 ***0.057
Education 0.103 *0.0520.114 *0.054
Income 0.293 ***0.0550.291 ***0.055
Experience 0.121 *0.0540.108 *0.055
Interaction Terms
PS x AGE x EXP −1.334 ***0.556
PS x GEN x AGE x EXP 2.344 ***0.966
Model Summary
F17.59 27.171 *** 19.171 *** 5.564 ***
R20.159 0.321 0.397 0.547
Adjusted R20.159 0.312 0.397 0.531
* means the observed effect is statistically significant at p < 0.05. ** means the observed effect is statistically significant at p < 0.01. *** means the observed effect is statistically significant at p < 0.001.
Disclaimer/Publisher’s Note: The statements, opinions and data contained in all publications are solely those of the individual author(s) and contributor(s) and not of MDPI and/or the editor(s). MDPI and/or the editor(s) disclaim responsibility for any injury to people or property resulting from any ideas, methods, instructions or products referred to in the content.

