You are currently viewing a new version of our website. To view the old version click .
Computers
  • Article
  • Open Access

1 April 2025

SMS3D: 3D Synthetic Mushroom Scenes Dataset for 3D Object Detection and Pose Estimation

,
,
,
,
,
and
1
Department of Computer Science, University of Houston, Houston, TX 77004, USA
2
Department of Engineering Technology, University of Houston, Houston, TX 77004, USA
*
Author to whom correspondence should be addressed.
This article belongs to the Special Issue Advanced Image Processing and Computer Vision (2nd Edition)

Abstract

The mushroom farming industry struggles to automate harvesting due to limited large-scale annotated datasets and the complex growth patterns of mushrooms, which complicate detection, segmentation, and pose estimation. To address this, we introduce a synthetic dataset with 40,000 unique scenes of white Agaricus bisporus and brown baby bella mushrooms, capturing realistic variations in quantity, position, orientation, and growth stages. Our two-stage pose estimation pipeline combines 2D object detection and instance segmentation with a 3D point cloud-based pose estimation network using a Point Transformer. By employing a continuous 6D rotation representation and a geodesic loss, our method ensures precise rotation predictions. Experiments show that processing point clouds with 1024 points and the 6D Gram–Schmidt rotation representation yields optimal results, achieving an average rotational error of 1.67 ° on synthetic data, surpassing current state-of-the-art methods in mushroom pose estimation. The model, further, generalizes well to real-world data, attaining a mean angle difference of 3.68 ° on a subset of the M18K dataset with ground-truth annotations. This approach aims to drive automation in harvesting, growth monitoring, and quality assessment in the mushroom industry.

1. Introduction

The mushroom industry has a vital role in global agriculture, providing nutritious food and driving economic growth. With growing consumer demand, innovative cultivation practices are essential to improve productivity, efficiency, and product quality. Automation technologies, especially those using computer vision, have the potential to transform mushroom farming by enabling precise monitoring of growth and controlled harvesting throughout the cultivation process.
Implementing computer vision models for automated mushroom harvesting presents unique challenges. Mushrooms have subtle texture variations, and often grow in dense clusters within controlled environments. Accurate detection, segmentation, and pose estimation of mushrooms can be further complicated by occlusions, changing light conditions, and similar-looking background elements. Additionally, the development of robust machine learning models requires extensive annotated data, which is limited due to the labor-intensive data collection and annotation required in industrial settings. Current datasets for mushroom detection and classification are limited in scale and realism. While recent publications provide 3D mushroom datasets [1,2], these datasets fall short in capturing the natural appearance, dense clustering, and realistic environmental backgrounds typical of mushroom farms. Moreover, they often impose a minimum spacing between mushrooms, which fails to mimic the close proximity and clustering commonly seen in actual cultivation environments.
To bridge these gaps, we present a comprehensive and fully customizable pipeline to generate synthetic scenes designed for training and evaluating computer vision models in the mushroom industry. Our pipeline includes two widely cultivated mushroom species, white Agaricus bisporus and brown baby bella. We also generated 20,000 unique scenes per species, totaling 40,000 scenes, which will be publicly available. This number of images was chosen to ensure comprehensive coverage of orientations, sizes, locations, and backgrounds, which is vital for robust detection and pose estimation. To justify this choice, we conducted an experiment measuring the average pairwise distance in feature space as we increased the sample size from a small subset up to 20,000 images (see Figure 1). In this experiment, we randomly sampled incremental subsets of the dataset and computed the mean Euclidean distance between every pair of object-level feature vectors (centers, dimensions, and orientations). The resulting curve shows that the distance initially increases sharply and then levels off, revealing minimal additional benefit beyond about 20,000 images.
Figure 1. Average pairwise distance in feature space as the sample size increases.
However, generating more than 20,000 images can still significantly broaden the distribution’s coverage. Due to storage and hardware limitations, we settled on 20,000 per species, which remains sufficiently large for training modern neural networks. Since deep learning benefits from as much data as possible, having a large, diverse set of synthetic images—without redundancy, given the vast configuration space—substantially strengthens a model’s ability to generalize. Moreover, the dataset remains scalable: Researchers can easily generate additional scenes, further improving training effectiveness and performance. Each scene features a random number of mushrooms ranging from 1 to 100 in varied locations, orientations, and scales, simulating diverse growth stages and arrangements. This dataset greatly exceeds prior datasets in size, the largest of which contains only 150 scenes [1].
Our synthetic dataset is generated from 3D scans of mushrooms and high-resolution soil images to closely replicate the appearance of real-world mushroom farms. For each species of both white and brown mushrooms, we used seven detailed 3D models to capture natural variations in mushroom appearance, as shown in Figure 2. By integrating realistic models and textures, as well as images having a mixture of different mushroom sizes, this dataset is designed for training models applicable to industrial applications.
Figure 2. High-definition 3D models of mushrooms used in the dataset. Top row: white Agaricus bisporus; bottom row: brown baby bella.
Our dataset can be utilized in a variety of applications, including 2D and 3D mushroom detection and pose estimation (which we focus on in this paper), monocular depth estimation of RGB images, and automatic harvesting. While we only demonstrate the first application here, the data can also be used to obtain depth information from single RGB images and assist robotic systems in efficiently harvesting mushrooms. In fact, automated mushroom harvesting robots have been developed to selectively pick individual mushrooms from clusters using computer vision and robotic manipulation techniques [3,4]. Our dataset can further aid in improving such systems by providing high-quality RGB-D data for detecting individual mushrooms within dense clusters.
Our data generation pipeline incorporates controlled variability in mushroom appearance, arrangement, and environmental factors to closely replicate industrial cultivation conditions. By allowing mushrooms to grow in dense clusters without enforcing minimum spacing, we tried to provide a more realistic dataset compared to previous similar studies. Figure 3 presents sample 3D scenes from our dataset along with 3D point clouds of real mushroom images for both white and brown mushrooms. The synthetic nature of our data provides precise annotations for each image, including segmentation masks, bounding boxes, depth maps, and 3D pose information. This comprehensive dataset enables the training of robust computer vision models suited for industrial applications.
Figure 3. (a,b) show sample 3D scenes with oriented bounding boxes from the dataset, demonstrating how white and brown mushrooms appear in the synthetic environment. (c,d) provide corresponding real-life photographs of white and brown mushrooms, illustrating their natural appearance.
The key contributions of our work are as follows:
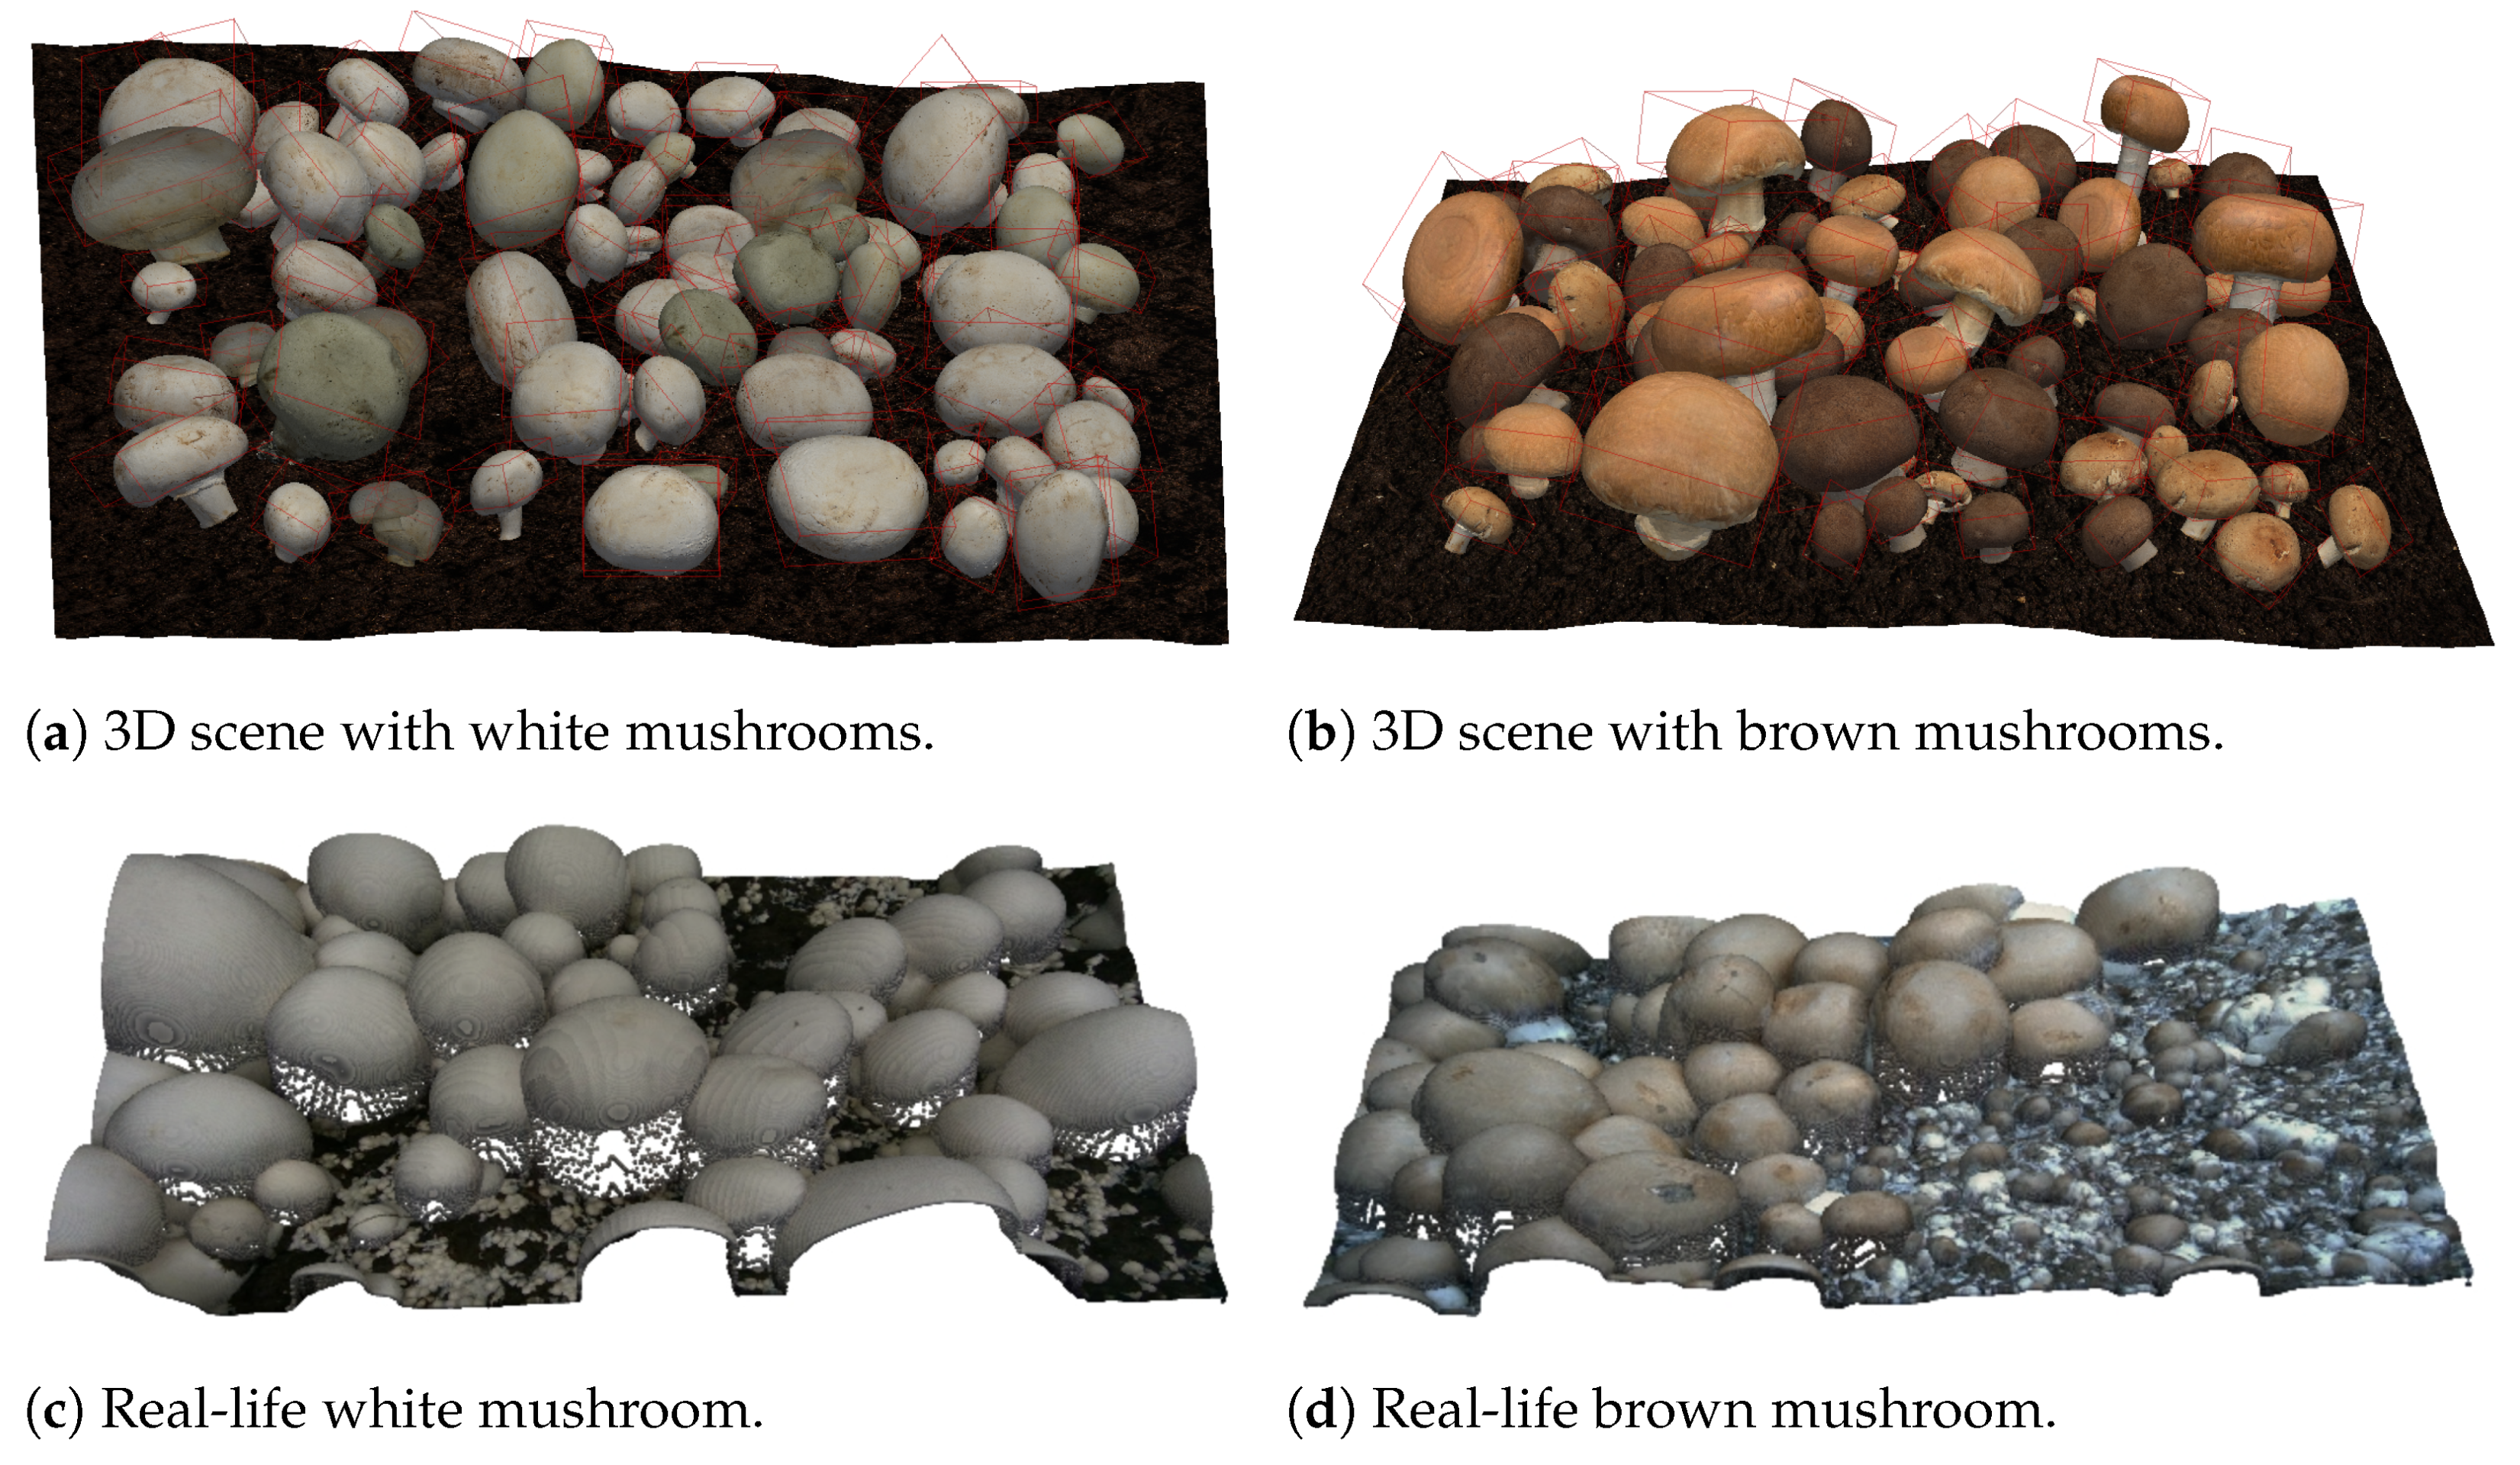
  • We introduce a novel synthetic dataset generation pipeline tailored for the mushroom industry, providing detailed annotations for various computer vision tasks.
  • Our data generation pipeline uses real 3D-scanned mushroom models and high-resolution soil images, enhancing dataset relevance.
  • We validate our dataset through quantitative and qualitative analysis, benchmarking machine learning models on relevant tasks to demonstrate its potential for advancing automation in the mushroom industry.
  • We propose a state-of-the-art 3D object detection and pose estimation pipeline for use in robotic mushroom harvesting applications.

3. Methodology

3.1. Synthetic Scene Generation

To generate a realistic and diverse dataset for training computer vision models in the mushroom industry, we developed a synthetic scene generation pipeline with two key components: (1) ground plane generation using Perlin noise [24] to simulate natural terrain, and (2) random mushroom placement with transformations and collision detection to replicate cluttered environments with occlusions.

3.1.1. Ground Plane Generation

The ground plane represents the soil surface where mushrooms grow. To mimic the natural, uneven appearance of soil in cultivation environments, we create a ground plane mesh and apply Perlin noise for height variation. The ground plane is defined as a grid of points with dimensions I × J and resolutions R I and R J along the x and y axes, respectively. The Perlin noise function N ( x , y ) is calculated at each grid point ( x , y ) to determine the elevation z ( x , y ) :
z ( x , y ) = A · Perlin ( s · x , s · y ) + z 0
where:
  • A is the amplitude controlling the height variation;
  • s is the scaling factor affecting the frequency of the noise;
  • z 0 is the base elevation (set to zero in our case);
  • Perlin ( x , y ) is the Perlin noise function, defined as follows:
    Perlin ( x , y ) = o = 0 O 1 p o · n ( 2 o x , 2 o y )
    where
    -
    O is the number of octaves controlling the level of detail;
    -
    p is the persistence determining the amplitude reduction at each octave;
    -
    n ( x , y ) is a smooth noise function.
Adjusting parameters such as amplitude A, scaling factor s, number of octaves O, and persistence p, we control the roughness and appearance of the ground surface. Figure 4 illustrates an example of the generated Perlin noise applied to the ground plane. High-definition soil textures are then mapped onto this surface to enhance realism, using texture tiling to cover the entire plane seamlessly.
Figure 4. Visualization of Perlin noise applied to the ground plane to simulate natural terrain variations.

3.1.2. Mushroom Placement

Mushrooms are placed on the ground plane with random transformations and collision detection to emulate natural growth patterns, including clustering and varied orientations. Each mushroom is assigned a random position ( x , y ) within a specified range [ x min , x max ] × [ y min , y max ] , ensuring even distribution. The z-coordinate coordinate is set to zero and adjusted based on the ground elevation at ( x , y ) . Random rotations are applied to simulate natural variations in mushroom orientation. The rotations around the x (roll), y (pitch), and z (yaw) axes are defined by the angles θ x , θ y , and θ z , respectively. These angles are sampled as follows:
  • Roll ( θ x ): sampled from a Gaussian distribution N ( 0 , σ x 2 ) .
  • Pitch ( θ y ): sampled from a Gaussian distribution N ( 0 , σ y 2 ) .
  • Yaw ( θ z ): uniformly sampled from [ 0 ° , 360 ° ] .
The standard deviations σ x and σ y control the extent of variation in roll and pitch. Distribution plots for each rotation angle are provided in Figure 5. Standard deviations σ x and σ y are both set to 20, which is the value closest to the rotation statistics of real mushrooms based on rotation distributions of our manually labeled subset of real images.
Figure 5. Distributions of rotation angles applied to mushrooms.
The combined rotation matrix R is computed by multiplying the individual rotation matrices:
R = R z · R y · R x
where R x , R y , and R z are the rotation matrices around the x, y, and z axes, respectively.
To represent different mushroom sizes, mushrooms are scaled uniformly. The scaling factor s is randomly sampled from a uniform distribution [ s min , s max ] . Additionally, random stretching factors s x , s y , and s z are applied along each axis to introduce variability in mushroom shapes:
s i = s · ϵ i for i { x , y , z }
where ϵ i is sampled from [ ϵ min , ϵ max ] . Size distribution is provided in Figure 6.
Figure 6. Distribution of scaling factors applied to mushrooms to simulate different growth stages.
To realistically model mushroom clusters, we allow mushrooms to be placed in proximity, sometimes with minimal overlap. Collision detection is performed using mesh intersection tests rather than simple bounding box checks, capturing the actual geometry of the mushrooms for a more accurate representation of natural clustering. For each new mushroom, intersections are checked with the k nearest previously placed mushrooms based on Euclidean distance. If the intersection volume exceeds a set threshold, the placement is deemed invalid, and a new position is sampled, with the process repeated up to a maximum number of attempts, set to 100. This value is a hyperparameter of the generation pipeline and it was chosen based on observations of the maximum number of mushrooms in real images. Increasing it allows for denser and more realistic mushroom clusters but slows down the generation process. After applying random rotation and scaling transformations, the same affine transformations are applied to the mushroom’s oriented bounding box (OBB) to ensure consistent annotations. To ensure mushrooms are properly positioned on uneven terrain, we adjust their vertical placement based on the ground elevation at their ( x , y ) coordinates derived from the Perlin noise function. Each mushroom is translated along the z-axis so that the base of its stem aligns with the ground surface, avoiding visual artifacts like floating or submerged mushrooms.

3.1.3. Mushroom Placement Algorithm

Algorithm 1 summarizes the mushroom placement process, outlining the key steps to ensure realism and diversity in the generated scenes.
Algorithm 1 Mushroom Placement Process.
Output Ground plane mesh, list of mushroom models, maximum attempts M, overlap threshold τ
  1:
for each mushroom to be placed do
  2:
    a t t e m p t s 0
  3:
   repeat
  4:
     Randomly select a mushroom model
  5:
     Sample random position ( x , y ) within placement range
  6:
     Sample rotation angles θ x , θ y , θ z
  7:
     Compute rotation matrix R R z · R y · R x
  8:
     Sample scaling factors s x , s y , s z
  9:
     Compute scaling matrix S diag ( s x , s y , s z , 1 )
10:
     Apply transformation T R · S to the mushroom model
11:
     Align mushroom stem base with ground elevation at ( x , y )
12:
      o v e r l a p  False
13:
     for each nearby placed mushroom do
14:
        Compute intersection volume V int
15:
        if  V int > τ  then
16:
           o v e r l a p  True
17:
          break
18:
        end if
19:
     end for
20:
      a t t e m p t s a t t e m p t s + 1
21:
   until  ¬ o v e r l a p  or  a t t e m p t s M
22:
   if  ¬ o v e r l a p  then
23:
     Add mushroom to scene
24:
     Store transformation data for annotations
25:
   end if
26:
end for
In the algorithm,
  • M is the maximum placement attempts (set to 100) to balance computational cost and placement success;
  • τ is the overlap threshold (5% IoU), ensuring minimal collisions, where larger τ can yield unrealistic overlaps and stricter thresholds reduce feasibility;
  • Transformations (position, orientation, size) ensure unique, realistic mushroom instances;
  • Collision detection uses mesh intersection volumes, checked against τ .
By following this process, we generate scenes with varying numbers of mushrooms, realistic clustering, and diverse appearances, closely mimicking conditions in actual mushroom cultivation environments.

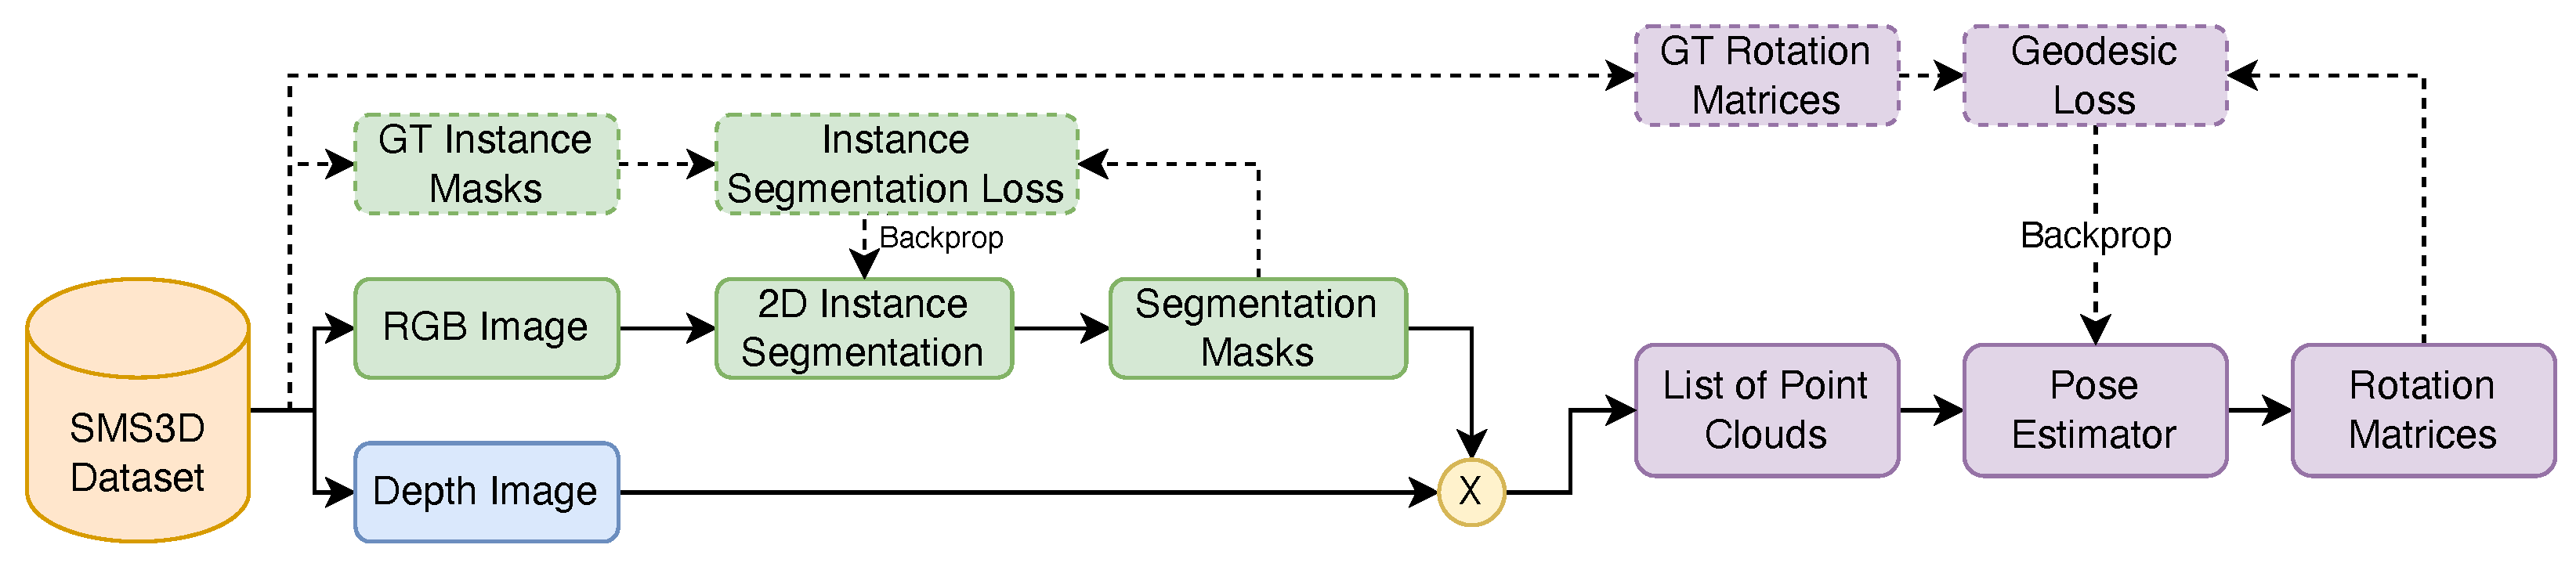
3.2. Pose Estimation Model Training

Our pose estimation pipeline, depicted in Figure 7, leverages two neural networks to estimate the 3D orientation (pose) of mushrooms in the generated scenes. The first network performs object detection and instance segmentation on RGB images, locating individual mushrooms and generating segmentation masks. The second network estimates each mushroom’s 3D pose by processing its corresponding point cloud, extracted using the segmentation masks. Initially, we attempted to predict rotation matrices directly from the complete scene’s point cloud, but this approach yielded suboptimal results due to overlapping mushrooms and environmental clutter. By isolating each mushroom with 2D detection and segmentation, pose estimation accuracy improved significantly. Figure 8 shows examples of extracted mushroom cap point clouds.
Figure 7. Complete two-stage pose estimation pipeline. Dotted boxes and lines are used for backward pass during training, and solid lines and boxes are used during forward pass (inference). The dataset provides ground truth (GT) annotations.
Figure 8. Sample mushroom cap 3D point cloud.
The pose estimation pipeline starts with a 2D object detection and segmentation network. We use an RGB-based convolutional neural network, such as Mask R-CNN [25], to detect mushrooms in the scene and generate instance segmentation masks, producing bounding boxes and pixel-wise masks for each detected mushroom. These instance masks allow us to extract individual mushroom point clouds from the complete scene’s point cloud, which are then processed by the 3D pose estimation network to predict the rotation matrix representing each mushroom’s 3D orientation.
To evaluate the effectiveness of different point cloud feature extractors, we compared PointNet [14], PointNet++ [11], and the Point Transformer [15], using the θ diff as the pose accuracy metric. The results were 8.37 ° (PointNet), 6.19 ° (PointNet++), and 1.67 ° (Point Transformer), with the Point Transformer performing best. We thus adopt the Point Transformer backbone, which processes point clouds directly, is permutation-invariant, and effectively captures local and global features through self-attention.
The network takes a point cloud P R N × 3 as input, where N is the number of points, each with 3D coordinates ( x , y , z ) . Local aggregation layers perform feature extraction by capturing local geometric structures, using sampling and grouping to form neighborhoods, followed by multi-layer perceptron’s (MLPs) for feature extraction. Self-attention layers model long-range dependencies and global context within the point cloud. Point-wise features are aggregated into a global feature vector via max pooling, and fully connected layers map this vector to a 6D rotation representation, with a normalization layer ensuring valid rotation outputs.
Predicting 3D rotations is challenging due to the non-Euclidean nature of rotation groups and discontinuities in conventional representations like Euler angles. To overcome these issues, we use the continuous 6D rotation representation proposed by Zhou et al. [23] and train with a geodesic loss function. A rotation matrix R S O ( 3 ) can be uniquely represented by its first two columns, concatenated into a 6D vector r 6 D R 6 . To reconstruct the full rotation matrix from r 6 D , we apply the Gram–Schmidt orthogonalization process:
b 1 = a 1 a 1
a 2 = a 2 ( b 1 a 2 ) b 1
b 2 = a 2 a 2
b 3 = b 1 × b 2
R = [ b 1 b 2 b 3 ]
where a 1 , a 2 R 3 are the first and second components of r 6 D , and × denotes the cross product.
The geodesic loss measures the rotational distance between two rotation matrices on the manifold S O ( 3 ) [26]. Given the predicted rotation matrix R pred and the ground truth rotation matrix R gt , the geodesic loss is defined as follows:
L geo = arccos trace ( R pred R gt ) 1 2
To ensure numerical stability, we clamp the input to the arccos function within [ 1 + ϵ , 1 ϵ ] , where ϵ is a small constant (e.g., ϵ = 1 × 10 7 ).
The training process involves generating training samples consisting of point clouds of individual mushrooms and their corresponding ground truth rotation matrices. Data augmentation techniques, such as random jittering and scaling, are applied to improve generalization. During the forward pass, the point cloud P is input to the pose estimation network, which outputs a normalized 6D rotation vector r 6 D . This vector is converted to a rotation matrix R pred using the Gram–Schmidt process. The geodesic loss L geo is computed between R pred and the ground truth rotation matrix R gt . Gradients are computed with respect to the network parameters, and the weights are updated using the Adam optimizer with a learning rate of 1 × 10 4 . The model’s performance is evaluated on a separate validation set to monitor overfitting and adjust hyperparameters as needed.
The pose estimation network is implemented using PyTorch and PyTorch Lightning for efficient training and scalability. We trained the network with a batch size of 32 for 200 epochs. The Adam optimizer is used with an initial learning rate of 1 × 10 4 , and learning rate scheduling is applied to reduce the learning rate upon plateau. Input point clouds are normalized to fit within a unit sphere to ensure scale invariance. Data augmentation techniques, including random permutations, and Gaussian noise, are applied to the input point clouds during training to improve the network’s robustness. To handle the discontinuities in rotation space, we ensure that the geodesic loss is computed within a stable numerical range by clamping the input to the arccos function.
By combining 2D object detection with 3D pose estimation, we decomposed the complex task of estimating mushroom poses in cluttered scenes into manageable sub-tasks. This approach allows the pose estimation network to focus on individual mushrooms, reducing interference from overlapping objects and background noise. The use of the 6D rotation representation and the geodesic loss was essential for stable training and accurate rotation predictions. Alternative rotation representations, such as Euler angles or quaternions, can suffer from discontinuities or ambiguities, which hinder the learning process.
To effectively capture intricate geometric relationships within the point cloud data, we chose the Point Transformer model as the backbone for the pose estimation network. The self-attention mechanism of the Point Transformer enables modeling of both local and global dependencies, which is crucial for accurate pose estimation in complex scenes.

4. Results

In this section, we present the experimental results of our pose estimation model and associated ablation studies. We evaluate the impact of various factors on the model’s performance, including the number of sampled points, rotation representation methods, and inclusion of RGB information. Additionally, we report the performance of the 2D object detection and instance segmentation component and demonstrate the applicability of our model to real-world data.

4.1. Evaluation of Pose Estimation

We conducted extensive experiments to assess the performance of our 3D pose estimation network. All ablation studies were conducted over 10 epochs to quickly evaluate the effects of different settings. After identifying the optimal configuration, we trained the model for a longer duration of 200 epochs to achieve the best possible performance.

4.1.1. Effect of Number of Points

To determine the impact of the number of sampled points from each mushroom point cloud, we experimented with three different settings: 64, 256, and 1024 points. In all cases, we excluded the RGB information and used the 6D rotation representation with the Gram–Schmidt process.
Table 1 summarizes the results of these experiments. As the number of points increases, the model’s performance improves, indicating that a higher point density provides more geometric information for accurate pose estimation. However, increasing the number of points also affects the inference time. Nevertheless, even with our largest model using 1024 points, we still achieve real-time performance on an end device CPU.
Table 1. Effect of the number of sampled points on pose estimation performance. All models use the 6D rotation representation without RGB information.

4.1.2. Effect of Rotation Representation

We investigated the influence of different rotation representations on the model’s accuracy. Using 1024 points without RGB information, we compared the following rotation representations: 6D Gram–Schmidt, 9D rotation matrix, quaternion, and Euler angles. The 6D Gram–Schmidt method achieved the best results, likely due to its continuity and avoidance of singularities or ambiguities present in other representations. Euler angles can suffer from discontinuities and gimbal lock, while quaternions have ambiguity between q and q representing the same rotation. In quaternion representation, q and −q describe the same 3D rotation. Flipping the sign of each component in a quaternion yields an identical orientation in space. This inherent ambiguity is an important consideration when training models that predict quaternions.
Table 2 shows the performance of each rotation representation.
Table 2. Comparison of different rotation representations on pose estimation performance. All models use 1024 points without RGB information.

4.1.3. Effect of Including RGB Information

We explored whether incorporating RGB color information into the point cloud would enhance the model’s performance. Using 1024 points and the 6D Gram–Schmidt rotation representation, we trained models with and without RGB features. The inclusion of RGB information led to a significant loss in rotation estimation accuracy, suggesting that the geometric structure captured by the point cloud is the primary contributor to accurate pose estimation in our scenario.
Table 3 presents the results of this experiment.
Table 3. Effect of including RGB information on pose estimation performance. All models use 1024 points and the 6D Gram–Schmidt rotation representation.

4.1.4. Model Performance and Inference Time

The experiments revealed a trade-off between model accuracy and inference time. Increasing the number of points improves performance but also increases computational load. These factors must be balanced to achieve practical real-time performance in industrial applications.

4.1.5. Final Model Performance

Using the optimal configuration identified from the ablation studies—1024 points, 6D Gram–Schmidt rotation representation, and excluding RGB information—we trained the model for 200 epochs. This extended training allowed the model to converge fully and achieve its best performance at a geodesic loss value of 0.059 for the validation set.
Figure 9 shows the error distribution for roll, pitch, and yaw components separately. The model demonstrates consistent accuracy across all rotation axes, indicating its robustness in estimating the complete orientation of mushrooms.
Figure 9. Error distribution of rotation estimation for roll, pitch, and yaw angles.
Additionally, we analyzed the rotation errors versus the size of the mushrooms and observed slightly higher errors for smaller mushrooms due to them being partially occluded by taller mushrooms. The results demonstrating the errors in roll, pitch, and yaw prediction are depicted in Figure 10.
Figure 10. Error distribution of rotation estimation vs the size of the mushroom for roll, pitch, and yaw angles.
We also provide a visual comparison between the ground truth and predicted oriented bounding boxes in Figure 11. The predicted bounding boxes closely align with the ground truth, visually confirming the model’s accuracy.
Figure 11. Comparison of ground truth and predicted oriented bounding boxes for sample mushrooms.

4.1.6. Comparison with State-of-the-Art Methods

To evaluate the effectiveness of our proposed pose estimation method, we compare its performance against several state-of-the-art approaches in object pose estimation, particularly those applied to mushrooms. The primary metric for comparison is the average rotational error, denoted as θ diff , which quantifies the mean angular difference between the predicted and ground truth orientations.
On our synthetic validation set, our approach achieves an average rotational error of 1.67 ° , outperforming other methods by a substantial margin. Table 4 presents these comparative results, including the synthetic dataset (This Work (Synthetic)) and the evaluation on 10 real images including 330 mushroom instances (This Work (Real, 10 Images)) from the M18K dataset, for which we labeled ground-truth 3D OBB rotations.
Table 4. Comparison of our method with state-of-the-art methods in terms of average rotational error θ diff . Our method achieves the lowest error on synthetic data and shows strong performance on the real subset (10 images) of the M18K dataset.
Our method’s superior performance (particularly on synthetic data) can be attributed to several key factors:
  • The use of the 6D rotation representation with the Gram–Schmidt process ensures continuity and avoids the ambiguities inherent in other representations, facilitating more accurate rotation predictions.
  • The adoption of the Point Transformer network [15] allows for the effective capture of both local and global geometric features within the point cloud data through self-attention mechanisms.
  • The combination of 2D object detection and instance segmentation with 3D pose estimation isolates individual mushrooms, reducing the complexity introduced by overlapping objects and background clutter.
  • Extensive training on a comprehensive synthetic dataset that closely mimics real-world conditions enhances the model’s generalization capabilities.

4.2. 2D Object Detection and Instance Segmentation Results

The performance of the 2D object detection and instance segmentation component is crucial for accurately isolating individual mushrooms for pose estimation. We evaluated this component using standard metrics such as average precision (AP) for detection and segmentation tasks. We also evaluated the 2D object detection and instance segmentation performance on the real-world dataset. Table 5 shows the detection results including the average precision (AP), average recall (AR), and F1 score across all IoU thresholds. The model maintains high accuracy, suggesting that the synthetic data effectively supplemented the real-world training data. Especially in the case of pre-training the 2D detection and instance segmentation model on the synthetic data and fine-tuning the pre-trained model on the real-world images of the M18K dataset, we observed a significant improvement in both detection and instance segmentation results.
Table 5. Performance metrics for 2D detection and segmentation on SMS3D dataset and M18K dataset. M18K’s results are improved after pre-training the model on SMS3D.

4.3. Application to Real-World Data

To assess the applicability of our model in real-world scenarios, we applied the trained system to real-world RGB-D images from our previous dataset, M18K. We used the M18K dataset to train the 2D object detection and instance segmentation component, ensuring it is adapted to real-world visual characteristics. For the 3D pose estimation component, we employed the model trained on the synthetic dataset.

4.3.1. Quantitative Evaluation on Real M18K Images

We additionally labeled 10 images (330 mushroom instances) from the M18K dataset with ground-truth 3D oriented bounding box rotations using the CVAT tool. Running inference on this newly annotated set shows a mean angle difference of 3.68 degrees between our predicted rotations and the ground truth. This quantitative result demonstrates that our model, trained entirely on synthetic data for pose estimation, generalizes effectively to real mushroom images.

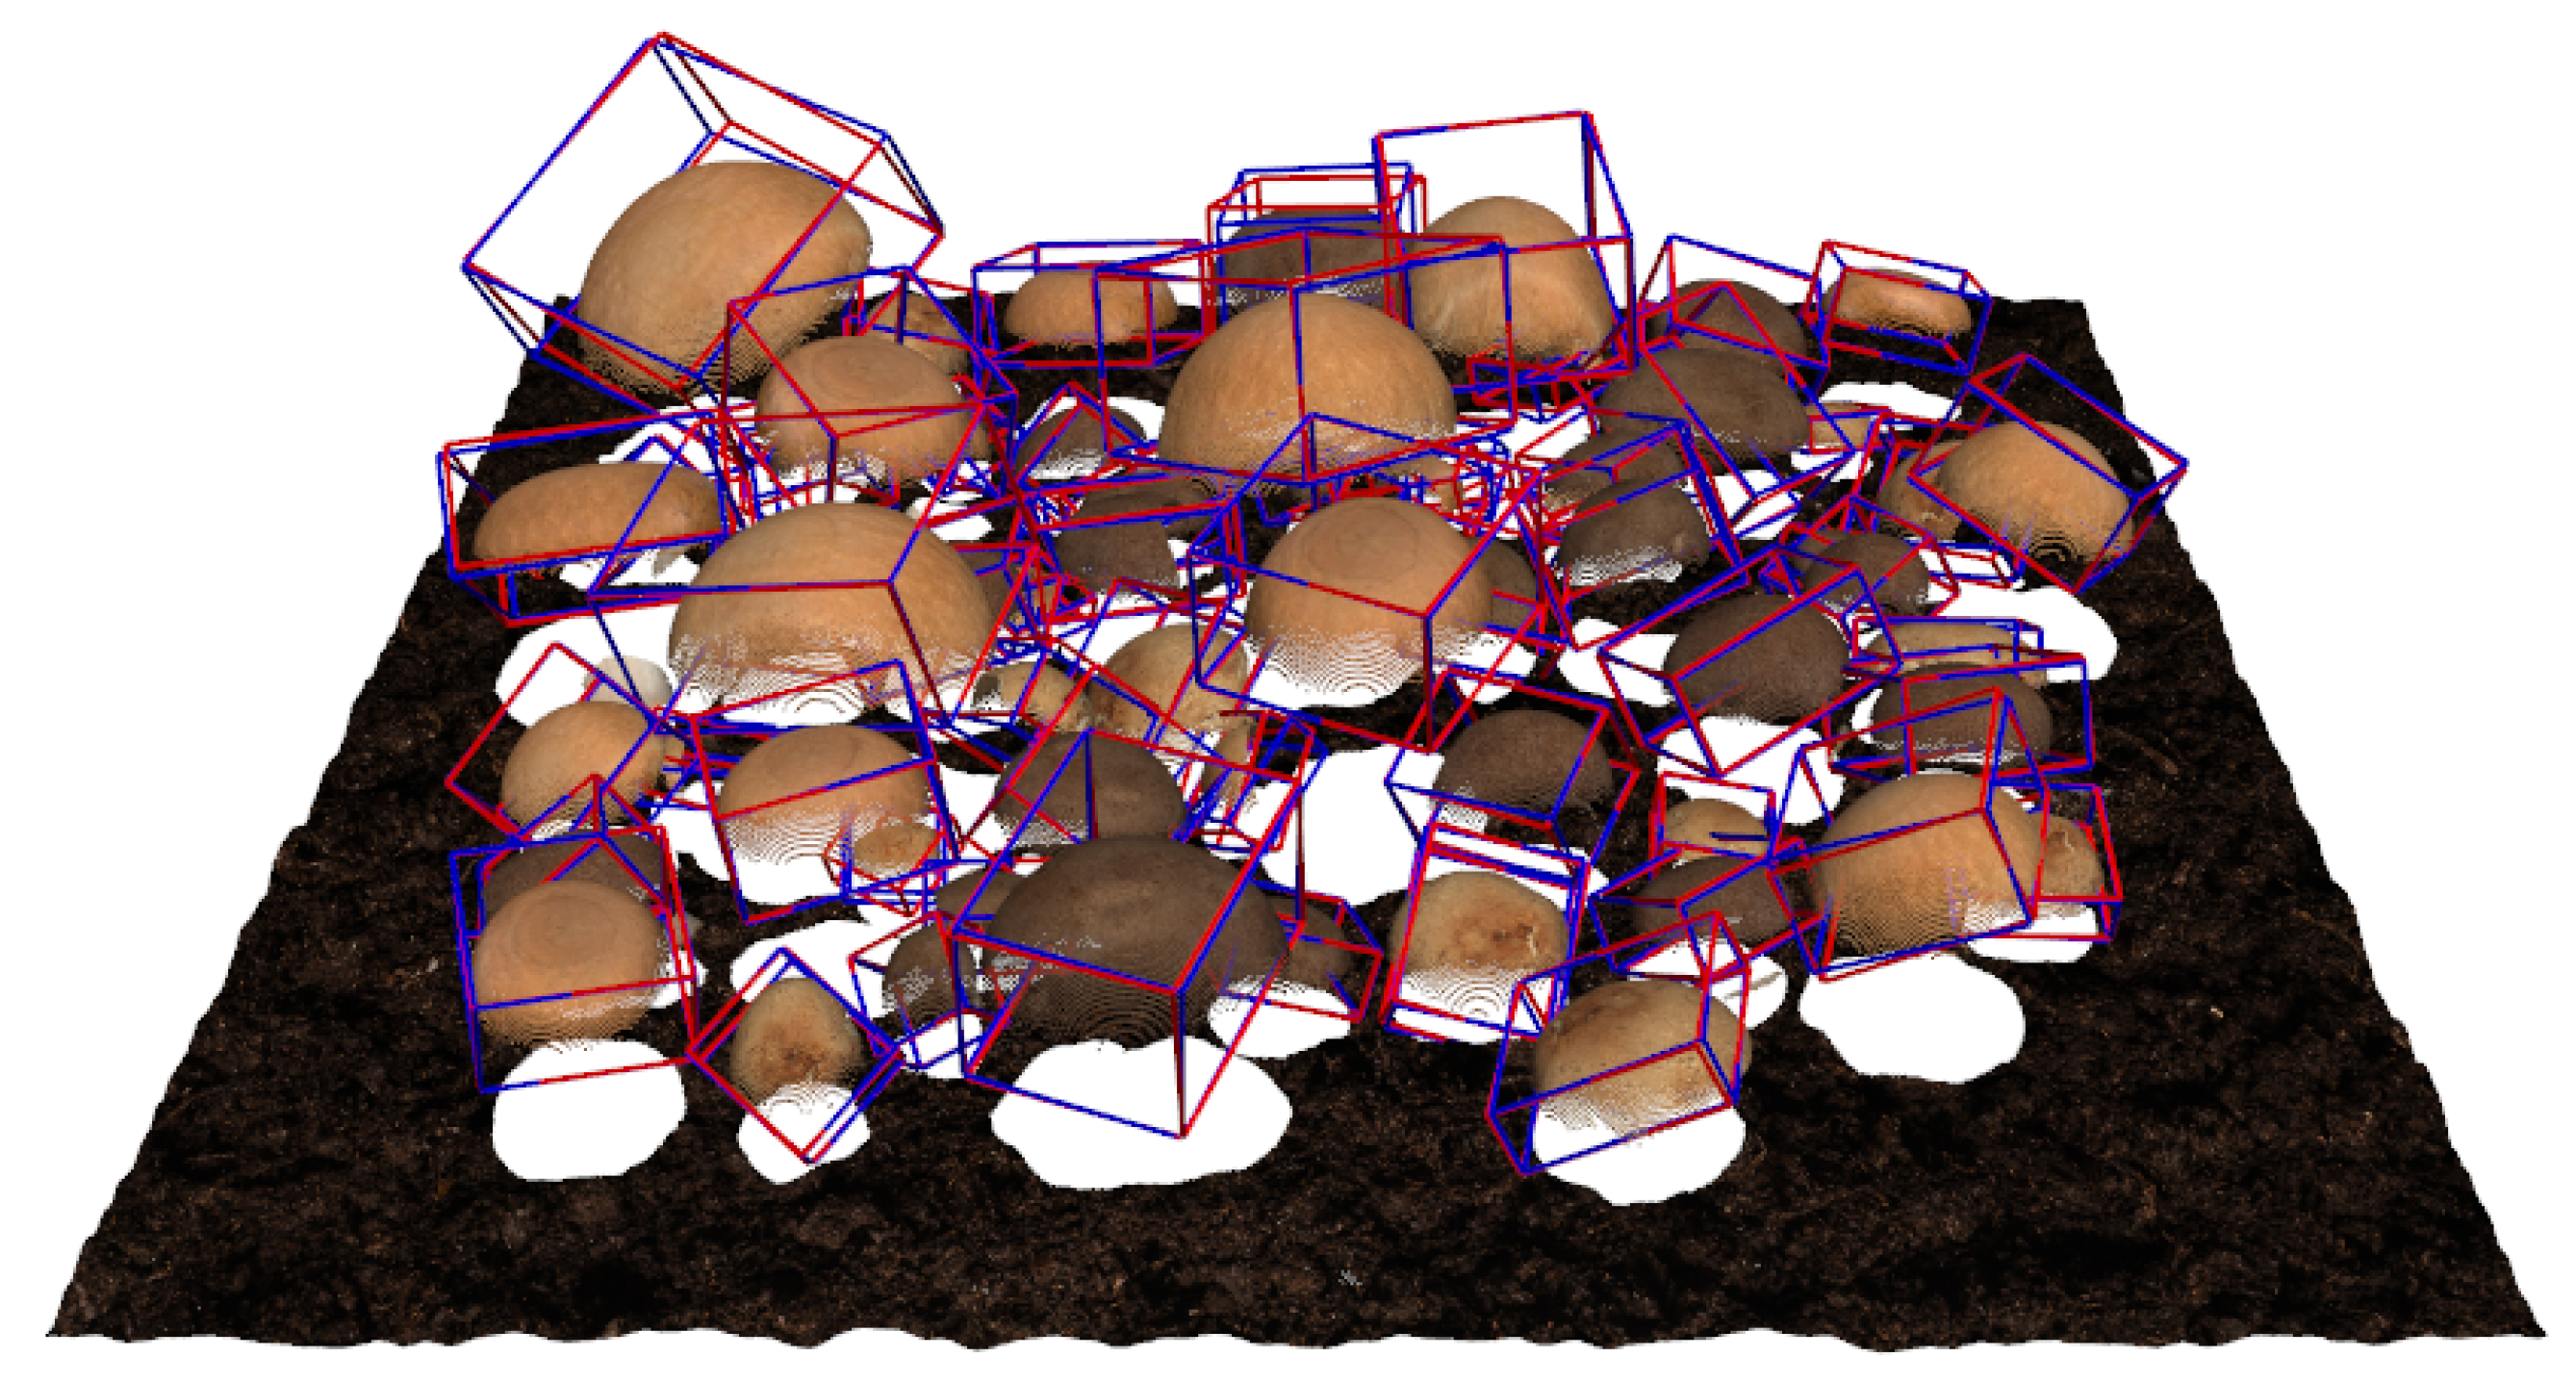
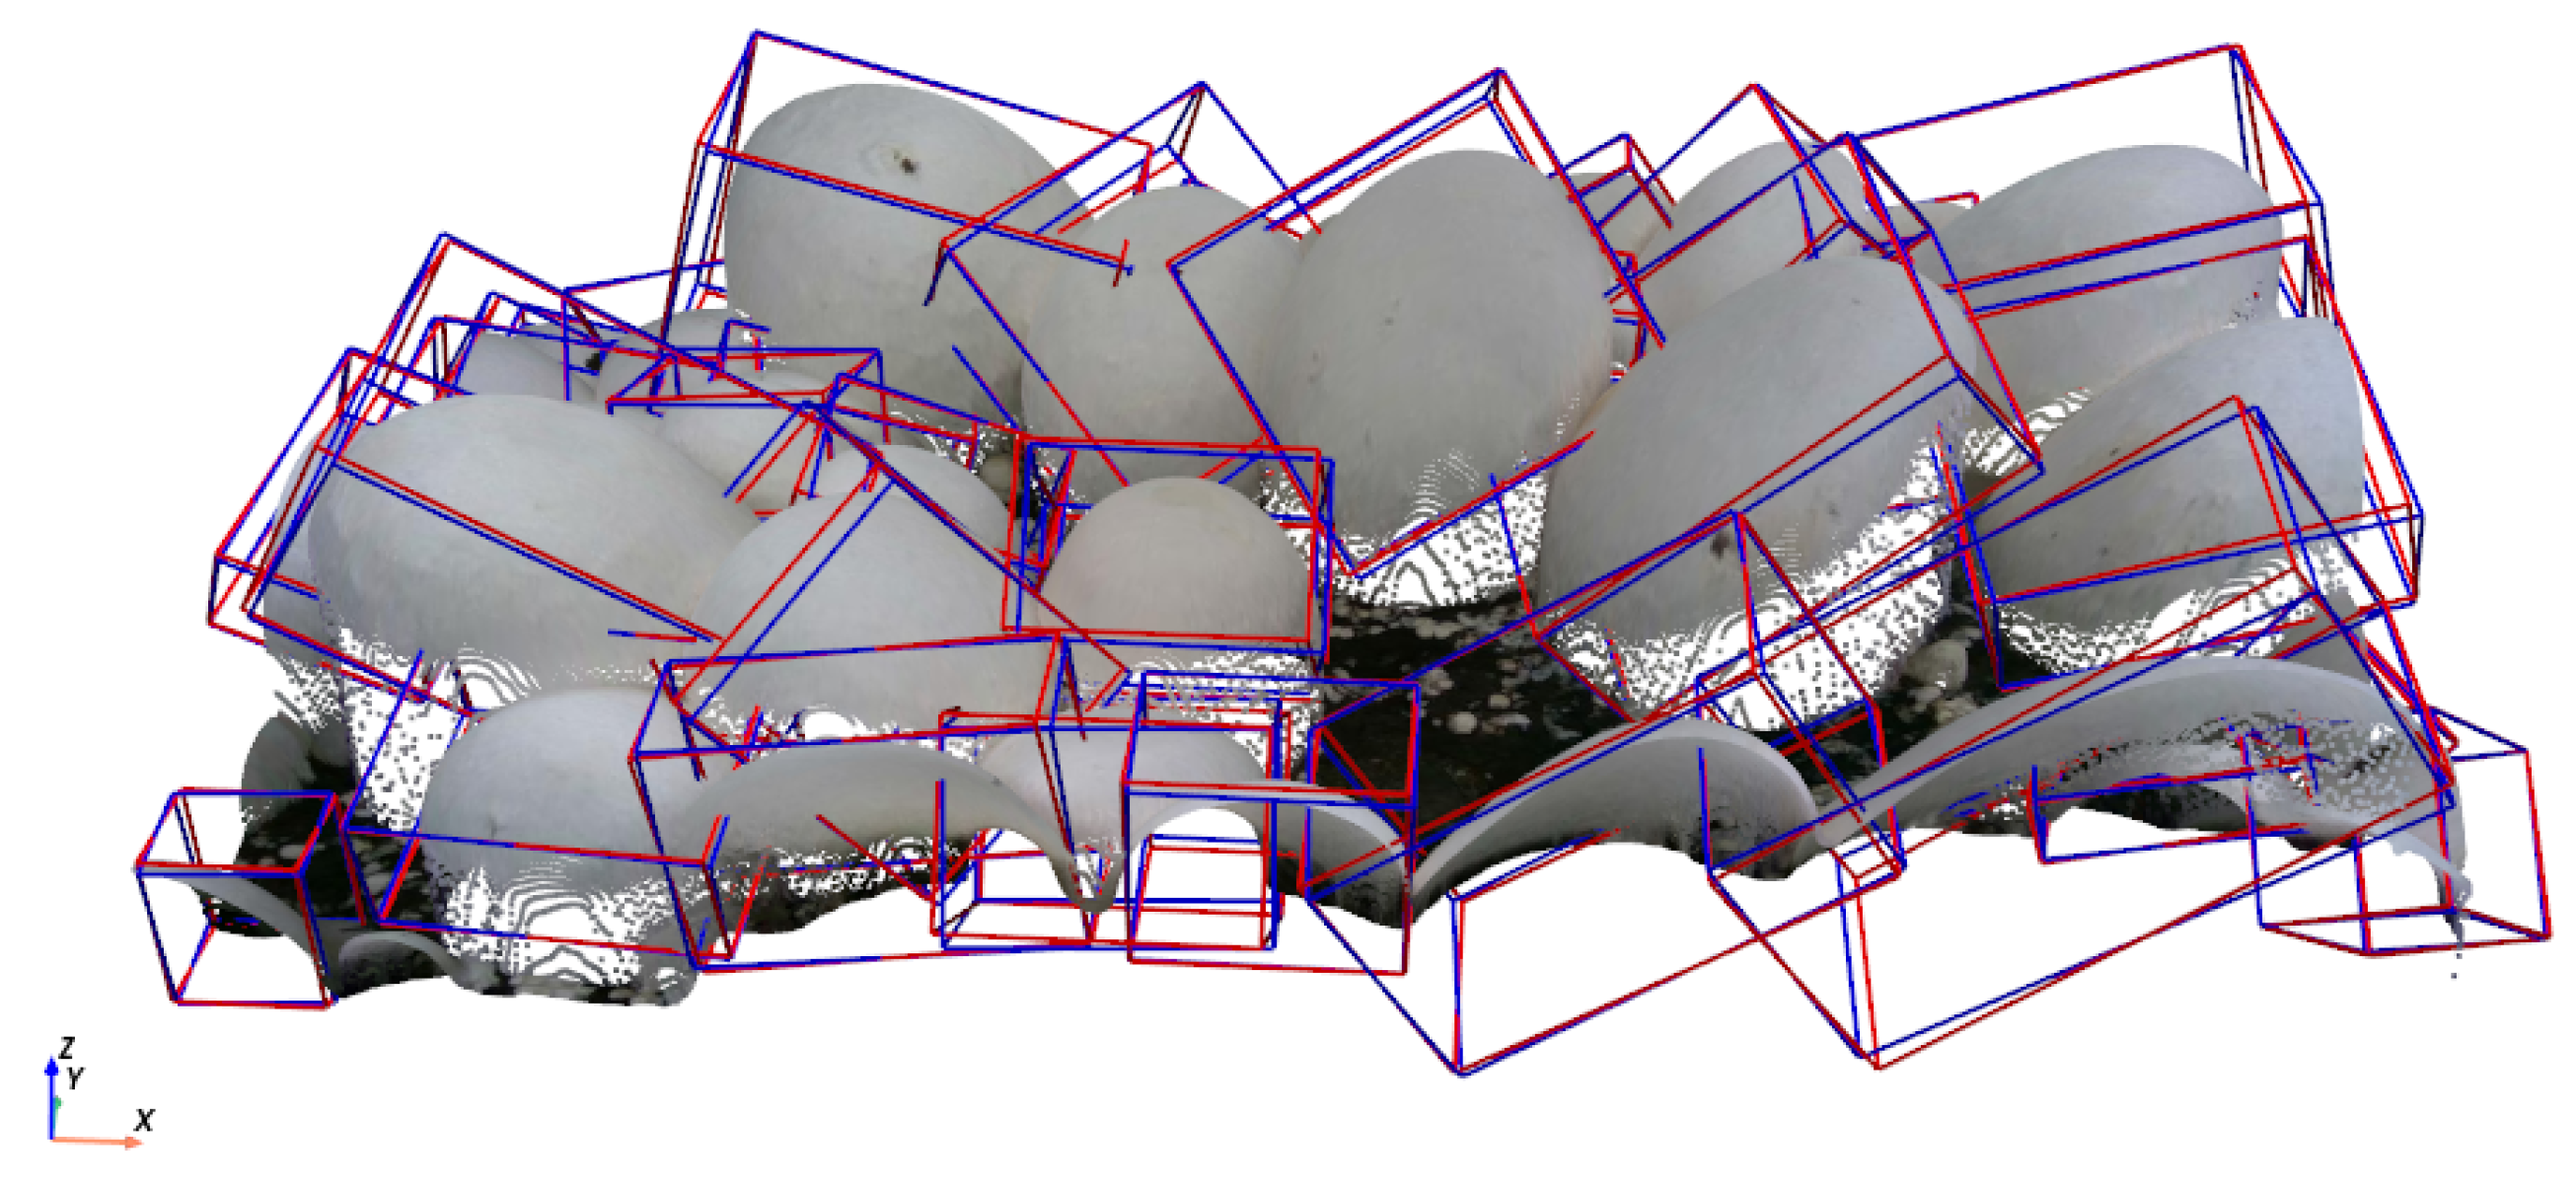
4.3.2. Qualitative Results

Figure 12 provides a visual comparison of ground-truth versus predicted oriented bounding boxes on one of these newly annotated real images. The predictions closely match the ground-truth orientations, suggesting that, despite the domain gap between synthetic and real data, the model successfully captures the poses of mushrooms in real-world scenes.
Figure 12. Visualization of ground truth (blue) vs. predicted (red) oriented bounding boxes on real-world point clouds from the M18K dataset (10 labeled images).
These results underscore the value of our synthetic dataset in enhancing model performance and facilitating the development of computer vision applications in the mushroom industry. They also demonstrate that the pose estimation component, though trained on synthetic data, achieves a compelling performance on real mushroom images, both qualitatively and quantitatively (3.68 degrees of average rotational error).

5. Discussion

The experimental results demonstrate the effectiveness of our proposed synthetic dataset and pose estimation model for applications in the mushroom industry. By achieving an average rotational error of 1.67 ° on our synthetic dataset, our method significantly outperforms state-of-the-art approaches, which reported errors ranging from 4.22 ° to 13.5 ° [2,17,27]. This substantial improvement highlights the robustness and precision of our model in estimating mushroom poses.
The ablation studies provide valuable insights into the factors influencing model performance and guide the selection of optimal configurations. The investigation into the number of sampled points revealed that increasing the point cloud density enhances the model’s ability to capture the geometric details essential for accurate pose estimation. Using 1024 points strikes a balance between performance and computational efficiency, offering sufficient detail without incurring excessive processing time.
The comparison of rotation representations highlighted the superiority of the 6D Gram–Schmidt method. Its continuity and avoidance of singularities make it well suited for neural network training. The limitations of Euler angles, such as discontinuities and gimbal lock, and the ambiguity inherent in quaternions between q and q adversely affect model convergence and accuracy. The 6D representation addresses these issues, leading to more stable and precise rotation predictions, which contributed to outperforming existing methods.
Including RGB information in the point cloud did not significantly improve the model’s performance. This outcome suggests that the geometric structure of the mushrooms, as captured by the spatial coordinates, is the primary determinant of pose estimation accuracy in our context. The color information may not provide the additional discriminative features necessary for orientation estimation, or the network may require a different architecture to leverage such data effectively.
To evaluate our model in real-world conditions, we tested it on a set of 10 images (330 mushrooms) from the M18K dataset, where we labeled the 3D oriented bounding box rotations. On this real subset, the model achieved a mean angle difference of 3.68 ° , indicating that the pose estimation component, trained entirely on synthetic data, generalizes well to real mushroom images. Nonetheless, a gap remains between the model’s performance on synthetic data (1.67 ° ) and that on real data (3.68 ° ), underscoring the potential benefits of acquiring additional real-world annotations or improving domain adaptation techniques.
While our synthetic dataset closely approximates real-world conditions, it may not capture all variations present in diverse mushroom cultivation environments. Factors such as lighting differences, extreme occlusions, and diverse sensor noise characteristics in real-world data can still impact performance. Expanding the annotated real dataset beyond the current subset of 10 images would enable a more comprehensive quantitative assessment and potentially guide further improvements.
Future work should focus on bridging the domain gap further by incorporating domain adaptation techniques or generating synthetic data that more closely mimic real-world sensor characteristics. Acquiring a larger set of annotated real-world data for fine-tuning could also enhance model performance. Expanding the dataset to include more mushroom species and varying environmental conditions would improve the model’s robustness and applicability across different cultivation setups. Additionally, implementing the pose estimation algorithm in a robotic system and evaluating its impact on automated harvesting performance will shed light on how accurate the orientation estimates need to be to meet industrial requirements.

6. Conclusions

In this paper, we presented a comprehensive synthetic dataset generation pipeline and a two-stage pose estimation pipeline tailored for the mushroom industry. By leveraging high-definition 3D scans of mushrooms and realistic soil textures, we generated 40,000 unique scenes that accurately reflect real-world cultivation environments. Our data generation process accounts for natural growth patterns, including clustering and variability in size and orientation.
The proposed pose estimation model combines 2D object detection and instance segmentation with a point cloud-based orientation estimation network. Through extensive experiments, we demonstrated that using a 6D rotation representation with the Gram–Schmidt process and processing 1024 points without RGB information yields the best performance. The Point Transformer backbone effectively captures both local and global geometric features, enabling accurate pose estimation even in complex scenes.
Our method achieved an average rotational error of 1.67 ° on synthetic data, significantly outperforming state-of-the-art methods in mushroom 3D pose estimation. When evaluated on 10 labeled real images from the M18K dataset, the model achieved a mean angle difference of 3.68 ° , showcasing its ability to generalize to real-world conditions despite being trained on synthetic data alone. This level of precision is crucial for applications such as automated harvesting, where accurate orientation information directly impacts the effectiveness of robotic manipulators.
Applying the model to these real-world images further underscores its potential for practical applications such as automated harvesting, growth monitoring, and quality assessment. The results indicate that our synthetic dataset serves as a valuable resource for training models in scenarios where real-world annotated data are limited.
Our work addresses key challenges in developing computer vision systems for the mushroom industry and contributes a significant dataset and methodology for future research. By continuing to refine the models and dataset, we aim to facilitate the adoption of automation technologies that enhance productivity, efficiency, and product quality in mushroom cultivation. Future efforts will focus on expanding the dataset to encompass more varieties and conditions, as well as integrating domain adaptation techniques to further bridge the gap between synthetic and real-world data. Additionally, evaluating the algorithm’s performance in a real robotic harvesting setup will provide insights into how to meet operational requirements in industrial mushroom production.

Author Contributions

Conceptualization, A.Z., D.B. and F.A.M.; methodology, A.Z.; software, A.Z., J.K.; validation, A.Z., B.K. and J.K.; formal analysis, A.Z., F.A.M. and D.B.; investigation, A.Z.; resources, W.Z., V.B. and F.A.M.; data curation, A.Z.; writing—original draft preparation, A.Z.; writing—review and editing, B.K., J.K., V.B., W.Z., D.B. and F.A.M.; visualization, A.Z.; supervision, F.A.M., D.B., V.B. and W.Z.; project administration, F.A.M. and W.Z.; funding acquisition, W.Z. All authors have read and agreed to the published version of the manuscript.

Funding

The work was partially supported by the United States Department of Agriculture grants #2021-67022-34889, 2022-67022-37867, and 2023-51300-40853, as well as the University of Houston Infrastructure Grant.

Data Availability Statement

The dataset and code supporting the findings of this study are publicly available at our GitHub repository: https://github.com/abdollahzakeri/sms3d, accessed on 27 March 2025.

Acknowledgments

We would like to acknowledge Kenneth Wood, Armando Juarez, and Bruce Knobeloch from Monterey Mushroom Inc. for allowing us to visit and obtain the necessary information from the mushroom farm in Madisonville, TX, USA.

Conflicts of Interest

The authors declare no conflicts of interest.

References

  1. Anagnostopoulou, D.; Retsinas, G.; Efthymiou, N.; Filntisis, P.; Maragos, P. A Realistic Synthetic Mushroom Scenes Dataset. In Proceedings of the 2023 IEEE/CVF Conference on Computer Vision and Pattern Recognition Workshops (CVPRW), Vancouver, BC, Canada, 17–24 June 2023. [Google Scholar] [CrossRef]
  2. Retsinas, G.; Efthymiou, N.; Maragos, P. Mushroom Segmentation and 3D Pose Estimation From Point Clouds Using Fully Convolutional Geometric Features and Implicit Pose Encoding. In Proceedings of the IEEE/CVF Conference on Computer Vision and Pattern Recognition, Vancouver, BC, Canada, 17–24 June 2023. [Google Scholar]
  3. Wee, B.S.; Chin, C.S.; Sharma, A. Survey of Mushroom Harvesting Agricultural Robots and Systems Design. IEEE Trans. Agrifood Electron. 2024, 2, 59–80. [Google Scholar] [CrossRef]
  4. Qian, Y.; Jiacheng, R.; Pengbo, W.; Zhan, Y.; Changxing, G. Real-time detection and localization using SSD method for oyster mushroom picking robot. In Proceedings of the 2020 IEEE International Conference on Real-Time Computing and Robotics (RCAR), Asahikawa, Japan, 28–29 September 2020; pp. 158–163. [Google Scholar] [CrossRef]
  5. Yang, S.; Zhang, J.; Yuan, J. A High-Accuracy Contour Segmentation and Reconstruction of a Dense Cluster of Mushrooms Based on Improved SOLOv2. Agriculture 2024, 14, 1646. [Google Scholar] [CrossRef]
  6. Shi, C.; Mo, Y.; Ren, X.; Nie, J.; Zhang, C.; Yuan, J.; Zhu, C. Improved Real-Time Models for Object Detection and Instance Segmentation for Agaricus bisporus Segmentation and Localization System Using RGB-D Panoramic Stitching Images. Agriculture 2024, 14, 735. [Google Scholar] [CrossRef]
  7. Zakeri, A.; Fawakherji, M.; Kang, J.; Koirala, B.; Balan, V.; Zhu, W.; Benhaddou, D.; Merchant, F.A. M18K: A Comprehensive RGB-D Dataset and Benchmark for Mushroom Detection and Instance Segmentation. arXiv 2024, arXiv:cs.CV/2407.11275. [Google Scholar]
  8. Károly, A.I.; Galambos, P. Automated Dataset Generation with Blender for Deep Learning-based Object Segmentation. In Proceedings of the 2022 IEEE 20th Jubilee World Symposium on Applied Machine Intelligence and Informatics (SAMI), Poprad, Slovakia, 2–5 March 2022. [Google Scholar] [CrossRef]
  9. Cieslak, M.; Govindarajan, U.; Garcia, A.; Chandrashekar, A.; Hädrich, T.; Mendoza-Drosik, A.; Michels, D.L.; Pirk, S.; Fu, C.C.; Pałubicki, W. Generating Diverse Agricultural Data for Vision-Based Farming Applications. In Proceedings of the 2024 IEEE/CVF Conference on Computer Vision and Pattern Recognition Workshops (CVPRW), Seattle, WA, USA, 17–18 June 2024. [Google Scholar] [CrossRef]
  10. Gao, G.; Lauri, M.; Wang, Y.; Hu, X.; Zhang, J.; Frintrop, S. 6D Object Pose Regression via Supervised Learning on Point Clouds. In Proceedings of the 2020 IEEE International Conference on Robotics and Automation (ICRA), Paris, France, 31 May–31 August 2020. [Google Scholar] [CrossRef]
  11. Qi, C.R.; Yi, L.; Su, H.; Guibas, L.J. PointNet++: Deep hierarchical feature learning on point sets in a metric space. In Proceedings of the 31st International Conference on Neural Information Processing Systems, Red Hook, NY, USA, 4–9 December 2017. NIPS’17. [Google Scholar]
  12. Dang, Z.; Wang, L.; Guo, Y.; Salzmann, M. Learning-Based Point Cloud Registration for 6D Object Pose Estimation in the Real World. In Proceedings of the Computer Vision–ECCV 2022; Avidan, S., Brostow, G., Cissé, M., Farinella, G.M., Hassner, T., Eds.; Springer: Cham, Germany, 2022. [Google Scholar] [CrossRef]
  13. Chen, W.; Duan, J.; Basevi, H.; Chang, H.J.; Leonardis, A. PointPoseNet: Point Pose Network for Robust 6D Object Pose Estimation. In Proceedings of the IEEE/CVF Winter Conference on Applications of Computer Vision, Snowmass Village, CO, USA, 1–5 March 2020. [Google Scholar]
  14. Charles, R.Q.; Su, H.; Kaichun, M.; Guibas, L.J. PointNet: Deep Learning on Point Sets for 3D Classification and Segmentation. In Proceedings of the IEEE Conference on Computer Vision and Pattern Recognition, Honolulu, HI, USA, 21–26 July 2017. [Google Scholar] [CrossRef]
  15. Zhao, H.; Jiang, L.; Jia, J.; Torr, P.H.; Koltun, V. Point Transformer. In Proceedings of the IEEE/CVF International Conference on Computer Vision (ICCV), Montreal, BC, Canada, 10–17 October 2021; pp. 16259–16268. [Google Scholar]
  16. Soltan, S.; Oleinikov, A.; Demirci, M.F.; Shintemirov, A. Deep Learning-Based Object Classification and Position Estimation Pipeline for Potential Use in Robotized Pick-and-Place Operations. Robotics 2020, 9, 63. [Google Scholar] [CrossRef]
  17. Baisa, N.L.; Al-Diri, B. Mushrooms Detection, Localization and 3D Pose Estimation using RGB-D Sensor for Robotic-picking Applications. arXiv 2022. [Google Scholar] [CrossRef]
  18. Mavridis, P.; Mavrikis, N.; Mastrogeorgiou, A.; Chatzakos, P. Low-cost, accurate robotic harvesting system for existing mushroom farms. In Proceedings of the 2023 IEEE/ASME International Conference on Advanced Intelligent Mechatronics (AIM), Seattle, WA, USA, 27 June–1 July 2023. [Google Scholar] [CrossRef]
  19. Lin, A.; Liu, Y.; Zhang, L. Mushroom Detection and Positioning Method Based on Neural Network. In Proceedings of the 2021 IEEE 5th Advanced Information Technology, Electronic and Automation Control Conference (IAEAC), Chongqing, China, 12–14 March 2021; Volume 5, pp. 1174–1178. [Google Scholar] [CrossRef]
  20. Development of a Compact Hybrid Gripper for Automated Harvesting of White Button Mushroom. Volume 7: 48th Mechanisms and Robotics Conference (MR). In Proceedings of the International Design Engineering Technical Conferences and Computers and Information in Engineering Conference, Washington, DC, USA, 25–28 August 2024; Available online: https://asmedigitalcollection.asme.org/IDETC-CIE/proceedings-pdf/IDETC-CIE2024/88414/V007T07A036/7403466/v007t07a036-detc2024-143056.pdf (accessed on 31 January 2025). [CrossRef]
  21. Koirala, B.; Kafle, A.; Nguyen, H.C.; Kang, J.; Zakeri, A.; Balan, V.; Merchant, F.; Benhaddou, D.; Zhu, W. A Hybrid Three-Finger Gripper for Automated Harvesting of Button Mushrooms. Actuators 2024, 13, 287. [Google Scholar] [CrossRef]
  22. Koirala, B.; Zakeri, A.; Kang, J.; Kafle, A.; Balan, V.; Merchant, F.A.; Benhaddou, D.; Zhu, W. Robotic Button Mushroom Harvesting Systems: A Review of Design, Mechanism, and Future Directions. Appl. Sci. 2024, 14, 9229. [Google Scholar] [CrossRef]
  23. Zhou, Y.; Barnes, C.; Lu, J.; Yang, J.; Li, H. On the Continuity of Rotation Representations in Neural Networks. In Proceedings of the IEEE/CVF Conference on Computer Vision and Pattern Recognition, Long Beach, CA, USA, 15–20 June 2019. [Google Scholar]
  24. Perlin, K. An Image Synthesizer; ACM SIGGRAPH Computer Graphics: New York, NY, USA, 1985; Volume 19, pp. 287–296. [Google Scholar] [CrossRef]
  25. He, K.; Gkioxari, G.; Dollár, P.; Girshick, R. Mask R-CNN. In Proceedings of the 2017 IEEE International Conference on Computer Vision (ICCV), Venice, Italy, 22–29 October 2017; pp. 2980–2988. [Google Scholar] [CrossRef]
  26. Huynh, D.Q. Metrics for 3D Rotations: Comparison and Analysis. J. Math. Imaging Vis. 2009, 35, 155–164. [Google Scholar] [CrossRef]
  27. Retsinas, G.; Efthymiou, N.; Anagnostopoulou, D.; Maragos, P. Mushroom Detection and Three Dimensional Pose Estimation from Multi-View Point Clouds. Sensors 2023, 23, 3576. [Google Scholar] [CrossRef] [PubMed]
Disclaimer/Publisher’s Note: The statements, opinions and data contained in all publications are solely those of the individual author(s) and contributor(s) and not of MDPI and/or the editor(s). MDPI and/or the editor(s) disclaim responsibility for any injury to people or property resulting from any ideas, methods, instructions or products referred to in the content.

Article Metrics

Citations

Article Access Statistics

Multiple requests from the same IP address are counted as one view.