
Predicting Breast Cancer from Risk Factors Using SVM and Extra-Trees-Based Feature Selection Method

 ,
,  ,
,  , , and
Abstract
:1. Introduction
- (i)
- For the first time, we suggest a combined extra-trees and SVM technique for predicting breast cancer.
- (ii)
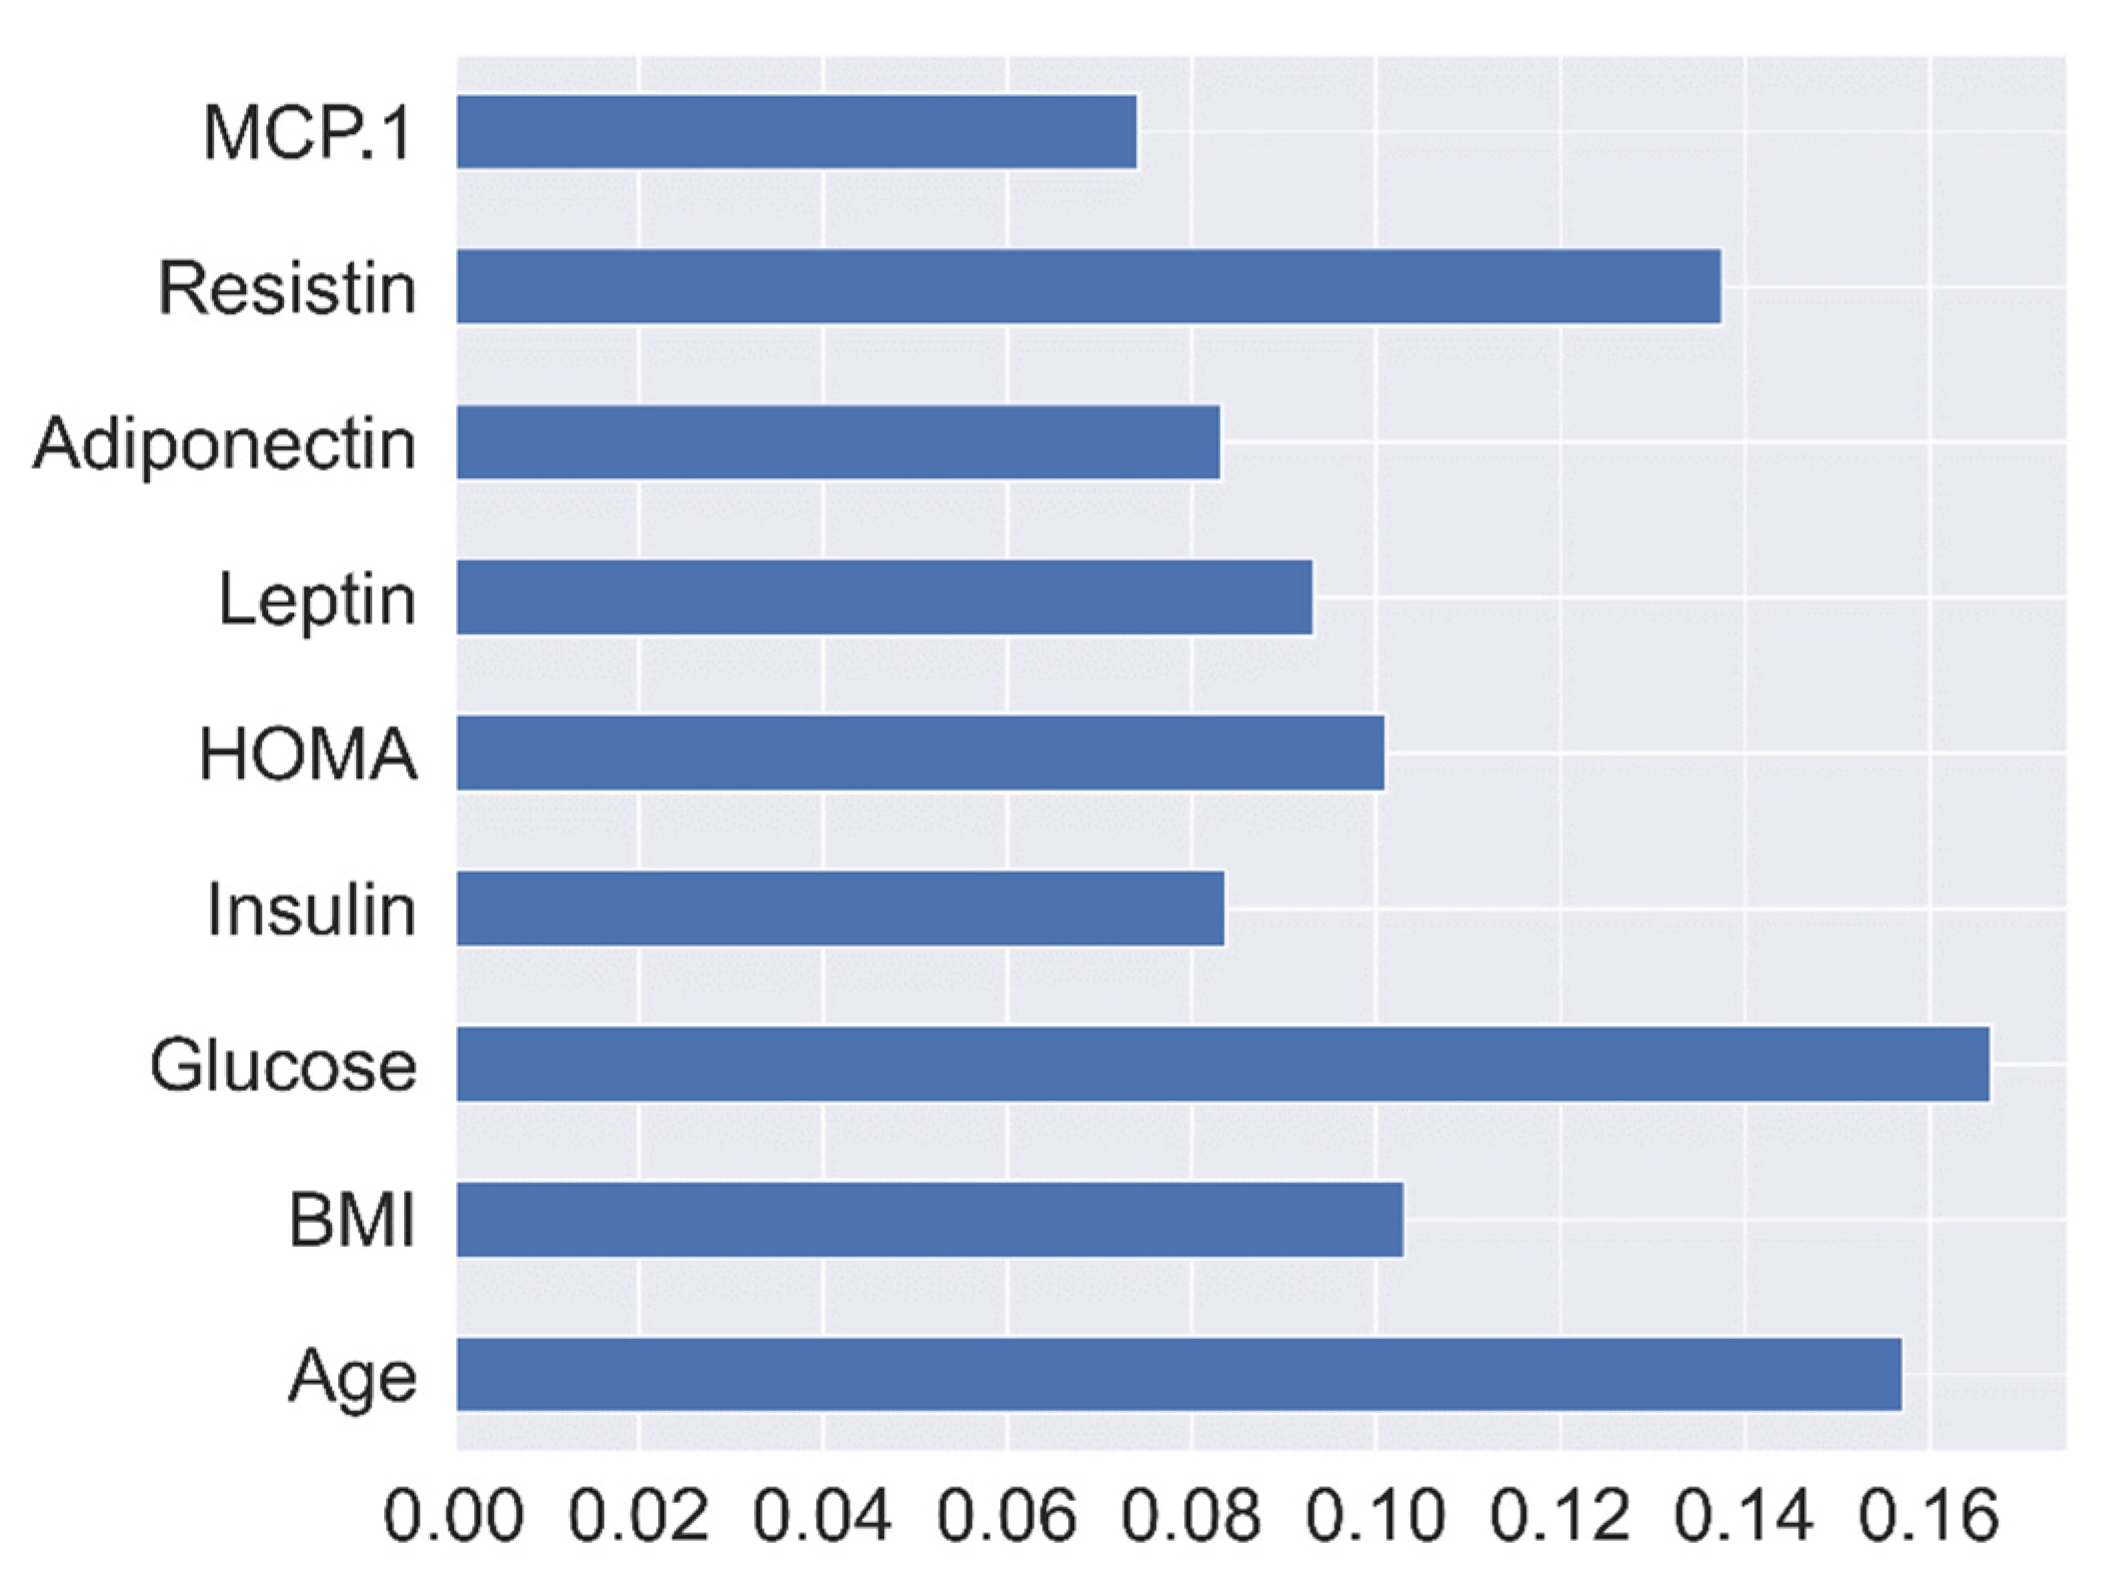
- By employing extra-trees to identify the most useful features, we enhanced the performance of the proposed model.
- (iii)
- We undertook in-depth experiments comparing the proposed model to other prediction models and findings from earlier research.
- (iv)
- We analyzed the effects of using extra-trees or not in the feature selection approach on the accuracy performance of the model.
- (v)
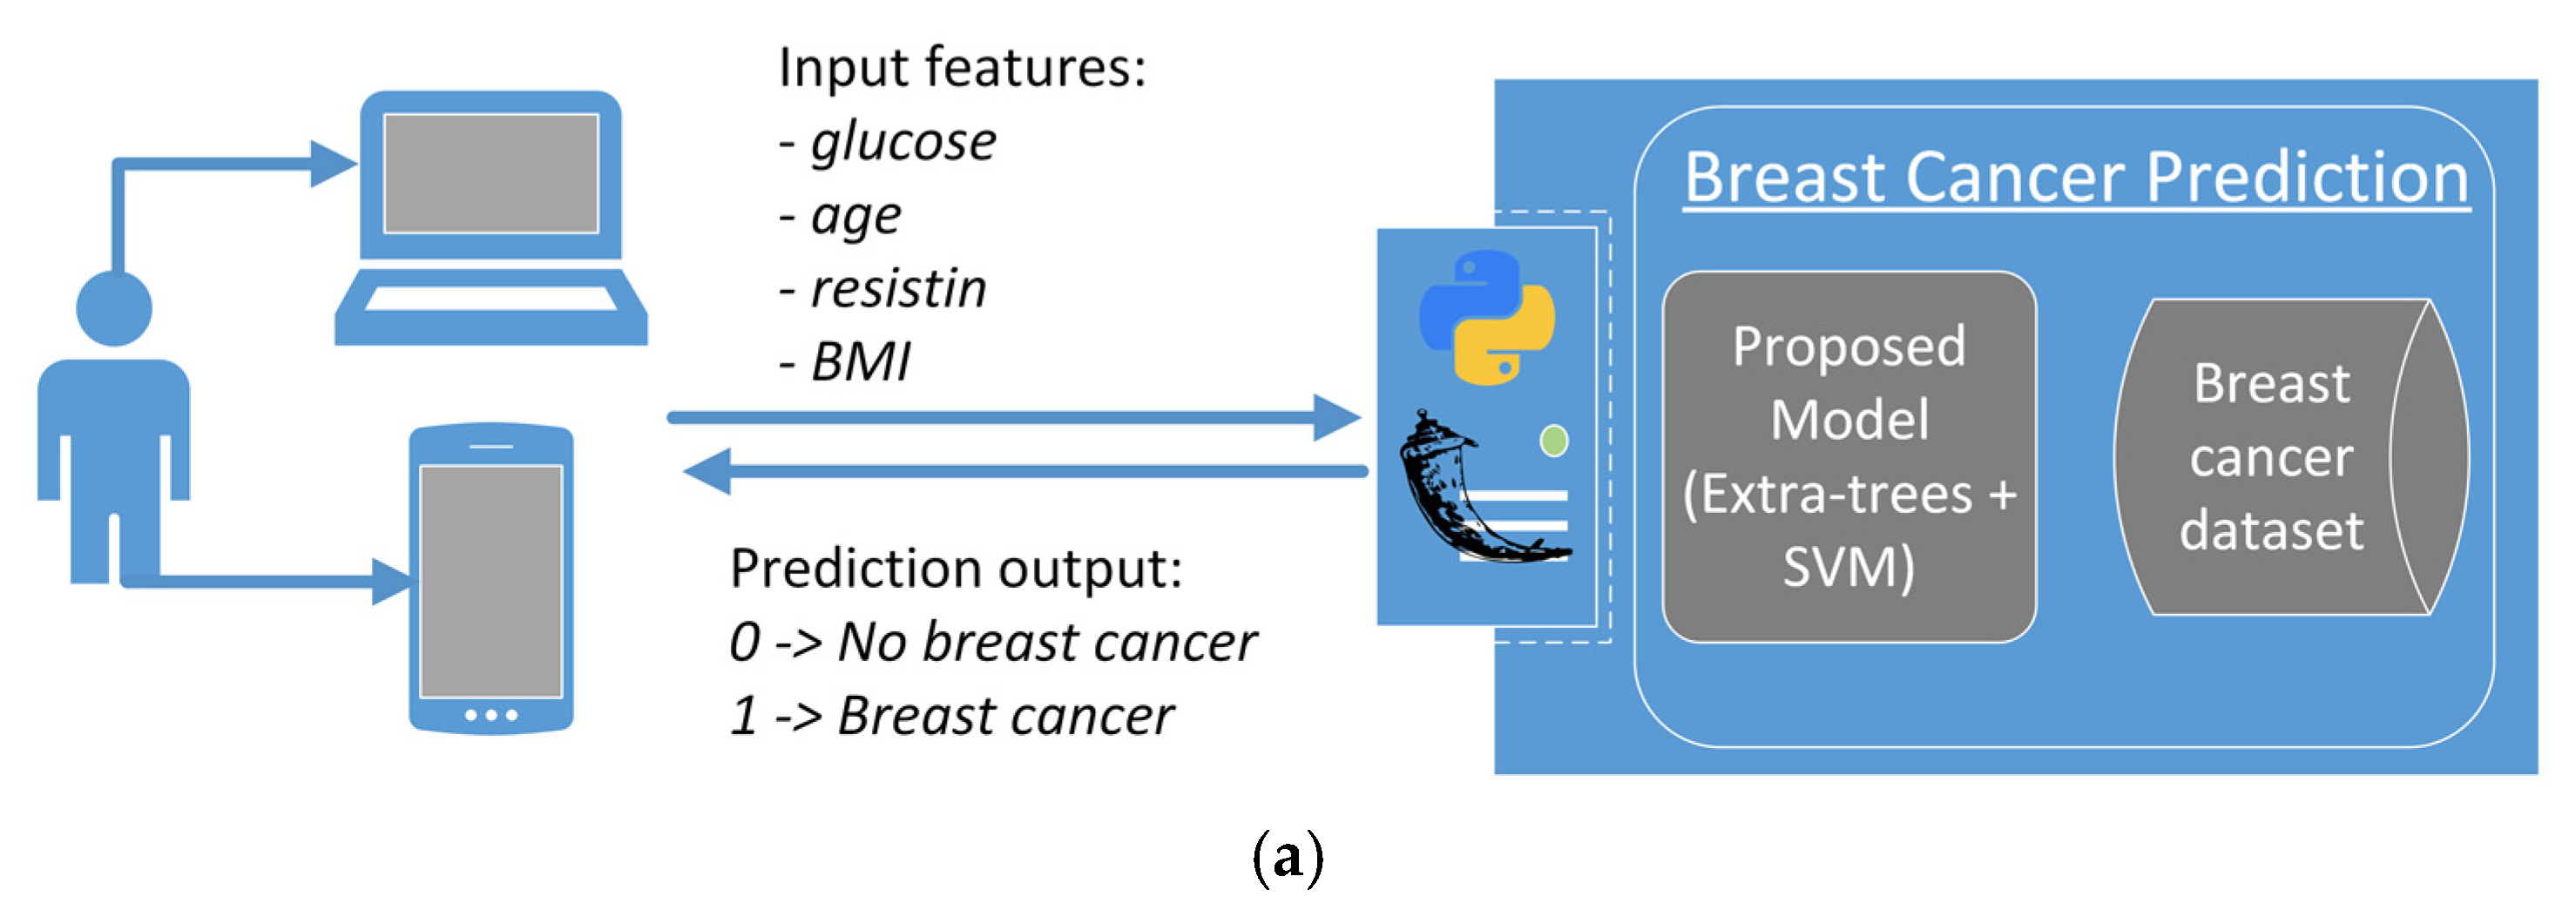
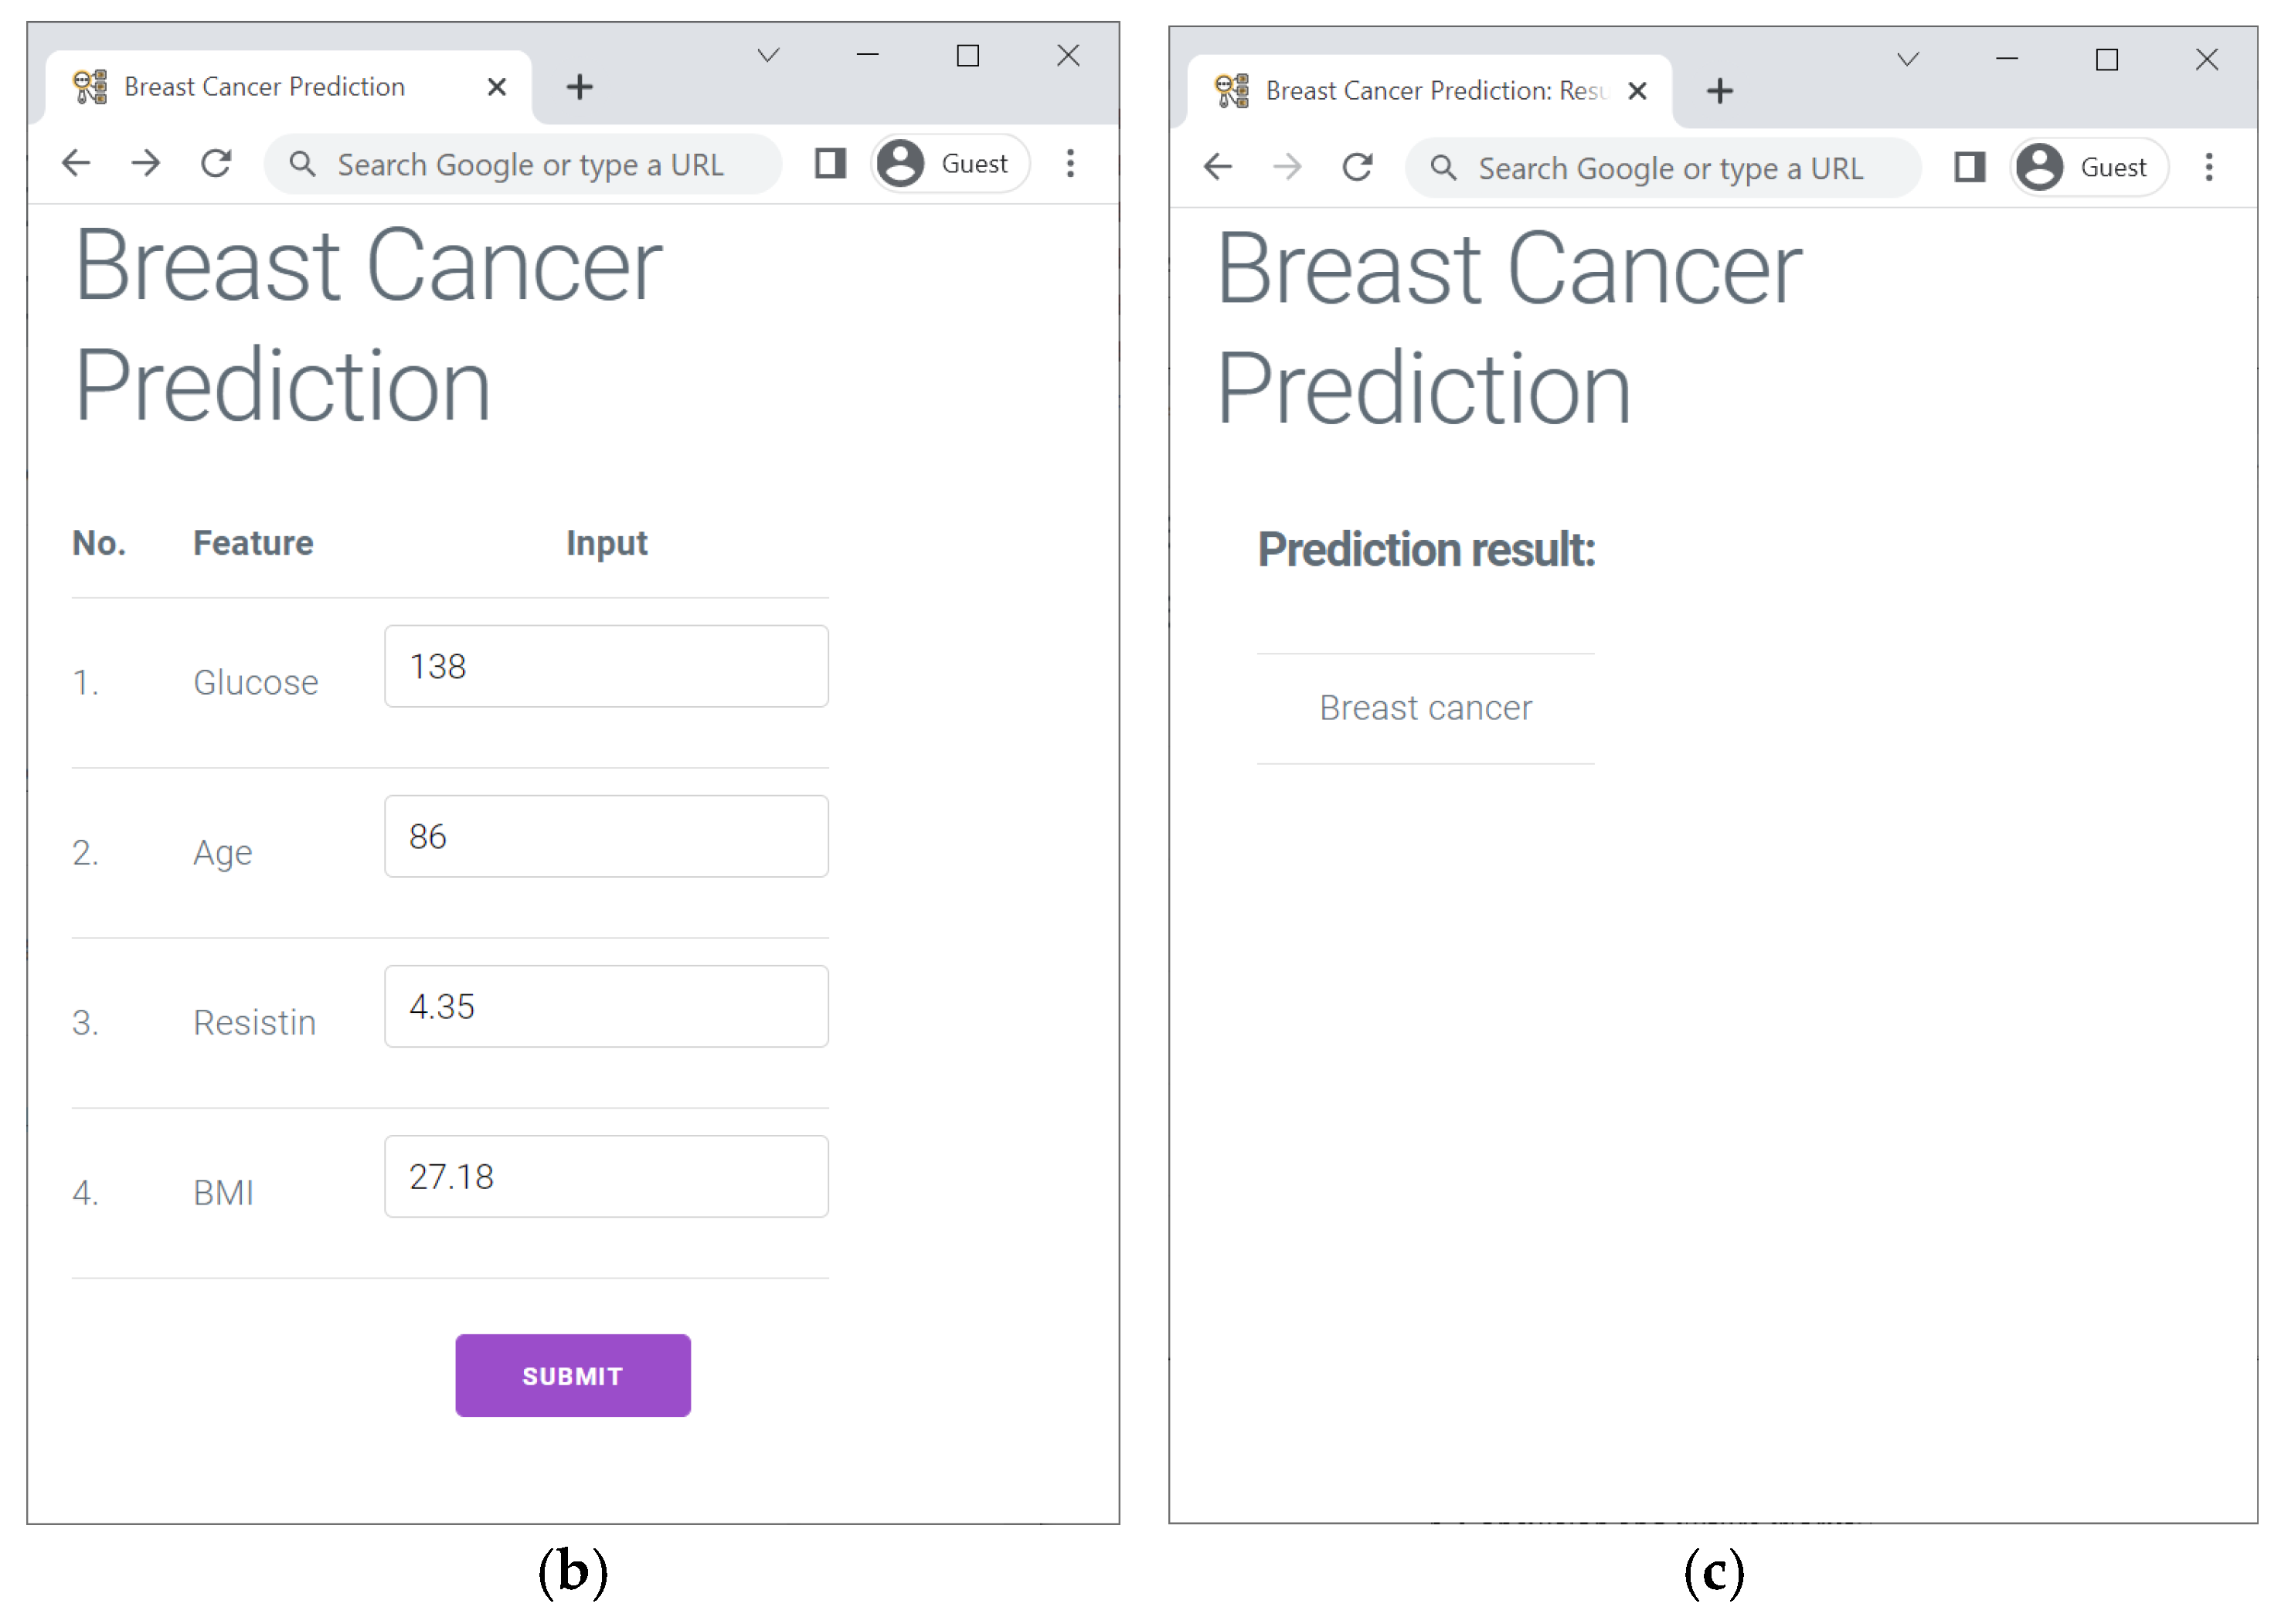
- Finally, we created a web-based breast cancer prediction tool to illustrate the viability of our model.
2. Related Works
3. Methodology
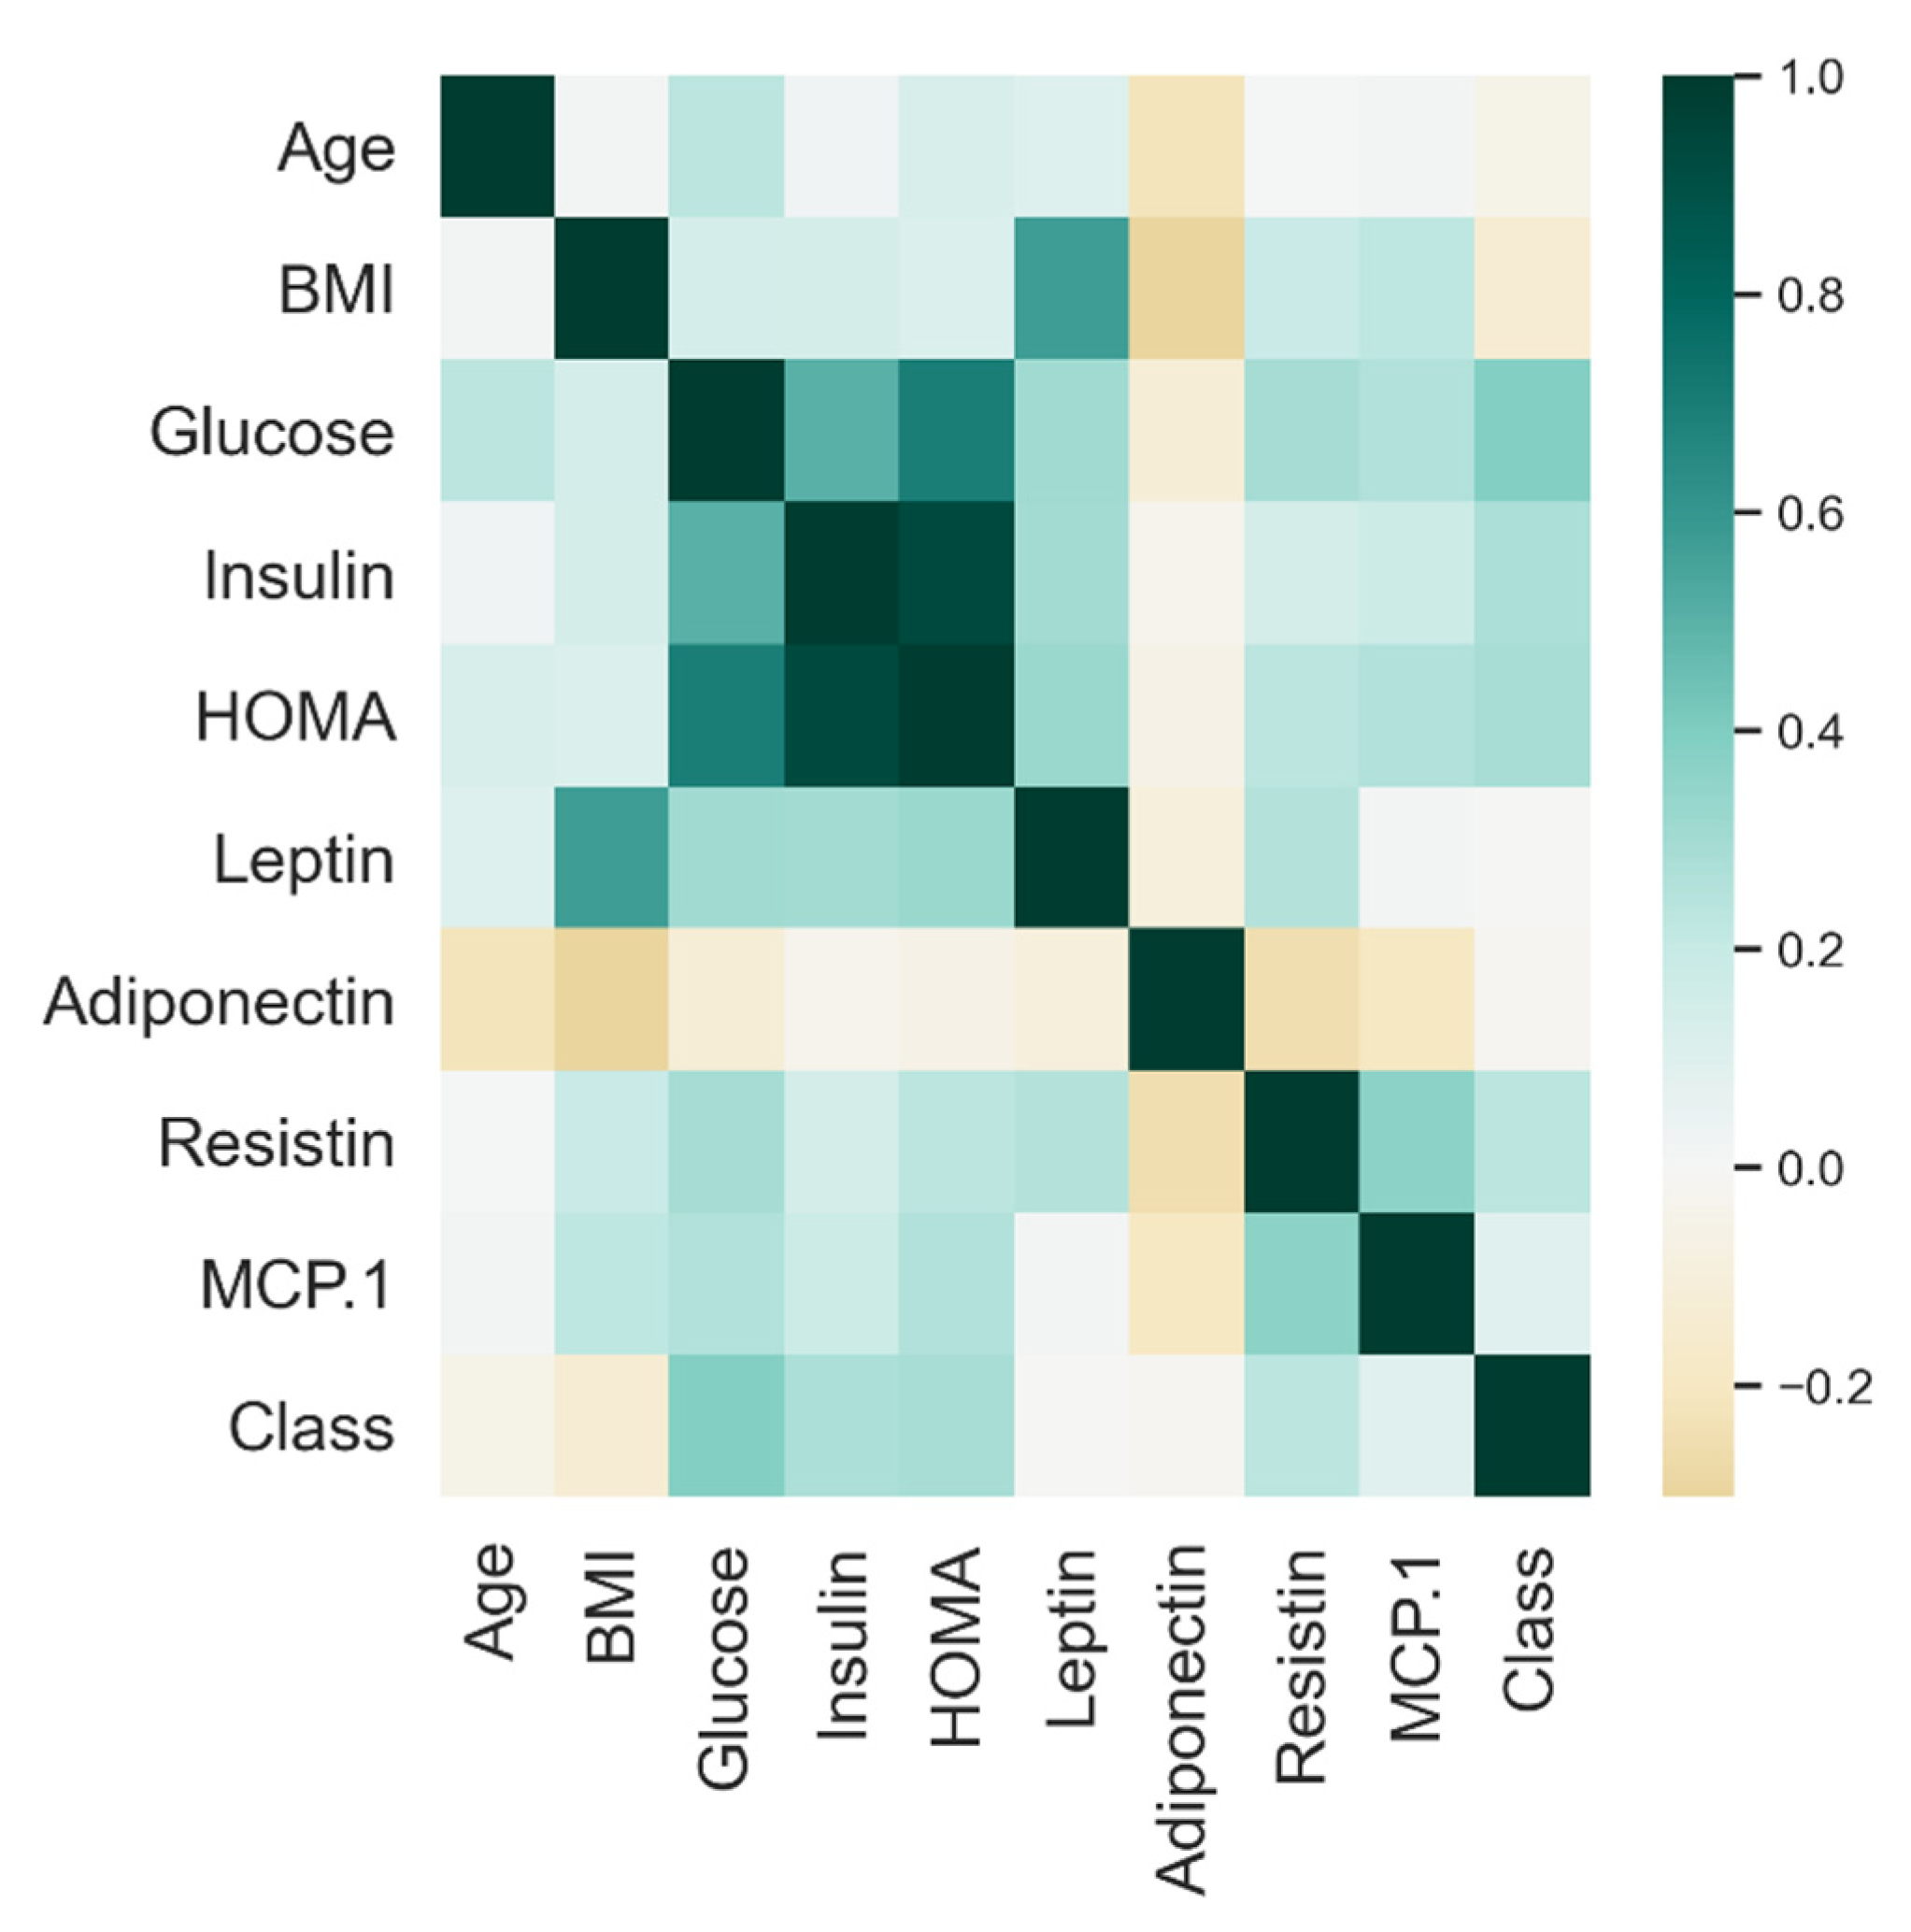
3.1. Dataset
3.2. Breast Cancer Prediction Model
3.3. Extra-Trees Feature Selection Method
3.4. SVM
4. Results and Discussions
4.1. Breast Cancer Model Performances
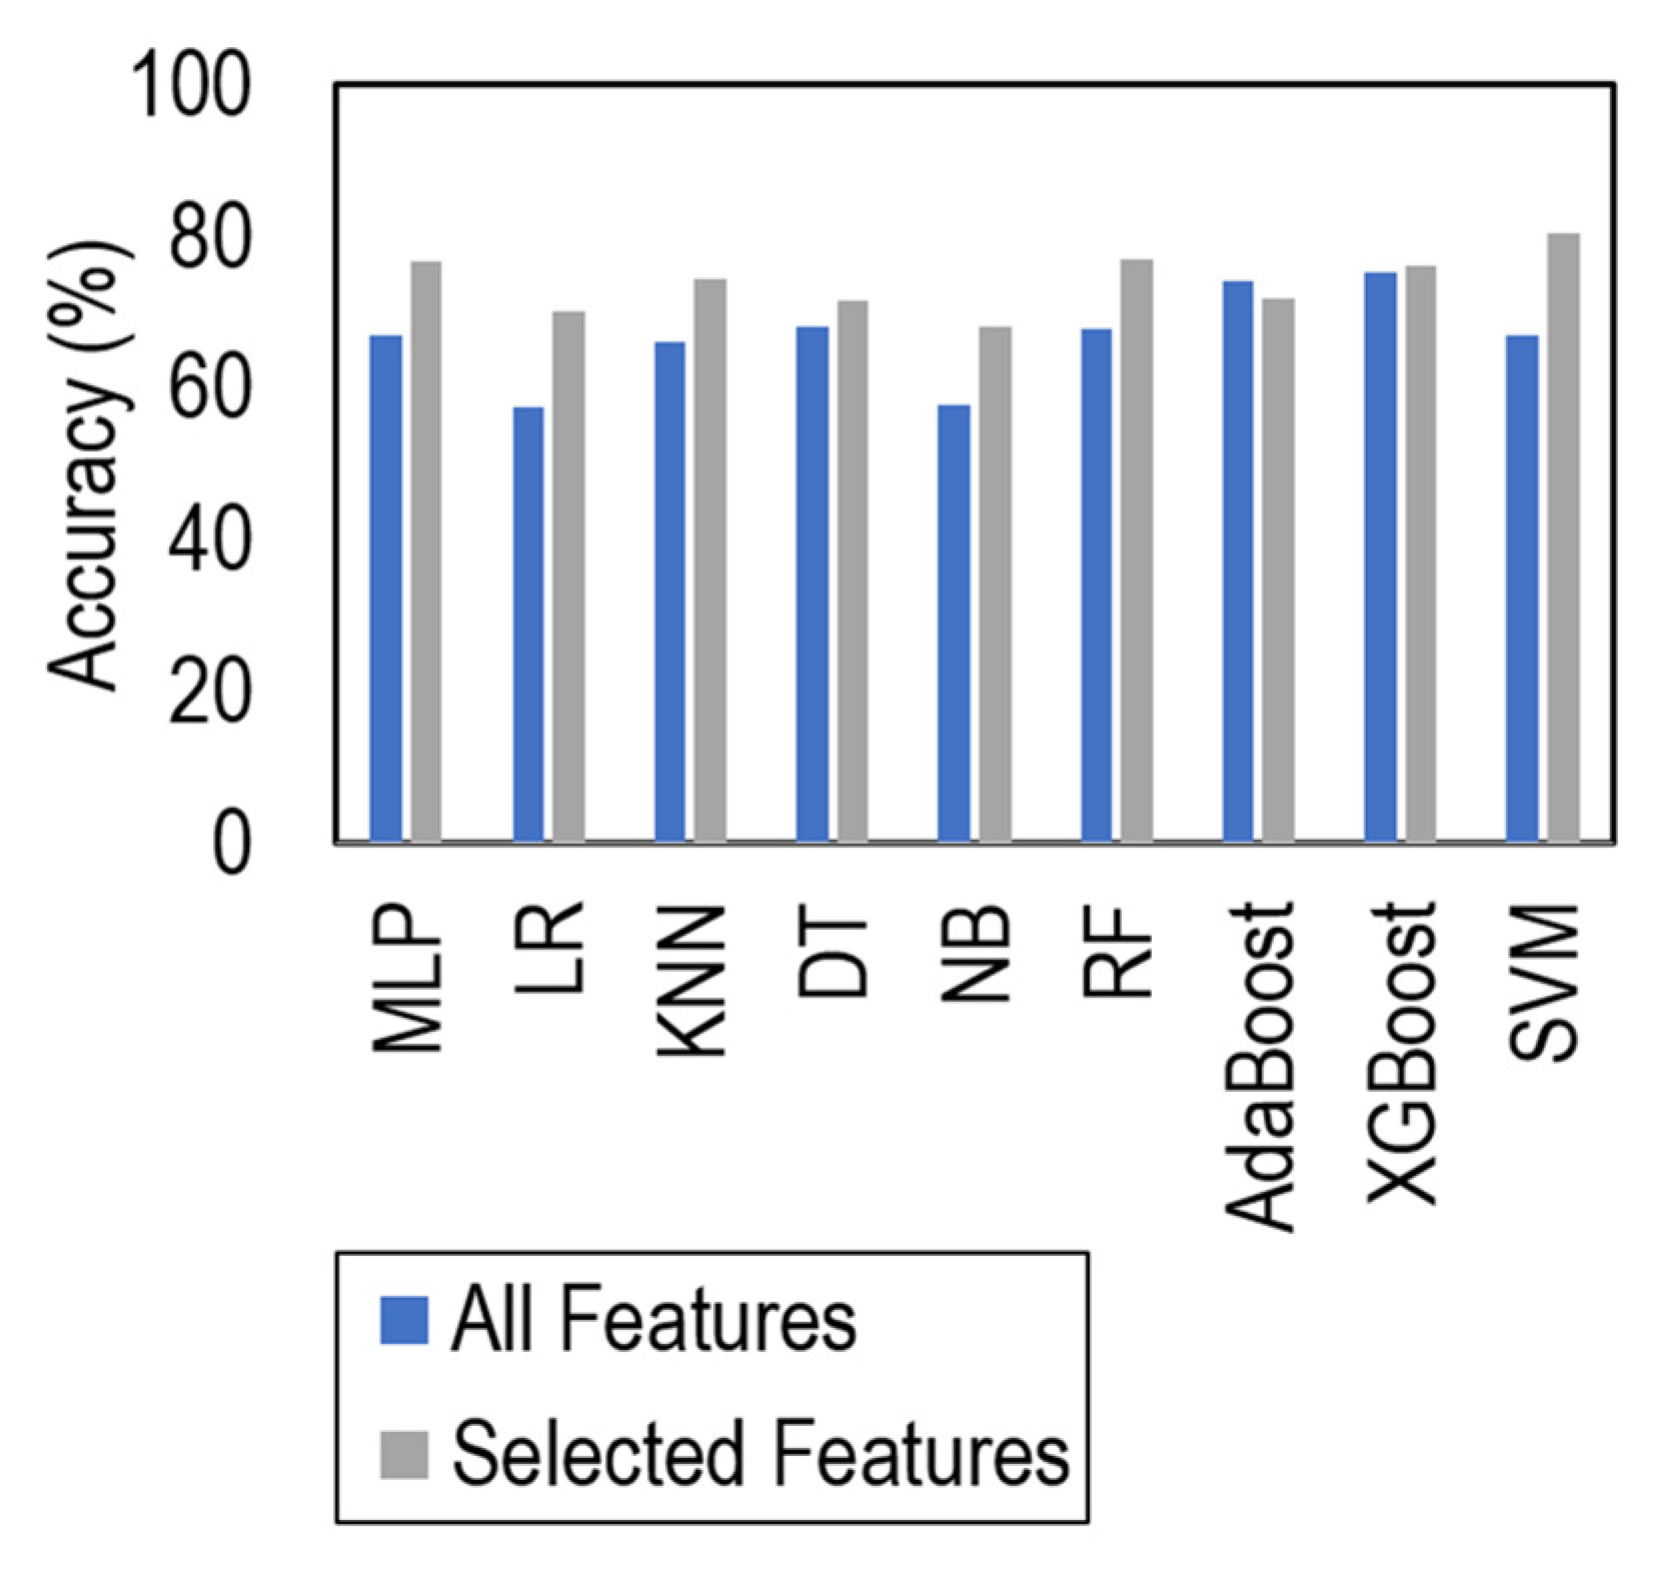
4.2. Impact Analysis of Extra-Trees-Based Feature Selection
4.3. Study Comparison with Earlier Works

| Author/Method | Feature Selection | Validation Method | Accuracy (%) | Practical Application |
|---|---|---|---|---|
| Ghani et al. (2019) [29]/ANN | RFE | Hold-out (70/30) | 80 | No |
| Khatun et al. (2021) [30]/MLP | - | Hold-out (80/20) | 85 | No |
| Nanglia et al. (2022) [14]/Ensemble model | Chi-square | 20-fold CV | 78 | No |
| Rasool et al. (2022) [31]/Polynomial SVM | RFE | Hold-out (80/20) | 76.42 | No |
| Our study/SVM and Extra-trees | Extra-trees | 10-fold stratified CV | 80.23 | Yes |
4.4. Management Implications
5. Conclusions and Future Works
Author Contributions
Funding
Data Availability Statement
Conflicts of Interest
Abbreviations
| Abbreviation | Definition |
| SVM | Support vector machine |
| Extra-trees | Extremely randomized trees classifier |
| CV | Cross-validation |
| AI | Artificial intelligence |
| ML | Machine learning |
| WHO | World Health Organization |
| WBCD | Wisconsin Breast Cancer dataset |
| CHUC | University Hospital Centre of Coimbra |
| LR | Logistic regression |
| CBCD | Coimbra Breast Cancer dataset |
| GNB | Gaussian naïve Bayes |
| BPNN | Back-propagation neural network |
| TP | True positive |
| KNN | K-nearest neighbor |
| V-CDNN | Voting convergent difference neural network |
| MLP | Multi-layer perceptron |
| CFS | Curvature-based feature selection |
| RF | Random forest |
| DT | Decision tree |
| NB | Naïve Bayes |
| TN | True negative |
| GBM | Gradient boosting method |
| BMI | Body mass index |
| ANN | Artificial neural network |
| RBF | Radial basis function |
| NLP | Natural language processing |
| WBC | White blood cell |
| ELM | Extreme learning machine |
| AUC | Area under the receiver operating characteristic curves |
| FN | False negative |
| HOMA | Homeostasis model assessment |
| FP | False positive |
| AdaBoost | Adaptive boosting |
| XGBoost | eXtreme Gradient Boosting |
| ROC | Receiver operating characteristic curve |
| RFE | Recursive features elimination |
References
- Alfian, G.; Syafrudin, M.; Fitriyani, N.L.; Anshari, M.; Stasa, P.; Svub, J.; Rhee, J. Deep Neural Network for Predicting Diabetic Retinopathy from Risk Factors. Mathematics 2020, 8, 1620. [Google Scholar] [CrossRef]
- Alfian, G.; Syafrudin, M.; Fitriyani, N.L.; Syaekhoni, M.A.; Rhee, J. Utilizing IoT-Based Sensors and Prediction Model for Health-Care Monitoring System. In Artificial Intelligence and Big Data Analytics for Smart Healthcare; Elsevier: Amsterdam, The Netherlands, 2021; pp. 63–80. ISBN 978-0-12-822060-3. [Google Scholar]
- Fitriyani, N.L.; Syafrudin, M.; Alfian, G.; Rhee, J. Development of Disease Prediction Model Based on Ensemble Learning Approach for Diabetes and Hypertension. IEEE Access 2019, 7, 144777–144789. [Google Scholar] [CrossRef]
- Fitriyani, N.L.; Syafrudin, M.; Alfian, G.; Fatwanto, A.; Qolbiyani, S.L.; Rhee, J. Prediction Model for Type 2 Diabetes Using Stacked Ensemble Classifiers. In Proceedings of the 2020 International Conference on Decision Aid Sciences and Application (DASA), Sakheer, Bahrain, 8–9 November 2020; pp. 399–402. [Google Scholar]
- Ferlay, J.; Soerjomataram, I.; Dikshit, R.; Eser, S.; Mathers, C.; Rebelo, M.; Parkin, D.M.; Forman, D.; Bray, F. Cancer incidence and mortality worldwide: Sources, methods and major patterns in GLOBOCAN 2012. Int. J. Cancer 2015, 136, E359–E386. [Google Scholar] [CrossRef] [PubMed]
- Breast Cancer. Available online: https://www.who.int/news-room/fact-sheets/detail/breast-cancer (accessed on 15 August 2021).
- Alkabban, F.M.; Ferguson, T. Breast Cancer. In StatPearls; StatPearls Publishing: Treasure Island, FL, USA, 2022. [Google Scholar]
- Hortobagyi, G.N.; de la Garza Salazar, J.; Pritchard, K.; Amadori, D.; Haidinger, R.; Hudis, C.A.; Khaled, H.; Liu, M.-C.; Martin, M.; Namer, M.; et al. The Global Breast Cancer Burden: Variations in Epidemiology and Survival. Clin. Breast Cancer 2005, 6, 391–401. [Google Scholar] [CrossRef] [PubMed]
- Akben, S. Determination of the Blood, Hormone and Obesity Value Ranges that Indicate the Breast Cancer, Using Data Mining Based Expert System. IRBM 2019, 40, 355–360. [Google Scholar] [CrossRef]
- Dalwinder, S.; Birmohan, S.; Manpreet, K. Simultaneous feature weighting and parameter determination of Neural Networks using Ant Lion Optimization for the classification of breast cancer. Biocybern. Biomed. Eng. 2019, 40, 337–351. [Google Scholar] [CrossRef]
- Zuo, Z.; Li, J.; Xu, H.; Al Moubayed, N. Curvature-based feature selection with application in classifying electronic health records. Technol. Forecast. Soc. Chang. 2021, 173, 121127. [Google Scholar] [CrossRef]
- Zhang, Z.; Chen, B.; Xu, S.; Chen, G.; Xie, J. A novel voting convergent difference neural network for diagnosing breast cancer. Neurocomputing 2021, 437, 339–350. [Google Scholar] [CrossRef]
- Austria, Y.D.; Lalata, J.-A.; Maria, L.B.S., Jr.; Goh, J.E.; Goh, M.L.; Vicente, H. Comparison of Machine Learning Algorithms in Breast Cancer Prediction Using the Coimbra Dataset. Int. J. Simul. Syst. Sci. Technol. 2019, 20, 23.1–23.8. [Google Scholar] [CrossRef]
- Nanglia, S.; Ahmad, M.; Khan, F.A.; Jhanjhi, N. An enhanced Predictive heterogeneous ensemble model for breast cancer prediction. Biomed. Signal Process. Control 2021, 72, 103279. [Google Scholar] [CrossRef]
- Akay, M.F. Support vector machines combined with feature selection for breast cancer diagnosis. Expert Syst. Appl. 2009, 36, 3240–3247. [Google Scholar] [CrossRef]
- Patrício, M.; Pereira, J.; Crisóstomo, J.; Matafome, P.; Gomes, M.; Seiça, R.; Caramelo, F. Using Resistin, glucose, age and BMI to predict the presence of breast cancer. BMC Cancer 2018, 18, 29. [Google Scholar] [CrossRef]
- Rahman, M.; Ghasemi, Y.; Suley, E.; Zhou, Y.; Wang, S.; Rogers, J. Machine Learning Based Computer Aided Diagnosis of Breast Cancer Utilizing Anthropometric and Clinical Features. IRBM 2020, 42, 215–226. [Google Scholar] [CrossRef]
- Alnowami, M.R.; Abolaban, F.A.; Taha, E. A Wrapper-Based Feature Selection Approach to Investigate Potential Biomarkers for Early Detection of Breast Cancer. J. Radiat. Res. Appl. Sci. 2022, 15, 104–110. [Google Scholar] [CrossRef]
- Nicula, B.; Dascalu, M.; Newton, N.N.; Orcutt, E.; McNamara, D.S. Automated Paraphrase Quality Assessment Using Language Models and Transfer Learning. Computers 2021, 10, 166. [Google Scholar] [CrossRef]
- Baby, D.; Devaraj, S.J.; Hemanth, J.; M, A.R.M. Leukocyte classification based on feature selection using extra trees classifier: A transfer learning approach. Turk. J. Electr. Eng. Comput. Sci. 2021, 29, 2742–2757. [Google Scholar] [CrossRef]
- Sharma, J.; Giri, C.; Granmo, O.-C.; Goodwin, M.; Sharma, J.; Giri, C.; Granmo, O.-C.; Goodwin, M. Multi-layer intrusion detection system with ExtraTrees feature selection, extreme learning machine ensemble, and softmax aggregation. EURASIP J. Inf. Secur. 2019, 2019, 15. [Google Scholar] [CrossRef]
- Breast Cancer Dataset. Available online: https://archive.ics.uci.edu/ml/datasets/Breast+Cancer+Coimbra (accessed on 1 June 2022).
- Guyon, I. Feature Extraction Foundations and Applications; Springer: Berlin, Germany, 2006; Volume 207, ISBN 9783540354871. [Google Scholar]
- Geurts, P.; Ernst, D.; Wehenkel, L. Extremely randomized trees. Mach. Learn. 2006, 63, 3–42. [Google Scholar] [CrossRef]
- Cortes, C.; Vapnik, V. Support-vector networks. Mach. Learn. 1995, 20, 273–297. [Google Scholar] [CrossRef]
- Pedregosa, F.; Varoquaux, G.; Gramfort, A.; Michel, V.; Thirion, B.; Grisel, O.; Blondel, M.; Prettenhofer, P.; Weiss, R.; Dubourg, V.; et al. Scikit-learn: Machine Learning in Python. J. Mach. Learn. Res. 2011, 12, 2825–2830. [Google Scholar]
- Bradley, A.P. The use of the area under the ROC curve in the evaluation of machine learning algorithms. Pattern Recognit. 1997, 30, 1145–1159. [Google Scholar] [CrossRef] [Green Version]
- Huang, J.; Ling, C. Using AUC and accuracy in evaluating learning algorithms. IEEE Trans. Knowl. Data Eng. 2005, 17, 299–310. [Google Scholar] [CrossRef]
- Ghani, M.U.; Alam, T.M.; Jaskani, F.H. Comparison of Classification Models for Early Prediction of Breast Cancer. In Proceedings of the 2019 International Conference on Innovative Computing (ICIC), Lahore, Pakistan, 9–10 November 2019; pp. 1–6. [Google Scholar]
- Khatun, T.; Utsho, M.M.R.; Islam, M.A.; Zohura, M.F.; Hossen, M.S.; Rimi, R.A.; Anni, S.J. Performance Analysis of Breast Cancer: A Machine Learning Approach. In Proceedings of the 2021 Third International Conference on Inventive Research in Computing Applications (ICIRCA), Coimbatore, India, 2–4 September 2021; pp. 1426–1434. [Google Scholar]
- Rasool, A.; Bunterngchit, C.; Tiejian, L.; Islam, R.; Qu, Q.; Jiang, Q. Improved Machine Learning-Based Predictive Models for Breast Cancer Diagnosis. Int. J. Environ. Res. Public Health 2022, 19, 3211. [Google Scholar] [CrossRef] [PubMed]
- Santos, M.S.; Soares, J.P.; Abreu, P.H.; Araujo, H.; Santos, J. Cross-Validation for Imbalanced Datasets: Avoiding Overoptimistic and Overfitting Approaches [Research Frontier]. IEEE Comput. Intell. Mag. 2018, 13, 59–76. [Google Scholar] [CrossRef]
- Alfian, G.; Syafrudin, M.; Ijaz, M.F.; Syaekhoni, M.A.; Fitriyani, N.L.; Rhee, J. A Personalized Healthcare Monitoring System for Diabetic Patients by Utilizing BLE-Based Sensors and Real-Time Data Processing. Sensors 2018, 18, 2183. [Google Scholar] [CrossRef] [PubMed]
- Fitriyani, N.L.; Syafrudin, M.; Alfian, G.; Rhee, J. HDPM: An Effective Heart Disease Prediction Model for a Clinical Decision Support System. IEEE Access 2020, 8, 133034–133050. [Google Scholar] [CrossRef]
- Krebs, J.; Negatsch, V.; Berg, C.; Aigner, A.; Opitz-Welke, A.; Seidel, P.; Konrad, N.; Voulgaris, A. Applicability of two violence risk assessment tools in a psychiatric prison hospital population. Behav. Sci. Law 2020, 38, 471–481. [Google Scholar] [CrossRef]
- Syafrudin, M.; Alfian, G.; Fitriyani, N.L.; Anshari, M.; Hadibarata, T.; Fatwanto, A.; Rhee, J. A Self-Care Prediction Model for Children with Disability Based on Genetic Algorithm and Extreme Gradient Boosting. Mathematics 2020, 8, 1590. [Google Scholar] [CrossRef]
- Yu, C.-S.; Lin, Y.-J.; Lin, C.-H.; Lin, S.-Y.; Wu, J.L.; Chang, S.-S. Development of an Online Health Care Assessment for Preventive Medicine: A Machine Learning Approach. J. Med. Internet Res. 2020, 22, e18585. [Google Scholar] [CrossRef]


| Predicted Class | |||
|---|---|---|---|
| 1 | 0 | ||
| Actual Class | 1 | TP | FN |
| 0 | FP | TN | |
| Metric | Formula |
|---|---|
| Accuracy | |
| Precision | |
| Specificity | |
| Sensitivity/Recall |
| Method | Accuracy (%) | Precision (%) | Specificity (%) | Sensitivity/Recall (%) | AUC |
|---|---|---|---|---|---|
| MLP | 66.82 | 66.48 | 66.60 | 66.60 | 0.67 |
| LR | 57.58 | 59.90 | 56.14 | 56.14 | 0.56 |
| KNN | 65.91 | 65.73 | 65.52 | 65.52 | 0.66 |
| DT | 67.96 | 70.04 | 67.83 | 67.83 | 0.68 |
| NB | 57.73 | 62.11 | 59.79 | 59.79 | 0.60 |
| RF | 67.80 | 70.14 | 67.02 | 67.02 | 0.67 |
| AdaBoost | 74.09 | 76.51 | 73.43 | 73.43 | 0.73 |
| XGBoost | 75.08 | 75.78 | 74.31 | 82.62 | 0.74 |
| Proposed model | 80.23 | 82.71 | 78.57 | 78.57 | 0.78 |
Publisher’s Note: MDPI stays neutral with regard to jurisdictional claims in published maps and institutional affiliations. |
© 2022 by the authors. Licensee MDPI, Basel, Switzerland. This article is an open access article distributed under the terms and conditions of the Creative Commons Attribution (CC BY) license (https://creativecommons.org/licenses/by/4.0/).
Share and Cite
Alfian, G.; Syafrudin, M.; Fahrurrozi, I.; Fitriyani, N.L.; Atmaji, F.T.D.; Widodo, T.; Bahiyah, N.; Benes, F.; Rhee, J. Predicting Breast Cancer from Risk Factors Using SVM and Extra-Trees-Based Feature Selection Method. Computers 2022, 11, 136. https://doi.org/10.3390/computers11090136
Alfian G, Syafrudin M, Fahrurrozi I, Fitriyani NL, Atmaji FTD, Widodo T, Bahiyah N, Benes F, Rhee J. Predicting Breast Cancer from Risk Factors Using SVM and Extra-Trees-Based Feature Selection Method. Computers. 2022; 11(9):136. https://doi.org/10.3390/computers11090136
Chicago/Turabian StyleAlfian, Ganjar, Muhammad Syafrudin, Imam Fahrurrozi, Norma Latif Fitriyani, Fransiskus Tatas Dwi Atmaji, Tri Widodo, Nurul Bahiyah, Filip Benes, and Jongtae Rhee. 2022. "Predicting Breast Cancer from Risk Factors Using SVM and Extra-Trees-Based Feature Selection Method" Computers 11, no. 9: 136. https://doi.org/10.3390/computers11090136
APA StyleAlfian, G., Syafrudin, M., Fahrurrozi, I., Fitriyani, N. L., Atmaji, F. T. D., Widodo, T., Bahiyah, N., Benes, F., & Rhee, J. (2022). Predicting Breast Cancer from Risk Factors Using SVM and Extra-Trees-Based Feature Selection Method. Computers, 11(9), 136. https://doi.org/10.3390/computers11090136