Review

Recent Advancement of the Sensors for Monitoring the Water Quality Parameters in Smart Fisheries Farming

by
Fowzia Akhter
1,*,
Hasin Reza Siddiquei
1,
Md Eshrat E. Alahi
2 and
Subhas C. Mukhopadhyay
1
1
Department of Engineering, Macquarie University, Sydney NSW 2109, Australia
2
Shenzhen Institute of Advanced Technology, Chinese Academy of Sciences, Shenzhen 518055, China
*
Author to whom correspondence should be addressed.
Computers 2021, 10(3), 26; https://doi.org/10.3390/computers10030026
Submission received: 1 February 2021 / Revised: 22 February 2021 / Accepted: 22 February 2021 / Published: 27 February 2021
(This article belongs to the Special Issue Real-Time Systems in Emerging IoT-Embedded Applications)

Abstract

:
Water quality is the most critical factor affecting fish health and performance in aquaculture production systems. Fish life is mostly dependent on the water fishes live in for all their needs. Therefore, it is essential to have a clear understanding of the water quality requirements of the fish. This research discusses the critical water parameters (temperature, pH, nitrate, phosphate, calcium, magnesium, and dissolved oxygen (DO)) for fisheries and reviews the existing sensors to detect those parameters. Moreover, this paper proposes a prospective solution for smart fisheries that will help to monitor water quality factors, make decisions based on the collected data, and adapt more quickly to changing conditions.

1. Introduction

Water contamination is a significant problem worldwide, and it is essential to monitor the contaminating ions to keep the water safe regularly. Moreover, fresh water and marine water fisheries contribute significantly to various countries such as Australia, Vietnam, Japan, and the Philippines [1]. It is accepted worldwide that good water quality must maintain viable aquaculture production and compete with the growing aquaculture industry [2]. The poor water quality outcomes result in inferior quality products, health risks for humans, and low profit. Water contaminants harm the growth, development, reproduction, and mortality of the fishes cultured on a farm, which vastly reduces farm production [3]. Some pollutants may remain in small quantities but may threaten human health [4].
The fishes breathe, excrete waste, feed, reproduce, and maintain salt balance inside the water they live in [5]. Hence, maintaining water quality is the key to ensure the success and failure of an aquaculture project. It is necessary to have a guideline for the farmers on the essential water quality factor and any parameters’ safe level. Otherwise, continuous water quality degradation because of anthropogenic sources would reduce the farm’s productivity and profit [6,7]. Therefore, control and management of water quality in water resources are pivotal for both fresh water and marine aquaculture.
The water quality of fisheries can be controlled by monitoring the water quality parameters such as temperature, pH, nitrate, phosphate, calcium, magnesium, and dissolved oxygen regularly using sensors. Inclusion of the Internet of Things (IoT) and communication technology with the sensors will bring significant advantages to monitoring the farm even from a remote location. Suppose the collected data are stored in a cloud server and shared with experts. In that case, the farmers can receive expert feedback from anywhere globally, irrespective of their time and location. Figure 1 shows a typical diagram of smart fisheries. That is why, nowadays, agricultural countries such as Australia, New Zealand, Japan, and the USA are interested in incorporating agriculture with technology. This necessitates a clear understanding of the vital water quality factors, their impact, and the development of smart systems that can be used by the farmers with minimal training.
This review article discusses the parameters of deciding water quality, the optimum requirement for various fishes, and sensors associated with those parameters. This paper also reviews the software related to water quality management and related research and discusses those algorithms’ advantages and disadvantages. Moreover, it also proposes a low-cost, low-power system as a solution to smart farming. Access to real-time data through IoT-enabled sensors will allow farmers to identify issues affecting farms’ conditions and make decisions to improve productivity efficiently. Due to the collection of a large amount of data, predicting situations is also possible to ensure that farmworkers are engaged most productively.

2. Factors Deciding Water Quality and Related Sensors

The essential parameters defining water quality are water temperature, pH, nitrate, phosphate, calcium, magnesium, and dissolved oxygen. Numerous studies have been carried out on detecting and measuring the amount of those parameters. These are discussed in this section.

2.1. Water Temperature

Fishes are poikilothermic animals whose body temperatures are almost the same as the water temperature they live in [8]. Water temperature and fish metabolism are closely related to each other. The fishes in higher temperatures have a more significant metabolism than those living in lower temperature water [9]. This applies to warm-water fishes. The optimum temperature range for tropical water fish is 24~27 °C, whereas for cold-water fish it is below 20 °C. Cold-water fishes such as whitefish, salmonids, and burbot have higher metabolism at a lower temperature. They become less active due to consuming less food at a temperature above 20 °C. Fish diseases may initiate and spread because of water temperature [10]. Different fishes require different temperatures for their health and wellbeing. These are summarised in Table 1 [11]. Most of the fishes have the highest immunity at a temperature of about 15 °C. Fishes naturally adapt to seasonal changes such as, at 0 °C in the winter and 20 °C to 30 °C in the summer. However, the temperature should not change abruptly as fishes are shocked if they are put in a new environment with a temperature change of 12 °C than the original water [12,13]. Fishes may be paralysed or die under these circumstances. The young fry may show these symptoms, even the temperature variation is as low as 1.5 °C to 3 °C. The digestive systems of fishes may slow down or stop if they are transferred to colder water by 8 °C or more after feeding. When the food is not entirely digested, gases are produced. Fishes become bloated, imbalanced, and finally, die [14,15,16,17]. Figure 2 depicts the influence of water temperature on fish lives. Therefore, monitoring water temperature is essential to control and maintain optimum conditions so that all the potential fishes can gain maximum weight.
Numerous studies have been carried out on developing a sensor for measuring water temperature. Some researchers used Lithium niobate (LiNbO3) interdigital sensor, whereas some researchers used fibre Bragg grating (FBG) sensors for measuring water temperature [18,19]. The detection range and limit are deficient, and these sensors need complex electronics to make them suitable for the IoT environment. Several sensors are commercially available for measuring water temperature. The most used sensor is an optical sensor (DS18B20) [20,21,22]. It provides a wide detection range (−55 °C~+125 °C), response fast within a second, and suitable for smart aquaculture. However, the cost is very high. Therefore, it is necessary to develop a low-cost, low-power, wide range detection temperature sensor applicable for fresh water and marine fisheries.

2.2. pH

The pH level is another critical parameter for water corrosivity. It measures water’s acidity or alkalinity by determining hydrogen ions (H+) [23]. Water with a pH value of less than 7.0 is acid, whereas a pH level above 7.0 is considered a base. The range of pH values for natural waters is from 5.0~10.0, whereas for seawater, it is from 5.0~8.3 [24].
Rapid changes in the pH level of water may have a significant impact on many organisms. Different organisms (fish, eggs, and fry) are adapted to live in water, have a specific pH, and die whenever a slight change in pH value [25]. The pH also varies due to other factors such as hardness, alkalinity, and dissolved carbon dioxide. The toxicity occurred because this may influence other elements such as ammonia, heavy metals, cyanides, and hydrogen sulphide. All these phenomena change the pH level in aquaculture and affect fish health, as mentioned in Table 2 [26].
The ideal pH range for marine fishes is from 7.5 to 8.5, whereas most freshwater fishes can sustain within a wide range of pH, ideally from 6.5–9.0. Table 3 shows the preferred pH level for various freshwater fish [27].
The desired range for producing cold-water fishes is between 6.4–8.4, which is different from the warm-water fishes. The optimum pH range for freshwater and marine fisheries usually varies from country to country, mainly between 5.0 and 9.0. In Australia, freshwater’s pH level is 5.0–9.0, and marine water is 6.0–9.0 [28,29,30]. Therefore, it is necessary to have accurate pH management in freshwater to produce healthy fishes. Numerous studies have been conducted on developing a pH sensor, and there are commercially available sensors. A summary of the existing sensors is given in Table 4.
Most lab-based sensors are cost-effective and provide a wide range of pH level detection but still need improvement to apply in a real-life scenario such as corrosion-free. The commercially available sensors are wide range, fast response, IoT compatible but expensive.

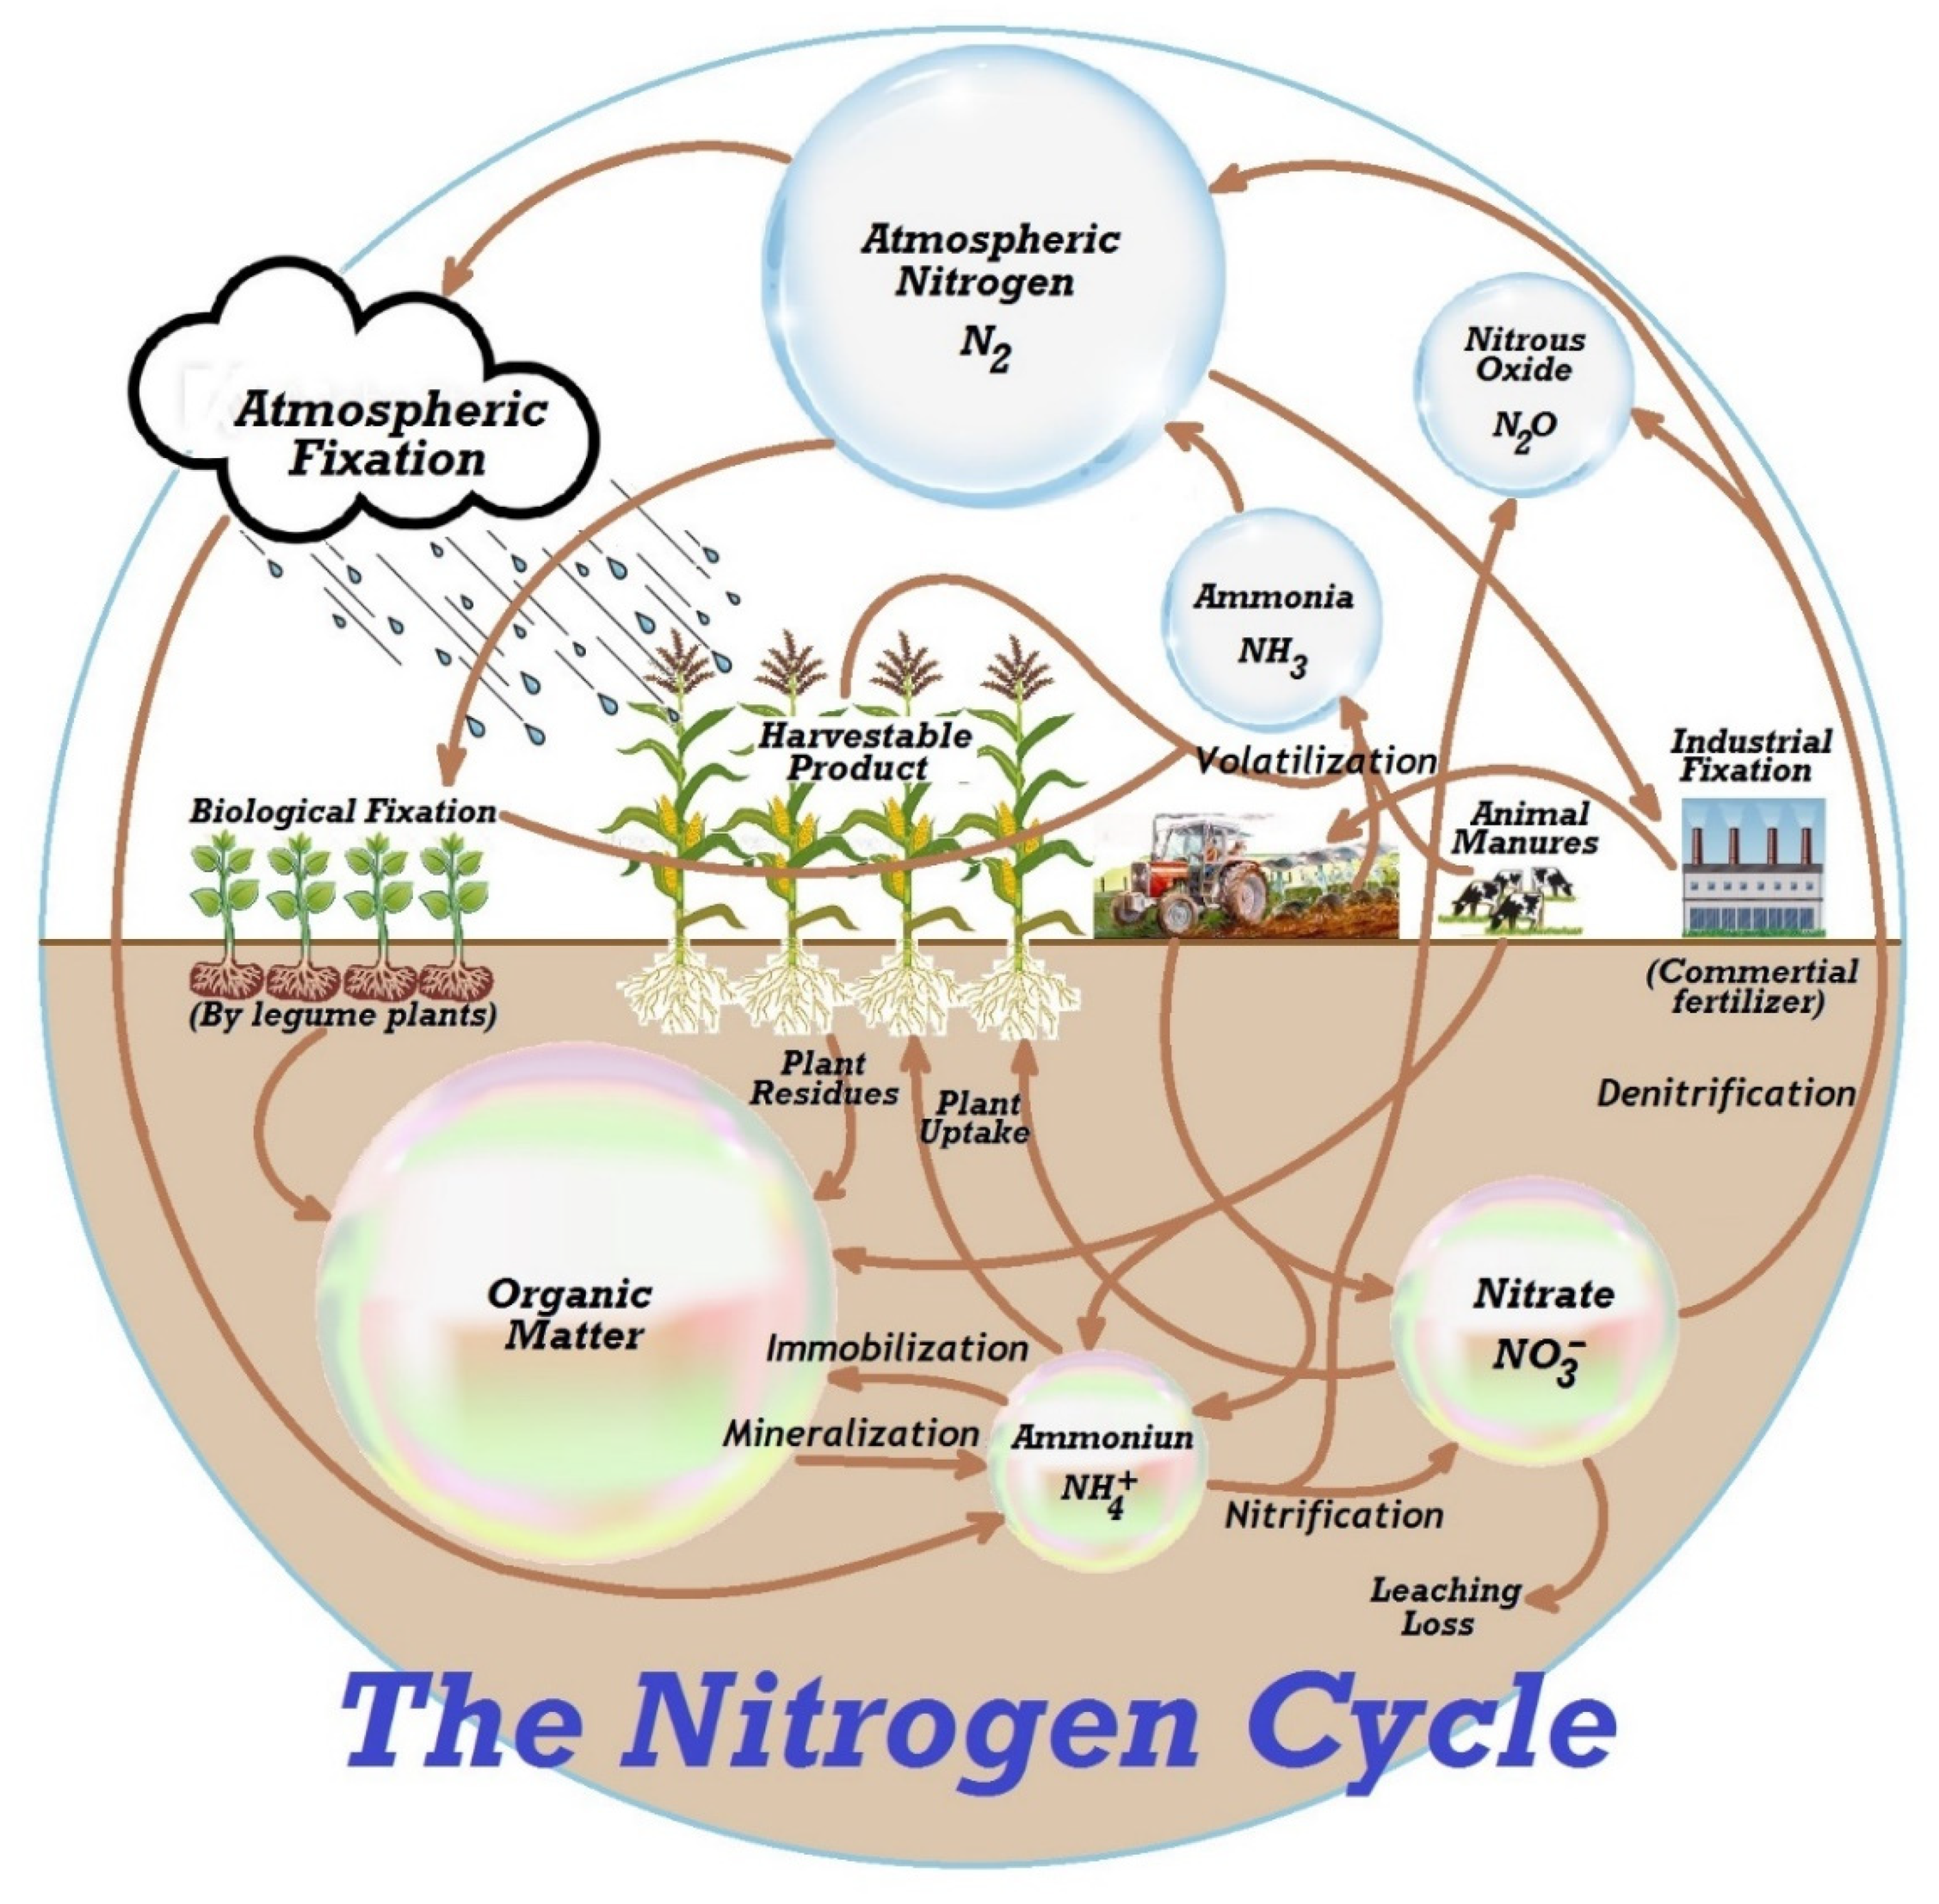
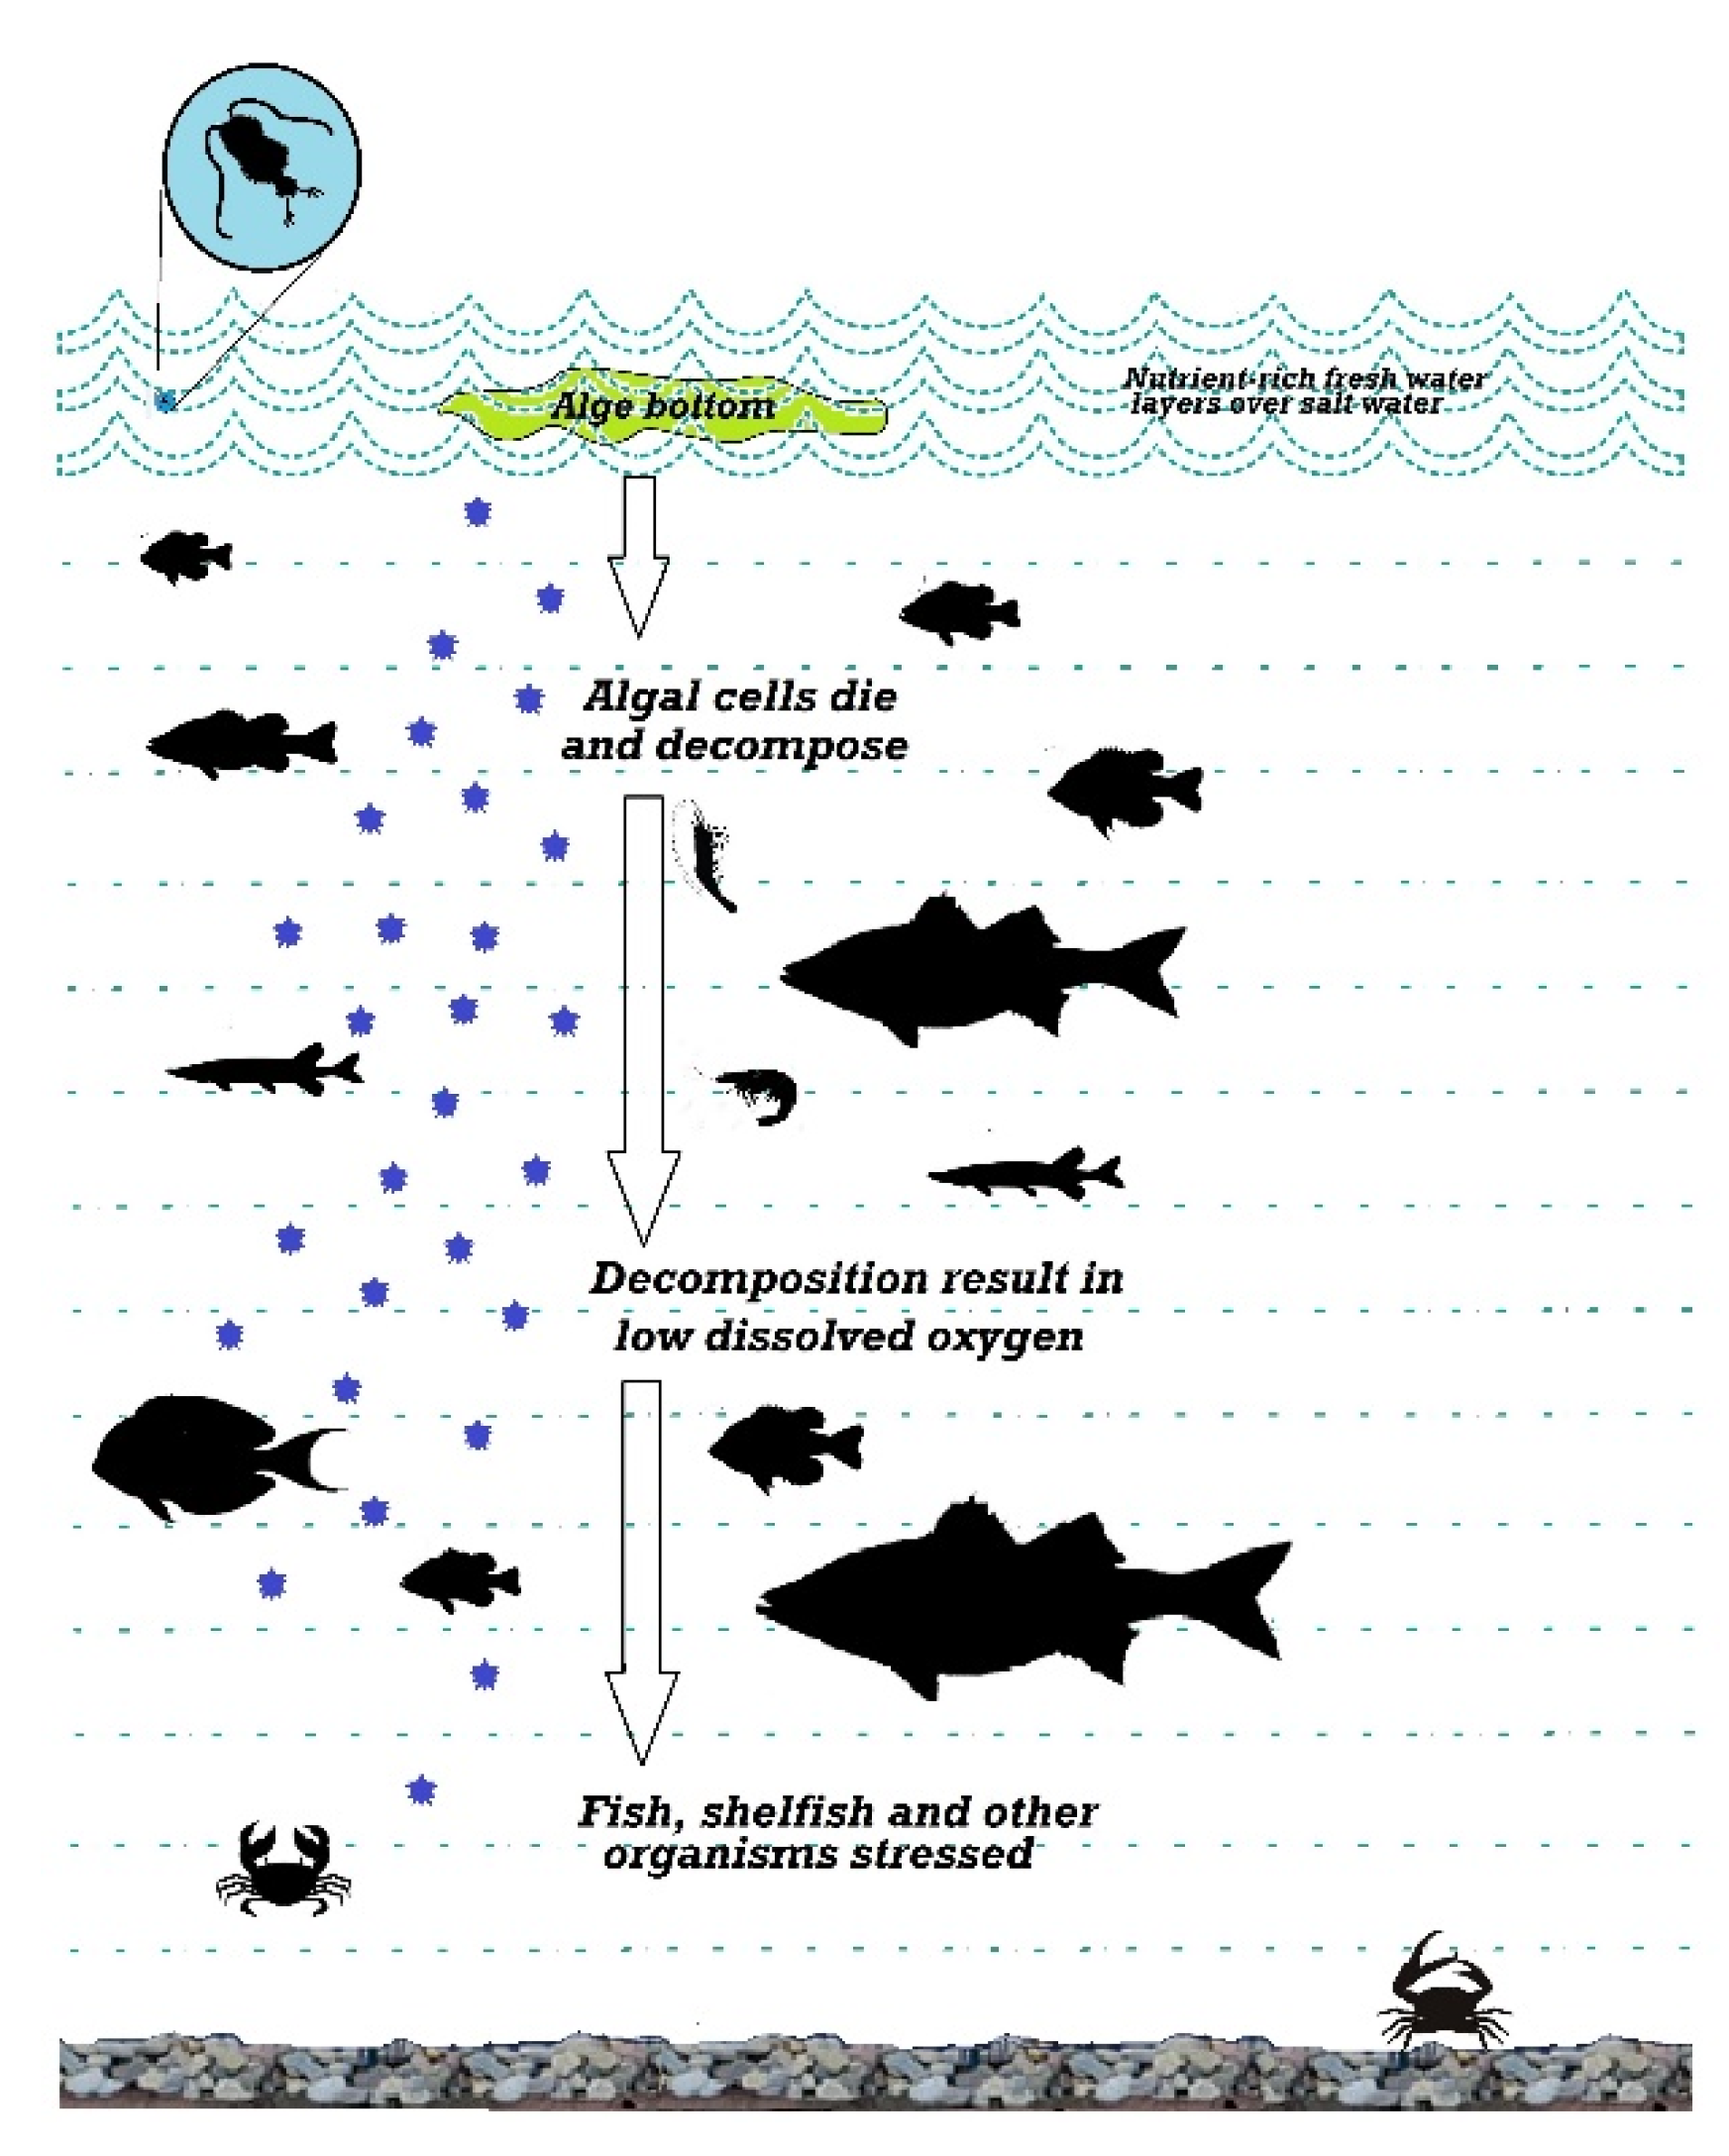
2.3. Nitrites and Nitrates

Nitrites exist in the surface water with nitrates and ammonia nitrogen, albeit at low concentrations due to instability. They transform into nitrate or ammonia both chemically and biochemically through bacteria [37]. Nitrates are formed due to organic nitrogen compounds’ aerobic decomposition [38]. Retention soil does not contain nitrate and leached to lakes, ponds, or creeks so easily. The surface water becomes nitrate polluted because of using manures on arable land and nitrogen fertilisers. These are diffused in the soil and discharge into sewage, lakes, or ponds [39]. Figure 3 shows a typical example of nitrate leaching.
Nitrate leaching to aquaculture affects the life of aquatic animals, although different species are affected differently. The maximum tolerable limits of nitrate for freshwater and marine water fisheries are 110 ppm and 40 ppm, respectively. A nitrite range of 0.0~0.2 ppm is ideal for both freshwater and marine water fisheries, whereas any concentration of more than 0.5 ppm is considered harmful, and 1.6 ppm is considered lethal. The optimum nitrites and nitrate levels for freshwater fisheries are summarised in Table 5 [40].
Fishes gain nitrite ions through chloride cells of the grills [41]. As soon as nitrites enter the blood, it bound to haemoglobin. As a result, methaemoglobin increases, which lowers the capacity of the blood’s oxygen transportation. A high level of methaemoglobin appears as a brown colour of the blood and gills. Fishes usually survive if methaemoglobin in the blood does not cross beyond 50% [42]. However, if the methaemoglobin level in their blood increased to 70% to 80%, fishes lose their orientation, react differently to stimuli, and become torpid. If fishes are kept in nitrite-free water, they can survive. Erythrocytes in the blood cell contain enzymes that transform methaemoglobin to haemoglobin. As a result, fishes behave normally within two days [43,44]. Hence, it is necessary to monitor and manage nitrate concentration in water using sensors for efficient and economic farming.
Some researchers used graphene-based electrochemical sensing methods [45,46,47,48,49,50,51,52], whereas some researchers used the colorimetric [53] method for detecting nitrate in water samples. A summary of the existing nitrate sensors is included in Table 6. Although these sensors can detect a wide range of nitrate concentrations, the process still needs improvement of response time, high-sensitivity, low-power, low-cost, and easily operable sensors applicable to real-time monitoring in any environmental condition.

2.4. Phosphorous (P)

Phosphorous (P) exists in the natural water in organic and inorganic phosphates (PO4) form. Polyphosphate and orthophosphate are inorganic forms, whereas organically bound phosphates are called organic phosphates [54]. All plants—aquatic plants and algae—require a minimal amount of phosphate for their growth. Phosphate (PO₄³⁻) ions is an essential mineral to generate usable energy from the sunlight. It helps cells to grow and reproduce. Therefore, a small amount of phosphorus loss from soil may reduce algae and freshwater weeds growth [55]. Phosphorus also damages the environment when added to the lake in a plethora of amounts due to inconsiderable human activities, including urban sewage, street runoff, and rural home septic tanks [56]. Phosphorous may migrate with the groundwater and mix with the surface water. Therefore, excessive phosphorus in groundwater may also affect surface water quality, a serious concern [57]. A high phosphate level in water reduces the amount of dissolved oxygen in lakes and rivers. This phenomenon has adverse effects on the life of flora and fauna inside rivers or lakes. Phosphates are not harmful to humans or animals unless they exist in too high concentrations. Fishes may have digestive issues if they live in water, having very high levels of phosphates [58]. The phosphate level usually varies from 0.005 ppm to 0.05 ppm in any fisheries. A phosphate level of 0.08 ppm to 0.10 ppm triggers periodic blooms. However, the eutrophication process will stop if phosphate levels remain at 0.05 ppm for the long-term [59]. Hence, it is necessary to have the best phosphate management in water used in farming and lakes or rivers for economic and environmental reasons.
Some researchers used graphene-based electrochemical sensing methods [60,61,62,63,64,65,66], whereas some researchers used the colorimetric [67] method for detecting phosphate in water samples. A summary of the existing phosphate sensors is included in Table 7. Although the current sensors can detect a wide range of phosphate concentrations, the response time is relatively high and needs vigorous testing to fit real-life scenarios. Therefore, there is a lot to improve in the phosphate sensing research in terms of high-sensitivity, low-power, low-cost, and applicability in any environmental condition.

2.5. Calcium (Ca) and Magnesium (Mg)

Calcium (Ca) and magnesium (Mg) are vital nutrients necessary for aquatic animals. They gain these nutrients either from food or water. Calcium (Ca) is a crucial nutrient of water in a fish hatchery. Fish hatcheries having low calcium concentration may suffer because the eggs hydrate and do not mature to hatch appropriately in that water [68]. The required calcium concentration varies based on the type of fishes. For example, the minimum concentration for brown trout is 10 ppm, whereas it is 4 ppm for channel catfish [69].
Magnesium (Mg) is another essential mineral needed for the development of freshwater fish. Some fish species such as tilapia, catfish, rainbow trout, and carp need dietary intake for their development [70]. These fishes’ growth largely depends on Mg and protein diets. Carp fishes’ activity and performance depend on various nutrients’ deposition rates on their bodies [71]. When the diet contains 0.08 g Mg kg−1 of Mg, the fishes’ growth reduces, muscle flaccidity, and skin haemorrhages may appear [72].
The fishes having a high protein diet may suffer due to Mg deficiency because the higher the protein diet they receive; the higher the required Mg level [73]. However, this generalisation does not apply to all fishes. The Tilapia, having a high protein diet, may suffer Mg deficiency. This research outcome is found by measuring the feed efficiency ratio, specific growth rate, and weight gain [74]. Hence, it is essential to manage and control the Ca and Mg level in fisheries to increase the farm’s quality, productivity, and profitability. In addition to fisheries farm, if someone wants to keep the aquarium, they also need to maintain the calcium and magnesium-based on the type of aquarium. The optimum Ca and Mg levels for different types of aquariums are summarised in Table 8 [75].
There are various methods of determining phosphate concentrations, including high-performance liquid chromatography (HPLC) [76], UV-spectroscopy [77], and chromatography [78]. These methods provide highly accurate results but are time-consuming, complicated, and require regular care such as cleaning, storage, and maintenance [79]. One has to be highly educated and trained to use these machines. Hence, it is essential to develop low-cost, low-power sensing devices for detecting nutrients accurately in different water bodies, which anyone can use with minimal training for economic and effective farming.

2.6. Dissolved Oxygen (DO)

Oxygen is diffused into fisheries from the atmosphere during surface turbulence and water when photosynthesis occurs in fisheries’ plants. However, oxygen is removed from the water due to all the organisms’ respiration and organic substances aerobic degradation caused by bacteria [80]. The oxygen requirement varies among the fish species. For example, the optimum need for salmonids is 8 ppm to 10 ppm, and they suffocate if the concentrations go below 3 ppm, whereas Cyprinids require less oxygen. They are very active and thrive in water having 6 ppm to 8 ppm of DO. However, they suffocate in case the concentration goes low from 1.5 ppm to 2 ppm [81]. Silver perch can tolerate up to 2 ppm of DO for few hours only. If it is exposed to this level for a long term, fish growth will be reduced, and stress will be increased. The required DO level changes depending on the species of fish. Worms, oysters, crabs, and bottom feeders require at least 1–6 ppm of oxygen (1–6 ppm), whereas shallow-water fishes need more oxygen from 4 ppm to 15 ppm. Yellow Perch, White Perch, Largemouth Bass, and Bluegill are known as warm-water fishes and require DO levels of more than 5 ppm [82]. They cannot stay in the areas having less than 3 ppm of DO levels and suffer badly when the oxygen level is reduced to 2 ppm. The average DO level should be maintained around 5.5 ppm for survival and optimum growth [83].
The fishes’ oxygen requirement also depends on water temperature, the total weight of fish per unit water volume, and individual weight. Fishes demand more oxygen when they live at a higher temperature. The oxygen requirement becomes double if the water temperature increases from 10 °C to 20 °C. When the number of fishes in a specific volume of water increases, fishes become more active. As a result, they demand more oxygen because of increased respiration rate due to overcrowding [84,85]. Therefore, the balance among these factors needs to understand clearly. It is also important to remember that an adequate oxygen level observed during the day does not ensure the same amount will remain at night. A sunny day indicates extreme oxygen deficiency at night [86].
Oxygen deficiency harms fish life. When the fishes are exposed to water having oxygen deficiency, they stop eating, gather near the surface water where the oxygen level is high, gasp for air, not react to irritation, become torpid, and lose the strength of escaping from capture, and finally die [87]. Figure 4 shows the impact of DO on the fishpond. The significant effect on fish health due to oxygen deficiency includes pale skin, small haemorrhages on the ocular cavity’s front and the covered grill, adherence of the gill lamellae, and congested cyanotic blood in the gills [88]. Therefore, it is essential to monitor the amount of dissolved oxygen inside fisheries farms to take the necessary actions beforehand.
Researchers have developed dissolved oxygen sensors using various detection methods, including electrochemical, optical, and colorimetric. A summary of the existing DO sensors is shown in Table 9. Some lab-based sensors provide a wide range of detection but need complex electronic circuitry to make the sensor applicable for a real-life scenario [89,90,91,92]. They are also prone to corrosion. The commercial sensors respond fast, IoT compatible, but very costly [93]. Some researchers used sensors for real-time monitoring DO in water, whereas some researchers combined sensor and machine learning models to predict results if the sensor fails. Therefore, it is essential to develop low-cost, low-power, wide detection range, IoT compatible sensors applicable to the practical field.

3. Necessity of IoT-Based Farming and Related Research

The fascinating ability of the Internet of Things (IoT) is converting a dumb system into smart by incorporating it with the internet. It helps sense the physical objects and control them from any remote location. It integrates the physical world with a computer-based system [96]. Data from IoT-enabled devices can guide farmers’ taking decisions, making farms smart enough to adapt more quickly to changing conditions. Remotely monitoring the farm conditions and infrastructure helps in saving time, labour, and cost, enabling farmers to focus on other things. It also improves the ability to decide based on data analysis. It helps build capabilities to respond to technological advancement by investing in research and development to contribute to innovation to improve the agricultural sector’s productivity and profit [97].
Nowadays, researchers utilise information and communications technology (ICT) with sensors to monitor, transmit, and manage fisheries’ quality of water and develop efficient quality management based on the collected data. Some researchers used machine-learning algorithms to predict and analyse the water quality parameters. The most popular machine-learning algorithms for water quality analysis are the K-nearest neighbour (KNN) algorithm, random forest (RF) model, decision tree regression, polynomial regression, multiple linear regression, and principal component analysis (PCA). The algorithms and applications of these methods in water quality management are discussed in this section.

3.1. K-Nearest Neighbour (KNN)

K-nearest neighbour is one of the most popular supervised algorithms to identify a new entry’s patterns or behaviour based on the trained data. It classifies the incoming data by looking at similar data at the neighbours. Rose et al. used this algorithm to identify the unknown solvents of water by determining known total dissolved solvents (TDS) [98]. Adidrana et al. applied this method to predict nutrient conditions in a hydroponic nutrition control system for lettuce [99]. Although this method is simple and easy to implement, it has some shortcomings. The number of samples plays a vital role in the classification speed for highly complex scenarios. The accuracy of this method significantly reduces when the samples are unevenly distributed [100].

3.2. Random Forest (RF) Model

An RF machine-learning model solves the classification and regression problems. The system is trained with a dataset, and a group of decision trees is constructed. A new entry is predicted based on the mean value from the set of decision trees. The users specify the maximum tree number for making the forest while developing the random forest model. A bootstrapped random sample is used to construct a tree from the training data set [101]
Devi et al. used this method for predicting the quality of water in the Kadapa District of India and classifying the regions into three classes such as excellent, good, or poor for drinking [102]. Benedict et al. applied the RF model to predict water quality parameters such as pH, temperature, and turbidity from remote locations [103]. The major advantage of using this algorithm is that it can automatically handle missing values. However, this model requires more time for training as compared to decision trees. It also requires generating a lot of trees to decide on the majority of votes [104].

3.3. Decision Tree Regression

A decision tree model is used for both regression and classification of data. The system is trained with a set of data, and decision trees are constructed. After that, the system takes decisions based on the relevant input parameter values. Using entropy, it selects the root variable and looks for values of other parameters. Different input parameters are given at various steps of the tree to finalise the decision based on the trained data [105].
Liao et al. used this model to predict and evaluate Chao Lake’s water quality. They also improved the decision tree’s learning method for the faster, easier, and accurate forecast of data [106]. Saghebian et al. developed a simple and powerful decision tree to classify the quality of groundwater in Ardebil [107]. Although this method works well for both linear and nonlinear problems, it overfits data and provides inaccurate results on small datasets.

3.4. Polynomial Regression

The polynomial regression method is used if the input and output variables relations are non-linear and complex. A higher-order variable (two or more) is used for capturing the non-linear relationship between the input and output parameters. However, overfitting may occur if a higher-order variable is used, as shown in Equation (1). In this equation, y refers to the output based on the applied machine learning algorithm, x represents the obtained value, i is the number of considered parameters, β is the scaling factor, k is the polynomial equation order, and ei is the residuals of the ith predictor [108].
y = β 0 + β 1 x i + β 2 x i 2 + + β k x i k + e i ,   w h e r e   i = 1 , 2 , , n
Huang et al. used this model to assess the change-points and trends of water quality parameters. This model successfully evaluates the efficiency of the strategies for controlling pollution and predicts the trends of water quality in Shanxi Reservoir [109]. Balf et al. proposed this model to predict longitudinal dispersion coefficient in rivers as a function of average and shear velocities, flow depth, and channel width [110]. Although this regression analysis works very well on any size of data and nonlinear problems, the selection of the right polynomial degree for good bias/variance trade-off is difficult [111].

3.5. Multiple Linear Regression

This regression analysis is used when it is necessary to predict more than one variable. Multiple linear regression is used to assess each variable’s impact on the output when numerous input variables are present. Equation (2) is the mathematical representation of the multiple linear regression analysis where y refers to the output of the applied machine-learning algorithm, x is the obtained values, β is the slope on the curve, and e is the error coefficient [112].
y = β 0 + β 1 x 1 + β 2 x 2 + + β k x k + e
El-Korashey et al. applied this algorithm for estimating concentrations of calcium, chloride, sodium, ammonia, total nitrogen, and biochemical oxygen demand from water-quality data collected in 2004–2006 [113]. Chen et al. used this model for simulating the Secchi disk depth (SD), chlorophyll, the total phosphorus (TP), and dissolved oxygen (DO) of reservoirs. They also tried to find the complex nonlinear relationships between the inputs and outputs in the Mingder Reservoir, Taiwan [114]. Although this regression analysis is easy and simple to implement for interpreting the output parameters, the outliers of this technique may have adverse effects on the boundaries and regression are linear [115].

3.6. Principal Component Analysis (PCA)

This is a method to compute the principal components to use them for performing the reason for variation basis of a dataset. Sometimes, the first few principal components are calculated, and the rest are ignored. Data are transferred into a new “coordinate system” in a way that the most significant variance falls into the first principal component, the second most significant variance on the second principal component, etc. [116].
Bhat et al. statistically analysed the deteriorating water quality of the Sukhnag stream using principal component analysis (PCA) to predict 26 water quality parameters [117]. Mahapatra et al. applied this method to classify water samples based on 10 water quality parameters such as sulphate (SO4--), iron (Fe++), biochemical oxygen demand (BOD), chloride ion (Cl−), calcium ion (Ca++), hardness, TDS, turbidity, DO, and pH [118]. The significant advantages of using the PCA model on a set of data are that all the principal components are not correlated. However, this method’s drawback is that it is essential to standardise the data before the implementation of PCA. Otherwise, PCA cannot find the optimal principal components [119].

4. A Proposed System

After reviewing the existing research about water quality monitoring, we have realised that although the lab-based sensors are low cost and need vigorous testing and electronics to apply that in a real-life scenario. Some researchers reported where ICT is utilised, but the system cost is very high due to using the commercially available sensor. Moreover, real-time water quality monitoring still relies on very few factors, including water temperature, velocity, level, conductivity, dissolved oxygen (DO), and pH [120]. Therefore, this research proposes a solution to the existing smart farming. Figure 5a shows the block diagram of the proposed system.
Because all the sensors necessary for monitoring water quality are not yet commercially available, an electronic component is included with the existing sensors to make the sensors smart. Any interdigital electrochemical sensors can be converted into an intelligent sensor using the AD5933 impedance analyser (Analogue Devices, Wilmington, MA, USA). This research proposes a smart system that is a continuation of our previous study [121]. The autonomous system consists of two pumps (SFDP1-010-035-21) [122], an LM298 pump controller (DC Pumps Australia, Littlehampton, SA, Australia) [123], nitrate sensor, and AD5933 impedance analyser [124] for taking the impedance measurement, Arduino UNO microcontroller (Core Electronics, Kotara, NSW, Australia) [125] is the core of the sensing node, LoRa shield (IoT store, Perth, Australia) [126] for radio communication, 12 V 10 W Solar Panel (Jaycar, Australia) [127], Dia Mec (DMU12-12(12V12AH/20HR) (Jaycar, Australia) [128] rechargeable battery for providing continuous energy, 12/24 V 10 A Solar Charge Controller (Jaycar, Australia) [129] with USB for converting the charging the battery utilising solar energy. The system was used to measure the nitrate concentrations in real-time from Macquarie Lake. This system is modified to monitor other water quality parameters, including temperature, pH, nitrate, phosphate, calcium, magnesium, and DO cascading all the sensors. Therefore, the circuit diagram of the proposed system is modified as Figure 5b. All these sensors are very low-cost and fabricated in our lab. For nitrate measurement, an FR4- based sensor proposed in our previous study is used [121]. For temperature, calcium, and magnesium measurement, an MWCNTs/PDMS sensor proposed by Akhter et al. is used [130]. For phosphate measurement, a graphite/PDMS sensor proposed by Nag et al. is used [131]. For pH measurement, a graphene sensor proposed by Nag et al. is used [132]. For selective detection of DO, a Microelectromechanical systems (MEMS) sensor coated with rGO/CuO2 is fabricated in our lab. All these sensors can detect a wide range of parameters and respond very fast.
Figure 5c,d shows the inset and final prototype. A chamber is allocated for water collection. Two pumps are used—one for water collection from the creek, and the other one that empties the chamber after finishing the measurement. LM298 motor controller controls all these. The pump goes to ON and OFF state based on NAND gate logic. When both inputs are in the same state, the pump remains OFF, and when both inputs are at different states, the pump goes ON.
AD5933 impedance analyser is used to read each sensor data and convert it into meaningful water quality parameters applying a data processing algorithm. Once the sensors’ data are read, those can be transferred to the ThingSpeak (The MathWorks, Inc., Natick, MA, USA) server. The necessary coding to run the system is written in Arduino integrated development environment (IDE). A channel is open in ThingSpeak, and different fields are allocated to store each data. While writing the server code, the channel number and application programming interface (API) key are given so that the system data is stored in the allocated channel.
After developing the sensor node, it is installed at Macquarie university creek for data collection. Figure 6 shows the preliminary results of the collected data into the ThingSpeak cloud server. Sensors’ performances deteriorate when used in the long term. Therefore, an auto-calibration algorithm will be developed based on the collected data in the future, enhancing the reliability of the proposed system.
The autonomous system can be installed in any fishers for monitoring water quality parameters. The farmers can use the system with minimal training and regularly check the water nutrient level to efficiently manage the farm’s productivity. They can also receive feedback from experts whenever necessary from anywhere in the world. This smart prototype will significantly impact the agricultural industry, detecting any abnormality in an early stage and taking necessary measures before the situation goes out of hand.

5. Conclusions

The essential parameters deciding water quality, their impact on fresh water and marine fisheries are successfully discussed in this research. Moreover, the acceptable limits of each parameter for healthy fisheries are also discussed. The existing sensors for each parameter are discussed; their advantages and disadvantages are presented. Additionally, software-based water quality monitoring systems are also discussed. Moreover, an autonomous system is proposed to monitor water quality for smart fisheries. The major advantage of the proposed system is using low-cost, low-power sensors compared to the existing systems. The implementation cost of the proposed system is USD 250, which includes purchasing electronic components in small numbers. However, the overall cost can be reduced significantly when the product is developed in large numbers. All the existing systems use commercially available sensors, and those are very expensive. Due to using the sensors fabricated in our lab, the system cost is significantly reduced. The proposed systems fulfil the motives of agriculture 4.0, which no longer only relies on applying pesticides and food into fishers but also running the farms with advanced technology, including sensors, machines, devices, and communication systems. The existence of these systems in any fisheries will help farmers make informed decisions beforehand using advanced technologies to improve productivity and profitability.

Author Contributions

F.A. and S.C.M.; Conceptualisation, F.A. and H.R.S.; writing—original draft preparation, F.A., H.R.S. and M.E.E.A.; writing—review and editing, S.C.M. and M.E.E.A.; supervision. All authors have read and agreed to the published version of the manuscript.

Funding

This research received no external funding.

Institutional Review Board Statement

Not applicable.

Informed Consent Statement

Not applicable.

Data Availability Statement

Authors can confirm that all relevant data are included in the article.

Conflicts of Interest

The authors declare no conflict of interest.

References

  1. Aura, C.M.; Musa, S.; Yongo, E.; Okechi, J.K.; Njiru, J.M.; Ogari, Z.; Wanyama, R.; Charo-Karisa, H.; Mbugua, H.; Kidera, S.; et al. Integration of mapping and socio-economic status of cage culture: Towards balancing lake-use and culture fisheries in Lake Victoria, Kenya. Aquac. Res. 2017, 49, 532–545. [Google Scholar] [CrossRef]
  2. Curtis, J.; Stanley, B. Water quality and recreational angling demand in Ireland. J. Outdoor Recreat. Tour. 2016, 14, 27–34. [Google Scholar] [CrossRef] [Green Version]
  3. Giacomazzo, M.; Bertolo, A.; Brodeur, P.; Massicotte, P.; Goyette, J.O.; Magnan, P. Linking fisheries to land use: How an-thropogenic inputs from the watershed shape fish habitat quality. Sci. Total Environ. 2020, 717, 1–11. [Google Scholar] [CrossRef]
  4. MacNeil, M.A.; Mellin, C.; Matthews, S.; Wolff, N.H.; McClanahan, T.R.; Devlin, M.; Drovandi, C.; Mengersen, K.; Graham, N.A.J. Water quality mediates resilience on the Great Barrier Reef. Nat. Ecol. Evol. 2019, 3, 620–627. [Google Scholar] [CrossRef] [Green Version]
  5. Achim, W.; Robert, F.; Robert, H.; Nina, B. Smart farming is key to developing sustainable agriculture. Proc. Natl. Acad. Sci. USA 2017, 114, 6148–6150. [Google Scholar]
  6. Jungsu, P.; Keug, T.K.; Woo, H.L. Recent advances in information and communications technology (ICT) and sensor tech-nology for monitoring water quality. Water 2020, 510, 1–24. [Google Scholar]
  7. Dieisson, P.; Paulo, D.W.; Edson, T.; Caroline, P.S.F.; Vitor, F.D.C.; Giana, V.M. Scientific development of smart farming technologies and their application in Brazil. Inf. Process. Agric. 2018, 5, 21–32. [Google Scholar]
  8. Munroe, D.; Narváez, D.; Hennen, D.; Jacobson, L.; Mann, R.; Hofmann, E.; Powell, E.; Klinck, J. Fishing and bottom water temperature as drivers of change in maximum shell length in Atlantic surfclams (Spisula solidissima). Estuar. Coast. Shelf Sci. 2016, 170, 112–122. [Google Scholar] [CrossRef] [Green Version]
  9. Dadras, H.; Dzyuba, B.; Cosson, J.; Golpour, A.; Siddique, M.A.M.; Linhart, O. Effect of water temperature on the physiology of fish spermatozoon function: A brief review. Aquac. Res. 2017, 48, 729–740. [Google Scholar] [CrossRef]
  10. Jackson, F.; Hannah, D.M.; Fryer, R.; Millar, C.; Malcolm, I. Development of spatial regression models for predicting summer river temperatures from landscape characteristics: Implications for land and fisheries management. Hydrol. Process. 2017, 31, 1225–1238. [Google Scholar] [CrossRef] [Green Version]
  11. Graf, R.; Zhu, S.; Sivakumar, B. Forecasting river water temperature time series using a wavelet–neural network hybrid modelling approach. J. Hydrol. 2019, 578, 124115. [Google Scholar] [CrossRef]
  12. Bowerman, T.; Roumasset, A.; Keefer, M.L.; Sharpe, C.S.; Caudill, C.C. Prespawn mortality of female Chinook salmon in-creases with water temperature and percent hatchery origin. Trans. Am. Fish. Soc. 2018, 147, 31–42. [Google Scholar] [CrossRef]
  13. Teffer, A.K.; Bass, A.L.; Miller, K.M.; Patterson, D.A.; Juanes, F.; Hinch, S.G. Infections, fisheries capture, temperature, and host responses: Multistressor influences on survival and behaviour of adult Chinook salmon. Can. J. Fish. Aquat. Sci. 2018, 75, 2069–2083. [Google Scholar] [CrossRef]
  14. Kędra, M.; Wiejaczka, Ł. Climatic and dam-induced impacts on river water temperature: Assessment and management im-plications. Sci. Total Environ. 2018, 626, 1474–1483. [Google Scholar] [CrossRef] [PubMed]
  15. Cheung, W.W. The future of fishes and fisheries in the changing oceans. J. Fish Biol. 2018, 92, 790–803. [Google Scholar] [CrossRef] [PubMed]
  16. Shahjahan-Uddin, H.; Bain, V.; Haque, M. Increased water temperature altered hemato-biochemical parameters and structure of peripheral erythrocytes in striped catfish Pangasianodon hypophthalmus. Fish. Physiol. Biochem. 2018, 44, 1309–1318. [Google Scholar] [CrossRef] [PubMed]
  17. The Thermal Optimum by David A. Ross. Available online: https://midcurrent.com/science/the-thermal-optimum/ (accessed on 28 January 2021).
  18. Zhaozhao, T.; Wenyan, W.; Jinliang, G. A wireless passive SAW delay line temperature and pressure sensor for monitoring water distribution system. In Proceedings of the IEEE Sensors Conference, New Delhi, India, 28–31 October 2018. [Google Scholar]
  19. Martin, A.; Peter, H.; Shima, T.; Simon, C.; Michael, J.W.; Heriberto, B.; Jose, G.; Louisa, V. Fibre optic temperature and humidity sensors for harsh wastewater environments. In Proceedings of the 19th International Conference on Sensing Technology (ICST), Sydney, Australia, 4–6 December 2017. [Google Scholar]
  20. Pushkar, S.; Sanghamitra, S. Arduino-based smart irrigation using water flow Sensor, soil moisture sensor, temperature sensor and esp8266 wifi module. In Proceedings of the IEEE Region 10 Humanitarian Technology Conference (R10-HTC), Agra, India, 21–23 December 2016. [Google Scholar]
  21. Muhammad, D.K.; Endro, A.; Sidik, P. Design and implementation of smart bath water heater using Arduino. In Proceedings of the 6th International Conference on Information and Communication Technology (ICoICT), Bandung, Indonesia, 3–5 May 2018. [Google Scholar]
  22. Waterproof DS18B20 Digital Temperature Sensor. Available online: https://core-electronics.com.au/waterproof-ds18b20-digital-temperature-sensor.html (accessed on 28 January 2021).
  23. Dong, Y.; Son, D.-H.; Dai, Q.; Lee, J.-H.; Won, C.-H.; Kim, J.-G.; Kang, S.-H.; Lee, J.-H.; Chen, D.; Lu, H.; et al. AlGaN/GaN heterostructure pH sensor with multi-sensing segments. Sens. Actuators B Chem. 2018, 260, 134–139. [Google Scholar] [CrossRef]
  24. Solovyev, M.M.; Izvekova, G.I.; Kashinskaya, E.N.; Gisbert, E. Dependence of pH values in the digestive tract of freshwater fishes on some abiotic and biotic factors. Hydrobiology 2017, 807, 67–85. [Google Scholar] [CrossRef] [Green Version]
  25. Alavi, S.M.H.; Cosson, J.; Bondarenko, O.; Linhart, O. Sperm motility in fishes: (III) diversity of regulatory signals from membrane to the axoneme. Theriogenology 2019, 136, 143–165. [Google Scholar] [CrossRef]
  26. Stevens, C.H.; Croft, D.P.; Paull, G.C.; Tyler, C.R. Stress and welfare in ornamental fishes: What can be learned from aqua-culture? J. Fish Biol. 2017, 91, 409–428. [Google Scholar] [CrossRef]
  27. Ahmed, I.; Reshi, Q.M.; Fazio, F. The influence of the endogenous and exogenous factors on hematological parameters in different fish species: A review. Aquac. Int. 2020, 28, 869–899. [Google Scholar] [CrossRef]
  28. Shartau, R.B.; Baker, D.W.; Brauner, C.J. White sturgeon (Acipenser transmontanus) acid–base regulation differs in response to different types of acidoses. J. Comp. Physiol. B 2017, 187, 985–994. [Google Scholar] [CrossRef] [PubMed]
  29. Borvinskaya, E.; Gurkov, A.; Shchapova, E.; Baduev, B.; Shatilina, Z.; Sadovoy, A.; Meglinski, I.; Timofeyev, M. Parallel in vivo monitoring of pH in gill capillaries and muscles of fishes using microencapsulated biomarkers. Biol. Open 2017, 6, 673–677. [Google Scholar] [CrossRef] [PubMed] [Green Version]
  30. Stephenson, R.L.; Wiber, M.; Paul, S.; Angel, E.; Benson, A.; Charles, A.; Chouinard, O.; Edwards, D.; Foley, P.; Lane, D.; et al. Integrating diverse objectives for sustainable fisheries in Canada. Can. J. Fish. Aquat. Sci. 2019, 76, 480–496. [Google Scholar] [CrossRef]
  31. Shogo, H.; Hironao, O.; Seiichi, T.; Toshihiro, I. Valve-actuator-integrated reference electrode for an ultra-long-life rumen pH sensor. Sensors 2020, 20, 1249. [Google Scholar]
  32. Wen-Chi, L.; Klaus, B.; Charles, W.M.; Mark, A.B. Multifunctional water sensors for pH, ORP, and conductivity using only microfabricated platinum electrodes. Sensors 2017, 17, 1655. [Google Scholar]
  33. Tanomsak, W.; Sarawoot, B.; Songgrod, P. Wireless sensor network for monitoring of water quality for pond Tilapia. In Proceedings of the 12th International Conference on UbiMedia Computing (UbiMedia), Bali, Indonesia, 5–8 August 2019. [Google Scholar]
  34. Noor, A.A.; Lee, Y.H.; Faridah, S.; Mohd, H.M.Z.; Sharina, A.H. A colorimetric pH sensor based on clitoria sp. and brassica sp. for monitoring of food spoilage using chromametry. Sensors 2019, 19, 4813. [Google Scholar]
  35. Nedal, A.T.; Yunusa, U.; Elaref, R.; Ayman, A.; Faraj, A.A. A flexible optical pH sensor based on polysulfone membranes coated with pH-responsive polyaniline nanofiber. Sensors 2016, 16, 986. [Google Scholar]
  36. Wade, L.; Magdalena, W.; Kamal, A. RuO2 pH sensor with super-glue-inspired reference electrode. Sensors 2017, 17, 2036. [Google Scholar]
  37. Gerwing, T.G.; Plate, E. Effectiveness of nutrient enhancement as a remediation or compensation strategy of salmonid fisheries in culturally oligotrophic lakes and streams in temperate climates. Restor. Ecol. 2018, 27, 279–288. [Google Scholar] [CrossRef]
  38. Liu, Y.; Lv, J.; Feng, J.; Liu, Q.; Nan, F.; Xie, S. Treatment of real aquaculture wastewater from a fishery utilizing phytoreme-diation with microalgae. J. Chem. Technol. Biotechnol. 2019, 94, 900–910. [Google Scholar] [CrossRef]
  39. Wongkiew, S.; Hu, Z.; Chandran, K.; Lee, J.W.; Khanal, S.K. Nitrogen transformations in aquaponic systems: A review. Aquac. Eng. 2017, 76, 9–19. [Google Scholar] [CrossRef] [Green Version]
  40. Md, E.E.A.; Anindya, N.; Subhas, C.M.; Lucy, B. A temperature-compensated graphene sensor for nitrate monitoring in real-time application. Sens. Actuators A Phys. 2018, 269, 79–90. [Google Scholar]
  41. Md, E.E.A.; Subhas, C.M.; Lucy, B. Imprinted polymer coated impedimetric nitrate sensor for real-time water quality moni-toring. Sens. Actuators B Chem. 2018, 259, 753–761. [Google Scholar]
  42. Md, E.E.A.; Li, X.; Subhas, C.M.; Lucy, B. Temperature compensated smart nitrate-sensor for agricultural industry. IEEE Trans. Ind. Electron. 2017, 64, 7333–7341. [Google Scholar]
  43. Md, E.E.A.; Li, X.; Asif, I.Z.; Subhas, C.M.; Lucy, B. Practical nitrate sensor based on electrochemical impedance measurement. In Proceedings of the International Instrumentation and Measurement Technology Conference, Taipei, Taiwan, 23–26 May 2016. [Google Scholar]
  44. Md, E.E.A.; Subhas, C.M. Detection methodologies for pathogen and toxins: A review. Sensors 2017, 17, 1885. [Google Scholar]
  45. Li, S.-J.; Zhao, G.-Y.; Zhang, R.-X.; Hou, Y.-L.; Liu, L.; Pang, H. A sensitive and selective nitrite sensor based on a glassy carbon electrode modified with gold nanoparticles and sulfonated graphene. Microchim. Acta 2013, 180, 821–827. [Google Scholar] [CrossRef]
  46. Wanga, P.; Wanga, M.; Zhoua, F.; Yanga, G.; Qua, L.; Miaoa, X. Development of a paper-based, inexpensive, and disposable electrochemical sensing platform for nitrite detection. Electrochem. Comm. 2017, 81, 74–78. [Google Scholar] [CrossRef]
  47. Hameed, R.A.; Medany, S.S. Construction of core-shell structured nickel@platinum nanoparticles on graphene sheets for electrochemical determination of nitrite in drinking water samples. Microchem. J. 2019, 145, 354–366. [Google Scholar] [CrossRef]
  48. Chen, X.; Pu, H.; Fu, Z.; Sui, X.; Chang, J.; Chen, J.; Mao, S. Real-time and selective detection of nitrates in water using gra-phene-based field-effect transistor sensors. Environ. Sci. Nano 2018, 5, 1990–1999. [Google Scholar] [CrossRef]
  49. Amanulla, B.; Palanisamy, S.; Chen, S.M.; Chiu, T.W.; Velusamy, V.; Hall, J.M.; Chen, T.W.; Ramaraj, S.K. Selective col-orimetric detection of nitrite in water using chitosan stabilised gold nanoparticles decorated reduced graphene oxide. Nat. Sci. Reports 2017, 7, 1–9. [Google Scholar]
  50. Hameed, R.A.; Medany, S.S. Sensitive nitrite detection at core-shell structured Cu@Pt nanoparticles supported on graphene. Appl. Surf. Sci. 2018, 458, 252–263. [Google Scholar] [CrossRef]
  51. Choosang, J.; Numnuam, A.; Thavarungkul, P.; Kanatharana, P.; Radu, T.; Ullah, S.; Radu, A. Simultaneous Detection of Ammonium and Nitrate in Environmental Samples Using on Ion-Selective Electrode and Comparison with Portable Colorimetric Assays. Sensors 2018, 18, 3555. [Google Scholar] [CrossRef] [PubMed] [Green Version]
  52. Chen, M.; Zhang, M.; Wang, X.; Yang, Q.; Wang, M.; Liu, G.; Yao, L. An All-Solid-State Nitrate Ion-Selective Electrode with Nanohybrids Composite Films for In-Situ Soil Nutrient Monitoring. Sensors 2020, 20, 2270. [Google Scholar] [CrossRef] [PubMed] [Green Version]
  53. Khanfar, M.F.; Al-Faqheri, W.; Al-Halhouli, A. Low Cost Lab on Chip for the Colorimetric Detection of Nitrate in Mineral Water Products. Sensors 2017, 17, 2345. [Google Scholar] [CrossRef] [Green Version]
  54. Prabhu, A.J.; Schrama, J.W.; Kaushik, S.J. Quantifying dietary phosphorus requirement of fish—a meta-analytic approach. Aquac. Nutr. 2013, 19, 233–249. [Google Scholar] [CrossRef]
  55. Hongwei, C.; Linlu, Z.; Fabiao, Y.; Qiaoling, D. Detection of phosphorus species in water: Technology and strategies. Analyst 2019, 144, 7130–7148. [Google Scholar]
  56. Environmental Impact of Nitrogen and Phosphorus Fertilisers in High Rainfall Areas. Available online: https://www.agric.wa.gov.au/high–rainfall-pastures/environmental–impact–nitrogen–and-phosphorus-fertilisers-high-rainfall-areas (accessed on 28 January 2021).
  57. Unni, S.; Lena, R.; Sanu, K.A.; Kamila, M.; Krishnapillai, G.K.; Hanna, R.; Stefan, K.; Jerzy, R. Ultrasensitive electrochemical sensing of phosphate in water mediated by a dipicolylamine-zinc(II) complex. Sens. Actuators B Chem. 2020, 321, 1–8. [Google Scholar]
  58. Mehenur, S.; Jared, L.; Ghinwa, M.N.; Chen-Zhong, L. Smart-phone, paper-based fluorescent sensor for ultra-low inorganic phosphate detection in environmental samples. Microsyst. Nanoeng. 2019, 5, 1–10. [Google Scholar]
  59. Sumaiya, I.; Nasim, R.; Jeong, J.; Lee, K. Sensing Technology for Rapid Detection of Phosphorus in Water: A Review. J. Biosyst. Eng. 2016, 41, 138–144. [Google Scholar]
  60. Kiesar, S.B.; Umesh, T.N.; Jin-Young, Y.; Yousheng, W.; Tahmineh, M.; Yoon-Bong, H. Nozzle-jet-printed silver/graphene composite-based field-effect transistor sensor for phosphate ion detection. ACS Omega 2019, 4, 8373–8380. [Google Scholar]
  61. Zhou, G.; Jin, B.; Wang, Y.; Dong, Q.; Maity, A.; Chang, J.; Ren, R.; Pu, H.; Sui, X.; Mao, S.; et al. Ultrasensitive sensors based on aluminum oxide protected reduced graphene oxide for phosphate ion detection in real water. Mol. Syst. Des. Eng. 2020, 5, 936–942. [Google Scholar]
  62. Mao, S.; Pu, H.; Chang, J.; Sui, X.; Zhou, G.; Ren, R.; Chen, Y.; Chen, J. Ultrasensitive detection of ortho-phosphate ions with reduced graphene oxide/ferritin field-effect transistor sensors. Environ. Sci. Nano 2017, 4, 856–863. [Google Scholar]
  63. Zhu, L.; Zhou, X.; Shi, H. A potentiometric cobalt-based phosphate sensor based on screen-printing technology. Front. Environ. Sci. Eng. 2014, 8, 945–951. [Google Scholar]
  64. Pankaj, K.; Dong, M.K.; Myong, H.H.; Yoon-Bo, S. An all-solid-state monohydrogen phosphate sensor based on a macrocyclic ionophore. Talanta 2010, 82, 1107–1112. [Google Scholar]
  65. John, J.W.; Paul, L.B. Fabrication, calibration and evaluation of a phosphate ion-selective microelectrode. Environ. Pollut. 2010, 158, 3612–3617. [Google Scholar]
  66. Stefano, C.; Daria, T.; Giuseppe, P.; Danila, M.; Fabiana, A. Novel reagentless paper-based screen-printed electrochemical sensor to detect phosphate. Anal. Chim. Acta 2016, 919, 78–84. [Google Scholar]
  67. Manová, A.; Beinrohr, E. Determination of phosphate in water by flow coulometry. Acta Chim. Slovaca 2020, 13, 102–107. [Google Scholar] [CrossRef]
  68. Luo, S.; Wu, B.; Xiong, X.; Wang, J. Effects of Total Hardness and Calcium:Magnesium Ratio of Water during Early Stages of Rare Minnows (Gobiocypris rarus). Comp. Med. 2016, 66, 181–187. [Google Scholar]
  69. Calcium and Magnesium Use in Aquaculture. Available online: https://www.aquaculturealliance.org/advocate/calcium-and-magnesium-use-in-aquaculture/ (accessed on 22 February 2021).
  70. Butler, D.H.; Koivisto, S.; Brumfeld, V.; Shahack-Gross, R. Early Evidence for Northern Salmonid Fisheries Discovered using Novel Mineral Proxies. Sci. Rep. 2019, 9, 1–12. [Google Scholar] [CrossRef] [Green Version]
  71. Arias, D.; Rivas, M.; Guinez, R.; Cisternas, L.A. Modeling the calcium and magnesium removal from seawater by immobilised biomass of ureolytic bacteria Bacillus subtilis through response surface methodology and artificial neural networks. Desalinat. Water Treat. 2018, 118, 294–303. [Google Scholar] [CrossRef]
  72. Joquiño, C.M.; Sarmiento, J.M.; Estaña, L.M.; Nañola, J.; Pedro, A.A. Seasonal Change, Fishing Revenues, and Nutrient In-takes of Fishers’ Children in Davao Gulf, Philippines. Philipp. J. Sci. 2021, 150, 307–323. [Google Scholar]
  73. Zhang, H.; Meng, Y.; Wang, Y.; Hu, X.; Wang, Y.; Huang, Y.; Zhou, Q.; Li, A.; Wang, L.; Xing, X. Correlation analysis between pH, major organic acids, calcium and magnesium ions of stratified bottom-pit-mud from Chinese strong-flavor Baijiu pit. Shipin Kexue/Food Sci. 2020, 41, 90–97. [Google Scholar]
  74. Hicks, C.C.; Cohen, P.J.; Graham, N.A.J.; Nash, K.L.; Allison, E.H.; D’Lima, C.; Mills, D.J.; Roscher, M.; Thilsted, S.H.; Thorne-Lyman, A.L.; et al. Harnessing global fisheries to tackle micronutrient deficiencies. Nat. Cell Biol. 2019, 574, 95–98. [Google Scholar] [CrossRef] [PubMed] [Green Version]
  75. Mozharovskaya, P.N.; Lykova, Y.A.; Semenishchev, V.S. Systematisation of chemical pollutants in samples of river water in Yekaterinburg city and Sverdlovsk Region. In Proceedings of the AIP Conference, Ekaterinburg, Russia, 20–23 May 2019. [Google Scholar]
  76. Moshoeshoe, M.N.; Obuseng, V. Simultaneous determination of nitrate, nitrite and phosphate in environmental samples by high performance liquid chromatography with UV detection. S. Afr. J. Chem. 2018, 71, 79–85. [Google Scholar] [CrossRef] [Green Version]
  77. Drolc, A.; Vrtovšek, J. Nitrate and nitrite nitrogen determination in wastewater using on-line UV spectrometric method. Bioresour. Tech. 2010, 101, 4228–4233. [Google Scholar] [CrossRef]
  78. Alahi, M.E.E.; Mukhopadhyay, S.C. Detection methods of nitrate in water: A review. Sens. Actuators A Phys. 2018, 280, 210–221. [Google Scholar] [CrossRef]
  79. Azmi, A.; Azman, A.A.; Kaman, K.K.; Ibrahim, S.; Mukhopadhyay, S.C.; Nawawi, S.W.; Yunus, M.A.M. Performance of Coating Materials on Planar Electromagnetic Sensing Array to Detect Water Contamination. IEEE Sens. J. 2017, 17, 5244–5251. [Google Scholar] [CrossRef]
  80. Coppola, L.; Legendre, L.; Lefevre, D.; Prieur, L.; Taillandier, V.; Riquier, E.D. Seasonal and inter-annual variations of dissolved oxygen in the northwestern Mediterranean Sea (DYFAMED site). Prog. Oceanogr. 2018, 162, 187–201. [Google Scholar] [CrossRef]
  81. Boyd, C.E.; Torrans, E.L.; Tucker, C.S. Dissolved Oxygen and Aeration in Ictalurid Catfish Aquaculture. J. World Aquac. Soc. 2018, 49, 7–70. [Google Scholar] [CrossRef]
  82. Kralj, M.; Lipizer, M.; Čermelj, B.; Celio, M.; Fabbro, C.; Brunetti, F.; Francé, J.; Mozetič, P.; Giani, M. Hypoxia and dissolved oxygen trends in the northeastern Adriatic Sea (Gulf of Trieste). Deep. Sea Res. Part II Top. Stud. Oceanogr. 2019, 164, 74–88. [Google Scholar] [CrossRef]
  83. Ren, Q.; Zhang, L.; Wei, Y.; Li, D. A method for predicting dissolved oxygen in aquaculture water in an aquaponics system. Comput. Electron. Agric. 2018, 151, 384–391. [Google Scholar] [CrossRef]
  84. Ta, X.; Wei, Y. Research on a dissolved oxygen prediction method for recirculating aquaculture systems based on a convolution neural network. Comput. Electron. Agric. 2018, 145, 302–310. [Google Scholar] [CrossRef]
  85. Parra, L.; Lloret, G.; Lloret, J.; Rodilla, M. Physical Sensors for Precision Aquaculture: A Review. IEEE Sens. J. 2018, 18, 3915–3923. [Google Scholar] [CrossRef] [Green Version]
  86. Defe, G.A.; Antonio, A.Z.C. Multi-parameter Water Quality Monitoring Device for Grouper Aquaculture. In Proceedings of the 2018 IEEE 10th International Conference on Humanoid, Nanotechnology, Information Technology, Communication and Control, Environment and Management (HNICEM), Baguio, Philippines, 29 November–2 December 2018; IEEE: Piscataway, NJ, USA, 2018; pp. 1–5. [Google Scholar]
  87. Kramer, D.L. Dissolved oxygen and fish behavior. Environ. Boil. Fishes 1987, 18, 81–92. [Google Scholar] [CrossRef]
  88. Franklin, P. Dissolved oxygen criteria for freshwater fish in New Zealand: A revised approach. New Zealand J. Mar. Freshw. Res. 2013, 48, 112–126. [Google Scholar] [CrossRef]
  89. Honglin, Z.; Zhiguo, Z. Ratiometric sensor based on PtOEP-C6/Poly (St-TFEMA) film for automatic dissolved oxygen content detection. Sensors 2020, 20, 6175. [Google Scholar]
  90. Lola, G.O.; Alba, R.O.; Petra, J.C.; Mirella, D.L. Ceramic soil microbial fuel cells sensors for early detection of eutrophication. Proceedings 2020, 60, 1–12. [Google Scholar]
  91. Selvaraj, C.; Sumit, K.; Gert-Jan, W.E. Fabrication of a nitrogen and Boron-doped reduced graphene oxide membrane-less amperometric sensor for measurement of dissolved oxygen in a microbial fermentation. Chemosensors 2020, 44, 1–10. [Google Scholar]
  92. Zike, J.; Xinsheng, Y.; Shikui, Z.; Yingyan, H. Ratiometric dissolved oxygen sensors based on ruthenium complex doped with silver nanoparticles. Sensors 2017, 17, 548. [Google Scholar]
  93. Manuel, V.; Ryan, K.W.; Barbara, A.B.; Jose, E.C. Machine learning based predictions of dissolved oxygen in a small coastal embayment. J. Mar. Sci. Eng. 2020, 1007, 1–16. [Google Scholar]
  94. Rune, I.; Emil, M.; Jonas, H.; Ole, B.; Jakob, J. Optimisation of all-polymer optical fiber oxygen sensors with antenna dyes and improved solvent selection using hansen solubility parameters. Sensors 2021, 21, 5. [Google Scholar]
  95. Salvatore, G.L.; Maryam, B.; Kaushik, G.; Ashish, K.D.; Luca, L.; Nicola, D.; Giovanni, N. Development of a Novel Cu(II) Complex Modified Electrode and a Portable Electrochemical Analyzer for the Determination of Dissolved Oxygen (DO) in Water. Chemosensors 2016, 7, 1–10. [Google Scholar]
  96. Fowzia, A.; Sam, K.; Hasin, R.S.; Md, E.E.A.; Subhas, C.M. IoT enabled intelligent sensor node for smart city: Pedestrian counting and ambient monitoring. Sensors 2019, 19, 3374. [Google Scholar]
  97. Fowzia, A.; Sam, K.; Jordan, L.; Hasin, R.S.; Md, E.E.A.; Subhas, C.M. Design and development of an IoT enabled pedestrian counting and environmental monitoring system for a smart city. In Proceedings of the 13th International Conference on Sensing Technology (ICST), Sydney, Australia, 2–4 December 2019. [Google Scholar]
  98. Lina, R.; Anitha, M. Sensor data classification using machine learning algorithm. J. Stat. Manag. Syst. 2020, 23, 363–371. [Google Scholar]
  99. Demi, A.; Nico, S. Hydroponic nutrient control system based on internet of things. In Proceedings of the International Conference on Computer, Control, Informatics and Its Applications (IC3INA), Tangerang, Indonesia, 23–24 October 2019. [Google Scholar]
  100. Jaime, V.; Francesc, P.; Diego, A.T.; Maribel, A. A sensor data fusion system based on k-nearest neighbor pattern classification for structural health monitoring applications. Sensors 2017, 17, 417. [Google Scholar]
  101. Hristos, T.; Georgia, P.; Andreas, L. A brief review of random forests for water scientists and practitioners and their recent history in water resources. Water 2019, 11, 1–37. [Google Scholar]
  102. Devi, S.V.S.G. Random forest advice for water quality prediction in the regions of Kadapa district. Int. J. Innov. Technol. Explor. Eng. 2019, 8, 1–3. [Google Scholar]
  103. Shajulin, B.; Nila, G.; Deepak, G.; Sreelakshmi, N. Real time water quality analysis framework using monitoring and prediction mechanisms. In Proceedings of the Conference on Information and Communication Technology (CICT), Jabalpur, India, 26–28 October 2018. [Google Scholar]
  104. Kangyang, C.; Hexia, C.; Chuanlong, Z.; Yichao, H.; Xiangyang, Q.; Ruqin, S.; Fengrui, L.; Min, Z.; Xinyi, Z.; Jinfeng, W.; et al. Comparative analysis of surface water quality prediction performance and identification of key water parameters using different machine learning models based on big data. Water Res. 2020, 171, 1–10. [Google Scholar]
  105. Consolata, G.; Jeniffer, J. A classification model for water quality analysis using decision tree. Eur. J. Comput. Sci. Inf. Technol. 2019, 7, 1–8. [Google Scholar]
  106. Hao, L.; Wen, S. Forecasting and evaluating water quality of Chao lake based on an improved decision tree method. Procedia Environ. Sci. 2010, 2, 970–979. [Google Scholar]
  107. Saghebian, S.M.; Sattari, M.T.; Rasoul, M.; Mahesh, P. Ground water quality classification by decision tree method in Ardebil region, Iran. Arab. J. Geosci. 2014, 7, 4767–4777. [Google Scholar] [CrossRef]
  108. Saptami, R.; Protik, C.B.; Md, A.H.; Md, R.I.; John, C. Polynomial regression of multiple sensing variables for high-performance smartphone colorimeter. OSA Contin. 2021, 4, 374–384. [Google Scholar]
  109. Huang, H.; Wang, Z.; Xia, F.; Shang, X.; Liu, Y.; Zhang, M.; Dahlgren, R.A.; Mei, K. Water quality trend and change-point analyses using integration of locally weighted polynomial regression and segmented regression. Environ. Sci. Pollut. Res. 2017, 24, 15827–15837. [Google Scholar] [CrossRef] [PubMed] [Green Version]
  110. Mohammad, R.B.; Roohollah, N.; Ronny, B.; Alireza, G.; Behzad, G. Evolutionary polynomial regression approach to predict longitudinal dispersion coefficient in rivers. J. Water Supply Res. Technol. AQUA 2018, 67, 1–11. [Google Scholar]
  111. Wei-Chih, H.; Pao-Yuan, C.; Chia-Sui, W.; Jen-Chieh, H.; Wesley, H. Application of regression analysis to achieve a smart monitoring system for aquaculture. Information 2020, 387, 1–9. [Google Scholar]
  112. Krishnan, K.S.D.; Bhuvaneswari, P.T.V. Multiple linear regression based water quality parameter modeling to detect hexa-valent chromium in drinking water. In Proceedings of the International Conference on Wireless Communications, Signal Processing and Networking (WiSPNET), Chennai, India, 22–24 March 2017. [Google Scholar]
  113. Reham, E.K. Using regression analysis to estimate water quality constituents in Bahr El Baqar drain. J. Appl. Sci. Res. 2009, 5, 1067–1076. [Google Scholar]
  114. Wei-Bo, C.; Wen-Cheng, L. Water quality modeling in reservoirs using multivariate linear regression and two neural network models. Adv. Artif. Neural Syst. 2015, 521721, 1–12. [Google Scholar]
  115. Abbaa, S.I.; Hadia, S.J.; Abdullah, J. River water modelling prediction using multi-linear regression, artificial neural network, and adaptive neuro-fuzzy inference system techniques. In Proceedings of the 9th International Conference on Theory and Application of Soft Computing, Computing with Words and Perception (ICSCCW), Budapest, Hungary, 24–25 August 2017. [Google Scholar]
  116. Tao, X.F.; Huang, T.; Li, X.F.; Peng, D.P. Application of a PCA based water quality classification method in water quality assessment in the Tongjiyan Irrigation Area, China. In Proceedings of the International Conference on Energy and Environmental Protection (ICEEP), Shenzhen, China, 17–18 September 2016. [Google Scholar]
  117. Salim, A.B.; Gowhar, M.; Sayar, Y.; Ashok, K.P. Statistical assessment of water quality parameters for pollution source identification in sukhnag stream: An inflow stream of lake Wular (Ramsar Site), Kashmir Himalaya. J. Ecosyst. 2014, 898054, 1–18. [Google Scholar]
  118. Mahapatra, S.S.; Sahu, M.; Patel, R.K.; Panda, B.N. Prediction of Water Quality Using Principal Component Analysis. Water Qual. Expo. Health 2012, 4, 93–104. [Google Scholar] [CrossRef]
  119. Carlos, A.B.G.; Helenice, L.G.; Maria, C.S.; Anamália, F.S.; José, P.H.A.; Silvânio, S.L.C.; Geovanny, O.A.; Igor, S.S. Assessment of water quality using principal component analysis: A case study of the açude da Macela—Sergipe—Brazil. In Proceedings of the 16th International World Water Congress (IWRC), Cancum, Mexico, 29 May–3 June 2017. [Google Scholar]
  120. Emerson, N.; Nuno, C.; António, P. A Systematic Review of IoT Solutions for Smart Farming. Sensors 2020, 20, 2345. [Google Scholar]
  121. Md, E.E.A.; Najid, P.I.; Subhas, C.M.; Lucy, B. An internet-of-things enabled smart sensing system for nitrate monitoring. IEEE Internet Things J. 2018, 5, 4409–4417. [Google Scholar]
  122. SEAFLO 21 Series Diaphragm Pump 12V. Available online: https://12voltpumps.com.au/product/12v-21-series-diaphragm-pump-sfdp1-010-035-21-seaflo/ (accessed on 28 January 2021).
  123. Stepper Motor Controller Module for Arduino Projects. Available online: https://www.auselectronicsdirect.com.au/stepper-motor-controller-module-for-arduino-projec?gclid=Cj0KCQiA3smABhCjARIsAKtrg6LbnXTiUl9Rt4UCoPRYiUTLWGviqctaB_ilo-f3IJpFNeQ6Pp2DgwEaAtsDEALw_wcB (accessed on 28 January 2021).
  124. AD5933. Analogue Devices, 1 MSPS, 12-Bit Impedance Converter, Network Analyzer. Available online: https://www.analog.com/media/en/technical-documentation/data-sheets/AD5933.pdf (accessed on 28 January 2021).
  125. Arduino Uno Rev3. Available online: https://core-electronics.com.au/arduino-uno-r3.html (accessed on 28 January 2021).
  126. Lora Shield for Arduino—Long Range Transceiver. Available online: https://www.iot-store.com.au/products/lora-shield-for-arduino-long-range-transceiver (accessed on 28 January 2021).
  127. 12V 10W Solar Panel with Clips. Available online: https://www.jaycar.com.au/12v-10w-solar-panel-with-clips/p/ZM9051?gclid=Cj0KCQiA3smABhCjARIsAKtrg6JvnJioP4MJkkjeCcEs6E0V7_mhCHOc0f7f-R7TsYnqDVc_OIZX3yIaAsc2EALw_wcB (accessed on 28 January 2021).
  128. 12V 12Ah SLA Battery. Available online: https://www.jaycar.com.au/12v-12ah-sla-battery/p/SB2489 (accessed on 28 January 2021).
  129. 12/24V 10A Dual Battery PWM Solar Charge Controller with LED Indicator. Available online: https://www.jaycar.com.au/12-24v-10a-dual-battery-pwm-solar-charge-controller-with-led-indicator/p/MP3760 (accessed on 28 January 2021).
  130. Fowzia, A.; Anindya, N.; Md, E.E.A.; Hangrui, L.; Subhas, C.M. Electrochemical detection of calcium and magnesium in water bodies. Sens. Actuators A Phys. 2020, 305, 1–10. [Google Scholar]
  131. Anindya, N.; Md, E.E.A.; Shilun, F.; Subhas, C.M. IoT-based sensing system for phosphate detection using Graphite/PDMS sensors. Sens. Actuators A Phys. 2019, 286, 43–50. [Google Scholar]
  132. Anindya, N.; Omer, F.D.; Subhas, M.; Jurgen, K. pH sensing of printed flexible sensors. In Proceedings of the 12th Inter-national Conference on Sensing Technology (ICST), Limerick, Ireland, 4–6 December 2018. [Google Scholar]
Figure 1. A typical diagram of smart fisheries.
Computers 10 00026 g001
Figure 2. Influence of water temperature on fish lives.
Computers 10 00026 g002
Figure 3. A typical example of nitrate leaching and the nitrogen cycle.
Computers 10 00026 g003
Figure 4. Dissolved oxygen and its effect.
Computers 10 00026 g004
Figure 5. (a) Block diagram of the proposed system, (b) connection diagram of the system, (c) inset of the proposed system, and (d) the final prototype installed for monitoring water quality.
Computers 10 00026 g005aComputers 10 00026 g005b
Figure 6. Sensor data collected into ThingSpeak server—(a) temperature, (b) nitrate, (c) phosphate, (d) calcium, (e) magnesium, (f) pH, and (g) dissolved oxygen (DO).
Computers 10 00026 g006aComputers 10 00026 g006b
Table 1. Temperature requirement for different fishes.
Type of FishOptimum Temperature Range (°C)
Crappie22~24
Smallmouth Bass18~21
Largemouth Bass18~23
Walleye18~21
White Bass18~21
Rock Bass21~23
Channel Catfish28~31
Rainbow Trout16~17
Brown Trout13~19
Yellow Perch20~22
Lake Trout10~13
Steelhead Trout13~16
Chinook and Coho Salmon13~15
Table 2. Impact of pH level on aquaculture.
Value of pHImpact on Warm-Water Fish
Less than 4.0Reach to the point of acid death
4.0 to 5.0Not productive
6.5 to 9.0Fish production desirable range
9.0 to 11.0Slow growth
Greater than 11.0Reach to an of alkaline death
Table 3. Optimum pH level for various freshwater fish.
Name of the FishOptimum pH Level
Zebra Danio6.5–7.0
Tiger Barb6.0–6.5
Silver Dollar 6.0–7.0
Plecostomus 5.0–7.0
Neon Tetra 5.8–6.2
Hatchet fish6.0–7.0
Harlequin Rasbora 6.0–6.5
Goldfish7.0–7.5
Clown Loach 6.0–6.5
Angelfish 6.5–7.0
Table 4. A comparative study on the water pH level measurement.
Sensing MaterialDetection RangeDetection LimitRef
Ag/AgCl4.01–6.864.01[31]
Platinum4–104[32]
SEN-10972 (commercial)1–141[33]
Colorimetric pH sensor1–101[34]
Polysulfone/Polyaniline4–124[35]
Ruthenium (IV) oxide (RuO2)1.5–121.51[36]
Table 5. Optimum nitrite and nitrate levels for freshwater fishes.
ParameterFreshwater CommunityBrackishDiscusAfrican Cichlids
Nitrate (ppm)<50 <30 <10 <50
Nitrite (ppm)0.0~0.2 0.0 0.00.0
Table 6. A comparative study on nitrate detection in water.
Sensing MaterialDetection RangeDetection LimitRef
AuNps/SG10~39600.2[45]
AuNps/Graphene sheet0.3~7200.1[46]
Ni@Pt/Graphene sheet10~150010[47]
rGO/TEBAC0.2~2000.2[48]
AuNPs/rGO0.1~200.1[49]
Cu@Pt/Graphene1~10001[50]
MMA-DMA copolymer0.5~10 0.55[51]
AuNPs/ERGO0.1~10 M0.1[52]
Colorimetric 0.03~5.190.03[53]
Table 7. A summary of the existing phosphate sensor applicable to water bodies.
Sensing MaterialDetection RangeDetection LimitRef
Ag/rGO5~6000 1.20[60]
Al2O3/rGO1~101[61]
rGO/ferritin16.7~5000.806 [62]
Co/Pt/C/Ag-AgCl1~95000.3[63]
Poly vinyl chloride/Polyurethane0.096~9600.096[64]
Cobalt/Glass1~33000.08[65]
Wax paper4~3004 [66]
Coulometric titration1.5~55 1.5[67]
Table 8. Preferred calcium and magnesium concentrations for various aquariums.
ParameterCoral ReefsFOWLR AquariumReef Aquarium
Calcium (ppm)380~420 350~450 350~450
Magnesium (ppm)1300 1150~1350 1250~1350
Table 9. A summary of the existing dissolved oxygen sensor.
Sensing MaterialDetection RangeDetection LimitRef
PtOEP-C6/Poly
(St-TFEMA)
0.1~39.30.1[89]
Ceramic Soil Microbial Fuel Cells1.0~10.01.0[90]
Nitrogen and Boron-Doped Reduced
Graphene Oxide Membrane-Less
1.5~10.01.5[91]
Ruthenium Complex Doped with
Silver Nanoparticles
1.0~15.01.0[92]
Seabird 63 DO1.0~10.01.0[93]
Polymer Optical Fibers (POF)1.0~10.01.0[94]
Cu (II) Complex Modified
Electrode
2.1~8.52.1[95]
Publisher’s Note: MDPI stays neutral with regard to jurisdictional claims in published maps and institutional affiliations.

