Abstract
Hepatocellular carcinoma (HCC) remains a difficult disease to study even after a decade of genomic analysis. Patient and disease heterogeneity, differences in statistical methods and multiple testing issues have resulted in a fragmented understanding of the molecular basis of tumor biology. Some researchers have suggested that HCC appears to share pathways with embryonic development. Therefore we generated targeted hypotheses regarding changes in developmental genes specific to the liver in HCV-cirrhosis and HCV-HCC. We obtained microarray studies from 30 patients with HCV-cirrhosis and 49 patients with HCV-HCC and compared to 12 normal livers. Genes specific to non-liver development have known associations with other cancer types but none were expressed in either adult liver or tumor tissue, while 98 of 179 (55%) genes specific to liver development had differential expression between normal and cirrhotic or HCC samples. We found genes from each developmental stage dysregulated in tumors compared to normal and cirrhotic samples. Although there was no single tumor marker, we identified a set of genes (Bone Morphogenetic Protein inhibitors GPC3, GREM1, FSTL3, and FST) in which at least one gene was over-expressed in 100% of the tumor samples. Only five genes were differentially expressed exclusively in late-stage tumors, indicating that while developmental genes appear to play a profound role in cirrhosis and malignant transformation, they play a limited role in late-stage HCC.
1. Introduction
1.1. Background and Motivation
Hepatocellular Carcinoma (HCC) ranks fifth among all cancers and third in mortality, accounting for hundreds of thousands of deaths per year. One-year survival rates remain less than 50% in the United States, despite advances in therapy [1]. HCC is the primary cancer morbidity evolving over decades in underlying hepatitis C (HCV) liver pathology in North America and Japan. HCC development is generally thought to be a multistep process resulting from hepatocyte turnover, chronic inflammation, regeneration, oxidative stress, DNA damage, and cirrhosis, as well as direct viral injuries. Unfortunately, the specific molecular mechanisms underlying hepatocarcinogenesis remain unclear.
In the last ten years, microarray technology has been a powerful tool to study the molecular basis of disease. By measuring whole-genome transcript levels, expression patterns associated with liver dysfunction have been examined. However, HCC remains a difficult disease to study, with widely variable findings between studies and several proposed non-overlapping gene signatures [2,3,4,5,6,7,8,9,10,11,12]. This is likely due not only to the biological heterogeneity of HCC pathogenesis, but also reflects the varied clinical background of patients and variation in statistical technique. There are significant statistical challenges which plague the analysis and interpretation of microarray experiments. Differences in technique in every stage of data pre-processing have been demonstrated to dramatically affect the end results, including background correction [13], normalization [14,15], and probe set summarization [16].
In addition, traditional statistical approaches are not particularly well-suited to cancer genomic data. When simultaneously comparing many thousands of genes, multiple testing problems are considerable. Worse, because the assumption of independent tests is often violated, actual false positive rates can be much higher than estimated by standard methods [13,14,15]. This implies that, even using conservative multiple testing correction methods, cancer studies which generate thousands of significantly differentially expressed genes could have several hundred false positive results. To reduce this problem, we used a knowledge-driven approach, using what is already known about normal and disease processes to generate hypotheses that can be tested with a relatively small number of statistical tests [17,18,19].
Another difficulty stems from the heterogeneity of cancer processes, in which changes in the expression of important genes occur only in subsets of tumors. This results in skewed density curves (sometimes even bi-modal) that may not be easily detected by means-based tests. Most statistical tests in common use are based on comparing the magnitude of mean change relative to the variation. These tests also place focus on the largest magnitude changes which are often products of tumor behavior, such as increased metabolism and cell proliferation/turnover, rather than drivers that often have smaller fold-changes [20]. We suspect that there are modest changes in the expression of critical genes that may be difficult to distinguish from “noise” in the data, but may have a significant impact on tumor development [21,22]. To address this we applied techniques that find patterns in the data (such as dimension reduction techniques), focused on such genes, to identify those that drive tumor behavior even if they have modest expression changes or skewed distribution patterns.
1.2. Questioning Biological Randomness in HCV-HCC
Tumors are widely believed to arise through an accumulation of random mutations. Mutations and chromosomal instability have been demonstrated in several carcinomas, including non-Hodgkins lymphoma, ovarian, colorectal, and oral tissue types [23,24,25,26,27]. HCC arising from chronic HBV infection has also been associated with mutations via HBx gene interference with p53 binding, leading to faulty DNA repair mechanisms [28,29]. It would be natural to think that the widespread dysregulation of gene expression in HCV-HCC is also largely random. However, HCV-HCC may be unusual because hepatitis C is an RNA virus that codes proteins that have direct interaction with over thirty host proteins. Tumors emerge from an environment of decades of host response to infection and liver damage. Therefore we hypothesize that induction of HCC in chronic HCV liver pathology may depend more on host response to chronic infection and HCV-host interactions than on direct DNA damage. If this is true, the effects of the HCV virus will be seen in the perturbation of the “tools at hand”: gene expression changes that might be expected include modified expression of genes already in use in the liver (including genes expressed by activated hepatic stellate cells), target genes of host proteins that HCV proteins interact with, and genes used in the liver’s own life history. Such genes contain the specific transcription factor binding sites (TFBS) that are responsive to the transcription factors expressed in the liver, while genes that are not normally expressed in the liver are responsive to different promoters. For instance, the promoter region for FGF7 (expressed in the embryonic liver) contains binding sequences for ATF2, FOXD1, HNF3B, STAT3, and JUN which are all expressed in the liver and dysregulated in liver disease. This reasoning also implies that genes never expressed by a healthy liver would not be expected to be activated by HCV-induced tumors to the same extent as in HBV-HCC or other cancers.
To further target our hypotheses, we reviewed the current knowledge of processes involved in HCC. For instance, it has recently been noted that there appear to be pathways common to both cancer and embryonic development in HCC and other cancers [30,31]. In the context of the hypothesis of non-random response to HCV as described above, this led us to question whether any developmental genes involved in HCC are specific to liver development, and if paralog genes (similar in structure and function in other tissues) remain dormant. In this paper we demonstrate that HCV-induced liver cirrhosis and HCC do indeed show a general pattern of differential expression of liver development genes compared to paralog genes that have similar roles in the development of other tissues. Many of these developmental genes are up- or down-regulated in cirrhotic livers in a coherent way (clustering closely together), then degenerating into widely variable expression patterns in tumors. Some of the genes identified in this manner are already associated with HCC, while others appear to be novel. We also observed that some of these important embryonic signals are secreted from mesodermal tissues during development. These same signaling molecules may be secreted from mesodermally-derived stellate cells in adults. However, these cells comprise less than five percent of adult liver volume, which may result in an observed low signal that may have been difficult to distinguish from noise in previous studies.
1.3. Overview of Liver Development
Liver development is a multi-stage process orchestrated by nearly 200 master regulators, growth factors, and their receptors. Growth factors secreted externally and from within the developing liver bind receptors on the surface of liver cells, which transduce signals to transcription factors (TFs) within the nucleus. These transcription factors, either individually or as co-factors, regulate a complex program of inducing or repressing access to gene transcription by a number of activities including chromatin decompaction, recruitment of chromatin remodeling complexes, and histone marker methylation, demethylation, or acetylation, as well as by physically blocking or recruiting RNA polymerase. For example, some of the earliest TFs that induce hepatic fate from the endoderm (FOXA1-3, GATA4/6) open the chromatin structure around early hepatic markers such as albumin and alpha fetoprotein (AFP), while β-catenin (CTNNB1), LEF1, and TCF3 recruit chromatin remodeling complexes, and ARID5B and ATF2 modify histone markers of target genes. See Si-Tayeb et al. for a recent review [32] of embryonic liver development.
In the neonatal period, many of these regulators are repressed in most parts of the liver, while others maintain some level of activity throughout adult life either playing roles in metabolism and homeostasis or in maintaining niches of hepatic stem cells.
2. Results
2.1. Description of Patient Population
Microarray studies were obtained over a 10 year period from 180 samples of cirrhotic tissue and tumors collected from 140 patients with chronic HCV infection. As described in the Experimental Section, stringent quality control criteria were applied minimize technical artifacts, leaving us with 30 HCV-cirrhosis (CIR) and 49 HCV-HCC (HCC) tumors. These were compared to a control group of 12 samples taken from non-diseased, deceased donor livers (NOR). Tissue was obtained from 31 early HCC (stage T1 and T2) and 18 late HCC (T3 and T4). Twenty-nine HCC patients were transplanted, six died on the waiting list and 14 were never listed for transplant due to age, stage of cancer, or other co-morbidities.
2.2. Differentially Expressed Genes Are Specific to Liver Development
We hypothesized that genes not normally expressed in adult livers are less likely to be transcriptionally activated in HCV-HCC. To test this, we identified a set of genes with zero counts in an RNA sequencing study on a normal liver sample. 1,399 were represented on the Affymetrix U133Av2 genechip. We tested for expression in HCC compared to normal samples in our dataset using a one-sided Kolmogorov-Smirnov (K-S) test of identical distribution. Of the 1,399 genes, none were expressed in the HCC samples (α < 0.001).
More specifically, we wished to determine whether the general developmental pathways altered in HCC were using genes specific to liver development, or whether any member of the gene family might be engaged. To examine this, we identified 26 paralog genes that have highly related developmental functions in other tissues that are not expressed in normal healthy livers (based on the RNA sequencing data and verified with a literature search). In our data, no paralogs were expressed in HCC compared to normal samples (α < 0.001) (Supplementary Table S1, column A). We validated this to an independently collected HCV-HCC dataset from Wurmbach et al. (see Experimental Section), which also had no expression of these paralog genes (Supplementary Table S1, column B). Next, we compared the expression patterns of liver genes to their non-liver paralogs in tumors. Most (31/33, 94%) of the liver genes had significantly different expression distributions compared to their paralog (Supplementary Table S1, column C). Figure 1 shows examples of the typically observed patterns of expression and poor regulation. Even when a liver gene is not differentially expressed in HCC, it often seems to be more poorly regulated with a wider distribution pattern than is seen in normal tissue.
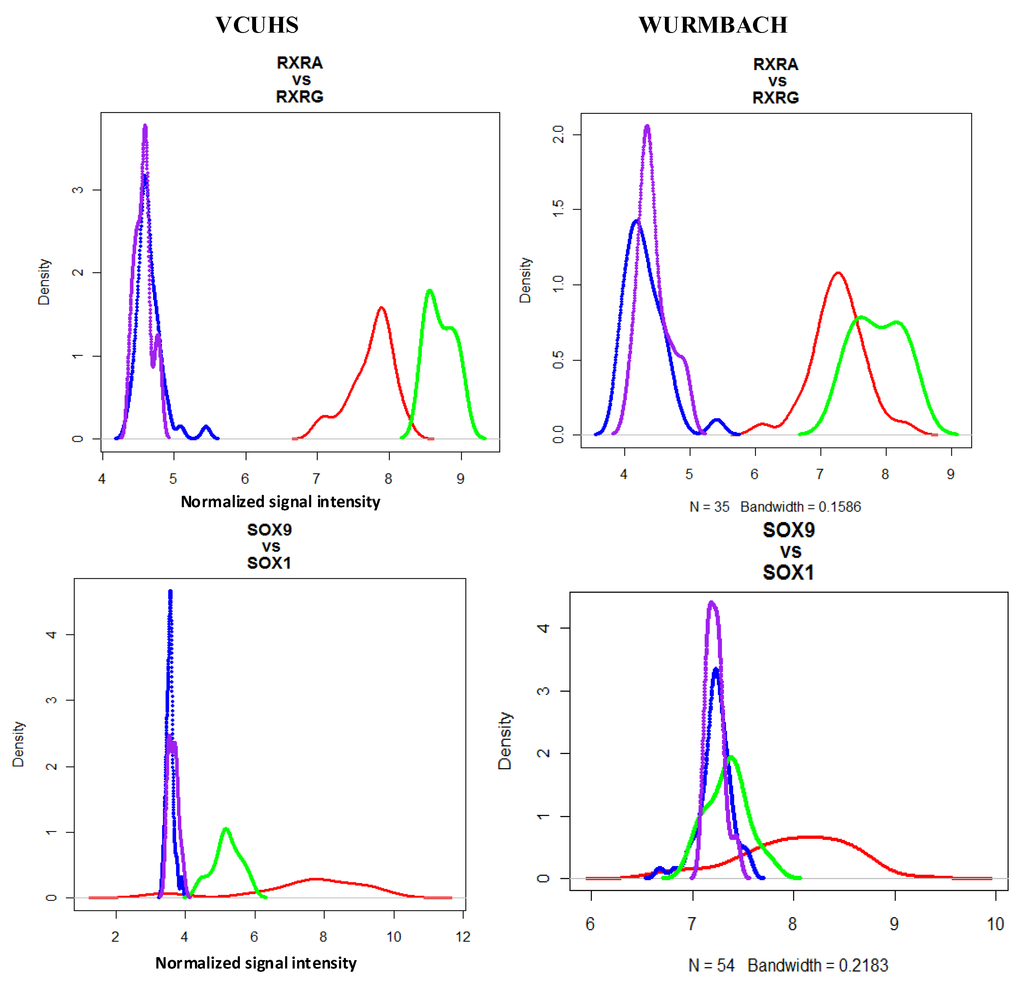
Figure 1.
Selected density plots of liver development vs. paralog non-liver development genes. Expression densities are shown for gene pairs in normal and HCC samples from our data and in the Wurmbach dataset. Red = expression of the liver gene in HCC; Green = expression of liver gene in normal controls; Blue = expression of non-liver gene in HCC; Purple = expression of non-liver gene in normal controls. Paralog genes (RXRG and SOX1) were not expressed in HCC or normal samples, while liver development genes RXRA and SOX9 were differentially expressed in HCC. These patterns were also observed in the Wurmbach dataset.
2.3. Patterns of Expression in HCV-Cirrhosis and HCV-HCC
We then identified patterns of expression for liver development genes in HCV-CIR and HCV-HCC. To capture changes in either mean or variation, we assessed significance with a combined p-value from both t and F tests. We were particularly interested in whether the genes associated with progression from cirrhosis to cancer were those particular to a certain developmental stage. However, differentially expressed genes were found from all stages of development, and PCA plots of stage-specific genes all showed discrimination between normal, cirrhotic, and tumor samples (data not shown).
Twenty-nine developmental genes had a pattern of higher magnitude over-expression in cirrhosis, then declining values in HCC (Table 1). These include several extra-cellular matrix (ECM) genes and members of the TGFβ/BMP signaling pathway. Transcription factors following this expression pattern include SOX9, GATA6, HAND2, and IRS2. The only genes differentially expressed between early (T1 and T2) and late-stage (T3 and T4) tumors were EPCAM and tumor suppressor KLF6. Nine genes were down-regulated in cirrhosis and remained low in tumors: transcription factors FOXA1, FOXA2, GATA4, HNF1A and STAT3; growth factor receptors ACVR2B, RXRA; signaling molecule NRTN, and MMP15, which degrades intracellular matrix proteins.

Table 1.
Liver development genes with significantly higher expression in cirrhosis than tumor samples. Fold-changes are relative to normal samples.
| Gene | Gene Name | Gene Function | Mean FC | Mean FC | Mean FC |
|---|---|---|---|---|---|
| CIR | Early HCC | Late HCC | |||
| EPCAM | Epithelial cell adhesion molecule | ECM | 14.8 | 14.0 | 5.7 * |
| MMP7 | Matrix metalloproteinase 7 | ECM | 7.5 | 6.1 * | 3.5 * |
| KRT19 | Cytokeratin-19 | Epidermal IF | 6.0 | 2.9 * | 1.8 * |
| MMP2 | Matrix metalloproteinase 2 | ECM | 5.4 | 4.8 * | 3.0 * |
| VIM | Vimentin | Mesenchymal IF | 5.8 | 5.2 * | 4.8 * |
| SOX9 | SRY-box 9 | TF | 4.9 | 3.2 * | 2.9 * |
| LAMA2 | Laminin alpha 2 | ECM | 4.4 | 2.3 * | 1.9* |
| FGFR2 | Fibroblast Growth Factor Receptor 2 | GF receptor | 4.3 | 2.4 * | 1.8 * |
| KLF6 | Kruppel-like factor 6 | TF | 3.9 | 2.6 * | 1.8 * |
| COL4A2 | Collagen IV alpha 2 | ECM | 3.9 | 2.6 * | 2.3 * |
| LAMB1 | Laminin beta 2 | ECM | 3.5 | 2.8 * | 1.5 * |
| ARID5B | AT rich interactive domain 5B | TF | 3.4 | 1.8 * | 1.7 * |
| FSTL3 | Follistatin-like protein 3 | GF antagonist | 3.4 | 1.7 * | 1.5 * |
| TGFB1 | Transforming growth factor, beta 1 | GF | 3.2 | 2.1 * | 1.5 * |
| SMAD7 | SMAD family member 7 | Signal transduction | 3.2 | 1.9 * | 1.4 * |
| CITED2 | CBP/p300-interacting transactivator | TF | 2.8 | 2.0 * | 1.7 * |
| GATA6 | GATA binding protein 6 | TF | 2.8 | 1.6 * | 0.9 * |
| SFRP5 | Secreted frizzled-related protein 5 | Wnt inhibitor | 2.6 | 1.8 * | 1.5 * |
| ID3 | Inhibitor of DNA binding 3 | TF antagonist | 2.4 | 1.7 * | 1.3 * |
| LAMC3 | Laminin gamma 3 | ECM | 2.4 | 1.9 * | 1.3 * |
| HAND2 | Heart- and neural crest derivatives-expressed protein 2 | ECM | 2.2 | 1.7 * | 1.4 * |
| NDN | Necdin | TF | 2.2 | 1.3 * | 1.3 * |
| PTN | Pleiotrophin | GF | 2.1 | 1.6 * | 1.4 * |
| ZBTB20 | Zinc finger and BTB domain containing 20 | TF | 2.1 | 1.4 * | 1.3 * |
| CDH1 | Cadherin 1 | ECM | 1.8 | 1.5 * | 1.5 * |
| FGF7 | Fibroblast growth factor 7 | GF | 1.7 | 1.3 * | 1.2 * |
| BMP2 | Bone morphogenic protein 2 | GF | 1.6 | 1.4 * | 1.3 * |
| COL4A4 | Collagen IV alpha 4 | ECM | 1.6 | 1.2 * | 1.2 * |
| CSNK1D | Casein kinase I isoform delta | kinase | 1.5 | 1.1 * | 1.0 * |
| IRS2 | Insulin receptor substrate 2 | GF receptor | 1.4 | 1.1 * | 1.1 * |
* denote genes that are differentially expressed compared to cirrhosis (α < 0.001). Abbreviations: TF = transcription factor; ECM = Extra-cellular matrix; IF = intermediate filament; GF = growth factor.
Sixteen genes were differentially expressed uniquely in the tumors (Table 2). Magnitude of change was modest, however six of the 16 genes were transcription factors or activators (TBX3, HHEX, ATF2, FOXM1, PROX1 and STAT3) which might be expected to induce large effects with small expression changes. Thirty-five more genes were differentially expressed in cirrhosis and either had similar expression in tumors (25 genes) or had larger magnitude changes in HCC (10 genes). For example, GPC3 was up-regulated slightly in cirrhosis (×2), and greatly up-regulated in both early (×7.2) and late (×10.4) tumors.
Table 2.
Genes uniquely changed in HCC (α < 0.001).
| Gene | Gene Name | Gene Function | FC Early HCC | FC Late HCC |
|---|---|---|---|---|
| DKK1 | Dickkopf-related protein 1 | Wnt inhibitor | 3.8 | 1.8 |
| MMP1 | Matrix metalloproteinase 1 | ECM | 2.4 | 1.5 |
| FST | Follistatin | GF antagonist | 1.9 | 2.1 |
| TBX3 | T-box 3 | TF | 1.3 | 2.2 |
| MAP4K4 | Mitogen-activated protein kinase kinase kinase kinase 4 | kinase | 1.3 | 1.3 |
| INHBA | Activin | GF | 1.3 | 1.3 |
| HHEX | Hematopoietically expressed homeobox | TF | 1.3 | 1.3 |
| ATF2 | Activating transcription factor 2 | TF | 1.3 | 1.4 |
| BSG | Basigen | ECM receptor | 1.3 | 1.4 |
| LAMA4 | Laminin alpha 4 | ECM | 1.2 | 1.3 |
| FOXM1 | Forkhead box M1 | TF | 1.2 | 1.1 |
| KRAS | v-Ki-ras2 Kirsten rat sarcoma viral oncogene homolog | GTPase | 0.9 | 0.7 |
| PROX1 | Prospero homeobox 1 | TF | 0.7 | 0.5 |
| TGFBR3 | Transforming Growth Factor beta receptor 3 | GF | 0.7 | 0.6 |
| MST1 | Macriogage stimulating 1 (hepatocyte growth factor-like) | GF | 0.6 | 0.6 |
| STAT3 | Signal transducer and activator of transcription 3 | TF | 0.6 | 0.5 |
Abbreviations: TF = transcription factor; ECM = Extra-cellular matrix; GF = growth factor.
Overall, 98 of the 179 (55%) genes critical to liver development had altered expression patterns in cirrhosis and early stage tumors. Only five of the genes were uniquely changed in late-stage tumors: ACVR1, HMGA2, IGF2, CP and YAP1. A complete list of all 179 liver development genes tested, and relative expression in each disease group can be found in Supplementary Table S2.
2.4. Functional Gene Sets That Discriminate between Normal, Cirrhosis, and Tumor Samples
From these significant liver development genes we have been able to identify some specific functional groups. Genes related to extra-cellular matrix (ECM) maintenance or remodeling demonstrated major changes in both cirrhosis and tumors. PCA of the significantly changed genes demonstrate that these genes also independently discriminate between normal, cirrhosis, and tumor samples (Figure 2A). The BMP signaling pathway is also highly dysregulated in HCV-cirrhosis and HCC. BMP2, its receptors, and BMP inhibitors are all differentially expressed in cirrhosis and HCC. Embryonically, BMP signaling is antagonistic to FGF signaling and this balance is controlled by the DAN family of BMP antagonists from mesenchymal cells and GPC3 expressed by hepatocytes. BMP2, BMPR1A, FGF7, FGFR2 and ID3 were more highly expressed in cirrhosis than HCC, while the BMP inhibitors were more highly expressed in tumors. At least one of the inhibitors GPC3, GREM1, FSTL3, and/or FST were over-expressed (FC > 1.5) in 100% of tumor samples (Supplementary Table S3). A PCA plot demonstrates the gene set’s ability to discriminate most tumors from normal and cirrhosis samples (Figure 2B). Leave-one-out cross-validation (LOOCV) of ROC curves assessed predication sensitivity of 95.9% and specificity of 83.3%.
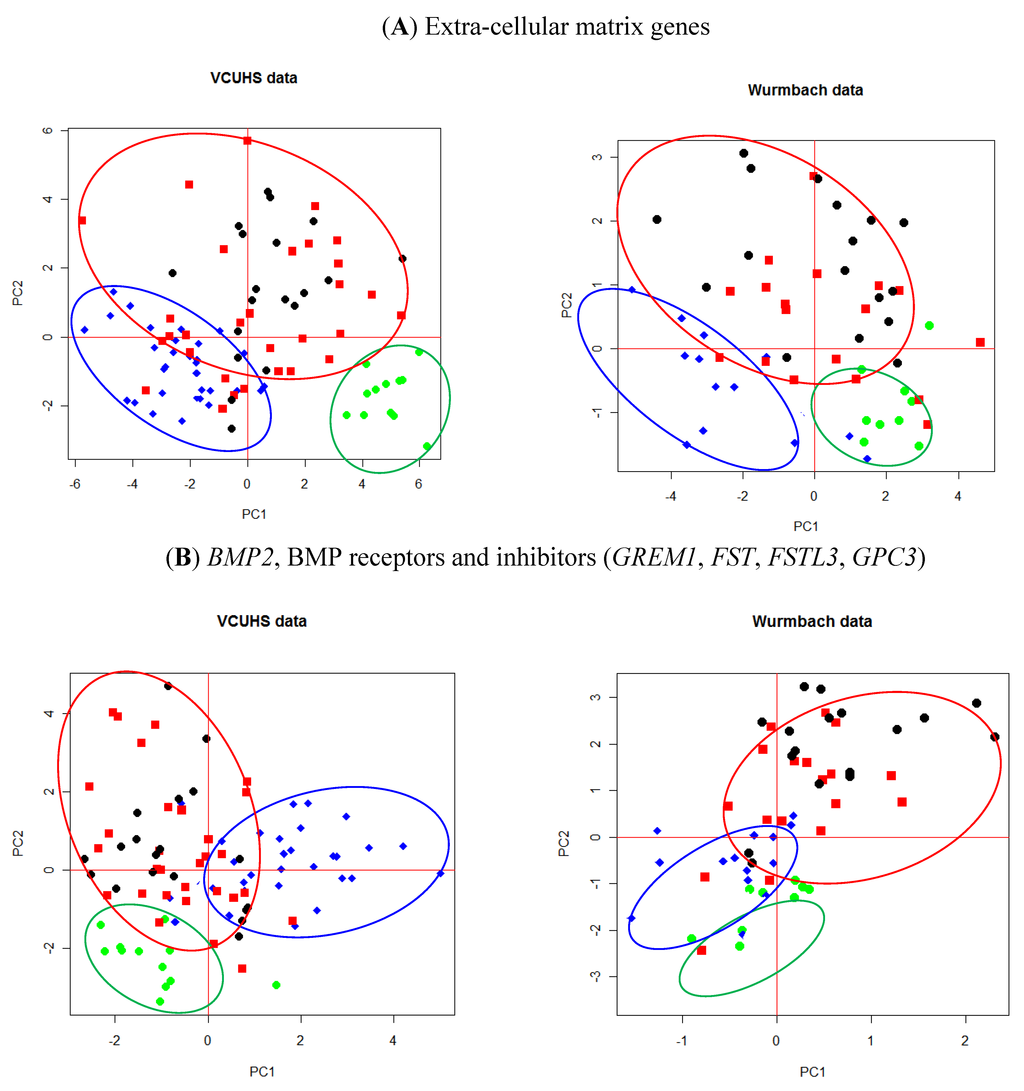
Figure 2.
PCA plots of (A) ECM genes and (B) BMP2 and its receptors and inhibitors. Green = normal control livers; Blue = cirrhosis; Red = early stage HCC; Black = late stage HCC. Normal tissues cluster well away from either cirrhosis or tumors. Both the ECM genes (A) and BMP inhibitors (B) were able to discriminate between cirrhosis and many of the tumor tissues.
These findings were validated against the Wurmbach dataset by applying the PCA loadings generated from our data to their dataset, and we observed similar patterns of separation between normal, cirrhosis, and HCC tissues (Figure 2A,B). The ECM and BMP genesets were well described with the first two principal components.
3. Discussion
Hepatocellular carcinoma is widely recognized as a highly heterogenous disease, which has made it difficult to characterize. However, because HCV is RNA virus that exerts its effects by direct protein interactions and host response to chronic infection and inflammation, we questioned the common perception that the gene expression changes observed in tumors are likely due to random activation of genes arising from mutations and DNA damage. We screened a total of 1,425 genes that were demonstrated by RNA seq analysis to have no expression in healthy liver. None of them were expressed in our HCV-HCC samples. This data suggests that the progression from cirrhosis to HCC in patients with chronic HCV infection is not accompanied by random gene activation, as has often been supposed. In particular, 26 of these genes have developmental roles highly paralogous to liver development genes and known association with carcinoma of other tissues, but remain under tight transcriptional control in both cirrhotic and HCC tissues. For example, BMP3 inactivation is associated with colorectal cancer [33], gastric cancer [34], and pancreatic cancer [35]; CDH3 is over-expressed in several types of cancer including breast [36] and pancreatic [37]; FGF3 is amplified in ovarian [38], breast [39], and bladder cancer [40]; FGF12 is amplified in esophageal squamous cell carcinoma [41] and squamous cell carcinoma of the lung [42], and GATA1 mutations have recently been associated with acute megakaryoblastic leukaemia [43] and breast cancer [44].
Using a knowledge-driven approach, we have shown that genes critical to every stage of liver development are differentially expressed in HCV-cirrhosis and further deregulated in tumors. In general we observed a pattern of modest changes in genes differentially expressed in cirrhosis and HCC. Mean fold-change in tumors was <2× up or down in many cases. Some of these genes are expressed by mesodermally-derived tissues in the embryonic liver and thus may also be expressed exclusively by the activated hepatic stellate cells (HSCs) in the adult liver. Since these cell types make up less than five percent of the liver volume in HCC, even large changes in gene expression from the HSC would result in modest overall signal change in a tissue sample. BMP2, BMP4, BMPR1A, HGF, LHX2, FST, SOX9, GREM1, FGF7, TGFB1, MMP2, TIMP2, SMAD7, KLF6 and JUN have experimentally validated expression in activated hepatic stellate cells [45,46,47,48,49]. All of these genes except BMP4, HGF, and LHX2 were differentially expressed in our study. As predicted, most of these have modest but significant mean fold-change.
The major pattern that emerged from our detailed analysis of these important genes was the BMP pathway. Embryonically, BMP2 and BMP4 are secreted from the mesenchymal STM and act antagonistically against FGF2 and FGF4 to regulate rate of proliferation. Later in development, FGF7 and FGFR2 promote differentiation into biliary epithelial cells. In healthy adults, BMP2 is secreted from hepatic stellate cells to suppress hepatocyte proliferation. During normal liver regeneration (such as after partial hepatectomy), BMP2 is down-regulated and hepatocyte proliferation is activated by at least four distinct and redundant mechanisms: FGF7 and FGFR2 [50]; KDR (aka VEGFR2), ID1, HGF, and WNT2 [51]; TNF, NFKB1, STAT3, and IL6 [52]; and β-catenin and Cyclin D1 [53]. During active hepatitis C infection, the HCV core protein induces over-expression of BMP2, which then participates in the activation of hepatic stellate cells and also functions to suppress hepatocyte proliferation in response to liver damage. In our dataset, late-stage cirrhotic livers had elevated levels of BMP2, its receptor, and some of its downstream effectors (SMADs and ID transcription factors). The proliferation promoters noted above were generally unchanged in cirrhotic tissue, while TNF and β-catenin were under-expressed. FGF7 and FGFR2, however, were over-expressed in both cirrhosis and HCC. This suggests a complex and somewhat chaotic response to active HCV infection and liver damage in the cirrhotic liver. However, many cirrhotic tissues and every tumor in our samples over-expressed at least one of the BMP inhibitors (FC > 1.5, see Supplementary Table S3), with higher expression in tumors. This data suggests there is a chronic struggle in the cirrhotic liver to maintain homeostasis of the BMP pathway, and that tumors might have found a way to overcome the proliferative inhibition imposed by BMP2 by sufficiently up-regulating any of the BMP inhibitors. In the tumors, most of the proliferation promoters had expression values similar to that of normal tissue (which is sufficient to induce proliferation in the absence of active BMP2), including those that were down-regulated in cirrhosis.
Several of the developmental genes expressed in adult livers have been shown to have roles in maintaining tissue differentiation or regulating cell proliferation. BMPs and their DAN family antagonists have opposing effects on Wnt signaling and the BMP-GREM-Wnt circuit has been proposed as a mechanism to maintain stem cell niches in the colon [54]. FOXA1, FOXA2, HLX and SFRP5 are expressed in progenitor cells, while SOX9, SOX17, FOXA2 and KIT have confirmed expression in hepatic stem cells [55]. FOXA1-3 drive differentiation of hepatocyte stem cells. Merlin (NF2) has recently been proposed as a regulator of liver stem cells, with deletion leading to HCC in rat models [56]. In our data, FOXA1, FOXA2, MST1 and NF2 were down-regulated, suggesting that in this population there is a general pattern of de-differentiation of hepatocytes within tumors and acquisition of stem-cell-like properties.
4. Experimental Section
4.1. Study Population
Since 1997, HCV patients diagnosed with cirrhosis and HCC have been evaluated and treated at the Hume-Lee Transplant Center at VCUHS according to an Institutional Review Board approved study protocol [57]. Informed consent was obtained from all patients. After staging, HCC patients had their tumors ablated and were evaluated for liver transplant according to the United Network for Organ Sharing criteria. Tissue samples were collected from biopsies and explanted livers according to protocols established by the Liver Tissue Cell Distribution System (Richmond, Virginia, funded by NIH Contract #N01-DK-7-0004/HHSN267200700004C). Control liver samples were obtained from explanted donor livers. Donor livers were shown to have normal function and were negative for hepatitis C virus antibodies.
An independently published dataset of HCV-cirrhosis and HCC was also obtained for verification of results [58] (Wurbach et al., NCBI GEO database accession GEO6764). In addition, the absolute expression levels of target genes in a normal adult human were obtained from the BodyMap gene expression database [59] and mapped with Burrows-Wheeler Alignment tool (BWA) [60] with default parameters. In cases where BodyMap results were inconclusive (counts of 0–40), a literature search was performed to confirm adult expression of target genes.
4.2. Sample Preparation
Pre-transplant biopsies and explanted livers were sectioned and grossly examined. Samples from tumors and cirrhotic liver tissue (according to diagnosis and pathological examination) were freshly snap-frozen and processed in the Hume-Lee Transplant Center Molecular Diagnostic Laboratory. Liver tissue samples were collected in liquid nitrogen or RNAlater solution (Ambion, Austin, TX, USA) and stored at −80 °C until use. Explanted livers were sliced at intervals of 4–5 mm, and all nodules suspicious for HCC processed for light microscopy. Only tumor samples with more than 85% tumor cell content were used for the microarray studies. Normal and necrotic tissues were macro-dissected from the sample.
With minor modifications, the sample preparation protocol follows the Affymetrix GeneChip Expression Analysis Manual (Affymetrix, Santa Clara, CA, USA). After hybridization and scanning, the microarray images were checked for major chip defects or abnormalities in the hybridization signal. Total RNA quality and integrity of each sample were analyzed using the Agilent 2100 Bioanalyzer (Agilent Technologies), and products of cDNA synthesis and in vitro transcription (IVT) were tested before being considered for microarray analysis using the Agilent 2100 Bioanalyzer (cDNA synthesis 1.5 kb < cDNA < 5.0kb; IVT 1.0kb < cRNA < 4.5 kb).
All chips in the study were examined with several quality control tests [61,62]. Any chip that fell well outside the recommendations for any of the quality assessment tests was excluded from further analysis.
4.3. Statistical Methods
Data files were read into the R (version 2.13) programming environment using updated probe annotations from the BrainArray project (version 14.1.0, HGU133A2_Hs_REFSEQ), which have been shown to improve accuracy of probe—gene mapping over the standard Affymetrix annotation [63].
Robust Multichip Average (RMA) pre-processing is broadly accepted as robust, easy to implement, and widely applicable. However, we were concerned that the assumptions of RMA may not be met (that only a small proportion (1–5%) of genes are differentially expressed, and that about the same number of genes are over- vs. under-expressed). Therefore, we processed a test dataset using RMA and carefully examined differential expression results. Comparison of group contrasts identified 25–45% genes that were called as differentially expressed at an FDR < 0.05, and 2/3 of those genes were over-expressed in tumors. This suggested to us that quantile normalization may not be an appropriate method for this dataset. Instead, we first performed background correction, then normalized the data using non-parametric, distribution-free regression on technical covariates of probes (GC content, melting temperature, and probe location) to estimate and correct for systematic bias [64].
We used scaled Principal Components Analysis (PCA) on specific gene sets to explore the relationship between those genes and disease behavior. We used the function “prcomp” with scale = TRUE in the R environment [65].
Normally regulated genes generally have a narrow distribution with small variation, while poorly regulated genes may have broad, flat distribution of expression values or long thick tails and high variability. Genes that are differentially expressed in a subset of tumor samples will have a skewed distribution. Either of these situations violate the assumption of normal distribution and can be difficult to identify with a t-test. Instead, we used F-test of variance to identify high-variance genes and the non-parametric two-sample Kolmogorov-Smirnov Test to test differences in both location and shape of the distributions.
4.4. Identification of Test Genesets
In this study, we investigated the hypothesis that genes critical to the development of the liver are poorly regulated or preferentially activated in HCV-cirrhosis and HCV-HCC. There are five main stages of liver development: hepatic fate specification, hepatoblast migration, liver bud growth, hepatocyte/biliary differentiation, and maturation. We identified 179 genes (via literature review) that are experimentally determined to be critical regulators necessary for normal liver development (See Supplementary Table S2 for a complete list). We also wished to determine whether liver development genes are more likely than their non-liver paralogs (which have highly similar functions in the development of other tissue types) to be dysregulated in liver tumors. We identified 26 such genes that are not normally expressed in either embryonic or adult liver tissue (Supplementary Table S1).
5. Conclusions
In summary, there is growing awareness that hepatocarcinogenesis shares many features with liver organogenesis. Recent reviews have compared the pathways that appear to be involved in both development and cancer [66,67]. We show here, for the first time to our knowledge, that tumors dysregulate the genes specific to their own development rather than closely related genes in the same pathways. We further demonstrate that these closely related paralogs, which have established roles in cancers of other tissues, remain under good transcriptional control in HCV-induced cirrhosis and HCC even in late-stage tumors. We have found that the earliest signals responsible for guiding the initiation and development of the embryonic liver are correlated with the development of cirrhosis and HCC due to chronic Hepatitis C infection, but do not appear to be involved in the progression from early to late stage cancer. These observed patterns of expression were validated in an independently collected HCV-HCC microarray experiment. By applying what is known about the control of these genes in normal liver development and their aberrant control in HCC, we can begin to model knock out and deletion experiments to further define how these pathways can be interrupted or stimulated to impact HCC occurrence or recurrence.
Acknowledgements
This work was supported by NIDDK grant 5R01DK069859-05.
Conflicts of Interest
The authors declare no conflict of interest.
References
- McGivern, D.; Lemon, S. Virus-specific mechanisms of carcinogenesis in hepatitis C virus associated with liver cancer. Oncogene 2011, 30, 1969–1983. [Google Scholar] [CrossRef]
- Chen, X.; Cheung, S.; So, S.; Fan, S.; Barry, C.; Higgins, B.; Lai, K.; Ji, J.; Dudoit, S.; Ng, I.; et al. Gene expression patterns in human liver cancers. Mol. Biol. Cell 2002, 13, 1929–1939. [Google Scholar] [CrossRef]
- Iizuka, N.; Oka, M.; Yamada-Okabe, H.; Nishida, M.; Maeda, Y.; Mori, N.; Takao, T.; Tamesa, T.; Tangoku, A.; Tabuchi, H.; et al. Oligonucleotide microarray for predication of early intrahepatic recurrence of hepatocellular carcinoma after curative resection. Lancet 2003, 361, 923–929. [Google Scholar]
- Kim, J.; Ye, Q.; Forgues, M.; Chen, Y.; Budhu, A.; Sime, J.; Hofseth, L.; Kaul, R.; Wang, X.-W. Cancer-associated molecular signature in the tissue samples of patients with cirrhosis. Hepatology 2004, 39, 518–527. [Google Scholar] [CrossRef]
- Llovet, J.; Chen, Y.; Wurmbach, E.; Roayaie, S.; Fiel, M.; Schwartz, M.; Thung, S.; Khitrov, G.; Zhang, W.; Villanueva, A.; et al. A molecular signature to discriminate dysplastic nodules from early hepatocellular carcinoma in HCV cirrhosis. Gastroenterology 2006, 131, 1758–1767. [Google Scholar] [CrossRef]
- Lee, J.; Chu, I.; Heo, J.; Calvisi, D.; Sun, Z.; Roskams, T.; Durnez, A.; Demetris, A.; Thorgeirsson, S. Classification and predication of survival in hepatocellular carcinoma by gene expression profiling. Hepatology 2004, 40, 667–676. [Google Scholar] [CrossRef]
- Budhu, A.; Forgues, M.; Ye, Q.; Jia, H.; He, P.; Zanetti, K.; Kammula, U.; Chen, Y.; Qin, L.; Tang, Z.; et al. Prediction of venous metastases, recurrence, and prognosis in hepatocellular carcinoma based on a unique immune response signature of the liver microenvironment. Cancer Cell 2006, 10, 99–111. [Google Scholar] [CrossRef]
- Wang, S.; Ooi, L.; Hui, K. Identification and validation of a novel gene signature associated with the recurrence of human hepatocellular carcinoma. Clin. Cancer Res. 2007, 13, 6275–6283. [Google Scholar] [CrossRef]
- Jia, H.; Ye, Q.; Qin, L.; Budhu, A.; Forgues, M.; Chen, Y.; Liu, Y.; Sun, H.; Wang, L.; Lu, H.; et al. Gene expression profiling reveals potential biomarkers of human hepatocellular carcinoma. Clin. Cancer Res. 2007, 13, 1133–1139. [Google Scholar]
- Wurmbach, E.; Chen, Y.; Khitrov, G.; Zhang, W.; Roayaie, S.; Schwartz, M.; Fiel, I.; Thung, S.; Mazzaferro, V.; Bruix, J.; et al. Genome-wide molecular profiles of HCV-induced dysplasia and hepatocellular carcinoma. Hepatoloty 2007, 45, 42–52. [Google Scholar] [CrossRef]
- Hoshida, Y.; Villanueva, A.; Kobayashi, M.; Peix, J.; Chiang, D.; Camargo, A.; Bupta, S.; Moore, J.; Wrobel, M.; Lerner, J.; et al. Gene expression in fixed tissues and outcome in hepatocellular carcinoma. N. Engl. J. Med. 2008, 359, 1995–2004. [Google Scholar] [CrossRef]
- Yamashita, T.; Ji, J.; Budhu, A.; Forgues, M.; Yang, W.; Wang, H.-Y.; Jia, H.; Ye, Q.; Qin, L.; Wauthier, E.; et al. EpCAM-positive hepatocellular carcinoma cells are tumor initiating cells with stem-progenitor cell features. Gastroenterology 2009, 69, 1012–1024. [Google Scholar]
- Korn, E.; Troendle, J.; McShane, L.; Simon, R. Controlling the number of false discoveries: Application to high-dimensional genomic data. J. Stat. Plan. Inference 2004, 124, 379–398. [Google Scholar] [CrossRef]
- Owen, A. Variance of the number of false discoveries. J. R. Statist. Soc. B 2005, 67, 411–426. [Google Scholar] [CrossRef]
- Schwartzman, A.; Lin, X. The effect of correlation in false discovery rate estimation. Biometrika 2011, 98, 199–214. [Google Scholar] [CrossRef]
- Hu, Z.; Willsky, G. Utilization of two sample t-test statistics from redundant probe sets to evaluate different probe set algorithms in GeneChip studies. BMC Bioinformatics 2006, 7, 12. [Google Scholar] [CrossRef]
- Ochs, M.; Quackenbush, J.; Davulvuri, R.; Ressom, H. Knowledge-driven analysis and data integration for high-throughput biological data. Pac. Symp. Biocomput. 2008, 14, 353–355. [Google Scholar]
- Turner, S.; Berg, R.; Linneman, G.; Peissig, P.; Crawford, D.; Denny, J.; Roden, D.; McCarty, C.; Ritchie, M.; Wilke, R. Knowledge-driven multi-locus analysis reveals gene-gene interactions influencing HDL cholesterol level in two independent EMR-linked biobanks. PLoSOne 2011, 6, e19586. [Google Scholar]
- Alterovitz, G.; Ramoni, M. Knowledge-Based Bioinformatics: From Analysis to Interpretation; John Wiley & Sons Ltd.: West Sussex, UK, 2010. [Google Scholar]
- Merlo, L.; Pepper, J.; Reid, B.; Maley, C. Cancer as an evolutionary and ecological process. Nat. Rev. Cancer 2006, 6, 924. [Google Scholar] [CrossRef]
- Choe, S.; Boutros, M.; Michelson, A.; Church, G.; Halfon, M. Preferred analysis methods for AffymetrixGeneChips revealed by a wholly defined control dataset. Genome Biol. 2005, 6, R16. [Google Scholar] [CrossRef]
- Jung, K.; Friede, T.; Beissbarth, T. Reporting FDR analogous confidence intervals for the log fold change of differentially expressed genes. BMC Bioinformatics 2011, 12, 288. [Google Scholar] [CrossRef]
- Beilas, J.; Loeb, K.; Rubin, B.; True, L.; Loeb, L. Human cancers express a mutator phenotype. Proc. Natl. Acad. Sci. USA 2006, 103, 18238–18242. [Google Scholar]
- Salk, J.; Fox, E.; Loeb, L. Mutational heterogeneity in human cancers: Origin and consequences. Annu. Rev. Pathol. Mech. Dis. 2010, 5, 51–75. [Google Scholar] [CrossRef]
- Peltomaki, P. Mutations and epimutations in the origin of cancer. Exp. Cell Res. 2011, 318, 299–310. [Google Scholar] [CrossRef]
- Lengauer, C.; Kinzler, K.; Vogelstein, B. Genetic instability in colorectal cancers. Nature 1997, 386, 623–627. [Google Scholar] [CrossRef]
- Reshmi, S.; Gollin, S. Chromosomal instability in oral cancer cells. J. Dent. Res. 2005, 84, 107–117. [Google Scholar] [CrossRef]
- Hsu, I.; Tokiwa, T.; Bennett, W.; Metcalf, R.; Welsh, J.; Sun, T.; Harris, C. p53 Gene mutation and integrated hepatitis B viral DNA sequences in human liver cancer cell lines. Carcinogenesis 1993, 14, 987–992. [Google Scholar] [CrossRef]
- Hussain, S.; Schwank, J.; Staib, F.; Wang, X.; Harris, C. TP53 mutations and Hepatocellular carcinoma: Insights into the etiology and pathogenesis of liver cancer. Oncogene 2007, 26, 2166–2176. [Google Scholar] [CrossRef]
- Kung, J.; Currie, I.; Forbes, S.; Ross, J. Liver development, regeneration, and carcinogenesis. J. Biomed. Biotechnol. 2010, 2010, 984248. [Google Scholar]
- Naxerova, K.; Bult, C.; Peaston, A.; Fancher, K.; Knowles, B.; Kasif, S.; Kohane, I. Analysis of gene expression in a developmental context emphasizes distinct biological leitmotifs in human cancers. Genome Biol. 2008, 9, R108. [Google Scholar] [CrossRef]
- Si-Tayeb, K.; Lemaigre, F.; Duncan, S. Organogenesis and development of the liver. Dev. Cell 2010, 18, 175–188. [Google Scholar] [CrossRef]
- Loh, K.; Chia, J.; Greco, S.; Cozzi, S.; Buttenshaw, R.; Bond, C.; Simms, L.; Pike, T.; Young, J.; Jass, J.; et al. Bone Morphogenic protein 3 inactivation is an early and frequent event in colorectal cancer development. Genes Chromosomes Cancer 2008, 47, 449–460. [Google Scholar] [CrossRef]
- Chen, X.; Wang, J.; Li, X.; Zhang, H.; Ye, Z. Role of BMP3 in progression of gastric carcinoma in Chinese people. World J. Gastroenterol. 2010, 16, 1409–1413. [Google Scholar] [CrossRef]
- Kisial, J.; Tab, T.; Tablor, W.; Chari, S.; Petersen, G.; Mahoney, M.; Ahlquist, D. Stool DNA testing for the detection of pancreatic cancer. Cancer 2012, 118, 2623–2631. [Google Scholar] [CrossRef]
- Albergaria, A.; Riberio, A.; Pinho, S.; Milanezi, F.; Carneiro, V.; Sousa, B.; Sousa, S.; Oliveira, C.; Machado, J.; Seruca, R.; et al. ICI 182,780 induces P-cadherinoverexpression in breast cancer cells through chromatin remodeling at the promoter level: A role for C/EBPbeta in CDH3 gene activation. Hum. Mol. Genet. 2010, 19, 2554–2566. [Google Scholar] [CrossRef]
- Taniuchi, K.; Nakagawa, H.; Hosokawa, M.; Nakamura, T.; Equchi, H.; Ohigashi, H.; Ishikawa, O.; Katagiri, T.; Nakamura, Y. Overexpressed P-cadherin/CDH3 promotes motility of pancreatic cancer cells by interacting with p120ctn and activating rho-family GTPases. Cancer Res. 2005, 65, 3092–3099. [Google Scholar]
- Rosen, A.; Sevelda, P.; Klein, M.; Dobianer, K.; Hruza, C.; Czerwnda, K.; Hanak, H.; Vavra, N.; Salzer, H.; Leodolter, S. First experience with FGF-3 (INT-2) amplification in women with epithelial ovarian cancer. Br. J. Cancer 1993, 67, 1122–1125. [Google Scholar] [CrossRef]
- Champeme, M.; Bieche, I.; Hacene, K.; Lidereau, R. Int-2/FGF3 amplification is a better independent predictor of relapse than c-myc and c-erbB-2/neu amplifications in primary human breast cancer. Mod. Pathol. 1994, 7, 900–905. [Google Scholar]
- Zaharieva, B.; Simon, R.; Diener, P.; Ackermann, D.; Maurer, R.; Alund, G.; Knonagel, H.; Rist, M.; Wilger, K.; Hering, F.; et al. High-throughput tissue microarray analysis of 11q13 gene amplification (CCND1, FGF3, FGF4, EMS1) in urinary bladder cancer. J. Pathol. 2003, 201, 603–608. [Google Scholar] [CrossRef]
- Chattopadhyay, I.; Singh, A.; Hukan, R.; Purkayashtha, J.; Kataki, A.; Mahanta, J.; Saxena, S.; Kapur, S. Genome-wide analysis of chromosomal alterations in patients with esophageal squamous cell carcinoma exposed to tobacco and betel quid from high-risk area in India. Mutat. Res. 2010, 696, 130–138. [Google Scholar] [CrossRef]
- Kang, J.; Koo, S.; Kwon, K.; Park, J.; Kim, J. Identification of novel candidate target genes, including EPHB3, MASP1 an SST at 3q26.2-q29 in squamous cell carcinoma of the lung. BMCCancer 2009, 16, 237. [Google Scholar]
- Hama, A.; Muramatsu, H.; Makishima, H.; Sugimoto, Y.; Szpurka, H.; Jasek, M.; O’Keefe, C.; Takahashi, Y.; Sakaguchi, H.; Doisaki, S.; et al. Molecular lesions in childhood and adult acute magakaryoblastic leukaemia. Br. J. Haematol. 2012, 156, 316–325. [Google Scholar] [CrossRef]
- Seo, M.; Liu, X.; Chang, M.; Park, J. GATA-binding protein 1 is a novel transcription regulator of peroxiredoxin 5 in human breast cancer cells. Int. J. Oncol. 2012, 40, 655–664. [Google Scholar]
- Jiang, F.; Parsons, C.; Stefanovic, B. Gene expression profile of quiescent and activated rate hepatic stellate cells implicates Wnt signaling pathway in activation. J. Hepatol. 2006, 45, 401–409. [Google Scholar] [CrossRef]
- Li, D.; Friedman, S. Liver fibrogenesis and the role of hepatic stellate cells: New insights and prospects for therapy. J. Gastroenterol. Hepatol. 1999, 14, 618–633. [Google Scholar] [CrossRef]
- Wang, B.-B.; Cheng, J.-Y.; Gao, H.-H.; Zhang, Y.; Chen, Z.-N.; Bian, H. Hepatic stellate cells in inflammation-fibrosis-carcinoma axis. Anat. Rec. 2010, 293, 1492–1496. [Google Scholar] [CrossRef]
- Denecke, B.; Wickert, L.; Liu, Y.; Ciuclan, L.; Dooley, S.; Meindl-Beinker, N. Smad7 dependent expression signature highlights BMP2 and HK2 signaling in HSC transdifferentiation. World J. Gastroenterol. 2010, 16, 5211–5224. [Google Scholar] [CrossRef]
- Fan, J.; Shen, H.; Sun, Y.; Li, P.; Burczynski, F.; Namaka, M.; Gong, Y. Bone morphogenetic protein 4 mediates bile duct ligation induced liver fibrosis through activation of Smad1 and ERK1/2 in rat hepatic stellate cells. J. Cell. Physiol. 2006, 207, 499–505. [Google Scholar] [CrossRef]
- Tsai, S.; Wang, W. Expression and function of Fibroblast Growth Factor (FGF) 7 during liver regeneration. Cell Physiol. Biochem. 2011, 11, 641–652. [Google Scholar] [CrossRef]
- Ding, B.; Nolan, D.; Butler, J.; James, D.; Babazadeh, A.; Rosenwaks, Z.; Mittal, V.; Kobayashi, H.; Shido, K.; Lyden, D.; et al. Inductive angiocrine signals from sinusoidal endothelium are required for liver regeneration. Nature 2010, 468, 310–317. [Google Scholar]
- Gilgenkrantz, H.; de l’Hortet, A. New insights into liver regeneration. Clin. Res. Hepatol. Gastroenterol. 2011, 35, 623–629. [Google Scholar] [CrossRef]
- Nejak-Bowen, K.; Monga, S. Beta-catenin signaling, liver regeneration and Hepatocellular cancer: Sorting the good from the bad. Semin. Cancer Biol. 2011, 21, 44–58. [Google Scholar] [CrossRef]
- Kosinki, C.; Li, V.; Chan, A.; Zhang, J.; Ho, C.; Tsui, W.; Chan, T.; Mifflin, R.; Powell, D.; Yuen, S.; et al. Gene expression patterns of human colon tops and basal crypts and BMP antagonists as intestinal stem cell niche factors. Proc. Natl. Acad. Sci. USA 2007, 104, 15418–15423. [Google Scholar]
- Turner, R.; Lozoya, O.; Want, Y.; Cardinale, V.; Gaudio, E.; Alpini, G.; Mendel, G.; Wauthier, E.; Barbier, C.; Alvaro, D.; et al. Human hepatic stem cell and maturational liver lineage biology. Hepatology 2011, 53, 1035–1045. [Google Scholar] [CrossRef]
- Benhamouche, S.; Curto, M.; Saotome, I.; Gladden, A.; Liu, C.; Giovannini, M.; McClatchey, A. Nf2/Merlin controls progenitor homeostasis and tumorigenesis in the liver. Genes Dev. 2010, 24, 1718–1730. [Google Scholar] [CrossRef]
- Fisher, R.; Maroney, T.; Fulcher, A.; Maluf, D.; Clay, J.; Wolfe, L.; Dawson, S.; Cotterell, A.; Stravitz, R.; Luketic, V.; et al. Hepatocellular carcinoma: Strategy for optimizing surgical resection, transplantation and palliation. Clin. Transplant. 2001, 16, 52–58. [Google Scholar]
- Wurmbach, E.; Chen, Y.; Khitrov, G.; Zhang, W.; Roayaie, S.; Schwartz, M.; Fiel, I.; Thung, S.; Mazzaferro, V.; Bruix, J.; et al. Genome-wide molecular profiles of HCV-induced dysplasia and hepatocellular carcinoma. Hepatology 2007, 45, 938–947. [Google Scholar] [CrossRef]
- Kawamoto, S.; Yoshii, J.; Mizuno, K.; Ito, K.; Ohnishi, T.; Matoba, R.; Hori, N.; Matsumoto, Y.; Okumura, T.; Nakao, Y.; et al. BodyMap: A collection of 3' ESTs for analysis of human gene expression information. Genome Res. 2000, 10, 1817–1827. [Google Scholar] [CrossRef]
- Li, H.; Durbin, R. Fast and accurate short read alignment with Burrows-Wheeler transform. Bioinformatics 2009, 25, 1754–1760. [Google Scholar] [CrossRef]
- Mas, V.; Maluf, D.; Stravitz, R.; Dumur, C.; Clark, B.; Rodgers, C.; Ferreira-Gonzalez, A.; Fisher, R.A. Hepatocellular carcinoma in HCV-infected patients awaiting liver transplantation: Genes involved in tumor progression. Liver Transpl. 2004, 10, 607–620. [Google Scholar] [CrossRef]
- Reimers, M.; Weinstein, J. Quality assessment of microarrays: Visualization of spatial artifacts and quantitation of regional biases. BMC Bioinformatics 2005, 6, 166. [Google Scholar] [CrossRef]
- Sandberg, R.; Larsson, O. Improved precision and accuracy for microarrays using updated probe set definitions. BMC Bioinformatics 2007, 8, 48. [Google Scholar] [CrossRef]
- Guennel, T.; Reinhold, W.; Pommier, Y.; Selzer, R.; Weinstein, J.; Reimers, M. Noise reduction for aCGH data using technical covariates and probe level information. BMC Bioinformatics 2012. under review.. [Google Scholar]
- Venables, W.; Ripley, B. Modern Applied Statistics with S. Fourth Edition; Springer: New York, NY, USA, 2002; ISBN ISBN 0-387-95457-0. [Google Scholar]
- Li, T.; Wan, B.; Huang, J.; Zhang, X. comparison of gene expression in Hepatocellular carcinoma, liver development, and liver regeneration. Mol. Genet. Genomics 2010, 283, 485–492. [Google Scholar] [CrossRef]
- Lu, J.; Hsia, Y.; Tu, H.-C.; Hsiao, Y.-C.; Yan, W.-Y.; Wang, H.-D.; Yuh, C.-H. Liver development and cancer formation in zebrafish. Birth Defects Res. C Embryo Today 2011, 93, 157–172. [Google Scholar] [CrossRef]
Supplementary Material
Table S1.
Liver development genes compared to their non-liver paralogs. A: one-sided K-S test of identical distribution comparing HCC to normal samples; B: on-sided K-S test in the Wurmbach dataset; C: K-S test comparing the liver development gene to it’s non-liver paralog.
| Liver development gene | Expression in normal adult liver | Non-liver paralog | Non-liver gene, tumor vs. normal (p-value) | Non-liver gene, tumor vs. normal (p-value) | Liver vs. non-liver gene in tumors (p-value) |
|---|---|---|---|---|---|
| VCU data | Wurmbach data | VCU data | |||
| A | B | C | |||
| ACVR2A | + | AMHR2 | 0.18 | 0.009 | 0.14 |
| BMP2 | + | BMP3 | 0.014 | 0.57 | 9.9 × 10⁻¹⁰ |
| BMP4 | + | BMP3 | 0.014 | 0.57 | 0.0091 |
| CDH1 | ++ | CDH3 | 0.20 | 0.007 | 1.7 × 10⁻⁶ |
| ELF5 | - | SPDEF | 0.003 | 0.29 | 5.2 × 10⁻⁸ |
| FGF1 | - | FGF3 | 0.73 | 0.37 | 0.0023 |
| FGF2 | + | FGF3 | 0.73 | 0.37 | 1.7 × 10⁻⁶ |
| FGF7 | + | FGF12 | 0.81 | 0.20 | 1.7 × 10⁻⁶ |
| FGF8 | - | FGF17 | 0.90 | 0.69 | 0.14 |
| FOXA1 | ++ | FOXB1 | 0.02 | 0.97 | 2.2 × 10⁻¹⁶ |
| FOXA2 | ++ | FOXD2 | 0.06 | 0.72 | 1.2 × 10⁻¹² |
| GATA4 | ++ | GATA1 | 0.05 | 0.18 | 2.4 × 10⁻¹⁰ |
| GATA6 | + | GATA1 | 0.05 | 0.18 | 1.7 × 10⁻⁶ |
| GPC3 | - | GPC4 | 0.29 | 0.22 | 1.1 × 10⁻¹¹ |
| HHEX | ++ | VENTX | 0.002 | 0.32 | 3.6 × 10⁻⁵ |
| HLX | + | BARX1 | 0.02 | 0.02 | 0.00049 |
| IL6ST | +++ | IL12RB2 | 0.25 | 0.59 | 7.3 × 10⁻⁶ |
| KIT | + | FLT3 | 0.87 | 0.09 | 0.0011 |
| KRT19 | + | KRT17 | 0.12 | 0.59 | 3.7 × 10⁻⁸ |
| LHX2 | + | LHX1 | 0.31 | 0.55 | 2.7 × 10⁻⁶ |
| MET | ++ | MST1R | 0.19 | 0.006 | 0.00026 |
| MMP7 | + | MMP10 | 0.59 | 0.07 | 2.2 × 10⁻¹⁶ |
| MMP12 | - | MMP10 | 0.59 | 0.07 | 0.0012 |
| MMP14 | + | MMP10 | 0.59 | 0.07 | 1.2 × 10⁻⁷ |
| MMP19 | + | MMP10 | 0.59 | 0.07 | 0.0025 |
| MMP2 | + | MMP10 | 0.59 | 0.07 | 2.2 × 10⁻¹⁶ |
| NR5A2 | ++ | NR5A1 | 0.32 | 0.37 | 2.2 × 10⁻¹⁶ |
| NRTN | + | PSPN | 064 | 0.36 | 2.2 × 10⁻¹⁶ |
| RXRA | +++ | RXRG | 0.05 | 0.15 | 2.2 × 10⁻¹⁶ |
| SOX9 | * | SOX1 | 0.27 | 0.05 | 4.4 × 10⁻¹⁶ |
| SOX17 | + | SOX11 | 0.01 | 0.26 | 0.0005 |
| TBX3 | ++ | TBX2 | 0.34 | 0.02 | 5.6 × 10⁻⁷ |
| WT1 | - | EGR4 | 0.14 | 0.009 | 3.6 × 10⁻⁵ |
Table S2.
All liver development genes tested and their relative expression in HCV-cirrhosis, HCC-cirrhotic tissues, early stage HCC and late stage HCC. Fold-change (FC) is relative to normal controls.
| Probe Set ID | Gene name | Mean FC HCV-CIR | Mean FC Early HCC | Mean FC late HCC |
|---|---|---|---|---|
| NM_001105_at | ACVR1 | 1.01 | 1.09 | 0.90 |
| NM_004302_at | ACVR1B | 0.92 | 0.86 | 0.87 |
| NM_001616_at | ACVR2A | 0.82 | 0.96 | 0.96 |
| NM_001106_at | ACVR2B | 0.50 | 0.58 | 0.59 |
| NM_001663_at | ARF6 | 1.18 | 1.11 | 1.11 |
| NM_032199_at | ARID5B | 3.62 | 2.13 | 1.86 |
| NM_001880_at | ATF2 | 0.93 | 1.27 | 1.41 |
| NM_006856_at | ATF7 | 0.92 | 0.93 | 0.96 |
| NM_006395_at | ATG7 | 0.88 | 0.91 | 0.97 |
| NM_001200_at | BMP2 | 1.56 | 1.42 | 1.32 |
| NM_001202_at | BMP4 | 0.77 | 1.02 | 1.09 |
| NM_004329_at | BMPR1A | 1.38 | 1.37 | 1.32 |
| NM_001203_at | BMPR1B | 0.97 | 1.01 | 1.05 |
| NM_001204_at | BMPR2 | 1.00 | 1.09 | 1.02 |
| NM_001728_at | BSG | 1.28 | 1.23 | 1.31 |
| NM_014333_at | CADM1 | 1.60 | 1.68 | 1.89 |
| NM_053056_at | CCND1 | 1.38 | 1.34 | 0.81 |
| NM_001759_at | CCND2 | 1.16 | 1.16 | 1.22 |
| NM_057749_at | CCNE2 | 1.17 | 1.81 | 2.16 |
| NM_004360_at | CDH1 | 1.74 | 1.49 | 1.41 |
| NM_004364_at | CEBPA | 0.61 | 0.93 | 0.95 |
| NM_005454_at | CER1 | 0.81 | 0.89 | 0.99 |
| NM_006079_at | CITED2 | 2.74 | 1.93 | 1.63 |
| NM_001845_at | COL4A1 | 5.29 | 4.22 | 4.07 |
| NM_001846_at | COL4A2 | 3.84 | 2.59 | 2.30 |
| NM_000091_at | COL4A3 | 1.10 | 1.04 | 1.01 |
| NM_000092_at | COL4A4 | 1.54 | 1.16 | 1.24 |
| NM_000495_at | COL4A5 | 1.38 | 1.79 | 1.42 |
| NM_001847_at | COL4A6 | 0.93 | 0.95 | 0.95 |
| NM_000096_at | CP | 0.90 | 0.87 | 0.66 |
| NM_001893_at | CSNK1D | 1.47 | 1.05 | 1.09 |
| NM_001904_at | CTNNB1 | 0.86 | 1.18 | 1.05 |
| NM_012242_at | DKK1 | 1.07 | 3.86 | 1.75 |
| NM_001422_at | ELF5 | 0.89 | 0.97 | 1.01 |
| NM_002354_at | EPCAM | 14.99 | 14.35 | 5.72 |
| NM_004448_at | ERBB2 | 1.37 | 1.28 | 1.37 |
| NM_000800_at | FGF1 | 1.10 | 1.02 | 1.07 |
| NM_002006_at | FGF2 | 0.98 | 0.99 | 0.93 |
| NM_002009_at | FGF7 | 1.54 | 1.28 | 1.17 |
| NM_006119_at | FGF8 | 0.99 | 1.09 | 1.09 |
| NM_015850_at | FGFR1 | 1.11 | 1.04 | 0.98 |
| NM_000141_at | FGFR2 | 4.22 | 2.38 | 1.68 |
| NM_002026_at | FN1 | 1.08 | 1.17 | 1.28 |
| NM_004496_at | FOXA1 | 0.41 | 0.53 | 0.42 |
| NM_021784_at | FOXA2 | 0.61 | 0.67 | 0.66 |
| NM_202002_at | FOXM1 | 0.87 | 1.04 | 1.36 |
| NM_006350_at | FST | 1.32 | 2.08 | 1.95 |
| NM_005860_at | FSTL3 | 3.39 | 1.64 | 1.57 |
| NM_000151_at | G6PC | 1.53 | 1.30 | 1.13 |
| NM_002052_at | GATA4 | 0.67 | 0.75 | 0.81 |
| NM_005257_at | GATA6 | 2.84 | 1.67 | 0.91 |
| NM_001495_at | GFRA2 | 1.02 | 1.01 | 1.01 |
| NM_004484_at | GPC3 | 2.07 | 7.77 | 10.13 |
| NM_002086_at | GRB2 | 0.86 | 0.94 | 0.96 |
| NM_013372_at | GREM1 | 1.25 | 3.66 | 2.09 |
| NM_021973_at | HAND2 | 2.23 | 1.71 | 1.35 |
| NM_004494_at | HDGF | 1.06 | 1.16 | 1.25 |
| NM_014571_at | HEYL | 1.09 | 1.16 | 1.13 |
| NM_000601_at | HGF | 1.18 | 1.01 | 0.98 |
| NM_002729_at | HHEX | 0.83 | 1.27 | 1.10 |
| NM_021958_at | HLX | 1.16 | 1.14 | 1.06 |
| NM_003483_at | HMGA2 | 0.93 | 0.94 | 1.12 |
| NM_002129_at | HMGB2 | 2.53 | 3.26 | 3.46 |
| NM_000545_at | HNF1A | 0.72 | 0.87 | 0.86 |
| NM_000458_at | HNF1B | 1.33 | 0.99 | 1.11 |
| NM_000457_at | HNF4A | 0.86 | 0.96 | 1.04 |
| NM_006896_at | HOXA7 | 0.95 | 0.98 | 0.97 |
| NM_005529_at | HSPG2 | 1.22 | 1.05 | 1.04 |
| NM_012405_at | ICMT | 0.84 | 0.82 | 0.97 |
| NM_002166_at | ID2 | 0.83 | 0.77 | 0.68 |
| NM_002167_at | ID3 | 2.36 | 1.66 | 1.28 |
| NM_000612_at | IGF2 | 1.03 | 0.98 | 0.44 |
| NM_002184_at | IL6ST | 1.05 | 0.96 | 0.93 |
| NM_002191_at | INHA | 1.07 | 1.08 | 1.05 |
| NM_002192_at | INHBA | 0.86 | 1.32 | 1.26 |
| NM_002193_at | INHBB | 3.14 | 1.72 | 1.48 |
| NM_005538_at | INHBC | 0.66 | 0.77 | 0.77 |
| NM_031479_at | INHBE | 0.70 | 0.67 | 0.39 |
| NM_005544_at | IRS1 | 0.88 | 0.99 | 1.01 |
| NM_003749_at | IRS2 | 1.40 | 1.09 | 1.09 |
| NM_002204_at | ITGA3 | 1.38 | 1.19 | 1.34 |
| NM_002205_at | ITGA5 | 1.13 | 0.94 | 0.95 |
| NM_000210_at | ITGA6 | 1.44 | 1.83 | 1.76 |
| NM_033668_at | ITGB1 | 0.83 | 0.91 | 0.92 |
| NM_000213_at | ITGB4 | 1.04 | 1.06 | 1.09 |
| NM_000214_at | JAG1 | 2.22 | 2.06 | 1.91 |
| NM_000222_at | KIT | 2.05 | 1.61 | 1.49 |
| NM_001300_at | KLF6 | 3.97 | 2.66 | 1.73 |
| NM_004985_at | KRAS | 0.92 | 0.80 | 0.71 |
| NM_002276_at | KRT19 | 5.71 | 2.96 | 1.86 |
| NM_000426_at | LAMA2 | 4.34 | 2.31 | 1.76 |
| NM_000227_at | LAMA3 | 1.36 | 1.43 | 1.81 |
| NM_002290_at | LAMA4 | 1.12 | 1.27 | 1.26 |
| NM_005560_at | LAMA5 | 1.07 | 0.98 | 1.02 |
| NM_002291_at | LAMB1 | 3.44 | 2.45 | 1.91 |
| NM_002292_at | LAMB2 | 1.14 | 0.93 | 0.82 |
| NM_000228_at | LAMB3 | 0.86 | 0.93 | 0.92 |
| NM_007356_at | LAMB4 | 0.95 | 1.06 | 1.05 |
| NM_002293_at | LAMC1 | 1.43 | 1.58 | 1.66 |
| NM_005562_at | LAMC2 | 1.07 | 0.96 | 1.01 |
| NM_006059_at | LAMC3 | 2.33 | 1.41 | 1.30 |
| NM_016269_at | LEF1 | 1.19 | 1.16 | 1.20 |
| NM_004789_at | LHX2 | 1.11 | 0.87 | 0.77 |
| NM_003010_at | MAP2K4 | 1.07 | 0.97 | 0.95 |
| NM_004834_at | MAP4K4 | 0.92 | 1.29 | 1.33 |
| NM_001315_at | MAPK14 | 0.87 | 1.02 | 1.06 |
| NM_002750_at | MAPK8 | 0.98 | 1.00 | 1.09 |
| NM_002391_at | MDK | 1.71 | 2.69 | 2.42 |
| NM_000245_at | MET | 0.79 | 1.12 | 1.29 |
| NM_002421_at | MMP1 | 1.31 | 1.40 | 3.07 |
| NM_005940_at | MMP11 | 1.03 | 1.07 | 1.09 |
| NM_002426_at | MMP12 | 1.11 | 9.73 | 21.08 |
| NM_004995_at | MMP14 | 0.85 | 0.85 | 0.92 |
| NM_002428_at | MMP15 | 0.73 | 0.71 | 0.73 |
| NM_005941_at | MMP16 | 0.92 | 0.99 | 1.01 |
| NM_016155_at | MMP17 | 0.66 | 0.84 | 0.85 |
| NM_002429_at | MMP19 | 1.48 | 1.18 | 1.21 |
| NM_004530_at | MMP2 | 5.14 | 4.57 | 3.03 |
| NM_022468_at | MMP25 | 0.92 | 0.84 | 0.93 |
| NM_002423_at | MMP7 | 7.08 | 5.04 | 5.29 |
| NM_004994_at | MMP9 | 1.22 | 2.45 | 4.35 |
| NM_020998_at | MST1 | 0.93 | 0.62 | 0.53 |
| NM_005955_at | MTF1 | 0.89 | 0.95 | 0.98 |
| NM_005378_at | MYCN | 0.95 | 1.08 | 1.07 |
| NM_002487_at | NDN | 2.15 | 1.28 | 1.25 |
| NM_000267_at | NF1 | 0.91 | 0.89 | 0.92 |
| NM_003998_at | NFKB1 | 1.28 | 1.07 | 1.10 |
| NM_002508_at | NID1 | 1.11 | 0.90 | 0.86 |
| NM_014360_at | NKX2-8 | 0.99 | 1.15 | 1.06 |
| NM_024408_at | NOTCH2 | 1.05 | 0.82 | 0.86 |
| NM_000435_at | NOTCH3 | 1.08 | 1.06 | 1.12 |
| NM_003822_at | NR5A2 | 0.57 | 0.92 | 0.75 |
| NM_005011_at | NRF1 | 1.11 | 1.09 | 1.08 |
| NM_004558_at | NRTN | 0.33 | 0.39 | 0.36 |
| NM_004498_at | ONECUT1 | 1.03 | 1.01 | 0.92 |
| NM_004852_at | ONECUT2 | 0.88 | 0.98 | 0.93 |
| NM_020530_at | OSM | 1.16 | 1.17 | 1.18 |
| NM_006191_at | PA2G4 | 1.06 | 0.93 | 1.11 |
| NM_005392_at | PHF2 | 1.09 | 0.90 | 0.87 |
| NM_006218_at | PIK3CA | 1.11 | 1.11 | 1.04 |
| NM_181504_at | PIK3R1 | 1.22 | 0.87 | 0.77 |
| NM_002763_at | PROX1 | 0.76 | 0.67 | 0.43 |
| NM_002825_at | PTN | 2.08 | 1.56 | 1.37 |
| NM_002957_at | RXRA | 0.52 | 0.52 | 0.53 |
| NM_012432_at | SETDB1 | 0.98 | 1.11 | 1.16 |
| NM_003015_at | SFRP5 | 2.50 | 1.71 | 1.41 |
| NM_005901_at | SMAD2 | 1.36 | 1.44 | 1.48 |
| NM_005902_at | SMAD3 | 0.90 | 0.97 | 1.00 |
| NM_005359_at | SMAD4 | 0.97 | 0.99 | 0.98 |
| NM_005903_at | SMAD5 | 0.87 | 0.93 | 0.90 |
| NM_005585_at | SMAD6 | 1.17 | 1.06 | 0.99 |
| NM_005904_at | SMAD7 | 2.94 | 1.77 | 1.25 |
| NM_005905_at | SMAD9 | 0.97 | 0.98 | 0.97 |
| NM_022454_at | SOX17 | 1.20 | 1.08 | 0.96 |
| NM_000346_at | SOX9 | 4.81 | 2.99 | 3.12 |
| NM_000582_at | SPP1 | 9.75 | 9.54 | 16.41 |
| NM_003137_at | SRPK1 | 0.76 | 0.92 | 1.05 |
| NM_003150_at | STAT3 | 0.83 | 0.57 | 0.50 |
| NM_018234_at | STEAP3 | 0.57 | 0.57 | 0.34 |
| NM_016569_at | TBX3 | 0.78 | 1.55 | 1.76 |
| NM_003200_at | TCF3 | 1.03 | 1.07 | 1.10 |
| NM_000660_at | TGFB1 | 3.13 | 1.90 | 1.75 |
| NM_003238_at | TGFB2 | 0.95 | 0.99 | 0.98 |
| NM_003239_at | TGFB3 | 1.00 | 0.93 | 0.97 |
| NM_004612_at | TGFBR1 | 0.91 | 1.03 | 1.08 |
| NM_003242_at | TGFBR2 | 1.51 | 1.39 | 1.17 |
| NM_003243_at | TGFBR3 | 1.19 | 0.67 | 0.56 |
| NM_003255_at | TIMP2 | 1.43 | 1.50 | 1.33 |
| NM_003256_at | TIMP4 | 0.92 | 0.88 | 0.89 |
| NM_000594_at | TNF | 0.90 | 0.91 | 0.98 |
| NM_015542_at | UPF2 | 1.02 | 1.23 | 1.26 |
| NM_003380_at | VIM | 5.53 | 4.74 | 5.16 |
| NM_000378_at | WT1 | 1.08 | 1.09 | 1.08 |
| NM_005080_at | XBP1 | 0.64 | 0.86 | 0.73 |
| NM_006106_at | YAP1 | 1.06 | 0.96 | 0.75 |
| NM_015642_at | ZBTB20 | 2.03 | 1.38 | 1.25 |
| NM_014943_at | ZHX2 | 1.11 | 1.02 | 1.09 |
| NM_004773_at | ZNHIT3 | 1.25 | 1.40 | 1.38 |
Table S3.
Individual fold-change for BMP inhibitors in HCC samples.
| Sample | FSTL3 | GPC3 | GREM1 | FST |
|---|---|---|---|---|
| T1_377 | 1.7 | 8.9 | 1.5 | 2.0 |
| T1_527 | 2.0 | 2.2 | 1.1 | 1.1 |
| T1_607 | 2.6 | 1.6 | 1.1 | 0.8 |
| T2_116 | 1.7 | 17.2 | 0.9 | 4.3 |
| T2_184 | 1.3 | 1.7 | 13.7 | 1.0 |
| T2_309 | 1.6 | 2.5 | 1.0 | 1.7 |
| T2_334 | 2.1 | 3.6 | 1.0 | 1.9 |
| T2_342 | 0.9 | 15.4 | 4.6 | 3.9 |
| T2_388 | 3.2 | 1.9 | 27.5 | 0.9 |
| T2_422 | 1.0 | 1.7 | 1.4 | 2.8 |
| T2_451 | 2.5 | 1.8 | 0.9 | 1.6 |
| T2_507 | 1.7 | 1.3 | 1.1 | 1.1 |
| T2_524 | 2.1 | 2.7 | 1.2 | 1.3 |
| T2_550 | 1.2 | 23.5 | 1.4 | 3.8 |
| T2_588 | 1.1 | 27.7 | 2.4 | 1.2 |
| T2_614 | 1.1 | 1.1 | 1.2 | 2.1 |
| T2_657 | 1.1 | 6.3 | 12.7 | 1.7 |
| T2_666 | 1.5 | 12.4 | 1.2 | 1.8 |
| T2_718 | 1.1 | 1.0 | 0.9 | 1.8 |
| T2_728 | 1.1 | 10.9 | 13.0 | 1.1 |
| T2_753 | 3.0 | 1.5 | 2.6 | 0.5 |
| T2_753B | 1.8 | 0.8 | 1.1 | 0.3 |
| T2_787 | 1.2 | 2.5 | 1.4 | 1.7 |
| T2_R2926 | 1.4 | 41.5 | 8.0 | 6.3 |
| T2_R2927 | 1.4 | 1.4 | 0.9 | 3.8 |
| T2_R2928 | 1.3 | 1.3 | 1.1 | 2.9 |
| T2_R2929 | 1.0 | 14.3 | 0.9 | 2.2 |
| T2_ R3502 | 2.0 | 1.9 | 1.1 | 0.8 |
| T2_VM3 | 2.3 | 3.0 | 0.9 | 0.7 |
| T2_VM4 | 2.7 | 1.1 | 1.5 | 0.7 |
| T3_256 | 3.2 | 1.4 | 0.9 | 1.4 |
| T3_297 | 1.5 | 2.5 | 1.0 | 4.4 |
| T3_329 | 1.2 | 14.2 | 1.1 | 3.1 |
| T3_358 | 1.8 | 1.0 | 1.0 | 1.4 |
| T3_411 | 1.1 | 1.4 | 6.3 | 0.9 |
| T3_584 | 1.4 | 15.2 | 1.0 | 4.2 |
| T3_627 | 1.1 | 50.3 | 1.3 | 1.8 |
| T4_300 | 2.1 | 12.0 | 1.6 | 1.9 |
| T4_393 | 0.9 | 5.9 | 3.0 | 3.3 |
| T4_400 | 1.2 | 2.3 | 1.3 | 0.7 |
| T4_531 | 1.2 | 1.1 | 1.1 | 2.6 |
| T4_552 | 1.0 | 11.1 | 0.8 | 0.8 |
| T4_810 | 1.5 | 25.1 | 1.0 | 1.8 |
| T4_R2858 | 1.3 | 21.3 | 1.1 | 4.4 |
| T4A_VM1 | 2.3 | 3.0 | 1.0 | 1.1 |
| T4B_324 | 1.0 | 24.5 | 0.9 | 1.3 |
| T4B_353 | 1.0 | 1.2 | 11.1 | 1.7 |
| T4B_381 | 1.9 | 1.6 | 1.3 | 1.3 |
| T4B_382 | 1.5 | 1.9 | 1.4 | 2.2 |
© 2012 by the authors; licensee MDPI, Basel, Switzerland. This article is an open access article distributed under the terms and conditions of the Creative Commons Attribution license (http://creativecommons.org/licenses/by/3.0/).