
Prognostic Value of Post-Transplant MRD Negativity in Standard Versus High- and Ultra-High-Risk Multiple Myeloma Patients

 , ,
, ,  and
and 
Simple Summary
Abstract
1. Introduction
2. Results
2.1. Patient Characteristics
2.2. Course of Treatment
2.3. Response
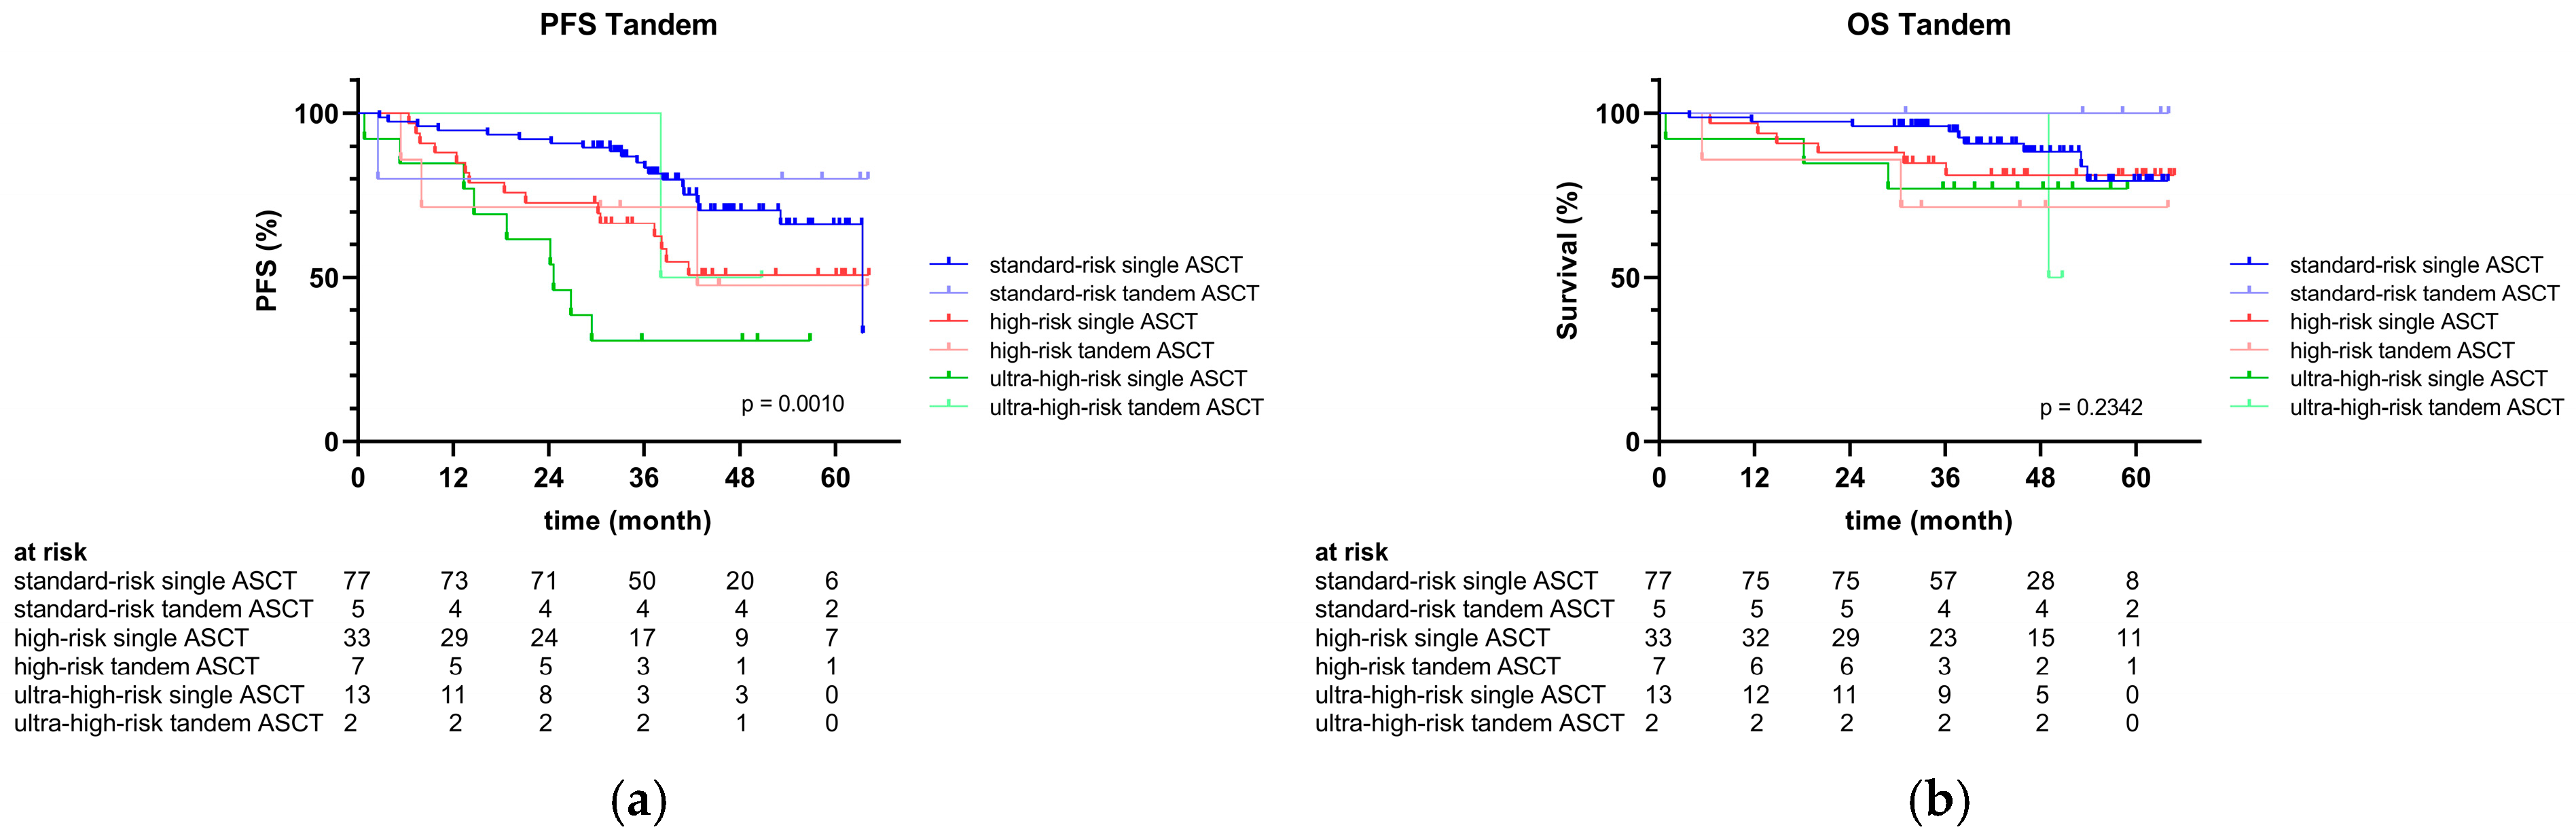
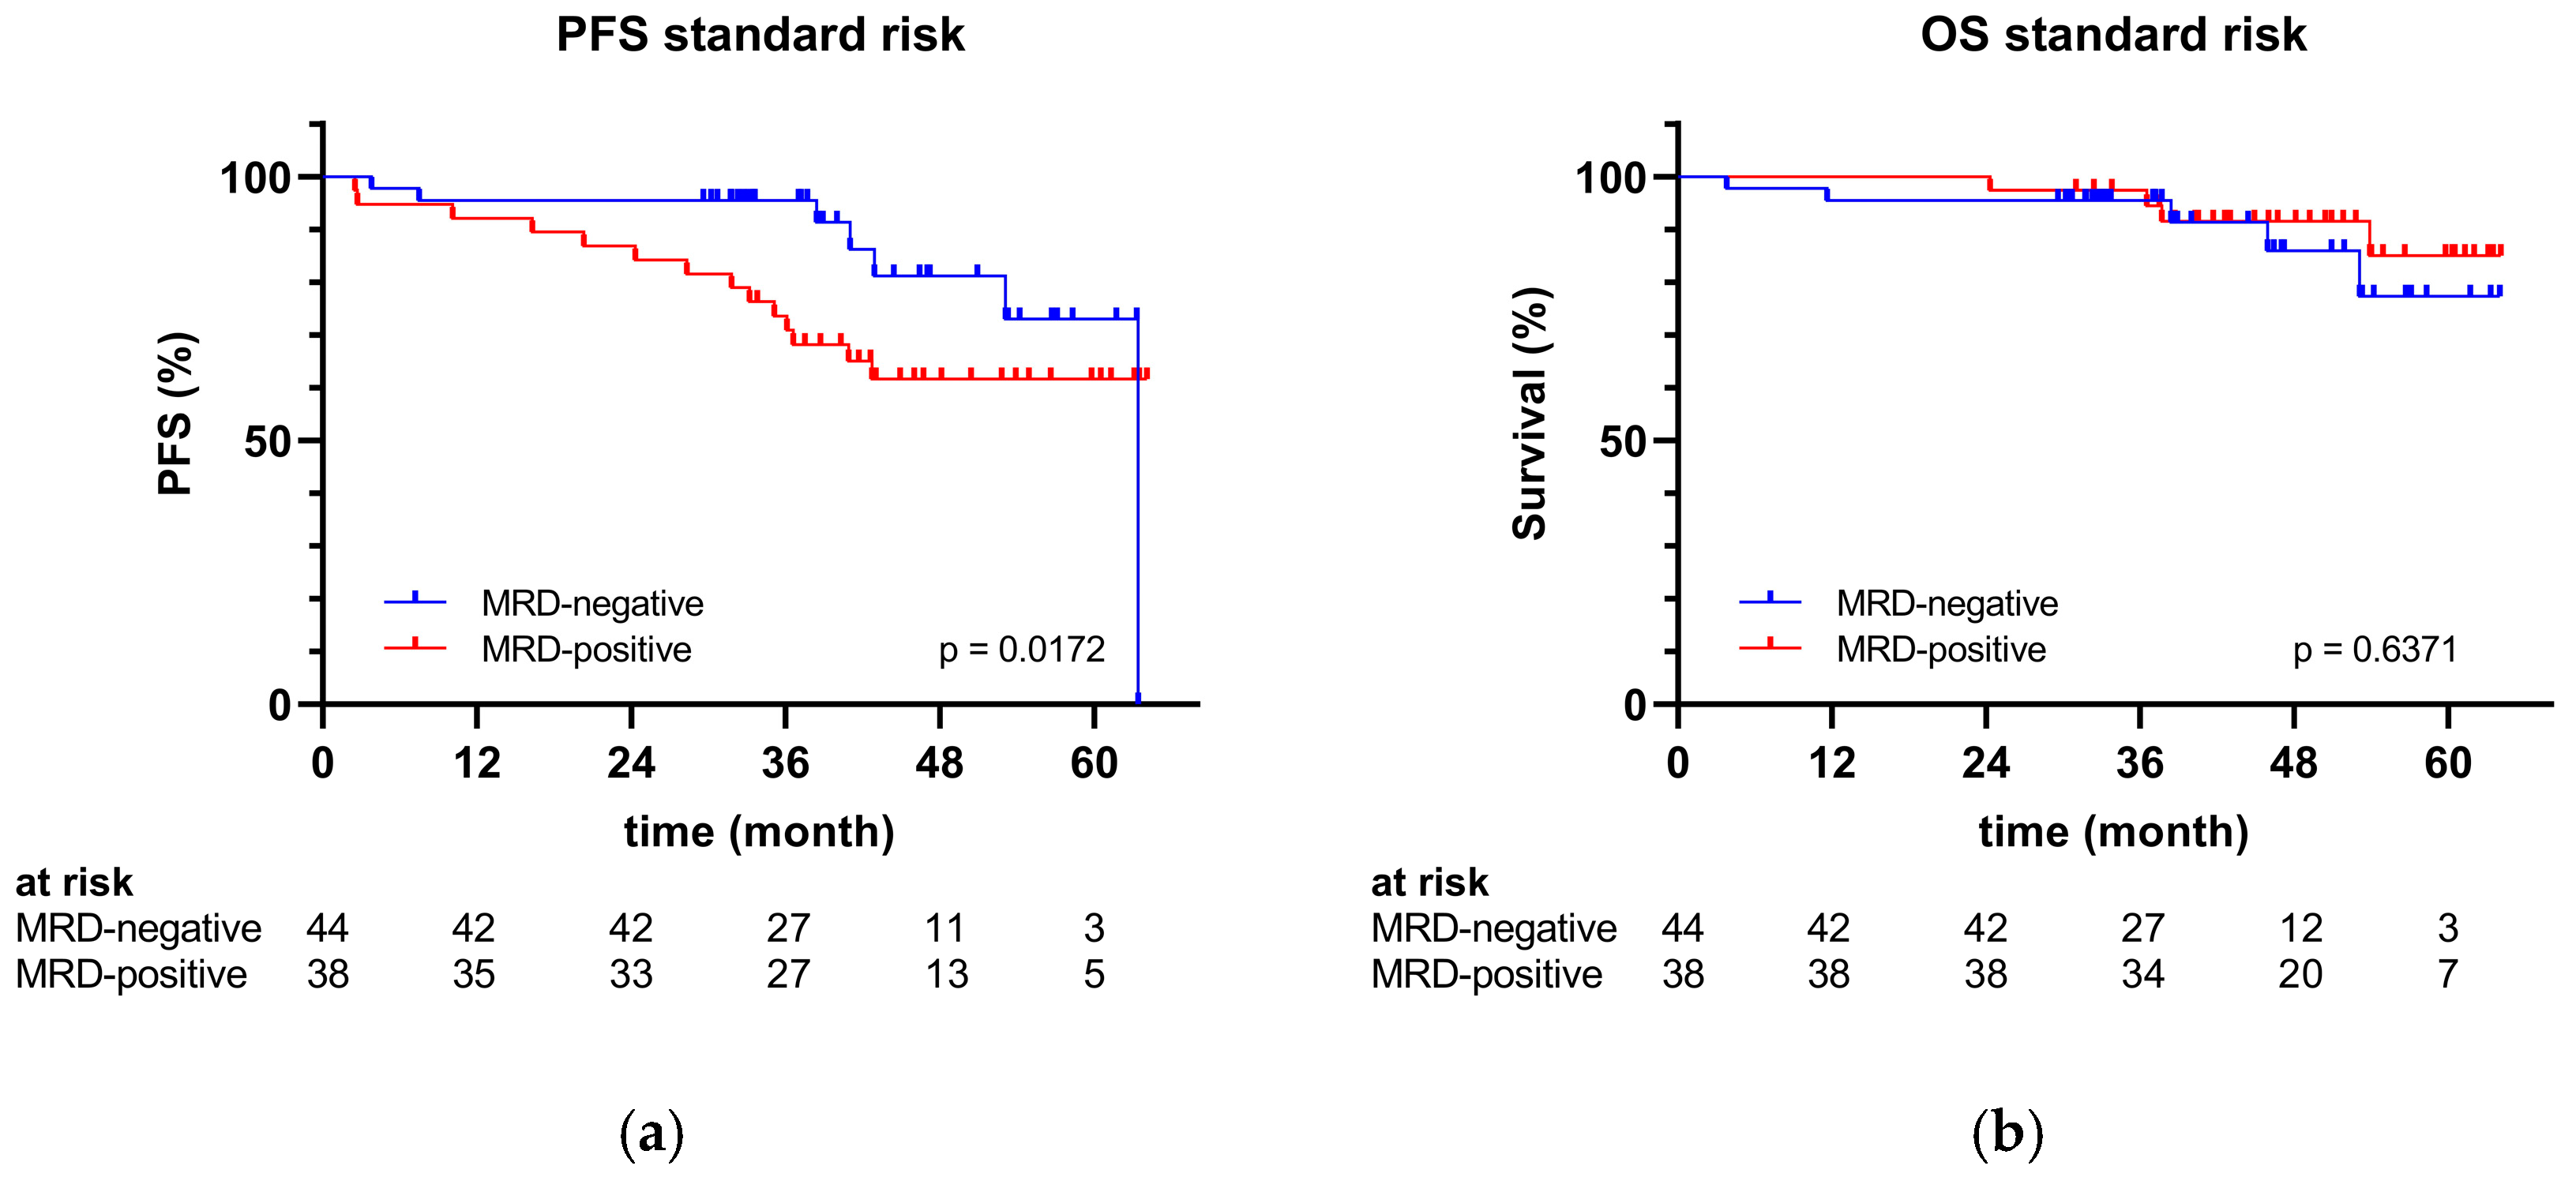
2.4. Clinical Outcomes
3. Discussion
4. Materials and Methods
4.1. Patients
4.2. Cytogenetics
4.3. MRD
4.4. Endpoints
4.5. Statistical Analysis
5. Conclusions
Author Contributions
Funding
Institutional Review Board Statement
Informed Consent Statement
Data Availability Statement
Conflicts of Interest
Appendix A

| Parameter |
Total (n = 137) |
Standard-Risk Genetics (n = 82) |
High-Risk Genetics (n = 40) |
Ultra-High-Risk Genetics b (n = 15) |
|---|---|---|---|---|
| High-risk cytogenetic abnormality, n (%) | 55 (40) | 0 (0) | 40 (100) | 15 (100) |
| del(17p) | 9 (7) | - | 5 (13) | 4 (27) |
| t(4;14) | 23 (17) | - | 14 (35) | 9 (60) |
| t(14;16) | 2 (1) | - | 1 (3) | 1 (7) |
| t(14;20) | 1 (1) | - | 0 (0) | 1 (7) |
| +1q | 31 (23) | - | 17 (43) | 14 (93) |
| TP53 mutation | 6 (4) | - | 3 (8) | 3 (20) |
| Standard-risk cytogenetic abnormality a, n (%) | 117 (85) | 82 (100) | 23 (58) | 12 (80) |
| t(11;14) | 26 (19) | 20 (24) | 5 (13) | 1 (7) |
| t(6;14) | 0 (0) | 0 (0) | 0 (0) | 0 (0) |
| del(1p) | 14 (10) | 6 (7) | 4 (10) | 4 (27) |
| Hypodiploidy | 27 (20) | 11 (13) | 9 (23) | 7 (47) |
| −13 | 24 (18) | 9 (11) | 8 (20) | 7 (47) |
| Hyperdiploidy | 53 (39) | 38 (46) | 10 (25) | 5 (33) |
| +3 | 34 (25) | 24 (29) | 7 (18) | 3 (20) |
| +5 | 25 (18) | 19 (23) | 3 (8) | 3 (20) |
| +7 | 22 (16) | 15 (18) | 3 (8) | 4 (27) |
| +9 | 25 (18) | 20 (24) | 3 (8) | 2 (13) |
| +11 | 22 (16) | 15 (18) | 3 (8) | 4 (27) |
| +15 | 27 (20) | 20 (24) | 5 (13) | 2 (13) |
| +19 | 25 (18) | 20 (24) | 3 (8) | 2 (13) |
| +21 | 15 (16) | 12 (15) | 1 (3) | 2 (13) |
| Patient | Genetic Risk Classification | Karyotype in ISCN Format |
|---|---|---|
| 1 | Standard risk | 54,XY,+3,+4,+7,+9,+15,+17,+19,+21,dup(8)(q),dup(11)(q) |
| 2 | Standard risk | 57,XY,+3,+4,+5,+7,+9,+9,+11,+12,+15,+15,+19 |
| 3 | Standard risk | ?,XY,? |
| 4 | Standard risk | 48,XY,+15,+19,+21,−Y |
| 5 | Standard risk | ?,XX,+? |
| 6 | Standard risk | 54,XY,+3,+4,+9,+11,+15,+19,+20,+21 |
| 7 | Standard risk | 46,XY,t(11;14) |
| 8 | Standard risk | 46,XY,t(11;14),del(16)(q) |
| 9 | Standard risk | ?,XX,? |
| 10 | Standard risk | 46,XY,t(11;14) |
| 11 | Standard risk | 49,XX,+3,+9,+15 |
| 12 | Standard risk | 50,XY,+5,+9,+15,+19,del(1)(p) |
| 13 | Standard risk | 51,XY,+3,+5,+11,+15,+19 |
| 14 | Standard risk | 54,XY,+3,+5,+7,+9,+11,+15,+19,+Y,del(1)(p) |
| 15 | Standard risk | ?,XX,+? |
| 16 | Standard risk | 50,XX,+1,+3,+7,+9,−13,+15 |
| 17 | Standard risk | 53,XY,+3,+5,+7,+9,+15,−16,+19,+21,+Y |
| 18 | Standard risk | 61,XY,+1,+2,+3,+4,+5,+6,+7,+9,+11,+15,+15,+17,+19,+19,+21 |
| 19 | Standard risk | 50,XX,+3,+9,+9,+15,dup(4)(p),dup(11)(q),dup(20)(q) |
| 20 | Standard risk | 46,XY,t(11;14) |
| 21 | Standard risk | ?,XY,? |
| 22 | Standard risk | 46,XY,t(11;14) |
| 23 | Standard risk | 44,XY,−13,−14,del(1)(p) |
| 24 | Standard risk | 46,XX,t(11;14) |
| 25 | Standard risk | 55,XY,+3,+5,+9,+9,+11,+15,+19,+21,+22 |
| 26 | Standard risk | 46,XY,t(11;14) |
| 27 | Standard risk | ?,XX,? |
| 28 | Standard risk | ?,XX,+?,del(1)(p) |
| 29 | Standard risk | 46,XX,del(1)(p) |
| 30 | Standard risk | 46,XX,t(11;14),del(16)(q) |
| 31 | Standard risk | 46,XX,t(11;14) |
| 32 | Standard risk | ?,XX,? |
| 33 | Standard risk | ?,XY,? |
| 34 | Standard risk | 46,XY,t(11;14) |
| 35 | Standard risk | 46,XX,t(11;14) |
| 36 | Standard risk | 49,XY,+4,+9,+11 |
| 37 | Standard risk | ?,XY,? |
| 38 | Standard risk | 53,XY,+3,+5,+7,+9,+9,+15,+19 |
| 39 | Standard risk | 53,XY,+3,+5,+9,+11,+15,+19,+Y |
| 40 | Standard risk | 43,XX,−13,−14,−22 |
| 41 | Standard risk | ?,XY,? |
| 42 | Standard risk | 55,XY,+3,+5,+6,+9,+9,+15,+15,+19,+21 |
| 43 | Standard risk | 45,XX,−13,dup(18)(q),del(20)(p) |
| 44 | Standard risk | 55,XY,+3,+5,+7,+9,+11,+15,+19,+19,+21 |
| 45 | Standard risk | 43,XY,t(11;14),−13,−14,−Y |
| 46 | Standard risk | ?,XX,? |
| 47 | Standard risk | 46,XX,t(11;14) |
| 48 | Standard risk | 50,XY,+3,+7,+9,+15 |
| 49 | Standard risk | 49,XY,+3,+7,+9 |
| 50 | Standard risk | ?,XY,? |
| 51 | Standard risk | ?,XY,? |
| 52 | Standard risk | ?,XY,? |
| 53 | Standard risk | ?,XY,? |
| 54 | Standard risk | 48,XX,+5,+9,+11,−13,−16,+19,dup(1)(p),del(17)(q),dup(18)(p) |
| 55 | Standard risk | 46,XY,t(11;14) |
| 56 | Standard risk | ?,XY,? |
| 57 | Standard risk | 48,XY,+9,+15 |
| 58 | Standard risk | ?,XY,? |
| 59 | Standard risk | 58,XY,+2,+3,+5,+6,+7,+9,+9,+11,+15,+15,+19,+21 |
| 60 | Standard risk | 42,XX,−13,−14,−16,−X |
| 61 | Standard risk | ?,XY,? |
| 62 | Standard risk | 65,XY,+2,+3,+5,+7,+9,+9,+11,+11,+13,+14,+15,+15,+16,+18,+18,+19,+19,+20,+20 |
| 63 | Standard risk | 46,XY,t(11;14) |
| 64 | Standard risk | 49,XY,+6,+9,+19 |
| 65 | Standard risk | ?,XY,+? |
| 66 | Standard risk | 47,XY,+12 |
| 67 | Standard risk | 46,XY,+3,−13 |
| 68 | Standard risk | 50,XY,+14,+14,+16,+16 |
| 69 | Standard risk | ?,XY,? |
| 70 | Standard risk | 45,XY,−13,del(13)(q) |
| 71 | Standard risk | ?,XX,? |
| 72 | Standard risk | 54,XY,+3,+5,+6,+9,+11,+15,+17,+19,del(1)(p) |
| 73 | Standard risk | 54,XY,+3,+5,+7,+9,+11,+15,+19,+21 |
| 74 | Standard risk | ?,XY,t(9;14),+? |
| 75 | Standard risk | 56,XY,+3,+4,+5,+6,+7,+9,+11,+15,+19,+21,dup(8)(q) |
| 76 | Standard risk | 46,XX,t(11;14) |
| 77 | Standard risk | 46,XX,dup(8)(q) |
| 78 | Standard risk | 46,XY,t(11;14) |
| 79 | Standard risk | 46,XY,t(11;14) |
| 80 | Standard risk | 46,XX,t(11;14) |
| 81 | Standard risk | 47,XY,t(11;14),+19 |
| 82 | Standard risk | 53,XY,+3,+5,+7,+9,+11,+15,+19 |
| 83 | High risk | 46,XX,dup(1)(q),dup(14)(q),del(16)(q) |
| 84 | High risk | 45,XY,−13,dup(1)(q) |
| 85 | High risk | 46,XY,t(4;14) |
| 86 | High risk | 46,XY,del(17)(p) |
| 87 | High risk | 46,XY,t(4;14),del(14)(q) |
| 88 | High risk | 46,XX,del(17)(p) |
| 89 | High risk | 46,XX,t(4;14) |
| 90 | High risk | ?,XY,? |
| 91 | High risk | 46,XX,t(4;14) |
| 92 | High risk | 46,XX,t(4;14) |
| 93 | High risk | 46,XX,t(11;14),dup(1)(q) |
| 94 | High risk | 46,XX,del(8)(q),del(14)(q),del(17)(p) |
| 95 | High risk | 47,XY,t(11;14),+11,dup(1)(q),dup(11)(q) |
| 96 | High risk | 46,XY,dup(1)(q) |
| 97 | High risk | 46,XY,t(11;14),dup(1)(q) |
| 98 | High risk | ?,XY,? |
| 99 | High risk | 46,XX,t(14;16) |
| 100 | High risk | 46,XY,t(4;14) |
| 101 | High risk | ?,XX,? |
| 102 | High risk | 45,XY,−13,−Y,dup(1)(q) |
| 103 | High risk | 45,XY,t(4;14),+3,−13,−18 |
| 104 | High risk | 50,XY,+3,+7,+9,+15,del(1)(p),dup(1)(q) |
| 105 | High risk | 46,XY,t(4;14) |
| 106 | High risk | 46,XX,t(4;14) |
| 107 | High risk | 46,XY,del(1)(p),dup(1)(q) |
| 108 | High risk | 57,XX,+3,+5,+7,+7,+9,+10,+15,+17,+18,+19,+19,dup(1)(q) |
| 109 | High risk | 44,XX,t(11;14),−13,−X,dup(1)(q) |
| 110 | High risk | 46,XX,t(4;14) |
| 111 | High risk | 46,XY,t(11;14),dup(1)(q),del(13)(q) |
| 112 | High risk | 51,XX,+3,+5,+7,+11,+19,dup(1)(q),del(13)(q) |
| 113 | High risk | 46,XY,dup(4)(p),del(17)(p),del(20)(q) |
| 114 | High risk | 51,XY,t(4;14),+3,+4,+15,+19,+21 |
| 115 | High risk | 46,XY,dup(1)(q) |
| 116 | High risk | 46,XX,t(4;14),+8,−13 |
| 117 | High risk | 50,XX,t(4;14),+3,+5,+11,−13,+15,+19,del(1)(p) |
| 118 | High risk | 49,XY,+3,+7,+9,−13,+15,dup(1)(q) |
| 119 | High risk | 46,XY,t(4;14) |
| 120 | High risk | 46,XY,dup(1)(q) |
| 121 | High risk | 44,XY,−12,−14,+18,−Y,del(1)(p),dup(1)(q),del(2)(q),del(5)(p),dup(5)(q),del(6)(q), del(7)(p),dup(9)(q),del(11)(q),del(15)(q),del(16)(q),del(20)(p) |
| 122 | High risk | 33,XY,−1,−2,−4,−6,−8,−10,−12,−13,−14,−16,−17,−20,−22,del(17)(p) |
| 123 | Ultra-high risk | 44,XY,−13,−16,dup(1)(q),del(17)(p) |
| 124 | Ultra-high risk | 53,XY,t(14;20),+3,+5,+7,+8,+11,−13,+18,+19,+21,dup(1)(q),dup(5)(p),dup(9)(q), dup(10)(q) |
| 125 | Ultra-high risk | 45,XX,t(4;14),−13,dup(1)(q) |
| 126 | Ultra-high risk | 45,XY,t(4;14),−13,del(1)(p),dup(1)(q) |
| 127 | Ultra-high risk | 46,XX,t(4;14),del(1)(p),dup(1)(q) |
| 128 | Ultra-high risk | 46,XX,t(14;16),dup(1)(q) |
| 129 | Ultra-high risk | 46,XX,t(4;14),dup(1)(q) |
| 130 | Ultra-high risk | 46,XY,t(4;14),dup(1)(q) |
| 131 | Ultra-high risk | 42,XY,t(4;14),−2,−9,−13,−Y,del(1)(p),dup(1)(q),del(13)(p) |
| 132 | Ultra-high risk | 45,XY,t(4;14),−13,dup(1)(q) |
| 133 | Ultra-high risk | 56,XY,t(4;14),+2,+3,+5,+7,+9,+11,+15,+17,+19,+21,dup(1)(q) |
| 134 | Ultra-high risk | 52,XY,t(11;14),+4,+7,+8,+9,+11,+15,del(17)(p) |
| 135 | Ultra-high risk | 45,XY,t(4;14),−13,dup(1)(q) |
| 136 | Ultra-high risk | 54,XY,+3,+5,+7,+11,+15,+15,+19,+19,dup(1)(q),del(17)(p) |
| 137 | Ultra-high risk | ?,XX,+?,del(1)(p),dup(1)(q),del(17)(p) |
| Parameter. | Total (n = 137) | Standard-Risk Genetics (n = 82) | High-Risk Genetics (n = 40) | Ultra-High-Risk Genetics (n = 15) | p-Value |
|---|---|---|---|---|---|
| First-line induction therapy received, n (%) | 137 (100) | 82 (100) | 40 (100) | 15 (100) | - |
| VRD | 118 (86) | 68 (83) | 35 (87) | 15 (100) | 0.2036 |
| Dara-VRD | 5 (4) | 3 (4) | 2 (5) | 0 (0) | - |
| VCD | 8 (6) | 6 (7) | 2 (5) | 0 (0) | - |
| VTD | 1 (1) | 1 (1) | 0 (0) | 0 (0) | - |
| VD | 3 (2) | 2 (2) | 1 (3) | 0 (0) | - |
| Dara-RD | 2 (1) | 2 (2) | 0 (0) | 0 (0) | - |
| Second-line induction therapy received, n (%) | 5 (4) | 4 (5) | 1 (3) | 0 (0) | - |
| Third-line induction therapy received, n (%) | 3 (2) | 3 (4) | 0 (0) | 0 (0) | - |
| Stem cell mobilisation a, n (%) | |||||
| G-CSF only | 41 (30) | 24 (29) | 12 (30) | 5 (33) | 0.9512 |
| Chemotherapy b, G-CSF | 80 (58) | 51 (62) | 22 (55) | 7 (47) | 0.4662 |
| Proteasome inhibitor c, G-CSF | 13 (10) | 6 (8) | 4 (10) | 3 (20) | 0.3024 |
| HDCT | |||||
| Melphalan | 43 (31) | 24 (29) | 14 (35) | 5 (33) | 0.8026 |
| Bendamustin, Melphalan | 29 (21) | 18 (22) | 7 (18) | 4 (27) | 0.7318 |
| Treosulfan, Melphalan | 65 (48) | 40 (49) | 19 (47) | 6 (40) | 0.8220 |
| Tandem ASCT received, n (%) | 14 (10) | 5 (6) | 7 (18) | 2 (13) | 0.1361 |
| Maintenance therapy d | |||||
| Lenalidomide | 119 (87) | 75 (92) | 31 (78) | 13 (87) | 0.1006 |
| Bortezomib | 3 (2) | 1 (1) | 0 (0) | 2 (13) | - |
| Carfilzomib | 2 (2) | 1 (1) | 1 (3) | 0 (0) | - |
| Ixazomib | 3 (2) | 0 (0) | 2 (5) | 1 (7) | - |
| Daratumumab | 6 (4) | 3 (4) | 2 (5) | 1 (7) | - |
| Pomalidomide, Elotuzumab | 1 (1) | 1 (1) | 0 (0) | 0 (0) | - |
| None | 12 (9) | 5 (6) | 6 (15) | 1 (7) | 0.2518 |
References
- van de Donk, N.W.C.J.; Pawlyn, C.; Yong, K.L. Multiple Myeloma. Lancet 2021, 397, 410–427. [Google Scholar] [CrossRef] [PubMed]
- Cowan, A.J.; Allen, C.; Barac, A.; Basaleem, H.; Bensenor, I.; Curado, M.P.; Foreman, K.; Gupta, R.; Harvey, J.; Hosgood, H.D.; et al. Global Burden of Multiple Myeloma: A Systematic Analysis for the Global Burden of Disease Study 2016. JAMA Oncol. 2018, 4, 1221. [Google Scholar] [CrossRef]
- Richardson, P.G.; Jacobus, S.J.; Weller, E.A.; Hassoun, H.; Lonial, S.; Raje, N.S.; Medvedova, E.; McCarthy, P.L.; Libby, E.N.; Voorhees, P.M.; et al. Triplet Therapy, Transplantation, and Maintenance until Progression in Myeloma. N. Engl. J. Med. 2022, 387, 132–147. [Google Scholar] [CrossRef]
- Hagen, P.; Zhang, J.; Barton, K. High-Risk Disease in Newly Diagnosed Multiple Myeloma: Beyond the R-ISS and IMWG Definitions. Blood Cancer J. 2022, 12, 83. [Google Scholar] [CrossRef] [PubMed]
- Palumbo, A.; Avet-Loiseau, H.; Oliva, S.; Lokhorst, H.M.; Goldschmidt, H.; Rosinol, L.; Richardson, P.; Caltagirone, S.; Lahuerta, J.J.; Facon, T.; et al. Revised International Staging System for Multiple Myeloma: A Report From International Myeloma Working Group. J. Clin. Oncol. 2015, 33, 2863–2869. [Google Scholar] [CrossRef]
- Rajkumar, S.V. Multiple Myeloma: 2022 Update on Diagnosis, Risk Stratification, and Management. Am. J. Hematol. 2022, 97, 1086–1107. [Google Scholar] [CrossRef] [PubMed]
- Costa, L.J.; Chhabra, S.; Medvedova, E.; Dholaria, B.R.; Schmidt, T.M.; Godby, K.N.; Silbermann, R.; Dhakal, B.; Bal, S.; Giri, S.; et al. Daratumumab, Carfilzomib, Lenalidomide, and Dexamethasone with Minimal Residual Disease Response-Adapted Therapy in Newly Diagnosed Multiple Myeloma. J. Clin. Oncol. 2022, 40, 2901–2912. [Google Scholar] [CrossRef]
- Derman, B.A.; Fonseca, R. Measurable Residual Disease and Decision-Making in Multiple Myeloma. Hematol. Oncol. Clin. N. Am. 2024, 38, 477–495. [Google Scholar] [CrossRef]
- Chakraborty, R.; Muchtar, E.; Kumar, S.K.; Jevremovic, D.; Buadi, F.K.; Dingli, D.; Dispenzieri, A.; Hayman, S.R.; Hogan, W.J.; Kapoor, P.; et al. Impact of Post-Transplant Response and Minimal Residual Disease on Survival in Myeloma with High-Risk Cytogenetics. Biol. Blood Marrow Transplant. 2017, 23, 598–605. [Google Scholar] [CrossRef]
- Kumar, S.; Paiva, B.; Anderson, K.C.; Durie, B.; Landgren, O.; Moreau, P.; Munshi, N.; Lonial, S.; Bladé, J.; Mateos, M.-V.; et al. International Myeloma Working Group Consensus Criteria for Response and Minimal Residual Disease Assessment in Multiple Myeloma. Lancet Oncol. 2016, 17, e328–e346. [Google Scholar] [CrossRef]
- Paiva, B.; Vidriales, M.-B.; Cerveró, J.; Mateo, G.; Pérez, J.J.; Montalbán, M.A.; Sureda, A.; Montejano, L.; Gutiérrez, N.C.; García de Coca, A.; et al. Multiparameter Flow Cytometric Remission Is the Most Relevant Prognostic Factor for Multiple Myeloma Patients Who Undergo Autologous Stem Cell Transplantation. Blood 2008, 112, 4017–4023. [Google Scholar] [CrossRef] [PubMed]
- Paiva, B.; Gutiérrez, N.C.; Rosiñol, L.; Vídriales, M.-B.; Montalbán, M.-Á.; Martínez-López, J.; Mateos, M.-V.; Cibeira, M.-T.; Cordón, L.; Oriol, A.; et al. High-Risk Cytogenetics and Persistent Minimal Residual Disease by Multiparameter Flow Cytometry Predict Unsustained Complete Response after Autologous Stem Cell Transplantation in Multiple Myeloma. Blood 2012, 119, 687–691. [Google Scholar] [CrossRef] [PubMed]
- Rawstron, A.C.; Child, J.A.; de Tute, R.M.; Davies, F.E.; Gregory, W.M.; Bell, S.E.; Szubert, A.J.; Navarro-Coy, N.; Drayson, M.T.; Feyler, S.; et al. Minimal Residual Disease Assessed by Multiparameter Flow Cytometry in Multiple Myeloma: Impact on Outcome in the Medical Research Council Myeloma IX Study. J. Clin. Oncol. 2013, 31, 2540–2547. [Google Scholar] [CrossRef]
- Martinez-Lopez, J.; Lahuerta, J.J.; Pepin, F.; González, M.; Barrio, S.; Ayala, R.; Puig, N.; Montalban, M.A.; Paiva, B.; Weng, L.; et al. Prognostic Value of Deep Sequencing Method for Minimal Residual Disease Detection in Multiple Myeloma. Blood 2014, 123, 3073–3079. [Google Scholar] [CrossRef]
- Risky Business: Examining the Challenge with Defining High-Risk and Ultra High–Risk Multiple Myeloma. Available online: https://dailynews.ascopubs.org/doi/10.1200/ADN.23.201523 (accessed on 4 November 2024).
- Rawstron, A.C.; Gregory, W.M.; de Tute, R.M.; Davies, F.E.; Bell, S.E.; Drayson, M.T.; Cook, G.; Jackson, G.H.; Morgan, G.J.; Child, J.A.; et al. Minimal Residual Disease in Myeloma by Flow Cytometry: Independent Prediction of Survival Benefit per Log Reduction. Blood 2015, 125, 1932–1935. [Google Scholar] [CrossRef]
- Li, H.; Li, F.; Zhou, X.; Mei, J.; Song, P.; An, Z.; Zhao, Q.; Guo, X.; Wang, X.; Zhai, Y. Achieving Minimal Residual Disease-Negative by Multiparameter Flow Cytometry May Ameliorate a Poor Prognosis in MM Patients with High-Risk Cytogenetics: A Retrospective Single-Center Analysis. Ann. Hematol. 2019, 98, 1185–1195. [Google Scholar] [CrossRef] [PubMed]
- Munshi, N.C.; Avet-Loiseau, H.; Rawstron, A.C.; Owen, R.G.; Child, J.A.; Thakurta, A.; Sherrington, P.; Samur, M.K.; Georgieva, A.; Anderson, K.C.; et al. Association of Minimal Residual Disease with Superior Survival Outcomes in Patients with Multiple Myeloma: A Meta-Analysis. JAMA Oncol. 2017, 3, 28–35. [Google Scholar] [CrossRef]
- Hu, B.; Thall, P.; Milton, D.R.; Sasaki, K.; Bashir, Q.; Shah, N.; Patel, K.; Popat, U.; Hosing, C.; Nieto, Y.; et al. High-Risk Myeloma and Minimal Residual Disease Postautologous-HSCT Predict Worse Outcomes. Leuk. Lymphoma 2019, 60, 442–452. [Google Scholar] [CrossRef]
- Kunacheewa, C.; Lee, H.C.; Patel, K.; Thomas, S.; Amini, B.; Srour, S.; Bashir, Q.; Nieto, Y.; Qazilbash, M.H.; Weber, D.M.; et al. Minimal Residual Disease Negativity Does Not Overcome Poor Prognosis in High-Risk Multiple Myeloma: A Single-Center Retrospective Study. Clin. Lymphoma Myeloma Leuk. 2020, 20, e221–e238. [Google Scholar] [CrossRef]
- Paiva, B.; Puig, N.; Cedena, M.-T.; Rosiñol, L.; Cordón, L.; Vidriales, M.-B.; Burgos, L.; Flores-Montero, J.; Sanoja-Flores, L.; Lopez-Anglada, L.; et al. Measurable Residual Disease by Next-Generation Flow Cytometry in Multiple Myeloma. J. Clin. Oncol. 2020, 38, 784–792. [Google Scholar] [CrossRef]
- Joseph, N.S.; Kaufman, J.L.; Dhodapkar, M.V.; Hofmeister, C.C.; Almaula, D.K.; Heffner, L.T.; Gupta, V.A.; Boise, L.H.; Lonial, S.; Nooka, A.K. Long-Term Follow-Up Results of Lenalidomide, Bortezomib, and Dexamethasone Induction Therapy and Risk-Adapted Maintenance Approach in Newly Diagnosed Multiple Myeloma. JCO 2020, 38, 1928–1937. [Google Scholar] [CrossRef] [PubMed]
- Avet-Loiseau, H.; Fonseca, R.; Siegel, D.; Dimopoulos, M.A.; Špička, I.; Masszi, T.; Hájek, R.; Rosiñol, L.; Goranova-Marinova, V.; Mihaylov, G.; et al. Carfilzomib Significantly Improves the Progression-Free Survival of High-Risk Patients in Multiple Myeloma. Blood 2016, 128, 1174–1180. [Google Scholar] [CrossRef]
- Shah, V.; Sherborne, A.L.; Walker, B.A.; Johnson, D.C.; Boyle, E.M.; Ellis, S.; Begum, D.B.; Proszek, P.Z.; Jones, J.R.; Pawlyn, C.; et al. Prediction of Outcome in Newly Diagnosed Myeloma: A Meta-Analysis of the Molecular Profiles of 1905 Trial Patients. Leukemia 2018, 32, 102–110. [Google Scholar] [CrossRef] [PubMed]
- Panopoulou, A.; Easdale, S.; Ethell, M.; Nicholson, E.; Potter, M.; Giotas, A.; Woods, H.; Thornton, T.; Pawlyn, C.; Boyd, K.D.; et al. Impact of Ultra High-Risk Genetics on Real-World Outcomes of Transplant-Eligible Multiple Myeloma Patients. Hemasphere 2023, 7, e831. [Google Scholar] [CrossRef] [PubMed]
- Amsler, I.G.; Jeker, B.; Mansouri Taleghani, B.; Bacher, U.; Betticher, D.; Egger, T.; Zander, T.; Luethi, J.-M.; Novak, U.; Pabst, T. Prolonged Survival with Increasing Duration of Lenalidomide Maintenance after Autologous Transplant for Multiple Myeloma. Leuk. Lymphoma 2019, 60, 511–514. [Google Scholar] [CrossRef]
- Panopoulou, A.; Cairns, D.A.; Holroyd, A.; Nichols, I.; Cray, N.; Pawlyn, C.; Cook, G.; Drayson, M.; Boyd, K.; Davies, F.E.; et al. Optimizing the Value of Lenalidomide Maintenance by Extended Genetic Profiling: An Analysis of 556 Patients in the Myeloma XI Trial. Blood 2023, 141, 1666–1674. [Google Scholar] [CrossRef]
- Shah, V.; Sherborne, A.L.; Johnson, D.C.; Ellis, S.; Price, A.; Chowdhury, F.; Kendall, J.; Jenner, M.W.; Drayson, M.T.; Owen, R.G.; et al. Predicting Ultrahigh Risk Multiple Myeloma by Molecular Profiling: An Analysis of Newly Diagnosed Transplant Eligible Myeloma XI Trial Patients. Leukemia 2020, 34, 3091–3096. [Google Scholar] [CrossRef]
- Sonneveld, P.; Dimopoulos, M.A.; Boccadoro, M.; Quach, H.; Ho, P.J.; Beksac, M.; Hulin, C.; Antonioli, E.; Leleu, X.; Mangiacavalli, S.; et al. Daratumumab, Bortezomib, Lenalidomide, and Dexamethasone for Multiple Myeloma. N. Engl. J. Med. 2024, 390, 301–313. [Google Scholar] [CrossRef]
- Badros, A.Z.; Foster, L.; Anderson, L.D., Jr.; Chaulagain, C.P.; Pettijohn, E.M.; Cowan, A.J.; Costello, C.L.; Larson, S.; Sborov, D.W.; Shain, K.H.; et al. Daratumumab with Lenalidomide as Maintenance after Transplant in Newly Diagnosed Multiple Myeloma: The AURIGA Study. Blood 2024, 145, 300–310. [Google Scholar] [CrossRef]
- Kaiser, M.F.; Hall, A.; Walker, K.; Sherborne, A.; Tute, R.M.D.; Newnham, N.; Roberts, S.; Ingleson, E.; Bowles, K.; Garg, M.; et al. Daratumumab, Cyclophosphamide, Bortezomib, Lenalidomide, and Dexamethasone as Induction and Extended Consolidation Improves Outcome in Ultra-High-Risk Multiple Myeloma. J. Clin. Oncol. 2023, 41, 3945–3955. [Google Scholar] [CrossRef]
- Dimopoulos, M.A.; Sonneveld, P.; Rodríguez-Otero, P.; Quach, H.; Ho, P.H.; Beksac, M.; Hulin, C.; Antonioli, R.; Leleu, X.; Mangiacavalli, S.; et al. Daratumumab (DARA)/Bortezomib/Lenalidomide/Dexamethasone (D-VRd) with D-R Maintenance in Transplant-Eligible (TE) Newly Diagnosed Multiple Myeloma (NDMM): Analysis of PERSEUS Based on Cytogenetic Risk. In Proceedings of the 2024 European Hematology Association Annual Meeting, Madrid, Spain, 13–16 June 2024. [Google Scholar]
- Mehl, J.; Akhoundova, D.; Bacher, U.; Jeker, B.; Rhyner Agocs, G.; Ruefer, A.; Soltermann, S.; Soekler, M.; Winkler, A.; Daskalakis, M.; et al. Daratumumab during Myeloma Induction Therapy Is Associated with Impaired Stem Cell Mobilization and Prolonged Post-Transplant Hematologic Recovery. Cancers 2024, 16, 1854. [Google Scholar] [CrossRef] [PubMed]
- Villalba, A.; Gonzalez-Rodriguez, A.P.; Arzuaga-Mendez, J.; Puig, N.; Arnao, M.; Arguiñano, J.M.; Jimenez, M.; Canet, M.; Teruel, A.I.; Sola, M.; et al. Single versus Tandem Autologous Stem-Cell Transplantation in Patients with Newly Diagnosed Multiple Myeloma and High-Risk Cytogenetics. A Retrospective, Open-Label Study of the PETHEMA/Spanish Myeloma Group (GEM). Leuk. Lymphoma 2022, 63, 3438–3447. [Google Scholar] [CrossRef] [PubMed]
- Cavo, M.; Gay, F.M.; Patriarca, F.; Zamagni, E.; Montefusco, V.; Dozza, L.; Galli, M.; Bringhen, S.; Testoni, N.; Grasso, M.; et al. Double Autologous Stem Cell Transplantation Significantly Prolongs Progression-Free Survival and Overall Survival in Comparison with Single Autotransplantation in Newly Diagnosed Multiple Myeloma: An Analysis of Phase 3 EMN02/HO95 Study. Blood 2017, 130, 401. [Google Scholar] [CrossRef]
- Garcés, J.-J.; Cedena, M.-T.; Puig, N.; Burgos, L.; Perez, J.J.; Cordon, L.; Flores-Montero, J.; Sanoja-Flores, L.; Calasanz, M.-J.; Ortiol, A.; et al. Circulating Tumor Cells for the Staging of Patients with Newly Diagnosed Transplant-Eligible Multiple Myeloma. JCO 2022, 40, 3151–3161. [Google Scholar] [CrossRef] [PubMed]
- Varettoni, M.; Corso, A.; Pica, G.; Mangiacavalli, S.; Pascutto, C.; Lazzarino, M. Incidence, Presenting Features and Outcome of Extramedullary Disease in Multiple Myeloma: A Longitudinal Study on 1003 Consecutive Patients. Ann. Oncol. 2010, 21, 325–330. [Google Scholar] [CrossRef]
- Costa, L.J.; Chhabra, S.; Medvedova, E.; Dholaria, B.R.; Schmidt, T.M.; Godby, K.N.; Silbermann, R.; Dhakal, B.; Bal, S.; Giri, S.; et al. Minimal Residual Disease Response-Adapted Therapy in Newly Diagnosed Multiple Myeloma (MASTER): Final Report of the Multicentre, Single-Arm, Phase 2 Trial. Lancet Haematol. 2023, 10, e890–e901. [Google Scholar] [CrossRef]


| Parameter | Total | Standard-Risk Genetics | High-Risk Genetics a | Ultra-High-Risk Genetics b | p-Value |
|---|---|---|---|---|---|
| Patients, n (%) | 137 (100) | 82 (60) | 40 (29) | 15 (11) | |
| Median age, years (range) | 62 (31–75) | 61 (35–75) | 62 (31–75) | 63 (44–75) | 0.9460 |
| Sex, n (%) | |||||
| Male | 92 (67) | 58 (71) | 24 (60) | 10 (67) | 0.4952 |
| Female | 45 (33) | 24 (29) | 16 (40) | 5 (33) | 0.4952 |
| R-ISS, n (%) | |||||
| I | 33 (24) | 24 (29) | 8 (20) | 1 (7) | 0.1314 |
| II | 67 (49) | 43 (53) | 19 (47) | 5 (33) | 0.3873 |
| III | 32 (23) | 10 (12) | 13 (33) | 9 (60) | <0.0001 |
| Unknown c | 5 (4) | 5 (6) | 0 (0) | 0 (0) | - |
| Paraprotein subtype, n (%) | |||||
| Lambda light chain | 43 (31) | 18 (22) | 13 (33) | 12 (80) | <0.0001 |
| Kappa light chain | 92 (67) | 62 (76) | 27 (68) | 3 (20) | 0.0001 |
| IgG | 91 (66) | 60 (73) | 22 (55) | 9 (60) | 0.1170 |
| IgA | 23 (17) | 9 (11) | 8 (20) | 6 (40) | 0.0177 |
| IgM | 1 (1) | 0 (0) | 1 (2) | 0 (0) | - |
| Light-chain-only | 20 (15) | 11 (13) | 9 (23) | 0 (0) | 0.0973 |
| Unknown | 2 (1) | 2 (3) | 0 (0) | 0 (0) | - |
| Hypercalcemia c, n (%) | 18 (13) | 9 (11) | 7 (18) | 2 (13) | 0.6055 |
| Renal insufficiency d, n (%) | 15 (11) | 6 (7) | 6 (15) | 3 (20) | 0.2184 |
| Anemia e, n (%) | 25 (18) | 8 (10) | 13 (33) | 4 (27) | 0.0063 |
| Osteolytic lesions, n (%) | 106 (77) | 64 (78) | 33 (83) | 9 (60) | 0.2011 |
| Bone marrow infiltration, median, % (range) | 60 (2–100) | 50 (2–100) | 60 (5–100) | 60 (15–80) | 0.1080 |
| Parameter | Total (n = 137) | Standard-Risk Genetics (n = 82) | High-Risk Genetics (n = 40) | Ultra-High-Risk Genetics (n = 15) | p-Value |
|---|---|---|---|---|---|
| Remission status after induction, n (%) | |||||
| CR | 19 (14) | 11 (13) | 6 (15) | 2 (13) | 0.9701 |
| VGPR | 64 (47) | 38 (46) | 21 (52) | 5 (33) | 0.4445 |
| PR | 49 (36) | 30 (37) | 12 (30) | 7 (47) | 0.5019 |
| SD | 5 (3) | 3 (4) | 1 (3) | 1 (7) | - |
| PD | 0 (0) | 0 (0) | 0 (0) | 0 (0) | - |
| Remission status after HDCT/ASCT a, n (%) | |||||
| sCR | 58 (42) | 34 (41) | 18 (45) | 6 (40) | 0.9160 |
| CR | 46 (34) | 25 (31) | 16 (40) | 5 (33) | 0.5795 |
| VGPR | 19 (14) | 13 (16) | 5 (12) | 1 (7) | 0.6112 |
| PR | 13 (9) | 10 (12) | 1 (3) | 2 (13) | 0.1987 |
| SD | 0 (0) | 0 (0) | 0 (0) | 0 (0) | - |
| PD | 0 (0) | 0 (0) | 0 (0) | 0 (0) | - |
| MRD b status post-transplant | |||||
| MRD-negative | 76 (55) | 44 (54) | 24 (60) | 8 (53) | 0.7910 |
| MRD-positive | 61 (45) | 38 (46) | 16 (40) | 7 (47) | 0.7910 |
| MRD in patients with tandem ASCT, n (%) | |||||
| MRD-negative after first HDCT/ASCT | 4 (3) | 0 (0) | 3 (8) | 1 (7) | - |
| MRD-negative after second HDCT/ASCT | 7 (5) | 2 (2) | 4 (10) | 1 (7) | - |
| MRD-positive after second HDCT/ASCT | 7 (5) | 3 (4) | 3 (8) | 1 (7) | - |
| Parameter | Total (n = 137) | Standard-Risk Genetics (n = 82) | High-Risk Genetics (n = 40) | Ultra- High-Risk Genetics (n = 15) | p-Value |
|---|---|---|---|---|---|
| Best response after HDCT/ASCT, n (%) | |||||
| sCR | 75 (55) | 43 (52) | 24 (60) | 8 (53) | 0.7284 |
| CR | 47 (34) | 27 (33) | 14 (35) | 6 (40) | 0.8635 |
| never in CR | 15 (11) | 12 (15) | 2 (5) | 1 (7) | 0.2374 |
| Relapse after HDCT/ASCT, n (%) | 44 (32) | 18 (22) | 17 (43) | 9 (60) | 0.0037 |
| 48-month PFS rate, % | 61 | 72 | 50 | 32 | 0.0004 |
| Death, n (%) | 21 (15) | 9 (11) | 8 (20) | 4 (27) | 0.1868 |
| Disease progression | 10 (7) | 3 (4) | 5 (13) | 2 (13) | - |
| HSCT-related cause | 1 (1) | 1 (1) | 0 (0) | 0 (0) | - |
| Other or unknown cause | 10 (7) | 5 (6) | 3 (8) | 2 (13) | - |
| 48-month OS rate, % | 85 | 89 | 79 | 80 | 0.1494 |
| Median follow-up after HDCT/ASCT, months (range) | 47 (0.8–65) | 46 (4–64) | 53 (5–65) | 49 (0.8–59) | 0.4512 |
Disclaimer/Publisher’s Note: The statements, opinions and data contained in all publications are solely those of the individual author(s) and contributor(s) and not of MDPI and/or the editor(s). MDPI and/or the editor(s) disclaim responsibility for any injury to people or property resulting from any ideas, methods, instructions or products referred to in the content. |
© 2025 by the authors. Licensee MDPI, Basel, Switzerland. This article is an open access article distributed under the terms and conditions of the Creative Commons Attribution (CC BY) license (https://creativecommons.org/licenses/by/4.0/).
Share and Cite
Kündgen, L.J.; Akhoundova, D.; Hoffmann, M.; Legros, M.; Shaforostova, I.; Seipel, K.; Bacher, U.; Pabst, T. Prognostic Value of Post-Transplant MRD Negativity in Standard Versus High- and Ultra-High-Risk Multiple Myeloma Patients. Cancers 2025, 17, 1565. https://doi.org/10.3390/cancers17091565
Kündgen LJ, Akhoundova D, Hoffmann M, Legros M, Shaforostova I, Seipel K, Bacher U, Pabst T. Prognostic Value of Post-Transplant MRD Negativity in Standard Versus High- and Ultra-High-Risk Multiple Myeloma Patients. Cancers. 2025; 17(9):1565. https://doi.org/10.3390/cancers17091565
Chicago/Turabian StyleKündgen, Lea Jasmin, Dilara Akhoundova, Michele Hoffmann, Myriam Legros, Inna Shaforostova, Katja Seipel, Ulrike Bacher, and Thomas Pabst. 2025. "Prognostic Value of Post-Transplant MRD Negativity in Standard Versus High- and Ultra-High-Risk Multiple Myeloma Patients" Cancers 17, no. 9: 1565. https://doi.org/10.3390/cancers17091565
APA StyleKündgen, L. J., Akhoundova, D., Hoffmann, M., Legros, M., Shaforostova, I., Seipel, K., Bacher, U., & Pabst, T. (2025). Prognostic Value of Post-Transplant MRD Negativity in Standard Versus High- and Ultra-High-Risk Multiple Myeloma Patients. Cancers, 17(9), 1565. https://doi.org/10.3390/cancers17091565