Fatigue Level Associated with Quality of Life for Prostate Cancer Patients: Results from the All of Us Research Program

 , , ,
, , , 
Simple Summary
Abstract
1. Introduction
2. Materials and Methods
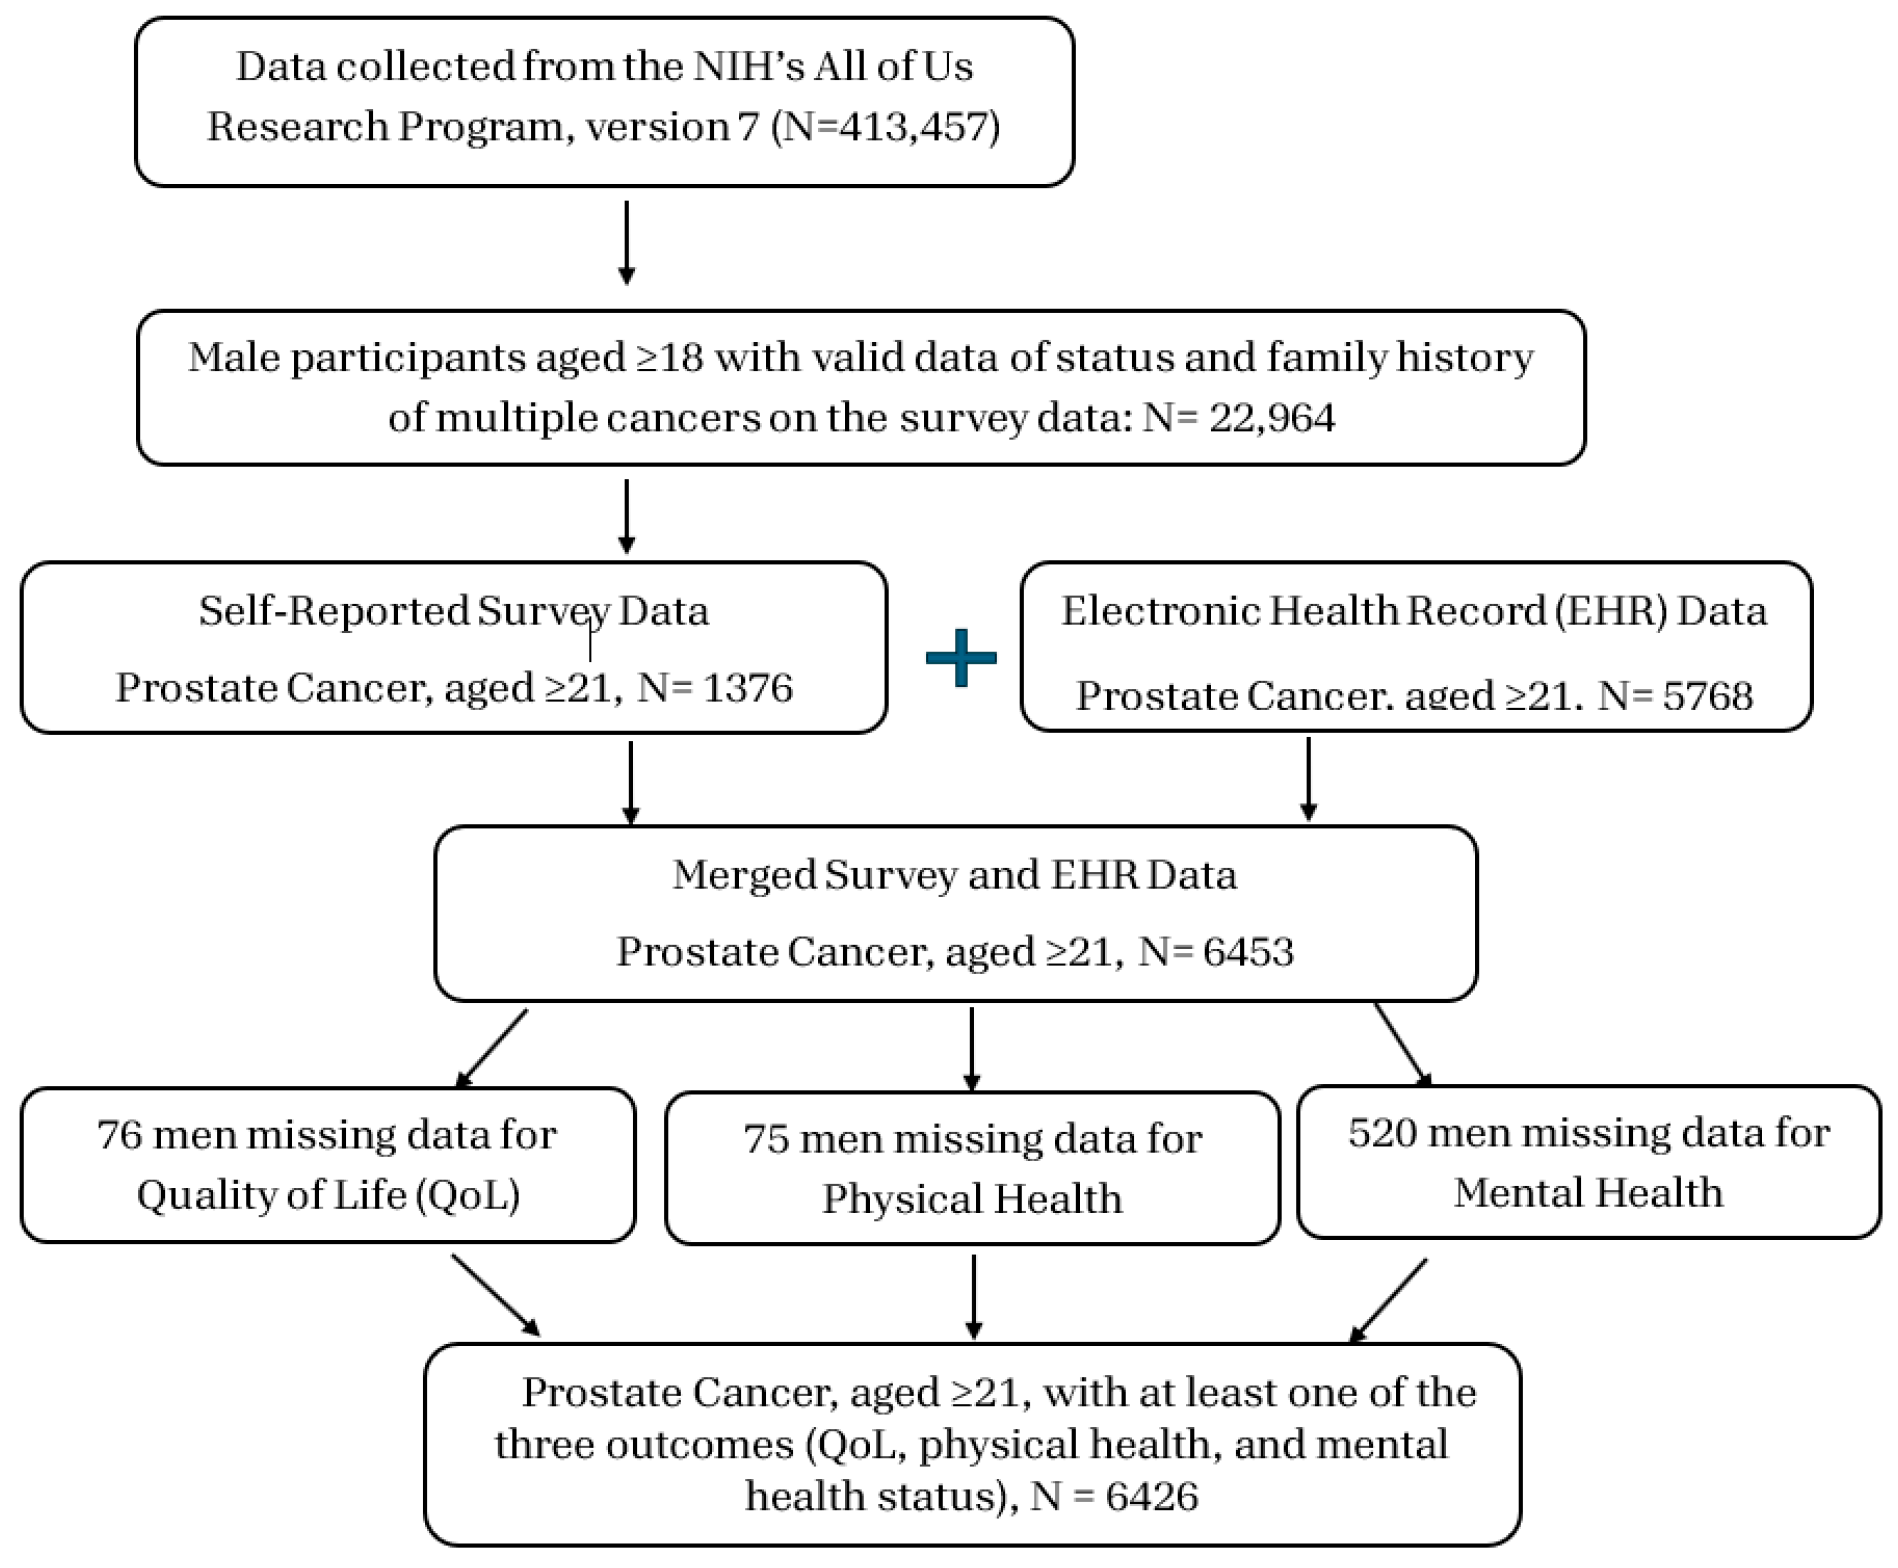
2.1. Study Design
2.2. Data Quality
2.3. Measures
2.4. Statistical Analyses
3. Results
4. Discussion
5. Conclusions
Supplementary Materials
Author Contributions
Funding
Institutional Review Board Statement
Informed Consent Statement
Data Availability Statement
Acknowledgments
Conflicts of Interest
References
- Siegel, R.L.; Giaquinto, A.N.; Jemal, A. Cancer statistics, 2024. CA Cancer J. Clin. 2024, 74, 12–49. [Google Scholar] [CrossRef] [PubMed]
- American Cancer Society. Cancer Facts & Figures. 2024. Available online: https://www.cancer.org/cancer/types/prostate-cancer/detection-diagnosis-staging/survival-rates.html#references (accessed on 17 August 2024).
- Skoufos, G.; Kakoulidis, P.; Tastsoglou, S.; Zacharopoulou, E.; Kotsira, V.; Miliotis, M.; Mavromati, G.; Grigoriadis, D.; Zioga, M.; Velli, A.; et al. TarBase-v9.0 extends experimentally supported miRNA-gene interactions to cell-types and virally encoded miRNAs. Nucleic Acids Res. 2024, 52, D304–D310. [Google Scholar] [CrossRef] [PubMed]
- Felce, D.; Perry, J. Quality of life: Its definition and measurement. Res. Dev. Disabil. 1995, 16, 51–74. [Google Scholar] [CrossRef] [PubMed]
- Beer, T.M.; Miller, K.; Tombal, B.; Cella, D.; Phung, D.; Holmstrom, S.; Ivanescu, C.; Skaltsa, K.; Naidoo, S. The association between health-related quality-of-life scores and clinical outcomes in metastatic castration-resistant prostate cancer patients: Exploratory analyses of AFFIRM and PREVAIL studies. Eur. J. Cancer 2017, 87, 21–29. [Google Scholar] [CrossRef]
- Braun, D.P.; Gupta, D.; Staren, E.D. Predicting survival in prostate cancer: The role of quality of life assessment. Support. Care Cancer 2012, 20, 1267–1274. [Google Scholar] [CrossRef]
- Fukushima, T.; Suzuki, K.; Tanaka, T.; Okayama, T.; Inoue, J.; Morishita, S.; Nakano, J. Global quality of life and mortality risk in patients with cancer: A systematic review and meta-analysis. Qual. Life Res. 2024, 33, 2631–2643. [Google Scholar] [CrossRef]
- Lardas, M.; Liew, M.; van den Bergh, R.C.; De Santis, M.; Bellmunt, J.; Van den Broeck, T.; Cornford, P.; Cumberbatch, M.G.; Fossati, N.; Gross, T.; et al. Quality of Life Outcomes after Primary Treatment for Clinically Localised Prostate Cancer: A Systematic Review. Eur. Urol. 2017, 72, 869–885. [Google Scholar] [CrossRef]
- Kim, J.S.; Taaffe, D.R.; Galvao, D.A.; Hart, N.H.; Gray, E.; Ryan, C.J.; Kenfield, S.A.; Saad, F.; Newton, R.U. Exercise in advanced prostate cancer elevates myokine levels and suppresses in-vitro cell growth. Prostate Cancer Prostatic Dis. 2022, 25, 86–92. [Google Scholar] [CrossRef]
- Tan, K.; Naylor, M.J. The Influence of Modifiable Factors on Breast and Prostate Cancer Risk and Disease Progression. Front. Physiol. 2022, 13, 840826. [Google Scholar] [CrossRef]
- Ziglioli, F.; Patera, A.; Isgro, G.; Campobasso, D.; Guarino, G.; Maestroni, U. Impact of modifiable lifestyle risk factors for prostate cancer prevention: A review of the literature. Front. Oncol. 2023, 13, 1203791. [Google Scholar] [CrossRef]
- Cornford, P.; Robijn, E.; Rogers, E.; Wassersug, R.; Fleure, L. Fatigue in Prostate Cancer: A Roundtable Discussion and Thematic Literature Review. Eur. Urol. Open Sci. 2024, 63, 119–125. [Google Scholar] [CrossRef] [PubMed]
- Luo, Y.H.; Yang, Y.W.; Wu, C.F.; Wang, C.; Li, W.J.; Zhang, H.C. Fatigue prevalence in men treated for prostate cancer: A systematic review and meta-analysis. World J. Clin. Cases 2021, 9, 5932–5942. [Google Scholar] [CrossRef] [PubMed]
- Billones, R.; Liwang, J.K.; Butler, K.; Graves, L.; Saligan, L.N. Dissecting the fatigue experience: A scoping review of fatigue definitions, dimensions, and measures in non-oncologic medical conditions. Brain Behav. Immun. Health 2021, 15, 100266. [Google Scholar] [CrossRef]
- Rio, C.J.; Gehling, G.M.; Blumhorst, C.; Ross, A.; Saligan, L.N. Defining fatigue from the experiences of patients living with chronic fatigue. Front. Med. 2024, 11, 1429275. [Google Scholar] [CrossRef]
- Tohi, Y.; Kato, T.; Honda, T.; Osaki, Y.; Abe, Y.; Naito, H.; Matsuoka, Y.; Okazoe, H.; Taoka, R.; Ueda, N.; et al. Impact of frailty on cancer-related fatigue and quality of life in outpatients with prostate cancer: A cross-sectional study of patient-reported outcomes. Jpn. J. Clin. Oncol. 2024, 54, 708–715. [Google Scholar] [CrossRef]
- All of Us Research Program Investigators. The “All of Us” Research Program. N. Engl. J. Med. 2019, 381, 668–676. [Google Scholar] [CrossRef]
- All of Us Research Hub: Data Methods. Available online: https://researchallofus.org/data-tools/methods/ (accessed on 19 April 2025).
- 2022Q4R9 v7 Data Characterization Report: Overall All of Us Cohort Demographics. Available online: https://support.researchallofus.org/hc/en-us/articles/14558858196628-2022Q4R9-v7-Data-Characterization-Report (accessed on 24 April 2025).
- Lojanapiwat, B.; Anutrakulchai, W.; Chongruksut, W.; Udomphot, C. Correlation and diagnostic performance of the prostate-specific antigen level with the diagnosis, aggressiveness, and bone metastasis of prostate cancer in clinical practice. Prostate Int. 2014, 2, 133–139. [Google Scholar] [CrossRef]
- Introduction to All of Us Electronic Health Record (EHR) Collection and Data Transformation Methods. Available online: https://support.researchallofus.org/hc/en-us/articles/30125602539284-Introduction-to-All-of-Us-Electronic-Health-Record-EHR-Collection-and-Data-Transformation-Methods (accessed on 19 April 2025).
- Maher, J.M.; Markey, J.C.; Ebert-May, D. The other half of the story: Effect size analysis in quantitative research. CBE Life Sci. Educ. 2013, 12, 345–351. [Google Scholar] [CrossRef]
- Corbacioglu, S.K.; Aksel, G. Receiver operating characteristic curve analysis in diagnostic accuracy studies: A guide to interpreting the area under the curve value. Turk. J. Emerg. Med. 2023, 23, 195–198. [Google Scholar] [CrossRef]
- Fossa, S.D.; Holck Storas, A.; Aas, K.; Borge Johannesen, T.; Maria Gjelsvik, Y.; Myklebust, T.A. Pretreatment Patient-reported Overall Health: A Prognostic Factor for Early Overall Mortality After Primary Curative Treatment of Prostate Cancer. Eur. Urol. Open Sci. 2024, 63, 62–70. [Google Scholar] [CrossRef]
- Houede, N.; Rebillard, X.; Bouvet, S.; Kabani, S.; Fabbro-Peray, P.; Tretarre, B.; Menegaux, F. Impact on quality of life 3 years after diagnosis of prostate cancer patients below 75 at diagnosis: An observational case-control study. BMC Cancer 2020, 20, 757. [Google Scholar] [CrossRef] [PubMed]
- Xiao, J.; Zhang, M.; Wu, D. Side effects of prostate cancer therapies and potential management. J. Biol. Methods 2024, 11, e99010018. [Google Scholar] [CrossRef] [PubMed]
- Ozdemir, K.; Keser, I.; Sen, I.; Ozgur Tan, M. Investigating the relationships between quality of life, fatigue and leisure time physical activity in prostate cancer patients. J. Back Musculoskelet. Rehabil. 2019, 32, 497–503. [Google Scholar] [CrossRef]
- Feng, L.R.; Regan, J.; Shrader, J.A.; Liwang, J.; Ross, A.; Kumar, S.; Saligan, L.N. Cognitive and motor aspects of cancer-related fatigue. Cancer Med. 2019, 8, 5840–5849. [Google Scholar] [CrossRef]
- Gonzalez, B.D.; Small, B.J.; Cases, M.G.; Williams, N.L.; Fishman, M.N.; Jacobsen, P.B.; Jim, H.S.L. Sleep disturbance in men receiving androgen deprivation therapy for prostate cancer: The role of hot flashes and nocturia. Cancer 2018, 124, 499–506. [Google Scholar] [CrossRef]
- Storey, D.J.; McLaren, D.B.; Atkinson, M.A.; Butcher, I.; Liggatt, S.; O’Dea, R.; Smyth, J.F.; Sharpe, M. Clinically relevant fatigue in recurrence-free prostate cancer survivors. Ann. Oncol. 2012, 23, 65–72. [Google Scholar] [CrossRef]
- Yen, L.L.; Lin, H.Y.; Yen, H.W. Effectiveness of Betel Nut Chewing Prevention Program in Junior High Schools. J. Med. Educ. 1998, 2, 49–64. [Google Scholar]
- Colloca, G.; Colloca, P. The Effects of Social Support on Health-Related Quality of Life of Patients with Metastatic Prostate Cancer. J. Cancer Educ. 2016, 31, 244–252. [Google Scholar] [CrossRef]
- Chien, C.H.; Chuang, C.K.; Liu, K.L.; Wu, C.T.; Pang, S.T.; Chang, Y.H. Health-Related Quality of Life and Its Associated Factors in Prostate Cancer Patients Who Receive Androgen Deprivation Therapy. Cancer Nurs. 2021, 44, E34–E42. [Google Scholar] [CrossRef]
- Nelson, K.; Bennett, P.; Rance, J. The experiences of giving and receiving social support for men with localised prostate cancer and their partners. Ecancermedicalscience 2019, 13, 989. [Google Scholar] [CrossRef]
- Nagy, D.S.; Isaic, A.; Motofelea, A.C.; Popovici, D.I.; Diaconescu, R.G.; Negru, S.M. The Role of Spirituality and Religion in Improving Quality of Life and Coping Mechanisms in Cancer Patients. Healthcare 2024, 12, 2349. [Google Scholar] [CrossRef] [PubMed]
- Odeo, S.; Degu, A. Factors affecting health-related quality of life among prostate cancer patients: A systematic review. J. Oncol. Pharm. Pract. 2020, 26, 1997–2010. [Google Scholar] [CrossRef] [PubMed]
- Komisarenko, M.; Martin, L.J.; Finelli, A. Active surveillance review: Contemporary selection criteria, follow-up, compliance and outcomes. Transl. Androl. Urol. 2018, 7, 243–255. [Google Scholar] [CrossRef]
- Milonas, D.; Venclovas, Z.; Jievaltas, M. Age and aggressiveness of prostate cancer: Analysis of clinical and pathological characteristics after radical prostatectomy for men with localized prostate cancer. Cent. Eur. J. Urol. 2019, 72, 240–246. [Google Scholar]
- Pettersson, A.; Robinson, D.; Garmo, H.; Holmberg, L.; Stattin, P. Age at diagnosis and prostate cancer treatment and prognosis: A population-based cohort study. Ann. Oncol. 2018, 29, 377–385. [Google Scholar] [CrossRef]
- Chen, R.C.; Basak, R.; Meyer, A.M.; Kuo, T.M.; Carpenter, W.R.; Agans, R.P.; Broughman, J.R.; Reeve, B.B.; Nielsen, M.E.; Usinger, D.S.; et al. Association Between Choice of Radical Prostatectomy, External Beam Radiotherapy, Brachytherapy, or Active Surveillance and Patient-Reported Quality of Life Among Men with Localized Prostate Cancer. JAMA 2017, 317, 1141–1150. [Google Scholar] [CrossRef]
- Haslam, A.; Herrera-Perez, D.; Gill, J.; Prasad, V. Patient Experience Captured by Quality-of-Life Measurement in Oncology Clinical Trials. JAMA Netw. Open 2020, 3, e200363. [Google Scholar] [CrossRef]
- Buiting, H.M.; Olthuis, G. Importance of Quality-of-Life Measurement Throughout the Disease Course. JAMA Netw. Open 2020, 3, e200388. [Google Scholar] [CrossRef]
- Hedden, S.L.; McClain, J.; Mandich, A.; Baskir, R.; Caulder, M.S.; Denny, J.C.; Hamlet, M.R.J.; Prabhu Das, I.; McNeil Ford, N.; Lopez-Class, M.; et al. The Impact of COVID-19 on the All of Us Research Program. Am. J. Epidemiol. 2023, 192, 11–24. [Google Scholar] [CrossRef]

| All | Quality of Life | |||
|---|---|---|---|---|
| N (%) Mean ± SD 1 | Good N (%) Mean ± SD 1 | Poor N (%) Mean ± SD 1 | p-Value 2 | |
| Total | 6426 | 5792 (91.2) | 558 (8.8) | - |
| Demographic factors | ||||
| Age | 75.9 ± 8.4 | 75.9± 8.3 | 72.4 ± 9.3 | <0.001 |
| Race | ||||
| White | 4751 (81.5) | 4428 (94.1) | 276 (5.9) | <0.001 |
| African Americans and others | 1077 (18.5) | 875 (82.8) | 182 (17.2) | |
| Missing | 598 | 489 (83.0) | 100 (17.0) | |
| Marital status | ||||
| Married/living with partner | 4553 (71.9) | 4260 (94.5) | 246 (5.5) | <0.001 |
| Never married/divorced/widowed/separated | 1783 (28.1) | 1465 (83.2) | 295 (16.8) | |
| Education | ||||
| ≤High school graduate | 1032 (16.4) | 808 (80.2) | 200 (19.8) | <0.001 |
| Some college/college graduate | 2928 (46.4) | 2659 (91.7) | 241 (8.3) | |
| Advanced degree | 2345 (37.2) | 2230 (95.8) | 97 (4.2) | |
| Annual household income | ||||
| <50,000 | 1625 (30.2) | 1311 (82.0) | 287 (18.0) | <0.001 |
| ≥50,000 | 3748 (69.8) | 3578 (96.3) | 138 (3.7) | |
| Missing | 1053 | 903 (87.2) | 133 (12.8) | |
| General health-related factors | ||||
| BMI | ||||
| Underweight/normal | 1489 (24.4) | 1326 (90.1) | 146 (9.9) | <0.001 |
| Overweight | 2643 (43.4) | 2432 (93.0) | 182 (7.0) | |
| Obesity | 1961 (32.2) | 1728 (89.4) | 204 (10.6) | |
| Missing | 333 | 306 (92.2) | 26 (7.8) | |
| Smoking status | ||||
| Never | 3229 (51.4) | 2952 (92.4) | 243 (7.6) | <0.001 |
| Former | 2566 (40.9) | 2355 (92.7) | 185 (7.3) | |
| Current | 484 (7.7) | 362 (76.2) | 113 (23.8) | |
| Drink containing alcohol in the past year | ||||
| Never/monthly or less | 2865 (45.2) | 2497 (88.3) | 331 (11.7) | <0.001 |
| 2–4 times/month or 2–3 times/week | 1074 (17.0) | 972 (91.6) | 89 (8.4) | |
| ≥4 times/week | 2396 (37.8) | 2254 (94.9) | 122 (5.1) | |
| Social function ability | ||||
| Poor | 529 (8.3) | 257 (49.1) | 267 (50.9) | <0.001 |
| Good | 5829 (91.7) | 5477 (95.0) | 288 (5.0) | |
| PCa clinical factors | ||||
| Prostate-Specific Antigen (PSA, ng/mL) | ||||
| <4 | 3014 (73.6) | 2723 (91.4) | 256 (8.6) | 0.203 |
| 4–10 | 745 (18.2) | 675 (92.2) | 57 (7.8) | |
| ≥10 | 336 (8.2) | 297 (88.9) | 37 (11.1) | |
| Missing | 2231 | 2097 (91.0) | 208 (9.0) | |
| Current PCa therapy | ||||
| No | 1999 (68.2) | 1890 (95.3) | 93 (4.7) | 0.014 |
| Yes | 934 (31.8) | 864 (93.1) | 64 (6.9) | |
| Age at PCa diagnosis | ||||
| <65 | 1673 (57.1) | 1553 (93.5) | 108 (6.5) | 0.002 |
| ≥65 | 1259 (42.9) | 1200 (96.1) | 49 (3.9) | |
| Physical Health | Mental Health | |||||
|---|---|---|---|---|---|---|
| Good N (%) Mean ± SD 1 | Poor N (%) Mean ± SD 1 | p-Value 2 | Good N (%) Mean ± SD 1 | Poor N (%) Mean ± SD 1 | p-Value 2 | |
| Total | 5027 (79.2) | 1324 (20.9) | - | 5372 (91.0) | 534 (9.0) | - |
| Demographic factors | ||||||
| Age | 76.1 ± 8.3 | 73.7± 8.8 | <0.001 | 75.8 ± 8.4 | 72.3 ± 8.9 | <0.001 |
| Race | ||||||
| White | 3900 (82.8) | 810 (17.2) | <0.001 | 4042 (92.9) | 308 (7.1) | <0.001 |
| African Americans and others | 719 (68.2) | 335 (31.8) | 831 (84.1) | 157 (15.9) | ||
| Missing | 408 (69.5) | 179 (30.5) | 499 (87.9) | 69 (12.2) | ||
| Marital status | ||||||
| Married/living with partner | 3739 (83.0) | 766 (17.0) | <0.001 | 3890 (93.4) | 274 (6.6) | <0.001 |
| Never married/divorced/widowed/separated | 1226 (69.7) | 533 (30.3) | 1409 (85.0) | 249 (15.0) | ||
| Education | ||||||
| ≤High school graduate | 635 (62.6) | 379 (37.4) | <0.001 | 789 (81.3) | 181 (18.7) | <0.001 |
| Some college/college graduate | 2303 (79.6) | 591 (20.4) | 2508 (92.1) | 216 (7.9) | ||
| Advanced degree | 2010 (86.2) | 321 (13.8) | 1976 (94.1) | 124 (5.9) | ||
| Annual household income | ||||||
| <50,000 | 1073 (67.2) | 525 (32.9) | <0.001 | 1288 (84.8) | 231 (15.2) | <0.001 |
| ≥50,000 | 3181 (85.6) | 535 (14.4) | 3206 (94.2) | 196 (5.8) | ||
| Missing | 773 (74.5) | 264 (25.5) | 878 (89.1) | 107 (10.9) | ||
| General health-related factors | ||||||
| BMI | ||||||
| Underweight/normal | 1159 (78.8) | 311 (21.2) | <0.001 | 1198 (89.1) | 146 (10.9) | 0.001 |
| Overweight | 2184 (83.7) | 425 (16.3) | 2241 (92.5) | 183 (7.5) | ||
| Obesity | 1417 (73.1) | 522 (26.9) | 1626 (89.9) | 182 (10.1) | ||
| Missing | 267 (80.2) | 66 (19.8) | 307 (93.0) | 23 (7.0) | ||
| Smoking status | ||||||
| Never | 2634 (82.4) | 561 (17.6) | <0.001 | 2714 (92.6) | 218 (7.4) | <0.001 |
| Former | 1992 (78.3) | 552 (21.7) | 2185 (91.6) | 200 (8.4) | ||
| Current | 287 (60.6) | 187 (39.4) | 359 (78.7) | 97 (21.3) | ||
| Drink containing alcohol in the past year | ||||||
| Never/monthly or less | 2060 (72.8) | 770 (27.2) | <0.001 | 2348 (88.5) | 305 (11.5) | <0.001 |
| 2–4 times/month or 2–3 times/week | 843 (79.5) | 217 (20.5) | 909 (91.8) | 81 (8.2) | ||
| ≥4 times/week | 2058 (86.7) | 316 (13.3) | 2045 (93.8) | 136 (6.2) | ||
| Social function ability | ||||||
| Poor | 142 (27.1) | 382 (72.9) | <0.001 | 286 (55.6) | 228 (44.4) | <0.001 |
| Good | 4835 (83.9) | 931 (16.1) | 5033 (94.4) | 299 (5.6) | ||
| PCa clinical factors | ||||||
| Prostate-Specific Antigen (PSA, ng/mL) | ||||||
| <4 | 2371 (79.6) | 609 (20.4) | 0.003 | 2493 (90.7) | 255 (9.3) | 0.903 |
| 4–10 | 606 (82.3) | 130 (17.7) | 605 (90.6) | 63 (9.4) | ||
| ≥10 | 242 (73.1) | 89 (26.9) | 278 (91.5) | 26 (8.5) | ||
| Missing | 1808 (78.5) | 496 (21.5) | 1996 (91.3) | 190 (8.7) | ||
| Current PCa therapy | ||||||
| No | 1708 (85.9) | 281 (14.1) | <0.001 | 1741 (93.9) | 113 (6.1) | 0.131 |
| Yes | 719 (77.6) | 208 (22.4) | 811 (92.4) | 67 (7.6) | ||
| Age at PCa diagnosis | ||||||
| <65 | 1353 (81.3) | 311 (18.7) | 0.001 | 1443 (91.8) | 129 (8.2) | <0.001 |
| ≥65 | 1075 (85.9) | 177 (14.1) | 1109 (95.7) | 50 (4.3) | ||
| Univariate Model | Multivariable Models 2 (n = 5993) | |||
|---|---|---|---|---|
| OR (95% CI) 1 | p-Value | OR (95% CI) 1 | p-Value | |
| Race | ||||
| White | 1 | 1 | ||
| African Americans and others | 3.34 (2.73, 4.08) | <0.001 | 1.31 (0.96, 1.77) | 0.084 |
| Missing | 3.28 (2.56, 4.2) | <0.001 | 1.98 (1.39, 2.83) | <0.001 |
| Marital status | ||||
| Married/living with partner | 1 | 1 | ||
| Never married/divorced/widowed/separated | 3.49 (2.92, 4.17) | <0.001 | 1.65 (1.26, 2.15) | <0.001 |
| Annual household income | ||||
| <50,000 | 5.68 (4.59, 7.02) | <0.001 | 2.12 (1.56, 2.88) | <0.001 |
| ≥50,000 | 1 | 1 | ||
| Missing | 3.82 (2.98, 4.9) | <0.001 | 1.87 (1.32, 2.65) | <0.001 |
| Smoking status | ||||
| Never | 1 | 1 | ||
| Former | 0.95 (0.78, 1.16) | 0.645 | 0.66 (0.50, 0.86) | 0.002 |
| Current | 3.79 (2.96, 4.86) | <0.001 | 1.11 (0.76, 1.61) | 0.587 |
| Social function ability | ||||
| Poor | 19.76(16.04, 24.33) | <0.001 | 3.07 (2.32, 4.07) | <0.001 |
| Good | 1 | 1 | ||
| Fatigue level in the past 7 days | ||||
| Low | 1 | 1 | ||
| Moderate | 5.14 (4.19, 6.31) | <0.001 | 1.46 (1.11, 1.92) | 0.007 |
| High | 16.91(12.86, 22.24) | <0.001 | 2.33 (1.59, 3.41) | <0.001 |
| Physical health | ||||
| Good | 1 | 1 | ||
| Poor | 37 (28.69, 47.72) | <0.001 | 14.69 (10.95, 19.71) | <0.001 |
| Mental health | ||||
| Good | 1 | 1 | ||
| Poor | 17.67(14.33, 21.77) | <0.001 | 4.79 (3.63, 6.32) | <0.001 |
| Missing | 0.47 (0.27, 0.82) | 0.008 | 0.68 (0.34, 1.37) | 0.276 |
| Univariate Model | Multivariable Models 2 (n = 5905) | |||
|---|---|---|---|---|
| OR (95% CI) 1 | p-Value | OR (95% CI) 1 | p-Value | |
| Age | 0.97 (0.96, 0.97) | <0.001 | 0.98 (0.97, 0.99) | <0.001 |
| Race | ||||
| White | 1 | 1 | ||
| African Americans and others | 2.24 (1.93, 2.61) | <0.001 | 1.23 (1.00, 1.52) | 0.053 |
| Missing | 2.11 (1.75, 2.56) | <0.001 | 1.31 (1.01, 1.69) | 0.041 |
| Marital status | ||||
| Married/living with partner | 1 | 1 | ||
| Never married/divorced/widowed/separated | 2.12 (1.87, 2.4) | <0.001 | 1.20 (1.01, 1.43) | 0.036 |
| Education | ||||
| ≤High school graduate | 1 | 1 | ||
| Some college/college graduate | 0.43 (0.37, 0.50) | <0.001 | 0.66 (0.54, 0.81) | <0.001 |
| Advanced degree | 0.27 (0.23, 0.32) | <0.001 | 0.63 (0.50, 0.80) | <0.001 |
| Annual household income | ||||
| <50,000 | 2.91 (2.53, 3.34) | <0.001 | 1.25 (1.03, 1.52) | 0.025 |
| ≥50,000 | 1 | 1 | ||
| Missing | 2.03 (1.72, 2.40) | <0.001 | 0.95 (0.75, 1.19) | 0.634 |
| BMI | ||||
| Underweight/normal | 1 | 1 | ||
| Overweight | 0.73 (0.62, 0.85) | <0.001 | 0.81 (0.66, 0.98) | 0.033 |
| Obesity | 1.37 (1.17, 1.61) | <0.001 | 1.18 (0.97, 1.45) | 0.105 |
| Missing | 0.92 (0.68, 1.24) | 0.588 | 1.04 (0.73, 1.50) | 0.818 |
| Smoking status | ||||
| Never | 1 | 1 | ||
| Former | 1.30 (1.14, 1.48) | <0.001 | 1.36 (1.16, 1.60) | <0.001 |
| Current | 3.06 (2.49, 3.76) | <0.001 | 1.35 (1.02, 1.79) | 0.035 |
| Drink containing alcohol in the past year | ||||
| Never/monthly or Less | 1 | 1 | ||
| 2–4 times/month or 2–3 times/week | 0.69 (0.58, 0.82) | <0.001 | 0.86 (0.70, 1.05) | 0.138 |
| ≥4 times/week | 0.41 (0.36, 0.48) | <0.001 | 0.59 (0.49, 0.70) | <0.001 |
| Social function ability | ||||
| Poor | 13.97 (11.38, 17.15) | <0.001 | 6.20 (4.87, 7.90) | <0.001 |
| Good | 1 | |||
| Fatigue level in the past 7 days | ||||
| Low | 1 | 1 | ||
| Moderate | 5.74 (4.99, 6.59) | <0.001 | 4.19 (3.58, 4.89) | <0.001 |
| High | 17.20 (13.31, 22.22) | <0.001 | 8.20 (6.09, 11.04) | <0.001 |
| Univariate Model | Multivariable Model 2 (n = 5636) | |||
|---|---|---|---|---|
| OR (95% CI) 1 | p-Value | OR (95% CI) 1 | p-Value | |
| Age | 0.95 (0.94, 0.96) | <0.001 | 0.97 (0.95, 0.98) | <0.001 |
| Marital status | ||||
| Married/living with partner | 1 | 1 | ||
| Never married/divorced/widowed/separated | 2.51 (2.09, 3.01) | <0.001 | 1.41 (1.12, 1.77) | 0.003 |
| Education | ||||
| ≤High school graduate | 1 | 1 | ||
| Some college/college graduate | 0.38 (0.30, 0.46) | <0.001 | 0.53 (0.41, 0.69) | <0.001 |
| Advanced degree | 0.27 (0.21, 0.35) | <0.001 | 0.62 (0.45, 0.85) | 0.003 |
| Annual household income | ||||
| <50,000 | 2.93 (2.40, 3.59) | <0.001 | 1.30 (1.00, 1.70) | 0.055 |
| ≥50,000 | 1 | 1 | ||
| Missing | 1.99 (1.56, 2.55) | <0.001 | 0.93 (0.68, 1.27) | 0.649 |
| Social function ability | ||||
| Poor | 13.42 (10.88, 16.55) | <0.001 | 6.63 (5.20, 8.45) | <0.001 |
| Good | 1 | 1 | ||
| Fatigue level in the past 7 days | ||||
| Low | 1 | 1 | ||
| Moderate | 4.08 (3.34, 4.99) | <0.001 | 2.64 (2.10, 3.30) | <0.001 |
| High | 9.92 (7.48, 13.15) | <0.001 | 3.62 (2.58, 5.08) | <0.001 |
Disclaimer/Publisher’s Note: The statements, opinions and data contained in all publications are solely those of the individual author(s) and contributor(s) and not of MDPI and/or the editor(s). MDPI and/or the editor(s) disclaim responsibility for any injury to people or property resulting from any ideas, methods, instructions or products referred to in the content. |
© 2025 by the authors. Licensee MDPI, Basel, Switzerland. This article is an open access article distributed under the terms and conditions of the Creative Commons Attribution (CC BY) license (https://creativecommons.org/licenses/by/4.0/).
Share and Cite
Lin, H.-Y.; Mannan, M.; Chiu, Y.-W.; Li, Y.-H.; Chowdry, R.P.; Tseng, T.-S. Fatigue Level Associated with Quality of Life for Prostate Cancer Patients: Results from the All of Us Research Program. Cancers 2025, 17, 1531. https://doi.org/10.3390/cancers17091531
Lin H-Y, Mannan M, Chiu Y-W, Li Y-H, Chowdry RP, Tseng T-S. Fatigue Level Associated with Quality of Life for Prostate Cancer Patients: Results from the All of Us Research Program. Cancers. 2025; 17(9):1531. https://doi.org/10.3390/cancers17091531
Chicago/Turabian StyleLin, Hui-Yi, Masuma Mannan, Yu-Wen Chiu, Ya-Hsin Li, Rajasree P. Chowdry, and Tung-Sung Tseng. 2025. "Fatigue Level Associated with Quality of Life for Prostate Cancer Patients: Results from the All of Us Research Program" Cancers 17, no. 9: 1531. https://doi.org/10.3390/cancers17091531
APA StyleLin, H.-Y., Mannan, M., Chiu, Y.-W., Li, Y.-H., Chowdry, R. P., & Tseng, T.-S. (2025). Fatigue Level Associated with Quality of Life for Prostate Cancer Patients: Results from the All of Us Research Program. Cancers, 17(9), 1531. https://doi.org/10.3390/cancers17091531