
Mapping the Binding Sites of CA125-Specific Antibodies on a Revised Molecular Model of MUC16
 , , ,
, , , 

Simple Summary
Abstract
1. Introduction
2. Materials and Methods
2.1. CA125 Recombinant Protein Expression and Purification
2.2. Western Blot
2.3. Mass Spectrometry
2.3.1. S-Trap Digestion
2.3.2. In-Gel Digestion
2.3.3. Mass Spectrometry Data Acquisition
2.3.4. Mass Spectrometry Analysis
2.4. ELISA
2.5. SPR Materials
2.6. M11 Stock Concentration Determination
2.7. SPR Binding Kinetics Assay Sample Preparation
2.8. SPR Instrumental Protocol
2.9. SPR Binding Kinetics Assessment
3. Results
3.1. Recombinant Tandem Repeat Protein Expression and Verification
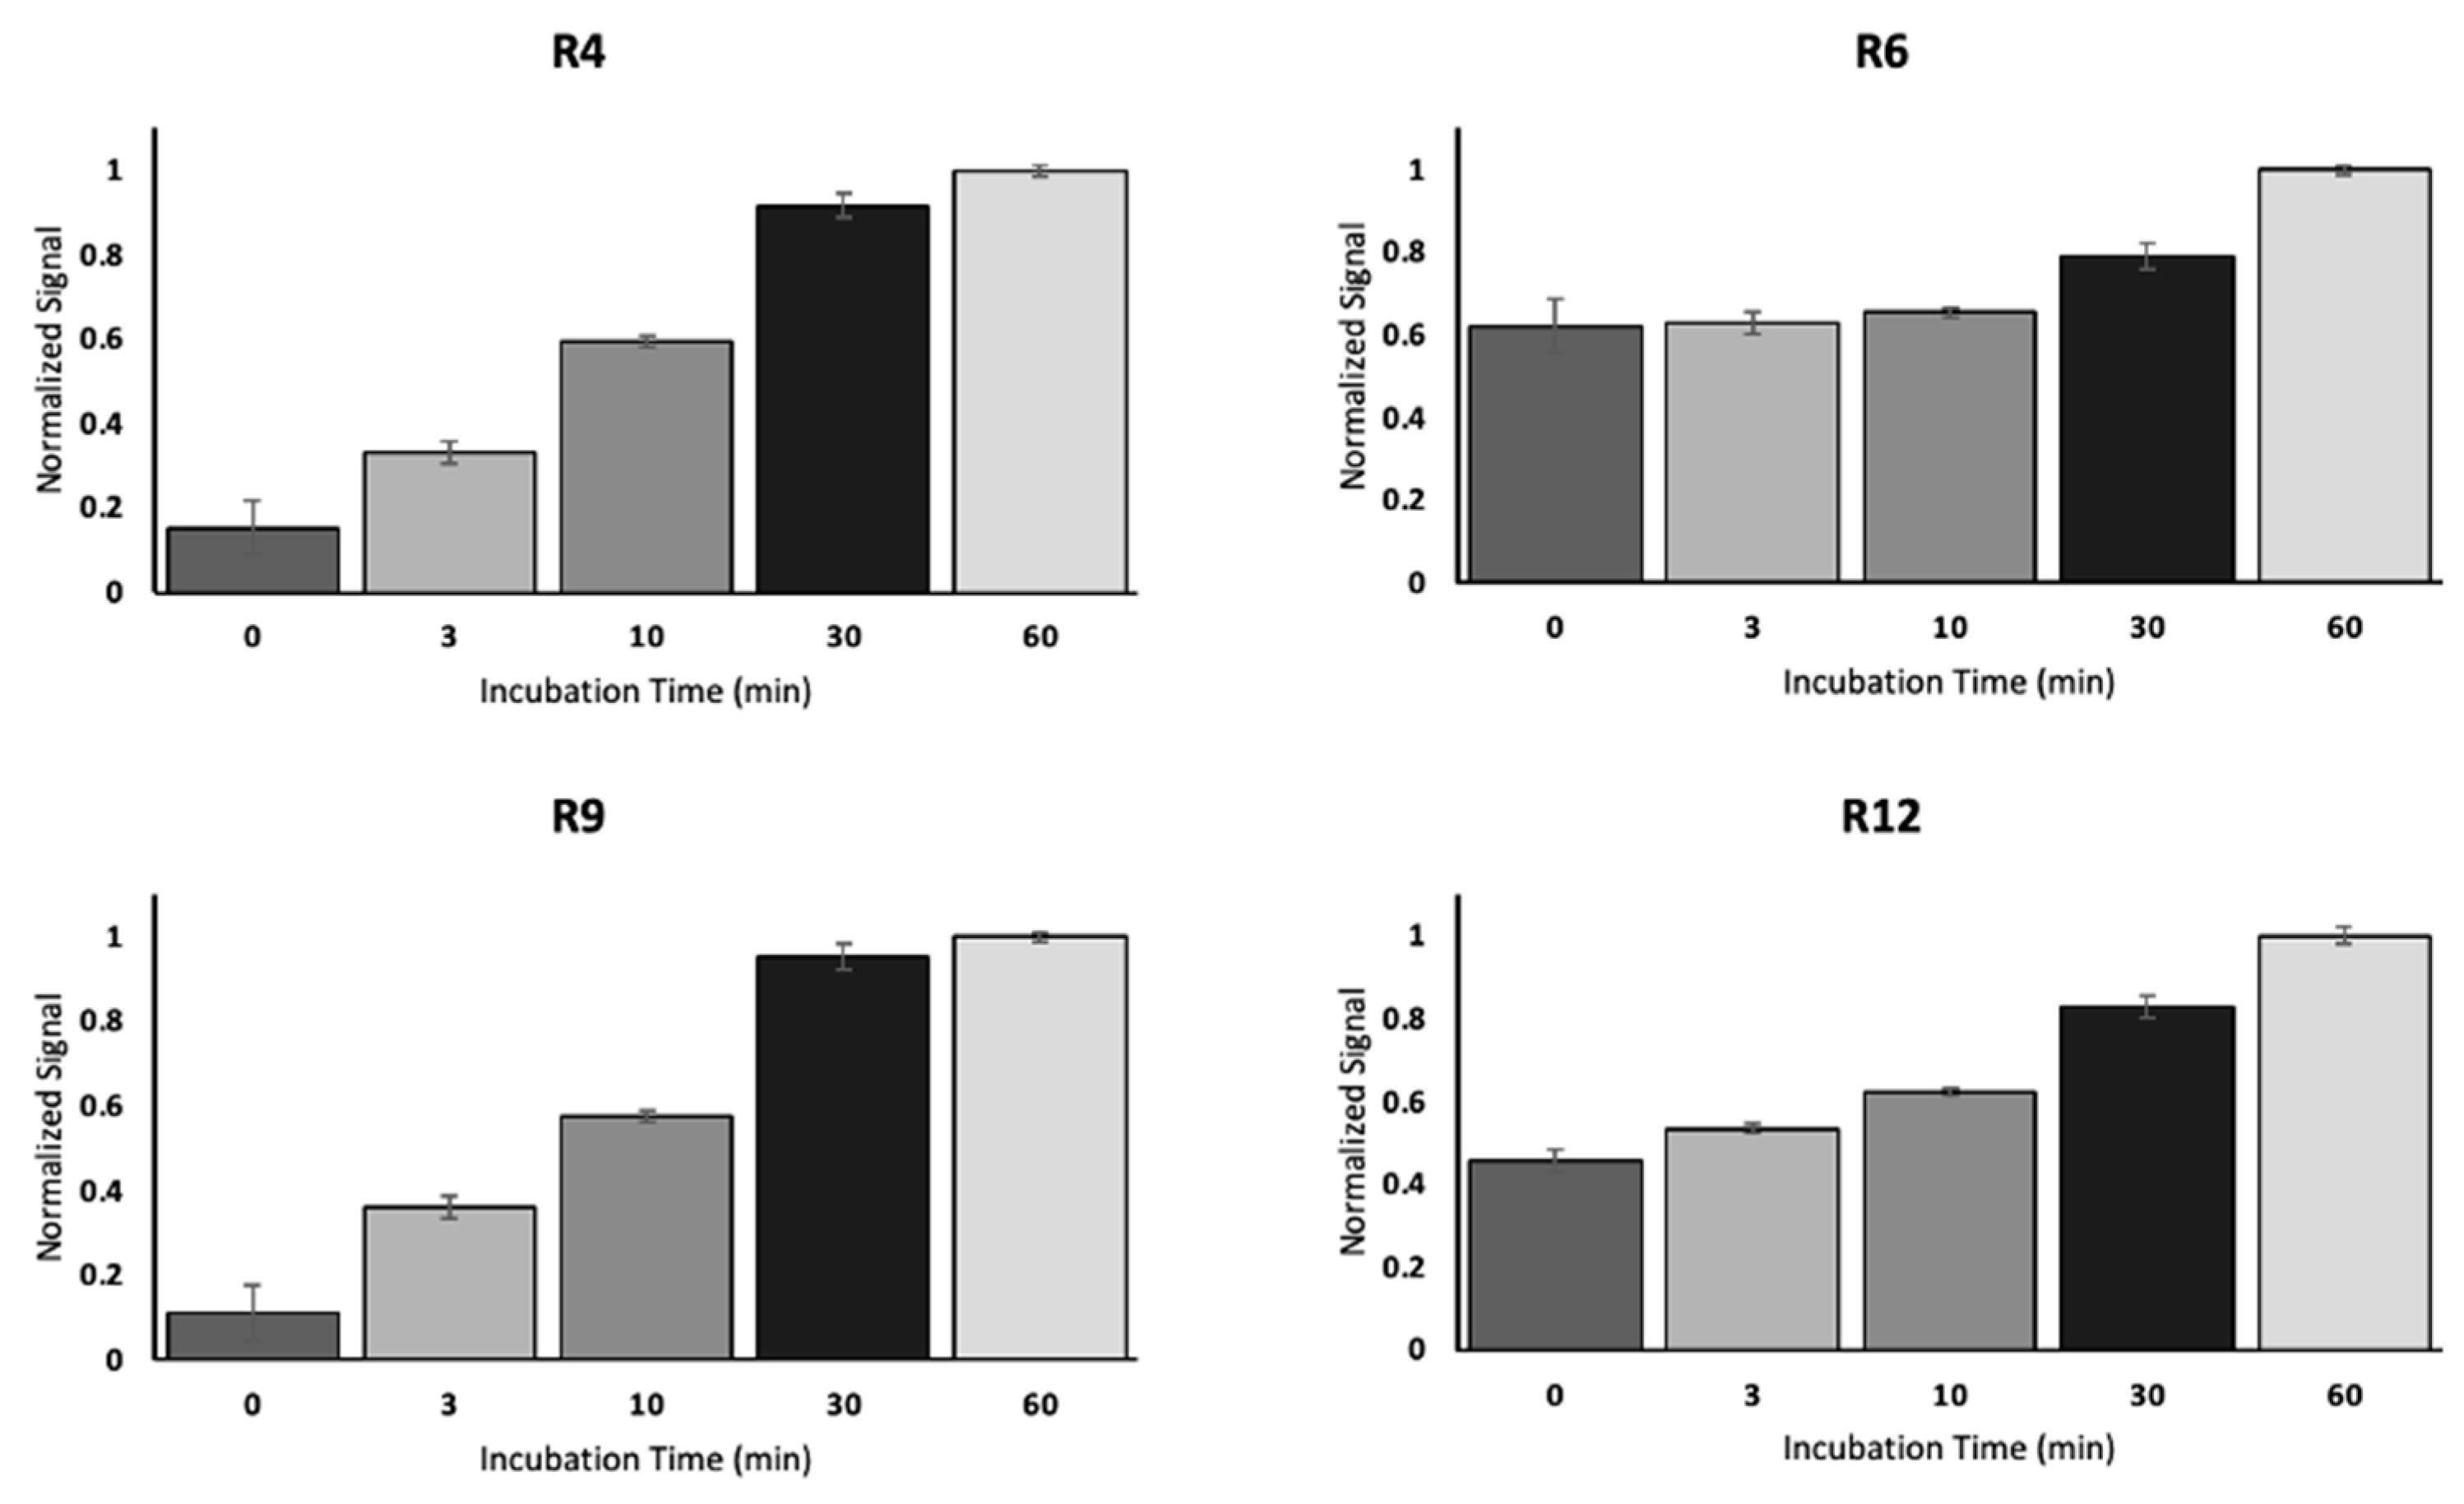
3.2. ELISA
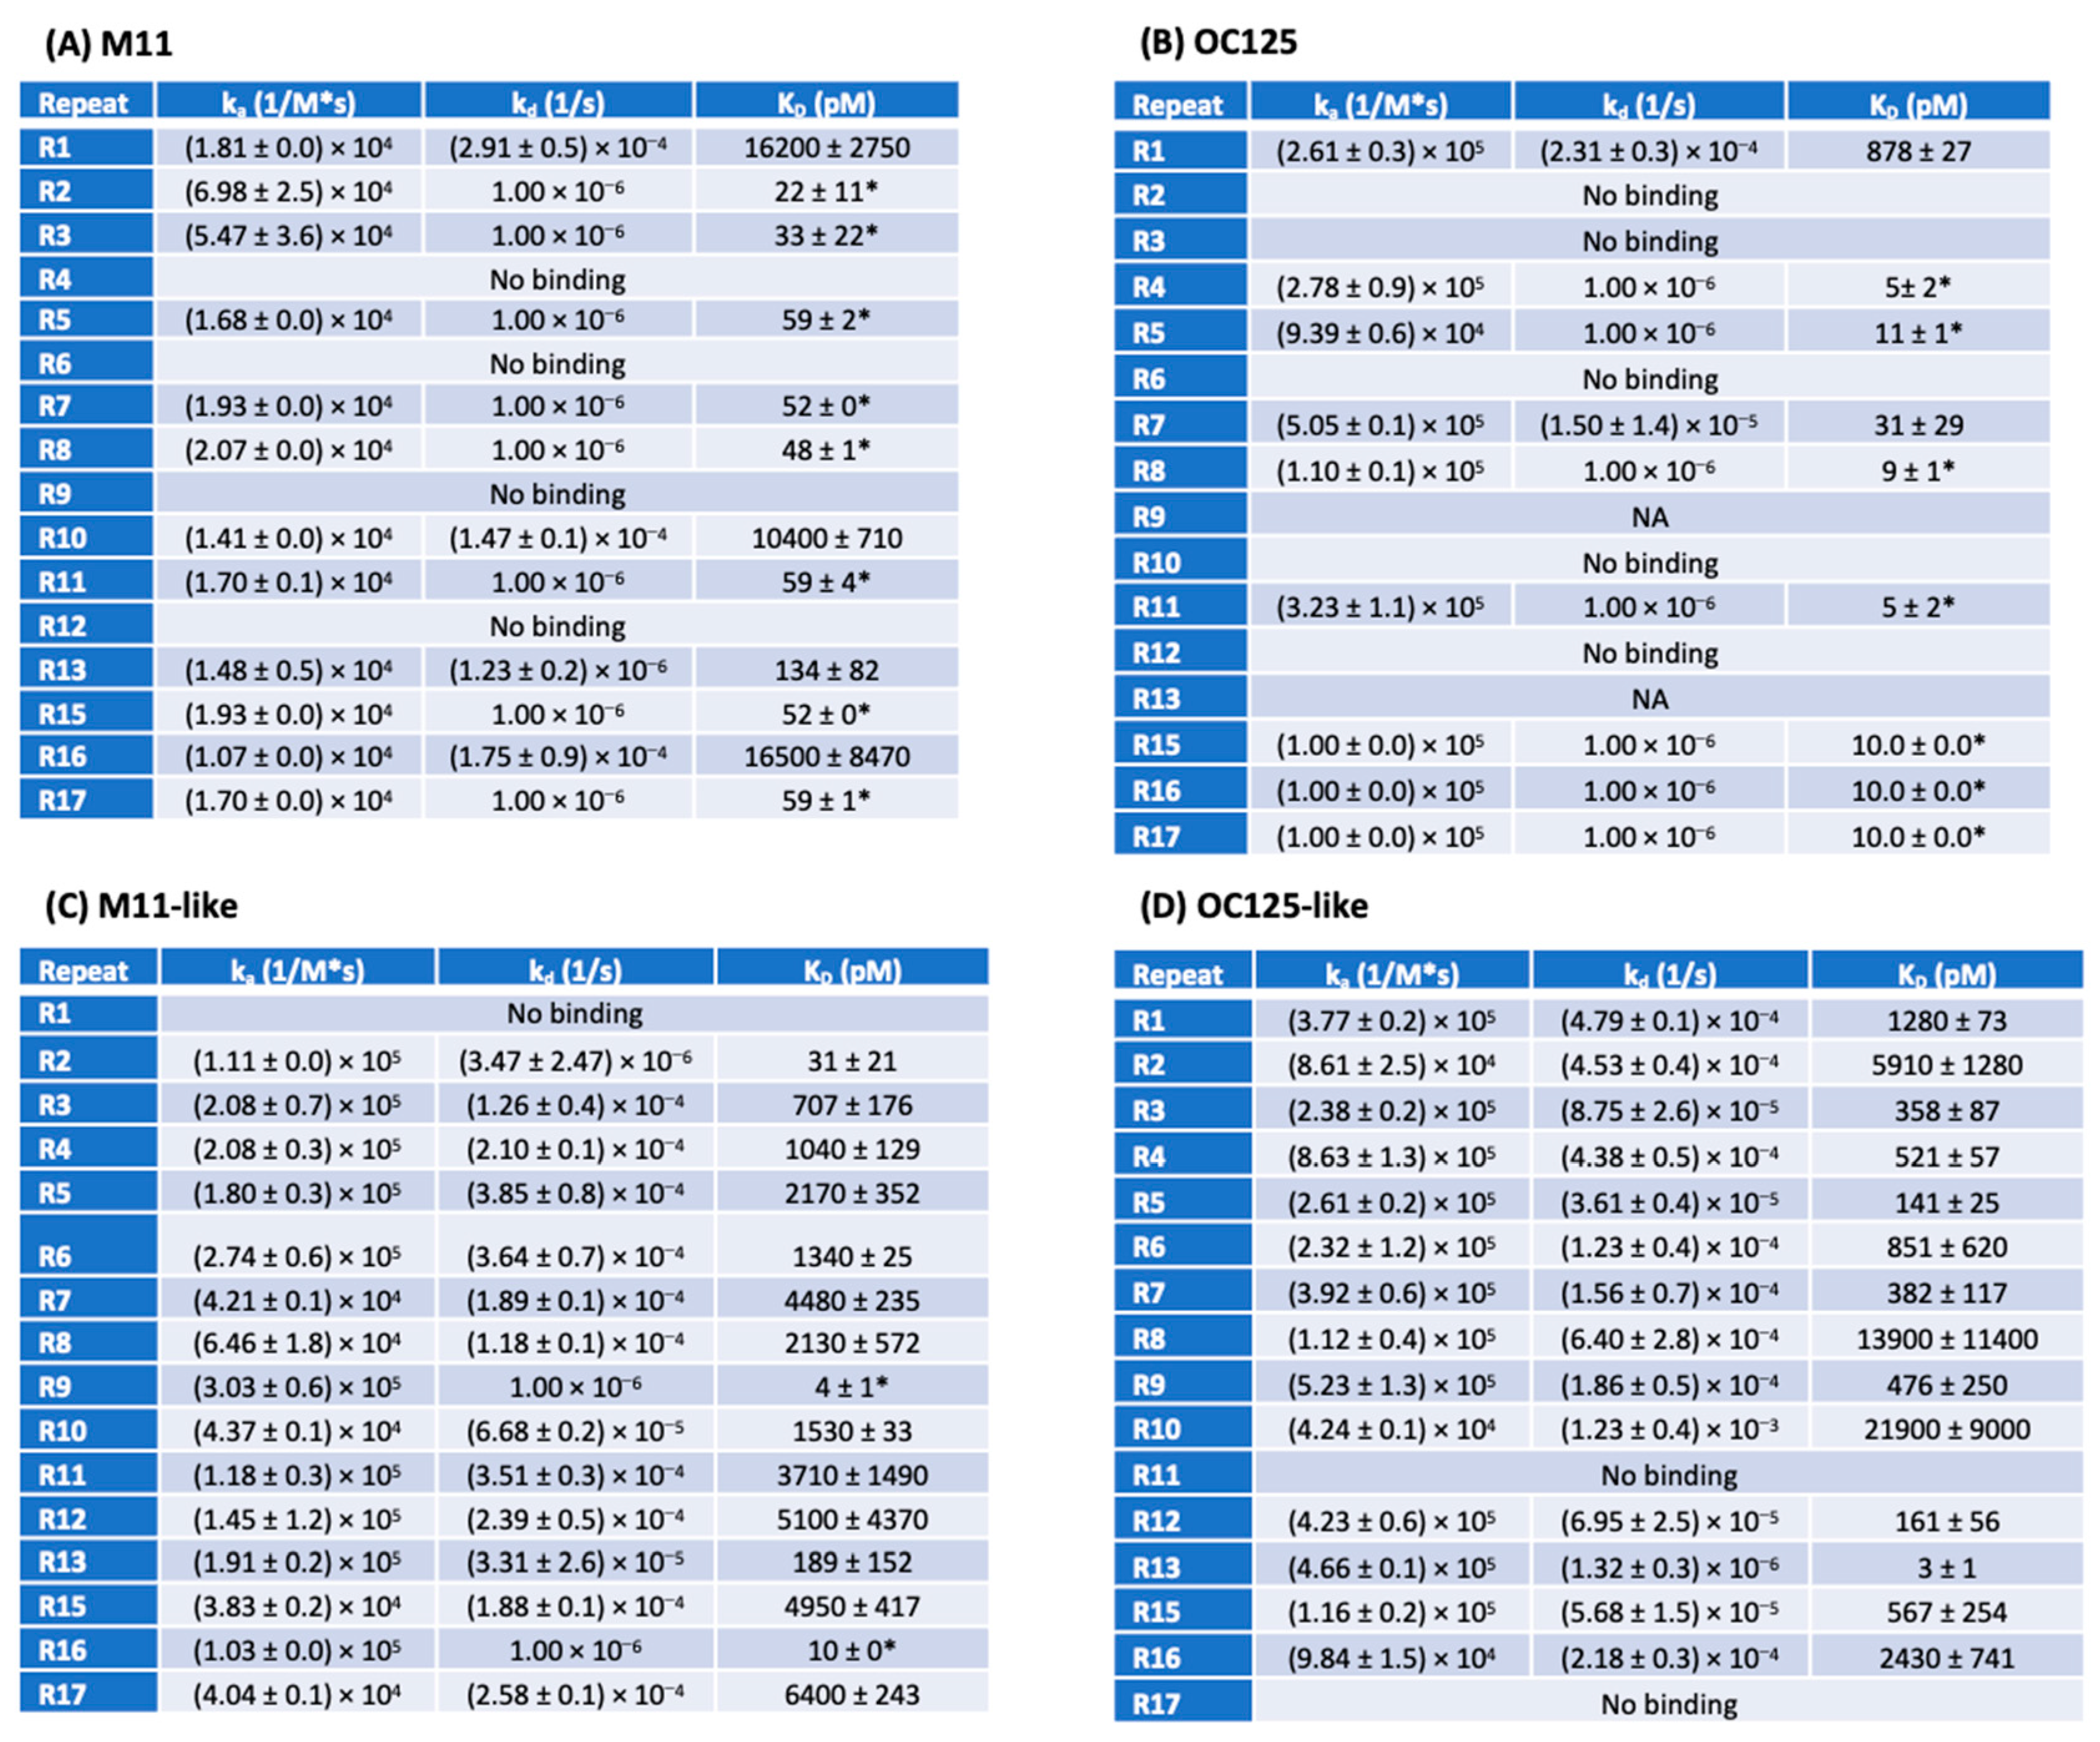
3.3. SPR
3.4. Comparison of Analytical Methods (ELISA and SPR)
4. Discussion
5. Conclusions
Supplementary Materials
Author Contributions
Funding
Institutional Review Board Statement
Informed Consent Statement
Data Availability Statement
Acknowledgments
Conflicts of Interest
References
- Bast, R.C.; Feeney, M.; Lazarus, H.; Nadler, L.M.; Colvin, R.B.; Knapp, R.C. Reactivity of a Monoclonal-Antibody with Human Ovarian-Carcinoma. J. Clin. Investig. 1981, 68, 1331–1337. [Google Scholar] [CrossRef]
- Bast, R.C., Jr.; Klug, T.L.; St. John, E.; Jenison, E.; Niloff, J.M.; Lazarus, H.; Berkowitz, R.S.; Leavitt, T.; Griffiths, C.T.; Parker, L.; et al. A Radioimmunoassay Using a Monoclonal-Antibody to Monitor the Course of Epithelial Ovarian-Cancer. N. Engl. J. Med. 1983, 309, 883–887. [Google Scholar] [CrossRef]
- Charkhchi, P.; Cybulski, C.; Gronwald, J.; Wong, F.O.; Narod, S.A.; Akbari, M.R. CA125 and Ovarian Cancer: A Comprehensive Review. Cancers 2020, 12, 3730. [Google Scholar] [CrossRef] [PubMed]
- Yin, B.W.T.; Lloyd, K.O. Molecular cloning of the CA125 ovarian cancer antigen—Identification as a new mucin, MUC16. J. Biol. Chem. 2001, 276, 27371–27375. [Google Scholar] [CrossRef] [PubMed]
- Rao, S.; Smith, D.A.; Guler, E.; Kikano, E.G.; Rajdev, M.A.; Yoest, J.M.; Ramaiya, N.H.; Tirumani, S.H. Past, Present, and Future of Serum Tumor Markers in Management of Ovarian Cancer: A Guide for the Radiologist. Radiographics 2021, 41, 1839–1856. [Google Scholar] [CrossRef]
- O’Brien, T.J.; Beard, J.B.; Underwood, L.J.; Dennis, R.A.; Santin, A.D.; York, L. The CA 125 gene: An extracellular superstructure dominated by repeat sequences. Tumor Biol. 2001, 22, 348–366. [Google Scholar] [CrossRef]
- Felder, M.; Kapur, A.; Gonzalez-Bosquet, J.; Horibata, S.; Heintz, J.; Albrecht, R.; Fass, L.; Kaur, J.; Hu, K.; Shojaei, H.; et al. MUC16 (CA125): Tumor biomarker to cancer therapy, a work in progress. Mol. Cancer 2014, 13, 129. [Google Scholar] [CrossRef] [PubMed]
- Wang, C.W.; Weaver, S.D.; Boonpattrawong, N.; Schuster-Little, N.; Patankar, M.; Whelan, R.J. A Revised Molecular Model of Ovarian Cancer Biomarker CA125 (MUC16) Enabled by Long-read Sequencing. Cancer Res. Commun. 2024, 4, 253–263. [Google Scholar] [CrossRef]
- Weiland, F.; Martin, K.; Oehler, M.K.; Hoffmann, P. Deciphering the Molecular Nature of Ovarian Cancer Biomarker CA125. Int. J. Mol. Sci. 2012, 13, 10568–10582. [Google Scholar] [CrossRef]
- Bressan, A.; Bozzo, F.; Maggi, C.A.; Binaschi, M. OC125, M11 and OV197 epitopes are not uniformly distributed in the tandem-repeat region of CA125 and require the entire SEA domain. Dis. Markers 2013, 34, 257–267. [Google Scholar] [CrossRef]
- Marcos-Silva, L.; Narimatsu, Y.; Halim, A.; Campos, D.; Yang, Z.; Tarp, M.A.; Pereira, P.J.B.; Mandel, U.; Bennett, E.P.; Vakhrushev, S.Y.; et al. Characterization of Binding Epitopes of CA125 Monoclonal Antibodies. J. Proteome Res. 2014, 13, 3349–3359. [Google Scholar] [CrossRef]
- White, B.; Patterson, M.; Karnwal, S.; Brooks, C.L. Crystal structure of a human MUC16 SEA domain reveals insight into the nature of the CA125 tumor marker. Proteins Struct. Funct. Bioinform. 2022, 90, 1210–1218. [Google Scholar] [CrossRef]
- Wang, C.W.; Hanson, E.K.; Minkoff, L.; Whelan, R.J. Individual recombinant repeats of MUC16 display variable binding to CA125 antibodies. Cancer Biomark. 2023, 37, 85–94. [Google Scholar] [CrossRef]
- Berman, Z.T.; Moore, L.J.; Knudson, K.E.; Whelan, R.J. Synthesis and structural characterization of the peptide epitope of the ovarian cancer biomarker CA125 (MUC16). Tumor Biol. 2010, 31, 495–502. [Google Scholar] [CrossRef] [PubMed]
- Kenemans, P.; Vankamp, G.J.; Oehr, P.; Verstraeten, R.A. Heterologous Double-Determinant Immunoradiometric Assay CA-125-II—Reliable 2nd-Generation Immunoassay for Determining CA-125 in Serum. Clin. Chem. 1993, 39, 2509–2513. [Google Scholar] [CrossRef]
- Weiland, F.; Fritz, K.; Oehler, M.K.; Hoffmann, P. Methods for Identification of CA125 from Ovarian Cancer Ascites by High Resolution Mass Spectrometry. Int. J. Mol. Sci. 2012, 13, 9942–9958. [Google Scholar] [CrossRef] [PubMed]
- Toma, L.; Mattarozzi, M.; Ronda, L.; Marassi, V.; Zattoni, A.; Fortunati, S.; Giannetto, M.; Careri, M. Are Aptamers Really Promising as Receptors for Analytical Purposes? Insights into Anti-Lysozyme DNA Aptamers through a Multitechnique Study. Anal. Chem. 2024, 96, 2719–2726. [Google Scholar] [CrossRef] [PubMed]
- Wenk, D.; Khan, S.; Ignatchenko, V.; May, T.; Bernardini, M.Q.; Kislinger, T. Targeted Mass Spectrometry of Longitudinal Patient Sera Reveals LTBP1 as a Potential Surveillance Biomarker for High-Grade Serous Ovarian Carcinoma. J. Proteome Res. 2024, 23, 749–759. [Google Scholar] [CrossRef]
- Choi, K.; Ng, A.H.C.; Fobel, R.; Wheeler, A.R. Digital Microfluidics. Ann. Rev. Anal. Chem. 2012, 5, 413–440. [Google Scholar] [CrossRef]
- Cho, S.K.; Moon, H.J.; Kim, C.J. Creating, transporting, cutting, and merging liquid droplets by electrowetting-based actuation for digital microfluidic circuits. J. Microelectromech. Syst. 2003, 12, 70–80. [Google Scholar]
- Schuster-Little, N.; Sokolovsky, A.D.; Gentry, A.; Saraf, A.; Etzel, M.R.; Patankar, M.S.; Whelan, R.J. Immunoaffinity-free chromatographic purification of ovarian cancer biomarker CA125 (MUC16) from blood serum enables mass spectrometry characterization. Anal. Methods 2024, 16, 6337–6348. [Google Scholar] [CrossRef] [PubMed]
- Rozkov, A.; Schweder, T.; Veide, A.; Enfors, S.O. Dynamics of proteolysis and its influence on the accumulation of intracellular recombinant proteins. Enzyme Microb. Technol. 2000, 27, 743–748. [Google Scholar] [CrossRef] [PubMed]
- Heinrich, L.; Tissot, N.; Hartmann, D.J.; Cohen, R. Comparison of the results obtained by ELISA and surface plasmon resonance for the determination of antibody affinity. J. Immunol. Methods 2010, 352, 13–22. [Google Scholar] [CrossRef]
- Serrano, A.; Guyette, J.L.; Heim, J.B.; Taylor, M.; Cherubin, P.; Krengel, U.; Teter, K.; Tatulian, S.A. Holotoxin disassembly by protein disulfide isomerase is less efficient for heat-labile enterotoxin than cholera toxin. Sci. Rep. 2022, 12, 34. [Google Scholar] [CrossRef]
- Thompson, C.M.; Cannon, A.; West, S.; Ghersi, D.; Atri, P.; Bhatia, R.; Smith, L.; Rachagani, S.; Wichman, C.; Kumar, S.; et al. Mucin Expression and Splicing Determine Novel Subtypes and Patient Mortality in Pancreatic Ductal Adenocarcinoma. Clin. Cancer Res. 2021, 27, 6787–6799. [Google Scholar] [CrossRef] [PubMed]
- Rao, T.D.; Tian, H.; Ma, X.; Yan, X.; Thapi, S.; Schultz, N.; Rosales, N.; Monette, S.; Wang, A.; Hyman, D.M.; et al. Expression of the Carboxy-Terminal Portion of MUC16/CA125 Induces Transformation and Tumor Invasion. PLoS ONE 2015, 10, e0126633. [Google Scholar] [CrossRef]
- He, C.P.; Chen, Y.; Zhang, X.; Feng, H.; Rao, Y.; Ji, T.; Wang, W. Down-regulation of ESRP2 inhibits breast cancer cell proliferation via inhibiting cyclinD1. Sci. Rep. 2024, 14, 28475. [Google Scholar] [CrossRef]
- Vankamp, G.J.; Verstraeten, A.A.; Kenemans, P. Discordant Serum CA-125 Values in Commercial Immunoassays. Eur. J. Obstet. Gynecol. Reprod. Biol. 1993, 49, 99–103. [Google Scholar] [CrossRef]
- Kenemans, P.; Bon, G.G.; Kessler, A.C.; Verstraeten, A.A.; Vankamp, G.J. Multicenter Technical and Clinical-Evaluation of a Fully Automated Enzyme-Immunoassay for CA-125. Clin. Chem. 1992, 38, 1466–1471. [Google Scholar] [CrossRef]
- Kenemans, P.; Verstraeten, A.A.; Vankamp, G.J.; Vonmensdorffpouilly, S. The 2nd Generation CA-125. Ann. Med. 1995, 27, 107–113. [Google Scholar] [CrossRef]
- Davis, H.M.; Zurawski, V.R.; Bast, R.C.; Klug, T.L. Characterization of the CA 125 antigen associated with human epithelial ovarian carcinomas. Cancer Res. 1986, 46, 6143–6148. [Google Scholar] [PubMed]


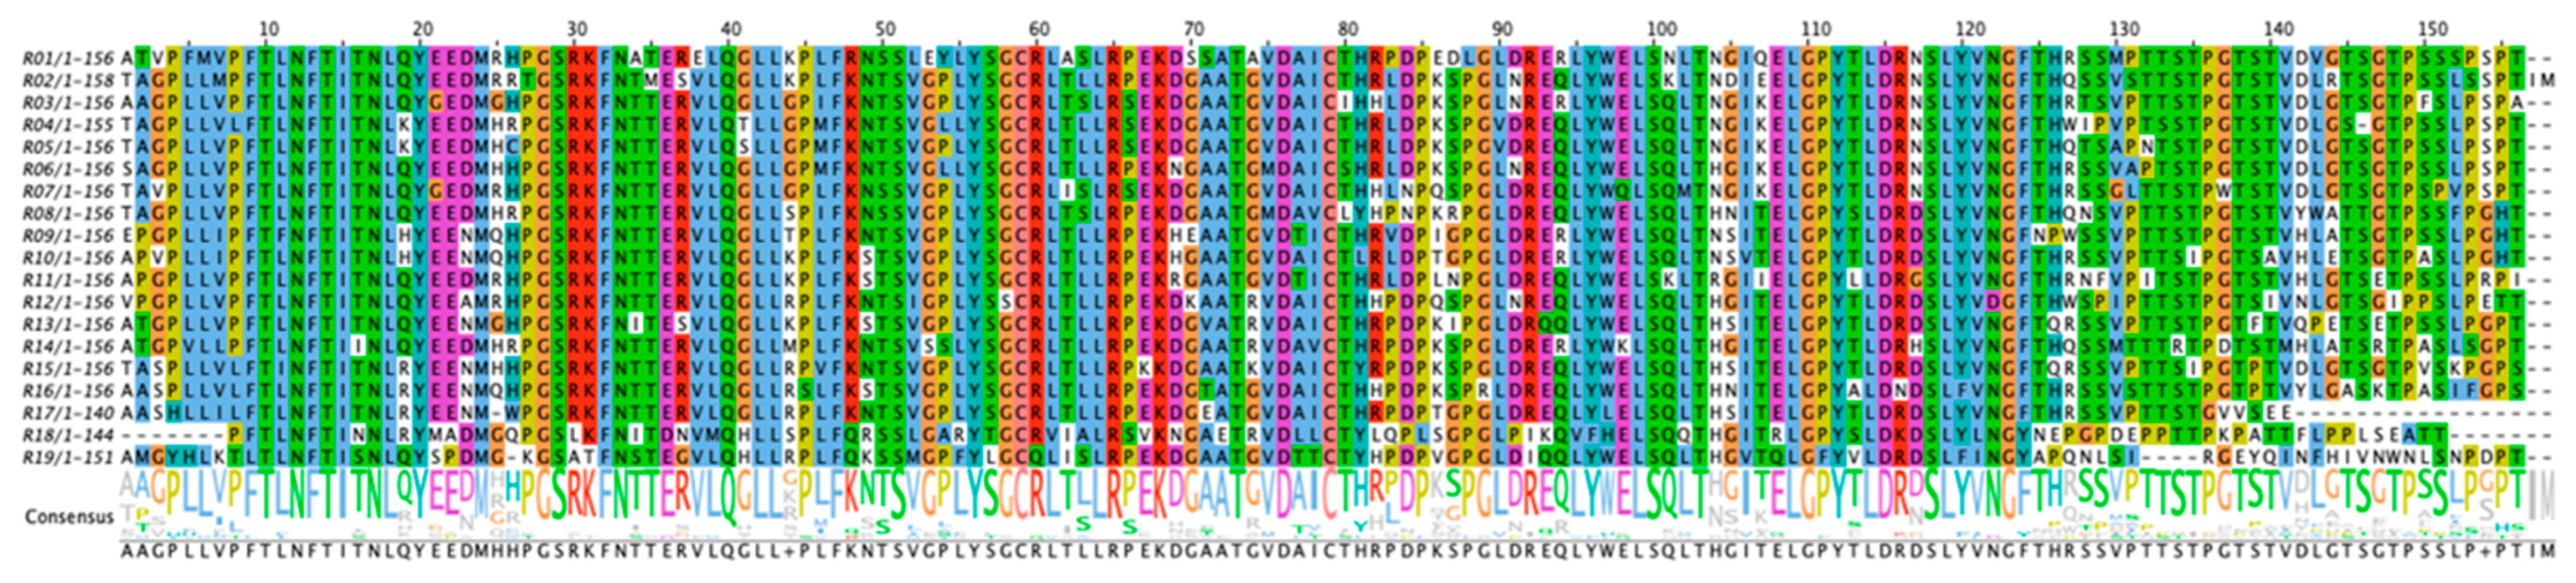
| Repeat | Sequence | Coverage |
|---|---|---|
| R1 | ATVPFMVPFTLNFTITNLQYEEDMRHPGSRKFNATERELQGLLKPLFRNSSLEYLYSGCRLAS LRPEKDSSATAVDAICTHRPDPEDLGLDRERLYWELSNLTNGIQELGPYTLDRNSLYVNGFT HRSSMPTTSTPGTSTVDVGTSGTPSSSPSPT | 100% |
| R2 | TAGPLLMPFTLNFTITNLQYEEDMRRTGSRKFNTMESVLQGLLKPLFKNTSVGPLYSGCRLT LLRPEKDGAATGVDAICTHRLDPKSPGLNREQLYWELSKLTNDIEELGPYTLDRNSLYVNGF THQSSVSTTSTPGTSTVDLRTSGTPSSLSSPTIM | 100% |
| R3 | AAGPLLVPFTLNFTITNLQYGEDMGHPGSRKFNTTERVLQGLLGPIFKNTSVGPLYSGCRLTS LRSEKDGAATGVDAICIHHLDPKSPGLNRERLYWELSQLTNGIKELGPYTLDRNSLYVNGFT HRTSVPTTSTPGTSTVDLGTSGTPFSLPSPA | 97% |
| R4 | TAGPLLVLFTLNFTITNLKYEEDMHRPGSRKFNTTERVLQTLLGPMFKNTSVGLLYSGCRLT LLRSEKDGAATGVDAICTHRLDPKSPGVDREQLYWELSQLTNGIKELGPYTLDRNSLYVNGFT HWIPVPTSSTPGTSTVDLGSGTPSSLPSPT | 99% |
| R5 | TAGPLLVPFTLNFTITNLKYEEDMHCPGSRKFNTTERVLQSLLGPMFKNTSVGPLYSGCRLT LLRSEKDGAATGVDAICTHRLDPKSPGVDREQLYWELSQLTNGIKELGPYTLDRNSLYVNG FTHQTSAPNTSTPGTSTVDLGTSGTPSSLPSPT | 100% |
| R6 | SAGPLLVPFTLNFTITNLQYEEDMHHPGSRKFNTTERVLQGLLGPMFKNTSVGLLYSGCRLT LLRPEKNGAATGMDAICSHRLDPKSPGLNREQLYWELSQLTHGIKELGPYTLDRNSLYVNG FTHRSSVAPTSTPGTSTVDLGTSGTPSSLPSPT | 95% |
| R7 | TAVPLLVPFTLNFTITNLQYGEDMRHPGSRKFNTTERVLQGLLGPLFKNSSVGPLYSGCRLIS LRSEKDGAATGVDAICTHHLNPQSPGLDREQLYWQLSQMTNGIKELGPYTLDRNSLYVNG FTHRSSGLTTSTPWTSTVDLGTSGTPSPVPSPT | 100% |
| R8 | TAGPLLVPFTLNFTITNLQYEEDMHRPGSRKFNTTERVLQGLLSPIFKNSSVGPLYSGCRLTSL RPEKDGAATGMDAVCLYHPNPKRPGLDREQLYWELSQLTHNITELGPYSLDRDSLYVNGF THQNSVPTTSTPGTSTVYWATTGTPSSFPGHT | 100% |
| R9 | EPGPLLIPFTFNFTITNLHYEENMQHPGSRKFNTTERVLQGLLTPLFKNTSVGPLYSGCRLTLL RPEKHEAATGVDTICTHRVDPIGPGLDRERLYWELSQLTNSITELGPYTLDRDSLYVNGFNP WSSVPTTSTPGTSTVHLATSGTPSSLPGHT | 100% |
| R10 | APVPLLIPFTLNFTITNLHYEENMQHPGSRKFNTTERVLQGLLKPLFKSTSVGPLYSGCRLTLL RPEKHGAATGVDAICTLRLDPTGPGLDRERLYWELSQLTNSVTELGPYTLDRDSLYVNGFT HRSSVPTTSIPGTSAVHLETSGTPASLPGHT | 100% |
| R11 | APGPLLVPFTLNFTITNLQYEEDMRHPGSRKFNTTERVLQGLLKPLFKSTSVGPLYSGCRLTL LRPEKRGAATGVDTICTHRLDPLNPGLDREQLYWELSKLTRGIIELGPYLLDRGSLYVNGFT HRNFVPITSTPGTSTVHLGTSETPSSLPRPI | 100% |
| R12 | VPGPLLVPFTLNFTITNLQYEEAMRHPGSRKFNTTERVLQGLLRPLFKNTSIGPLYSSCRLTLL RPEKDKAATRVDAICTHHPDPQSPGLNREQLYWELSQLTHGITELGPYTLDRDSLYVDGFT HWSPIPTTSTPGTSIVNLGTSGIPPSLPETT | 100% |
| R13 | ATGPLLVPFTLNFTITNLQYEENMGHPGSRKFNITESVLQGLLKPLFKSTSVGPLYSGCRLTLL RPEKDGVATRVDAICTHRPDPKIPGLDRQQLYWELSQLTHSITELGPYTLDRDSLYVNGFTQ RSSVPTTSTPGTFTVQPETSETPSSLPGPT | 88% |
| R14 | ATGPVLLPFTLNFTIINLQYEEDMHRPGSRKFNTTERVLQGLLMPLFKNTSVSSLYSGCRLTL LRPEKDGAATRVDAVCTHRPDPKSPGLDRERLYWKLSQLTHGITELGPYTLDRHSLYVNGF THQSSMTTTRTPDTSTMHLATSRTPASLSGPT | N/A |
| R15 | TASPLLVLFTINFTITNLRYEENMHHPGSRKFNTTERVLQGLLRPVFKNTSVGPLYSGCRLTL LRPKKDGAATKVDAICTYRPDPKSPGLDREQLYWELSQLTHSITELGPYTLDRDSLYVNGF TQRSSVPTTSIPGTPTVDLGTSGTPVSKPGPS | 99% |
| R16 | AASPLLVLFTLNFTITNLRYEENMQHPGSRKFNTTERVLQGLLRSLFKSTSVGPLYSGCRLTL LRPEKDGTATGVDAICTHHPDPKSPRLDREQLYWELSQLTHNITELGPYALDNDSLFVNGF THRSSVSTTSTPGTPTVYLGASKTPASIFGPS | 76% |
| R17 | AASHLLILFTLNFTITNLRYEENMWPGSRKFNTTERVLQGLLRPLFKNTSVGPLYSGCRLTLL RPEKDGEATGVDAICTHRPDPTGPGLDREQLYLELSQLTHSITELGPYTLDRDSLYVNGF THRSSVPTTSTGVVSEE | 100% |
| R18 | PFTLNFTINNLRYMADMGQPGSLKFNITDNVMQHLLSPLFQRSSLGARYTGCRVIALRSVK NGAETRVDLLCTYLQPLSGPGLPIKQVFHELSQQTHGITRLGPYSLDKDSLYLNGYNEPGPD EPPTTPKPATTFLPPLSEATT | N/A |
| R19 | AMGYHLKTLTLNFTISNLQYSPDMGKGSATFNSTEGVLQHLLRPLFQKSSMGPFYLGCQLIS LRPEKDGAATGVDTTCTYHPDPVGPGLDIQQLYWELSQLTHGVTQLGFYVLDRDSLFINGY APQNLSIRGEYQINFHIVNWNLSNPDPT | N/A |
Disclaimer/Publisher’s Note: The statements, opinions and data contained in all publications are solely those of the individual author(s) and contributor(s) and not of MDPI and/or the editor(s). MDPI and/or the editor(s) disclaim responsibility for any injury to people or property resulting from any ideas, methods, instructions or products referred to in the content. |
© 2025 by the authors. Licensee MDPI, Basel, Switzerland. This article is an open access article distributed under the terms and conditions of the Creative Commons Attribution (CC BY) license (https://creativecommons.org/licenses/by/4.0/).
Share and Cite
Wang, C.-W.; Srivastava, A.; Hanson, E.K.; McEntee, C.R.; Nair, T.; March, J.C.; Whelan, R.J. Mapping the Binding Sites of CA125-Specific Antibodies on a Revised Molecular Model of MUC16. Cancers 2025, 17, 1458. https://doi.org/10.3390/cancers17091458
Wang C-W, Srivastava A, Hanson EK, McEntee CR, Nair T, March JC, Whelan RJ. Mapping the Binding Sites of CA125-Specific Antibodies on a Revised Molecular Model of MUC16. Cancers. 2025; 17(9):1458. https://doi.org/10.3390/cancers17091458
Chicago/Turabian StyleWang, Chien-Wei, Anubhuti Srivastava, Eliza K. Hanson, Caitlin R. McEntee, Trisha Nair, Jane C. March, and Rebecca J. Whelan. 2025. "Mapping the Binding Sites of CA125-Specific Antibodies on a Revised Molecular Model of MUC16" Cancers 17, no. 9: 1458. https://doi.org/10.3390/cancers17091458
APA StyleWang, C.-W., Srivastava, A., Hanson, E. K., McEntee, C. R., Nair, T., March, J. C., & Whelan, R. J. (2025). Mapping the Binding Sites of CA125-Specific Antibodies on a Revised Molecular Model of MUC16. Cancers, 17(9), 1458. https://doi.org/10.3390/cancers17091458