Thyroid Cancer Incidence and Trends in United States and Canadian Pediatric, Adolescent, and Young Adults
Simple Summary
Abstract
1. Introduction
2. Methods
2.1. Study Design
2.2. Data Source
2.3. Study Population
2.4. Data Analysis
3. Results
3.1. Demographic Characteristics
3.2. Overall Incidence Trend
3.3. Temporal Trends in Thyroid Cancer Incidence Rates in the United States vs. Canada
3.4. Age at Diagnosis
3.5. Sex
3.6. Histology
3.7. Race (United States Only)
3.8. Sex/Age
3.9. Race/Ethnicity/Sex (United States Only)
4. Discussion
4.1. Global Trends in Thyroid Cancer Incidence
4.2. Clinical and Public Health Implications
4.3. Strengths and Limitations
5. Conclusions
Supplementary Materials
Author Contributions
Funding
Institutional Review Board Statement
Informed Consent Statement
Data Availability Statement
Conflicts of Interest
References
- American Cancer Society. Cancer Facts & Figures 2024; American Cancer Society: New York, NY, USA, 2024. [Google Scholar]
- Canadian Cancer Statistics Advisory Committee. Canadian Cancer Statistics 2018; Canadian Cancer Society: Toronto, ON, Canda, 2018. [Google Scholar]
- Vaccarella, S.; Franceschi, S.; Bray, F.; Wild, C.P.; Plummer, M.; Dal Maso, L. Worldwide Thyroid-Cancer Epidemic? The Increasing Impact of Overdiagnosis. N. Engl. J. Med. 2016, 375, 614–617. [Google Scholar] [CrossRef] [PubMed]
- Kitahara, C.M.; Sosa, J.A. The changing incidence of thyroid cancer. Nat. Rev. Endocrinol. 2016, 12, 646–653. [Google Scholar] [CrossRef] [PubMed]
- Zanocco, K.A.; Hershman, J.M.; Leung, A.M. Active Surveillance of Low-Risk Thyroid Cancer. JAMA 2019, 321, 2020–2021. [Google Scholar] [CrossRef] [PubMed]
- Davies, L.; Welch, H.G. Current thyroid cancer trends in the United States. JAMA Otolaryngol.—Head Neck Surg. 2014, 140, 317–322. [Google Scholar] [CrossRef]
- Sanabria, A.; Kowalski, L.P.; Shah, J.P.; Nixon, I.J.; Angelos, P.; Williams, M.D.; Rinaldo, A.; Ferlito, A. Growing incidence of thyroid carcinoma in recent years: Factors underlying overdiagnosis. Head Neck 2018, 40, 855–866. [Google Scholar] [CrossRef]
- Topstad, D.; Dickinson, J.A. Thyroid cancer incidence in Canada: A national cancer registry analysis. CMAJ Open 2017, 5, E612–E616. [Google Scholar] [CrossRef]
- Lim, H.; Devesa, S.S.; Sosa, J.A.; Check, D.; Kitahara, C.M. Trends in Thyroid Cancer Incidence and Mortality in the United States, 1974–2013. JAMA 2017, 317, 1338–1348. [Google Scholar] [CrossRef]
- Enewold, L.; Zhu, K.; Ron, E.; Marrogi, A.J.; Stojadinovic, A.; Peoples, G.E.; Devesa, S.S. Rising thyroid cancer incidence in the United States by demographic and tumor characteristics, 1980–2005. Cancer Epidemiol. Biomark. Prev. 2009, 18, 784–791. [Google Scholar] [CrossRef]
- Vaccarella, S.; Dal Maso, L.; Laversanne, M.; Bray, F.; Plummer, M.; Franceschi, S. The Impact of Diagnostic Changes on the Rise in Thyroid Cancer Incidence: A Population-Based Study in Selected High-Resource Countries. Thyroid 2015, 25, 1127–1136. [Google Scholar] [CrossRef]
- Coccia, P.F. Overview of Adolescent and Young Adult Oncology. J. Oncol. Pract. 2019, 15, 235–237. [Google Scholar] [CrossRef]
- Ladenson, P.W.; Singer, P.A.; Ain, K.B.; Bagchi, N.; Bigos, S.T.; Levy, E.G.; Smith, S.A.; Daniels, G.H.; Cohen, H.D. American Thyroid Association guidelines for detection of thyroid dysfunction. Arch. Intern. Med. 2000, 160, 1573–1575. [Google Scholar] [CrossRef] [PubMed]
- Canadian Task Force on the Periodic Health Examination; Canada. Health Canada. The Canadian Guide to Clinical Preventive Health Care; Canadian Government Pub Centre: Ottawa, ON, Canada, 1994. [Google Scholar]
- Dal Maso, L.; Lise, M.; Zambon, P.; Falcini, F.; Crocetti, E.; Serraino, D.; Cirilli, C.; Zanetti, R.; Vercelli, M.; Ferretti, S.; et al. Incidence of thyroid cancer in Italy, 1991-2005: Time trends and age-period-cohort effects. Ann. Oncol. 2011, 22, 957–963. [Google Scholar] [CrossRef] [PubMed]
- Chen, M.M.; Luu, M.; Sacks, W.L.; Orloff, L.; Wallner, L.P.; Clair, J.M.; Pitt, S.C.; Ho, A.S.; Zumsteg, Z.S. Trends in incidence, metastasis, and mortality from thyroid cancer in the USA from 1975 to 2019: A population-based study of age, period, and cohort effects. Lancet Diabetes Endocrinol. 2025, 13, 188–195. [Google Scholar] [CrossRef] [PubMed]
- Ahn, H.S.; Kim, H.J.; Welch, H.G. Korea’s thyroid-cancer “epidemic”—Screening and overdiagnosis. N. Engl. J. Med. 2014, 371, 1765–1767. [Google Scholar] [CrossRef]
- Siegel, D.A.; King, J.; Tai, E.; Buchanan, N.; Ajani, U.A.; Li, J. Cancer incidence rates and trends among children and adolescents in the United States, 2001–2009. Pediatrics 2014, 134, e945–e955. [Google Scholar] [CrossRef]
- Qian, Z.J.; Jin, M.C.; Meister, K.D.; Megwalu, U.C. Pediatric Thyroid Cancer Incidence and Mortality Trends in the United States, 1973–2013. JAMA Otolaryngol.—Head Neck Surg. 2019, 145, 617–623. [Google Scholar] [CrossRef]
- North American Association of Central Cancer Registries. Description of CiNA Public Use Dataset. Available online: https://www.naaccr.org/wp-content/uploads/2017/09/Description-of-CiNA-Public-Use-Dataset.pdf (accessed on 2 August 2018).
- Tomar, S.L.; Loree, M.; Logan, H. Racial differences in oral and pharyngeal cancer treatment and survival in Florida. Cancer Causes Control 2004, 15, 601–609. [Google Scholar] [CrossRef]
- Garber, J.R.; Cobin, R.H.; Gharib, H.; Hennessey, J.V.; Klein, I.; Mechanick, J.I.; Pessah-Pollack, R.; Singer, P.A.; Woeber, K.A. Clinical Practice Guidelines for Hypothyroidism in Adults: Cosponsored by the American Association of Clinical Endocrinologists and the American Thyroid Association. Thyroid 2012, 22, 1200–1235. [Google Scholar] [CrossRef]
- Anderson, R.N.; Rosenberg, H.M. Age standardization of death rates: Implementation of the year 2000 standard. Natl. Vital Stat. Rep. 1998, 47, 1–16. [Google Scholar]
- National Cancer Institute. Linear or Log-Linear Model. Available online: https://surveillance.cancer.gov/help/joinpoint/tech-help/frequently-asked-questions/linear-or-log-linear-model (accessed on 2 August 2018).
- National Cancer Institute. Selecting the Final Model. Available online: https://surveillance.cancer.gov/help/joinpoint/tech-help/frequently-asked-questions/selecting-the-final-model (accessed on 3 August 2018).
- Gillis, A.; Chen, H.; Wang, T.S.; Dream, S. Racial and Ethnic Disparities in the Diagnosis and Treatment of Thyroid Disease. J. Clin. Endocrinol. Metab. 2024, 109, e1336–e1344. [Google Scholar] [CrossRef]
- Cooper, D.S.; Doherty, G.M.; Haugen, B.R.; Kloos, R.T.; Lee, S.L.; Mandel, S.J.; Mazzaferri, E.L.; McIver, B.; Pacini, F.; Schlumberger, M.; et al. Revised American Thyroid Association management guidelines for patients with thyroid nodules and differentiated thyroid cancer. Thyroid 2009, 19, 1167–1214. [Google Scholar] [CrossRef] [PubMed]
- Rugge, B.; Balshem, H.; Sehgal, R.; Relevo, R.; Gorman, P.; Helfand, M. Screening and Treatment of Subclinical Hypothyroidism or Hyperthyroidism; Agency for Healthcare Research and Quality (US): Rockville, MD, USA, 2011.
- Bibbins-Domingo, K.; Grossman, D.C.; Curry, S.J.; Barry, M.J.; Davidson, K.W.; Doubeni, C.A.; Epling, J.W., Jr.; Kemper, A.R.; Krist, A.H.; Kurth, A.E.; et al. Screening for Thyroid Cancer: US Preventive Services Task Force Recommendation Statement. JAMA 2017, 317, 1882–1887. [Google Scholar] [CrossRef] [PubMed]
- Hall, S.F.; Webber, C.; Groome, P.A.; Booth, C.M.; Nguyen, P.; DeWit, Y. Do doctors who order more routine medical tests diagnose more cancers? A population-based study from Ontario Canada. Cancer Med. 2019, 8, 850–859. [Google Scholar] [CrossRef] [PubMed]
- Dal Maso, L.; Vaccarella, S.; Franceschi, S. Trends in thyroid cancer incidence and overdiagnosis in the USA. Lancet Diabetes Endocrinol. 2025, 13, 167–169. [Google Scholar] [CrossRef]
- Hoang, J.K.; Nguyen, X.V.; Davies, L. Overdiagnosis of thyroid cancer: Answers to five key questions. Acad. Radiol. 2015, 22, 1024–1029. [Google Scholar] [CrossRef]
- Harper, A.S.; Diaz, R.L.; Cortez, S.N.R.; Shack, L.; Amin, K.; Bu, J.V.; Barr, R.D.; Fidler-Benaoudia, M.M. Trends in the Incidence of Cancer Among Adolescent and Young Adults in Alberta, 1983–2017: A Population-Based Study Using Cancer Registry Data. J. Adolesc Young Adult Oncol. 2023, 12, 185–198. [Google Scholar] [CrossRef]
- Norwood, T.A.; Buajitti, E.; Lipscombe, L.L.; Stukel, T.A.; Rosella, L.C. Incidental detection, imaging modalities and temporal trends of differentiated thyroid cancer in Ontario: A population-based retrospective cohort study. CMAJ Open 2020, 8, E695–E705. [Google Scholar] [CrossRef]
- Haugen, B.R.; Alexander, E.K.; Bible, K.C.; Doherty, G.M.; Mandel, S.J.; Nikiforov, Y.E.; Pacini, F.; Randolph, G.W.; Sawka, A.M.; Schlumberger, M.; et al. 2015 American Thyroid Association Management Guidelines for Adult Patients with Thyroid Nodules and Differentiated Thyroid Cancer: The American Thyroid Association Guidelines Task Force on Thyroid Nodules and Differentiated Thyroid Cancer. Thyroid 2016, 26, 1–133. [Google Scholar] [CrossRef]
- Liu, S.; Semenciw, R.; Ugnat, A.M.; Mao, Y. Increasing thyroid cancer incidence in Canada, 1970–1996: Time trends and age-period-cohort effects. Br. J. Cancer 2001, 85, 1335–1339. [Google Scholar] [CrossRef][Green Version]
- Bernier, M.O.; Withrow, D.R.; Berrington de Gonzalez, A.; Lam, C.J.K.; Linet, M.S.; Kitahara, C.M.; Shiels, M.S. Trends in pediatric thyroid cancer incidence in the United States, 1998–2013. Cancer 2019, 125, 2497–2505. [Google Scholar] [CrossRef]
- Ma, J.; Huang, M.; Wang, L.; Ye, W.; Tong, Y.; Wang, H. Obesity and risk of thyroid cancer: Evidence from a meta-analysis of 21 observational studies. Med. Sci. Monit. 2015, 21, 283–291. [Google Scholar] [CrossRef] [PubMed]
- Colditz, G.A.; Peterson, L.L. Obesity and Cancer: Evidence, Impact, and Future Directions. Clin. Chem. 2018, 64, 154–162. [Google Scholar] [CrossRef] [PubMed]
- Kitahara, C.M.; Platz, E.A.; Freeman, L.E.; Hsing, A.W.; Linet, M.S.; Park, Y.; Schairer, C.; Schatzkin, A.; Shikany, J.M.; Berrington de Gonzalez, A. Obesity and thyroid cancer risk among U.S. men and women: A pooled analysis of five prospective studies. Cancer Epidemiol. Biomark. Prev. A Publ. Am. Assoc. Cancer Res. Cosponsored Am. Soc. Prev. Oncol. 2011, 20, 464–472. [Google Scholar] [CrossRef] [PubMed]
- Kitahara, C.M.; Pfeiffer, R.M.; Sosa, J.A.; Shiels, M.S. Impact of overweight and obesity on U.S. papillary thyroid cancer incidence trends (1995–2015). J. Natl. Cancer Inst. 2019, 112, 810–817. [Google Scholar] [CrossRef]
- Lauby-Secretan, B.; Scoccianti, C.; Loomis, D.; Grosse, Y.; Bianchini, F.; Straif, K. Body Fatness and Cancer--Viewpoint of the IARC Working Group. N. Engl. J. Med. 2016, 375, 794–798. [Google Scholar] [CrossRef]
- Sung, H.; Siegel, R.L.; Rosenberg, P.S.; Jemal, A. Emerging cancer trends among young adults in the USA: Analysis of a population-based cancer registry. Lancet Public Health 2019, 4, e137–e147. [Google Scholar] [CrossRef]
- Goldenberg, D. We cannot ignore the real component of the rise in thyroid cancer incidence. Cancer 2019, 125, 2362–2363. [Google Scholar] [CrossRef]
- Zane, M.; Parello, C.; Pennelli, G.; Townsend, D.M.; Merigliano, S.; Boscaro, M.; Toniato, A.; Baggio, G.; Pelizzo, M.R.; Rubello, D.; et al. Estrogen and thyroid cancer is a stem affair: A preliminary study. Biomed. Pharmacother. 2017, 85, 399–411. [Google Scholar] [CrossRef]
- Nejadghaderi, S.A.; Moghaddam, S.S.; Azadnajafabad, S.; Rezaei, N.; Rezaei, N.; Tavangar, S.M.; Jamshidi, H.; Mokdad, A.H.; Naghavi, M.; Farzadfar, F.; et al. Burden of thyroid cancer in North Africa and Middle East 1990–2019. Front. Oncol. 2022, 12, 955358. [Google Scholar] [CrossRef]
- Rossing, M.A.; Schwartz, S.M.; Weiss, N.S. Thyroid cancer incidence in Asian migrants to the United States and their descendants. Cancer Causes Control 1995, 6, 439–444. [Google Scholar] [CrossRef]
- Moleti, M.; Aversa, T.; Crisafulli, S.; Trifirò, G.; Corica, D.; Pepe, G.; Cannavò, L.; Di Mauro, M.; Paola, G.; Fontana, A.; et al. Global incidence and prevalence of differentiated thyroid cancer in childhood: Systematic review and meta-analysis. Front. Endocrinol. 2023, 14, 1270518. [Google Scholar] [CrossRef]
- Dedhia, P.H.; Saucke, M.C.; Long, K.L.; Doherty, G.M.; Pitt, S.C. Physician Perspectives of Overdiagnosis and Overtreatment of Low-Risk Papillary Thyroid Cancer in the US. JAMA Netw. Open 2022, 5, e228722. [Google Scholar] [CrossRef]
- North American Association of Central Cancer Registries (NAACCR). Certification Criteria. Available online: https://www.naaccr.org/certification-criteria/ (accessed on 9 April 2025).
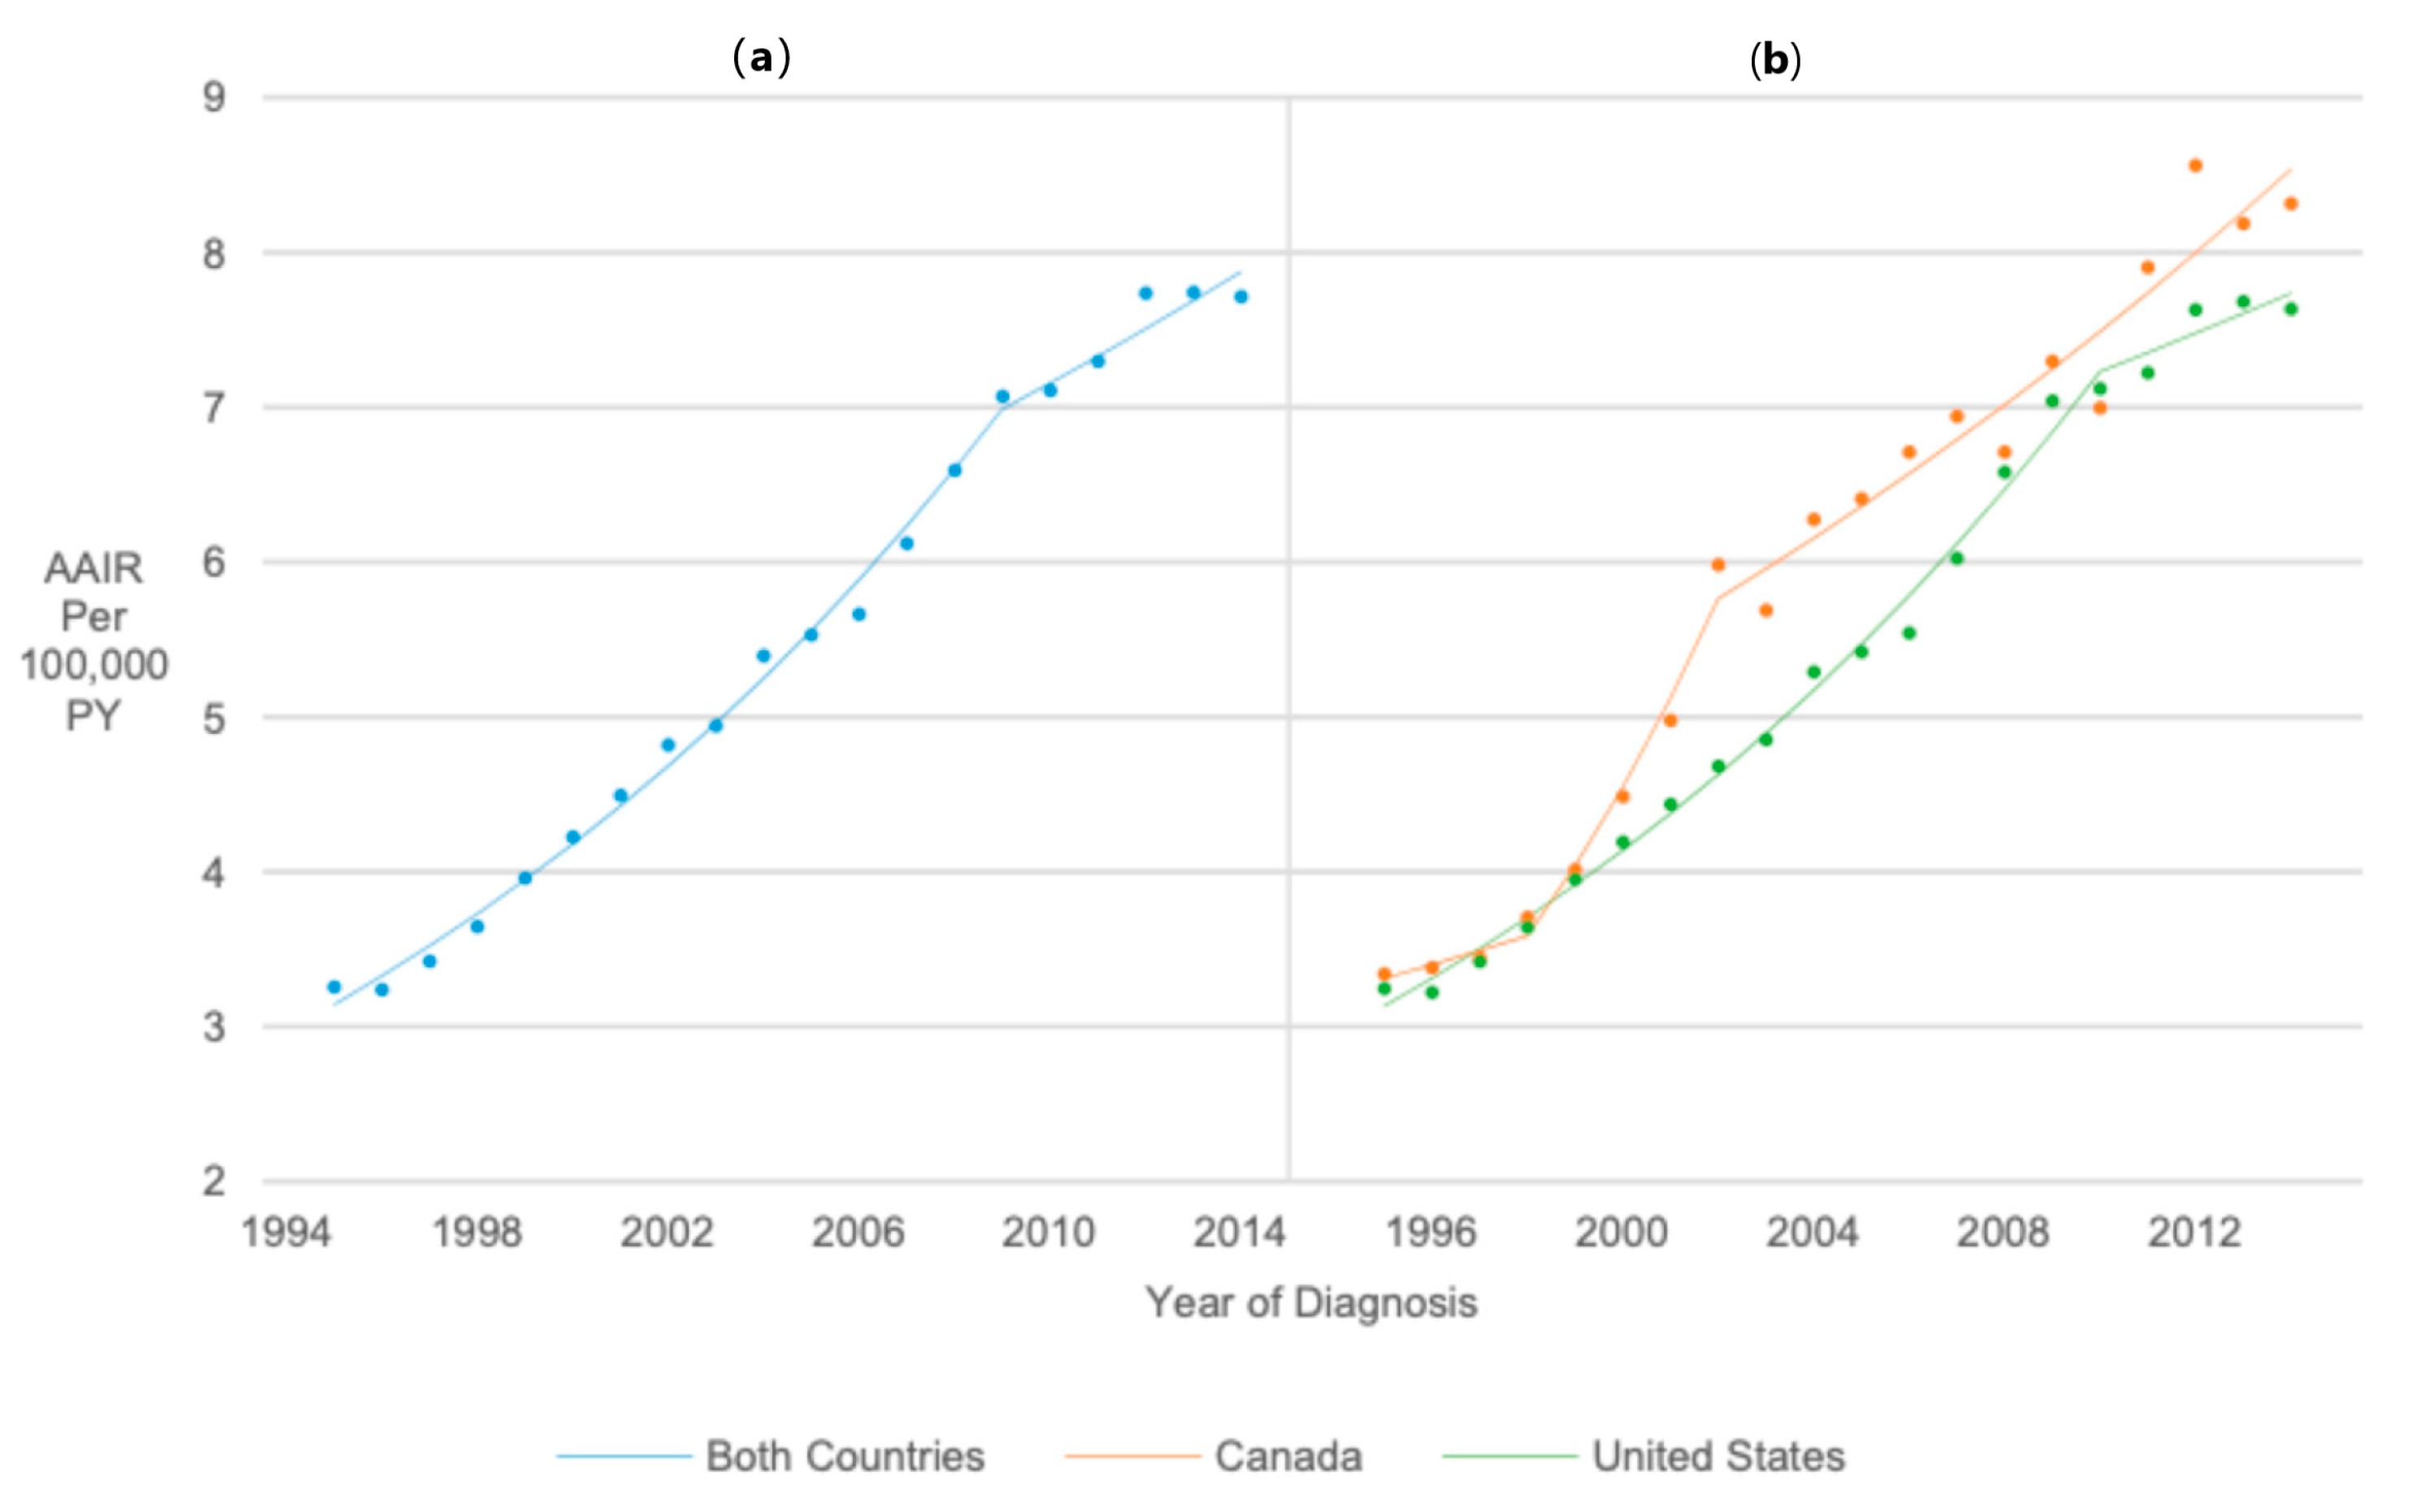
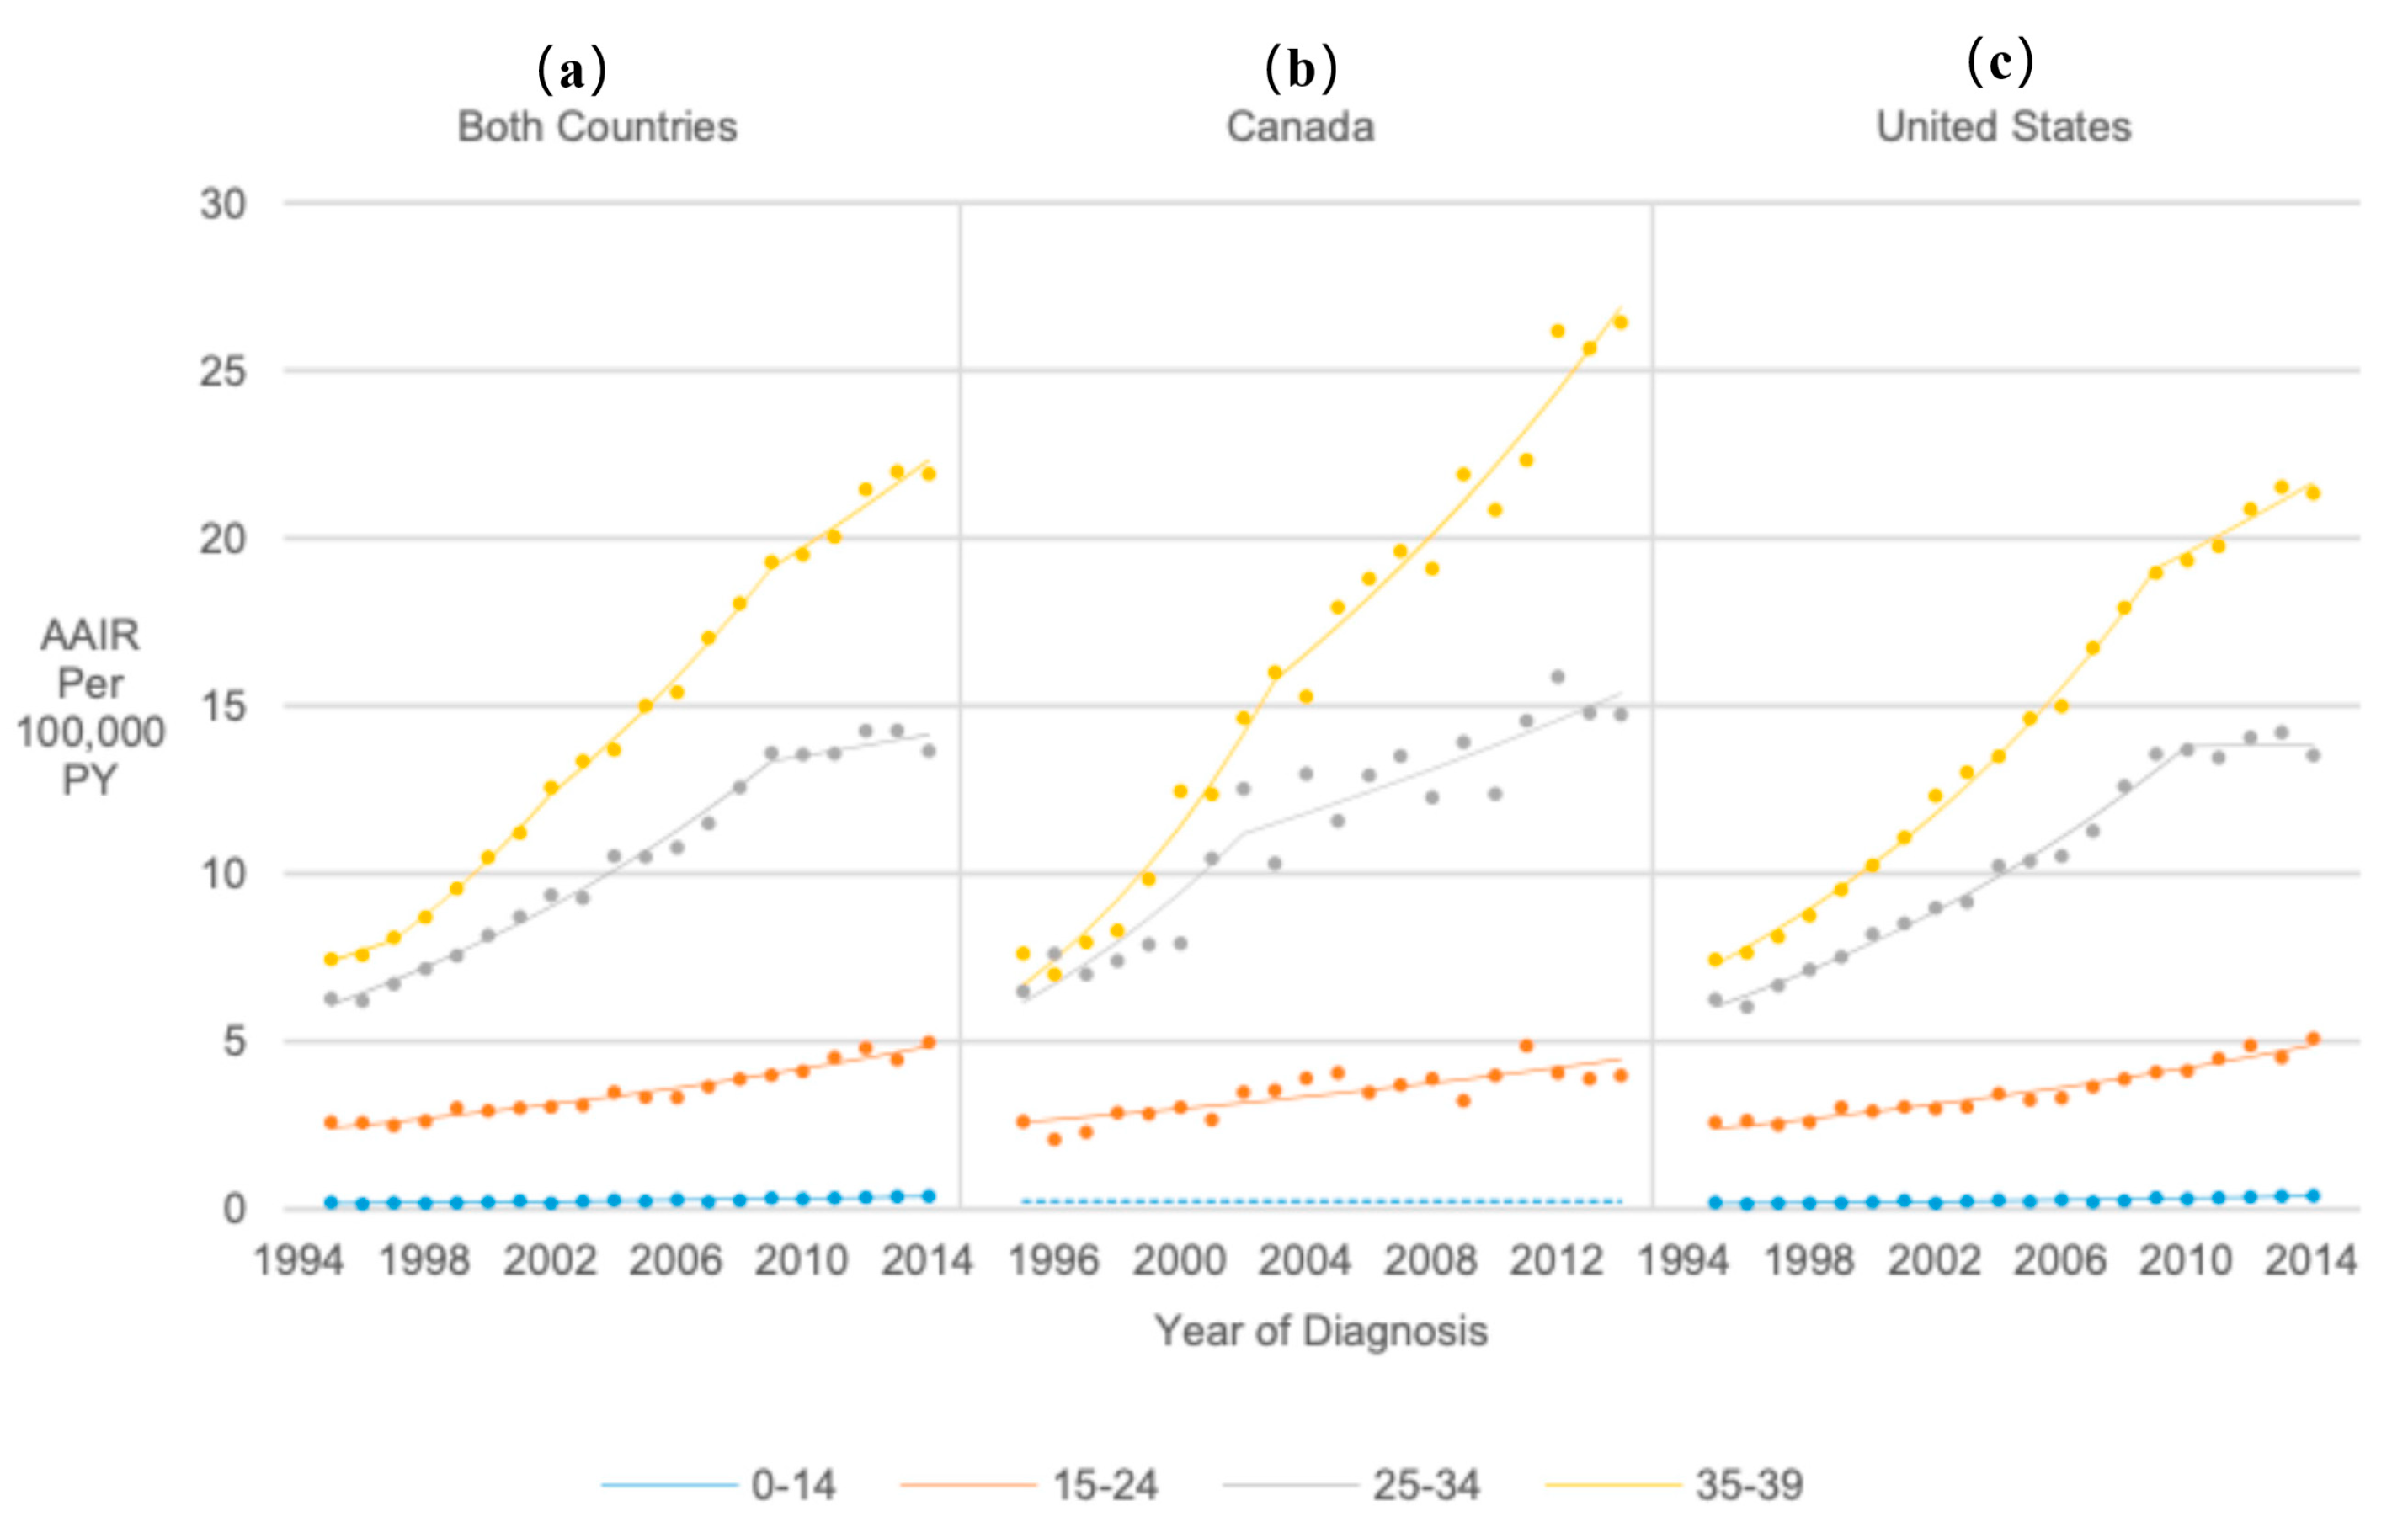
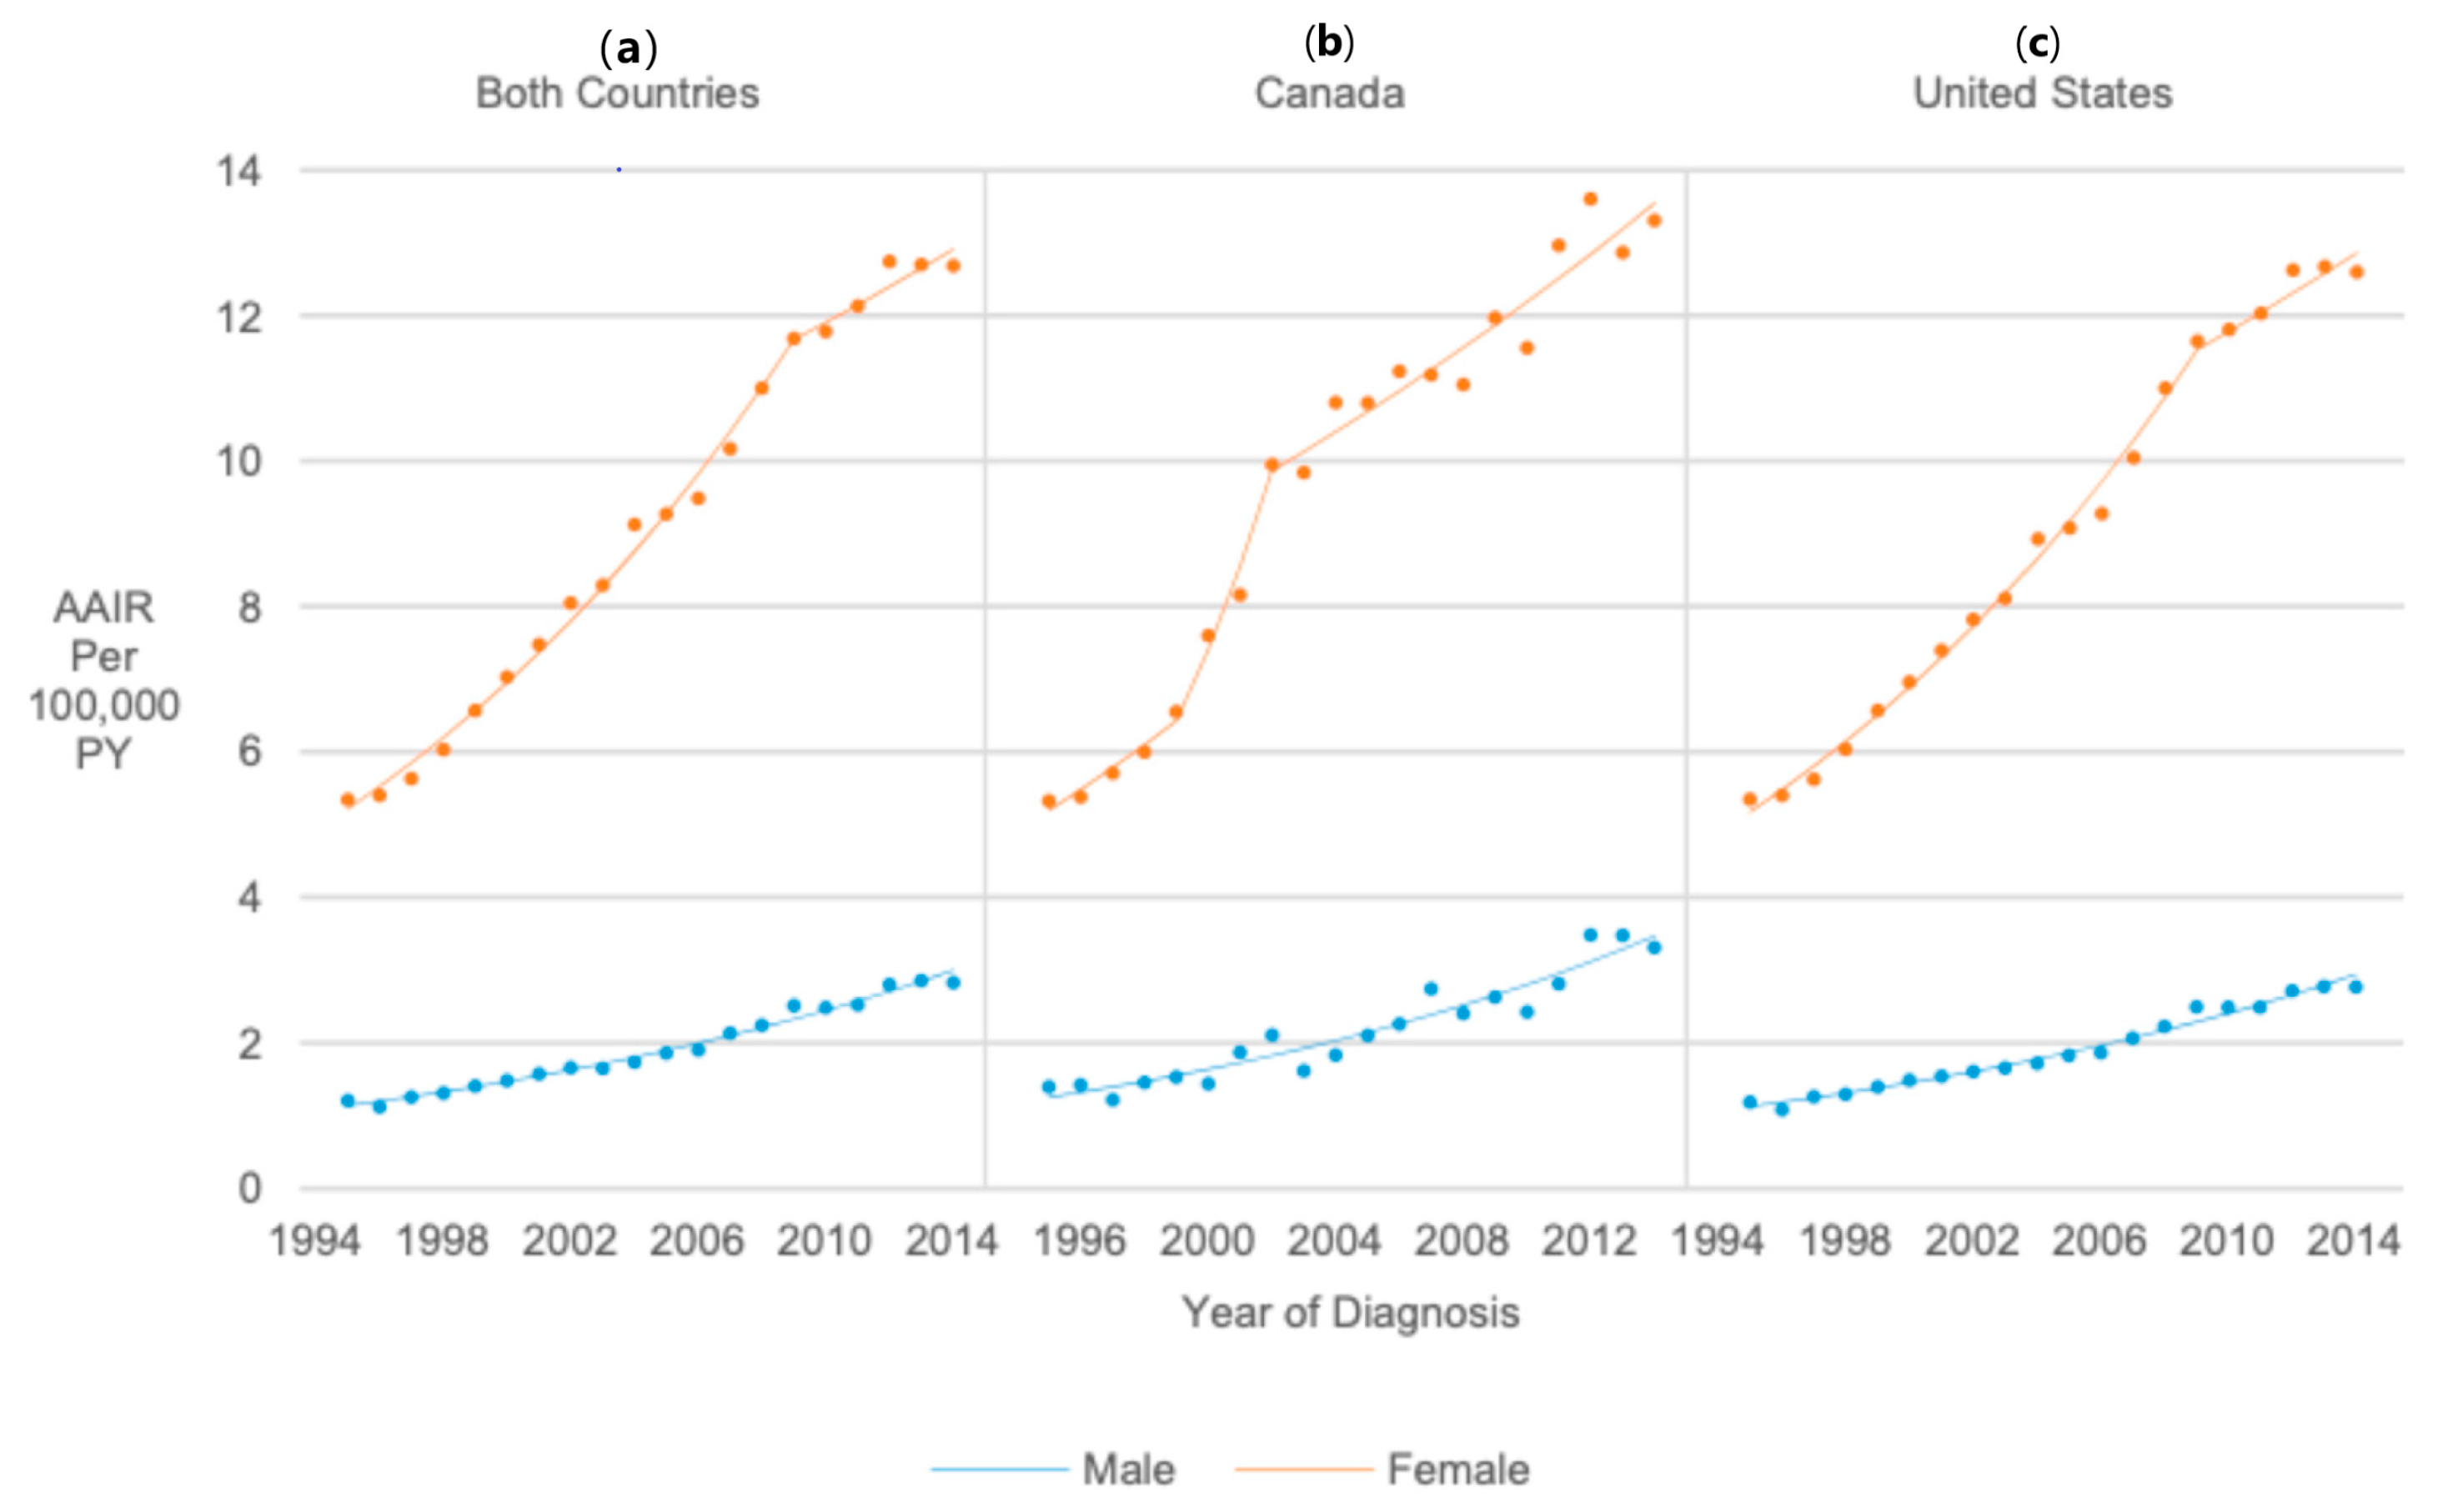
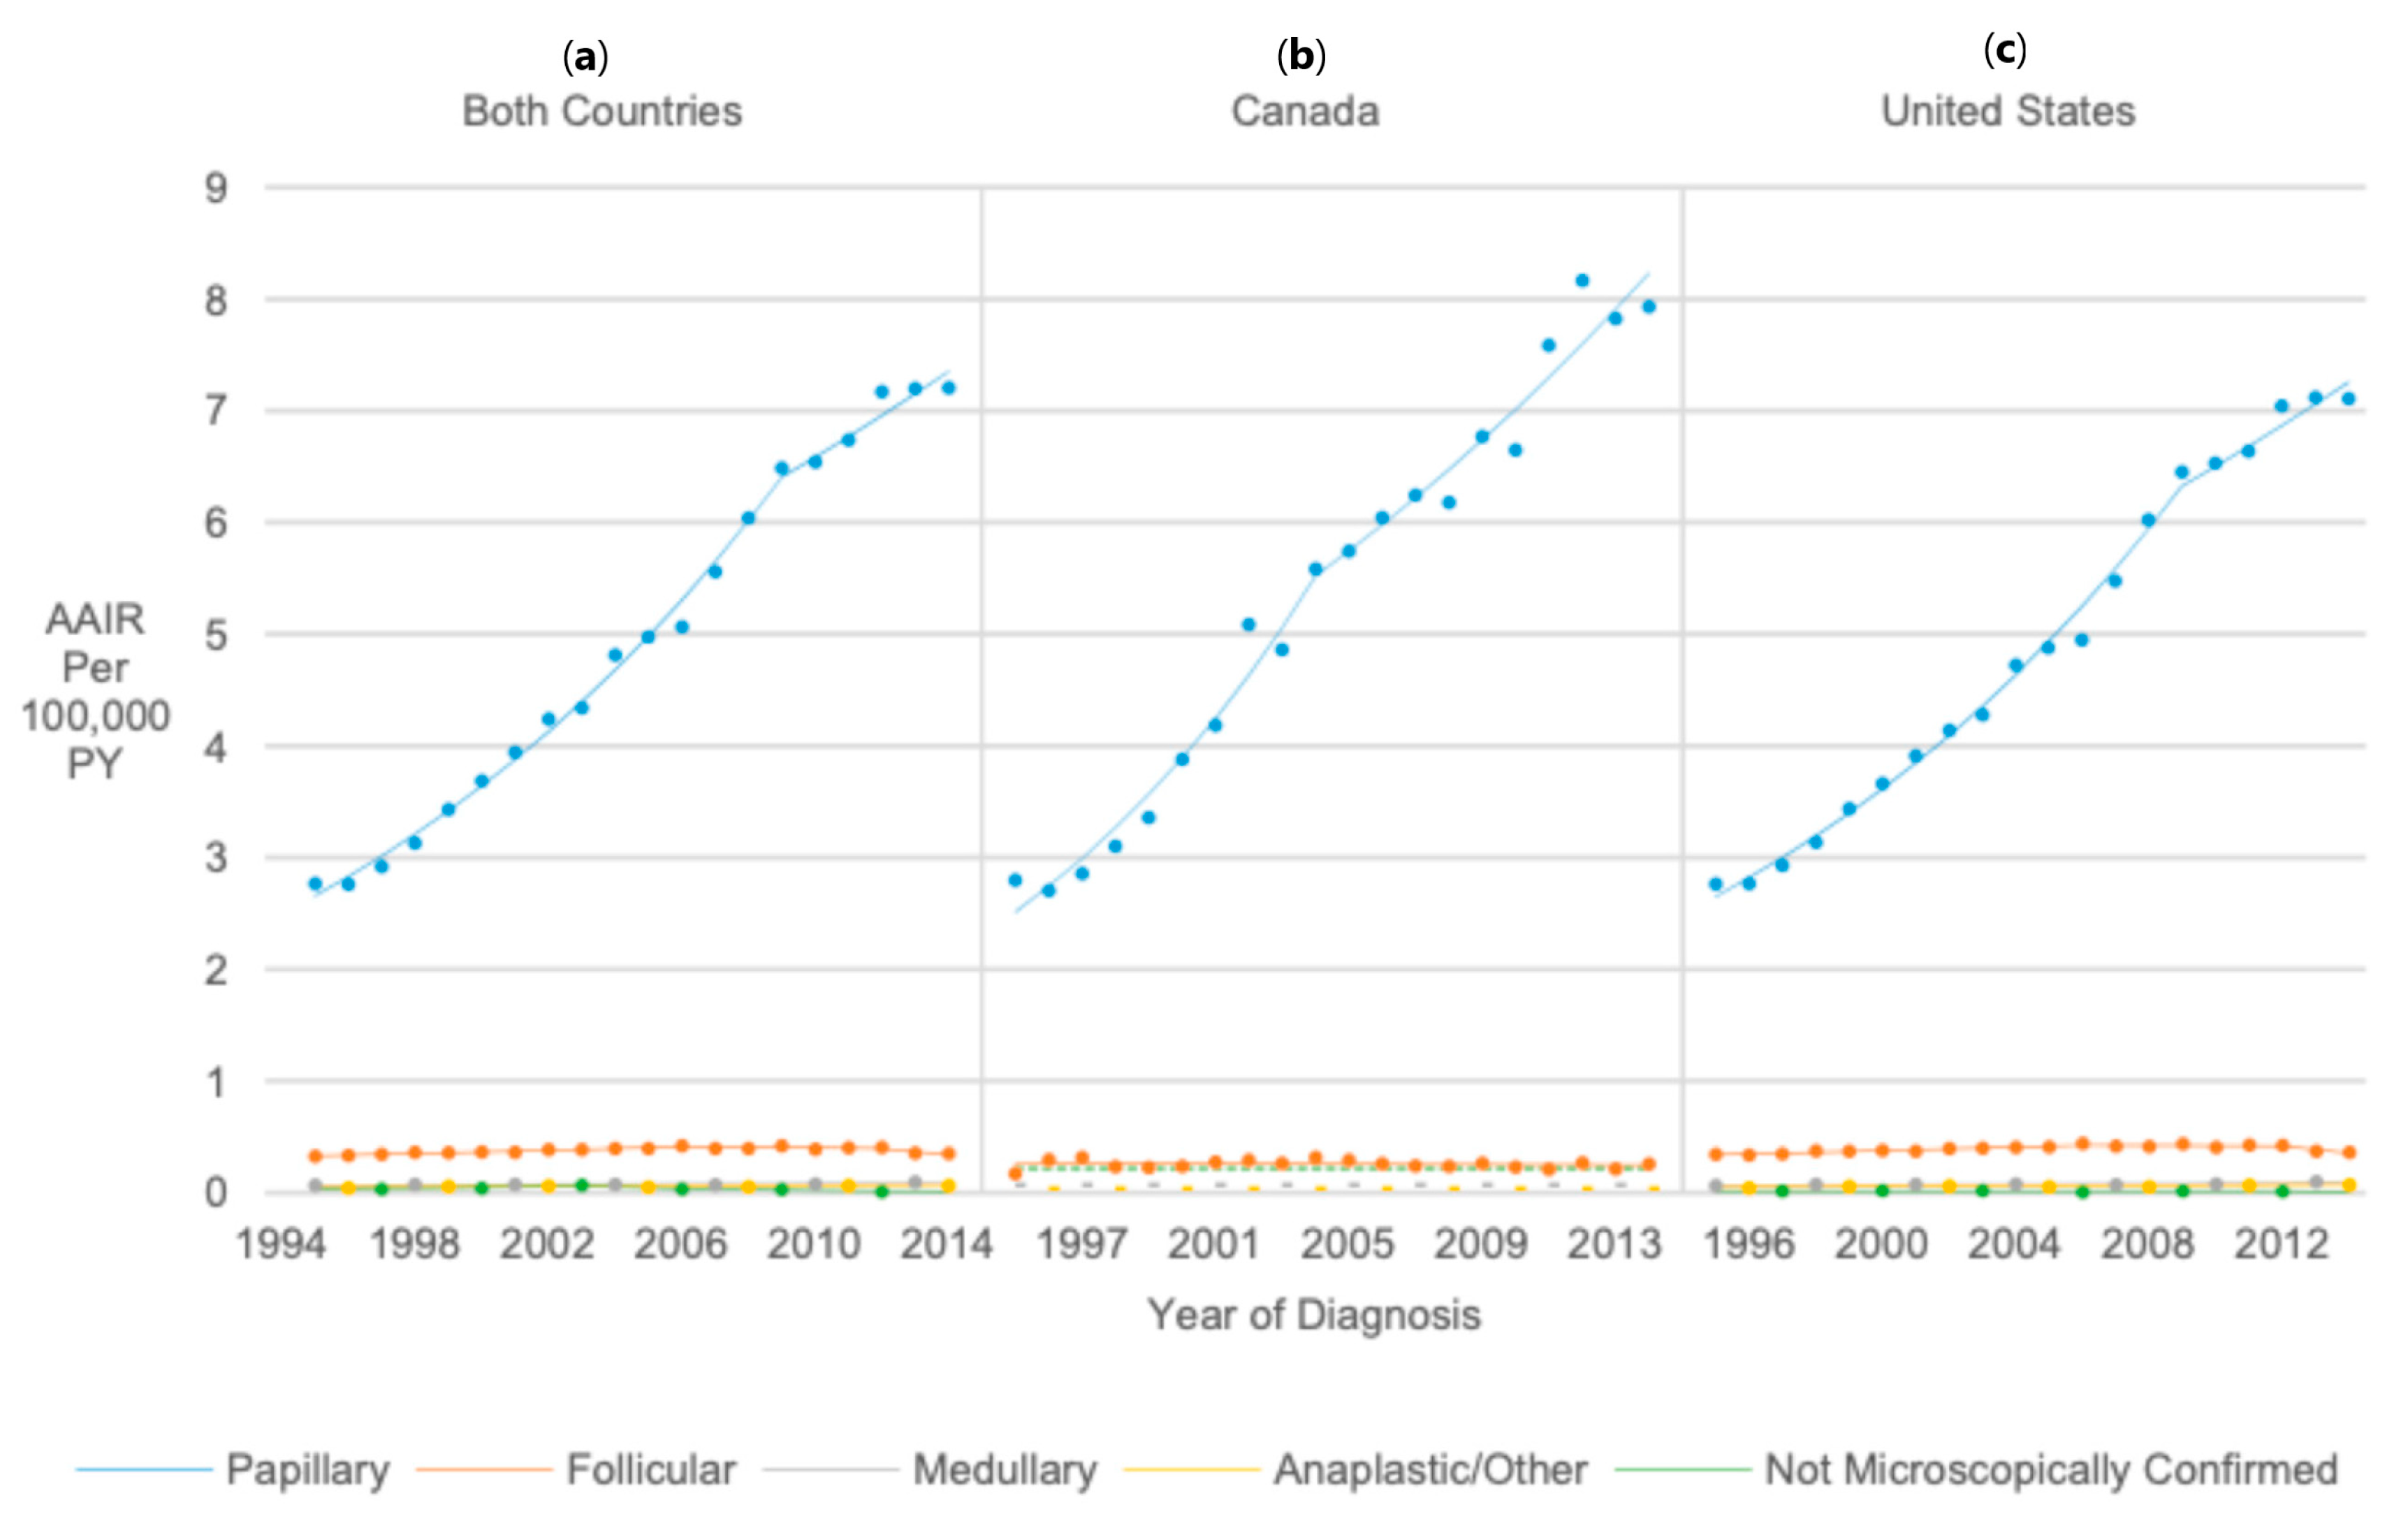
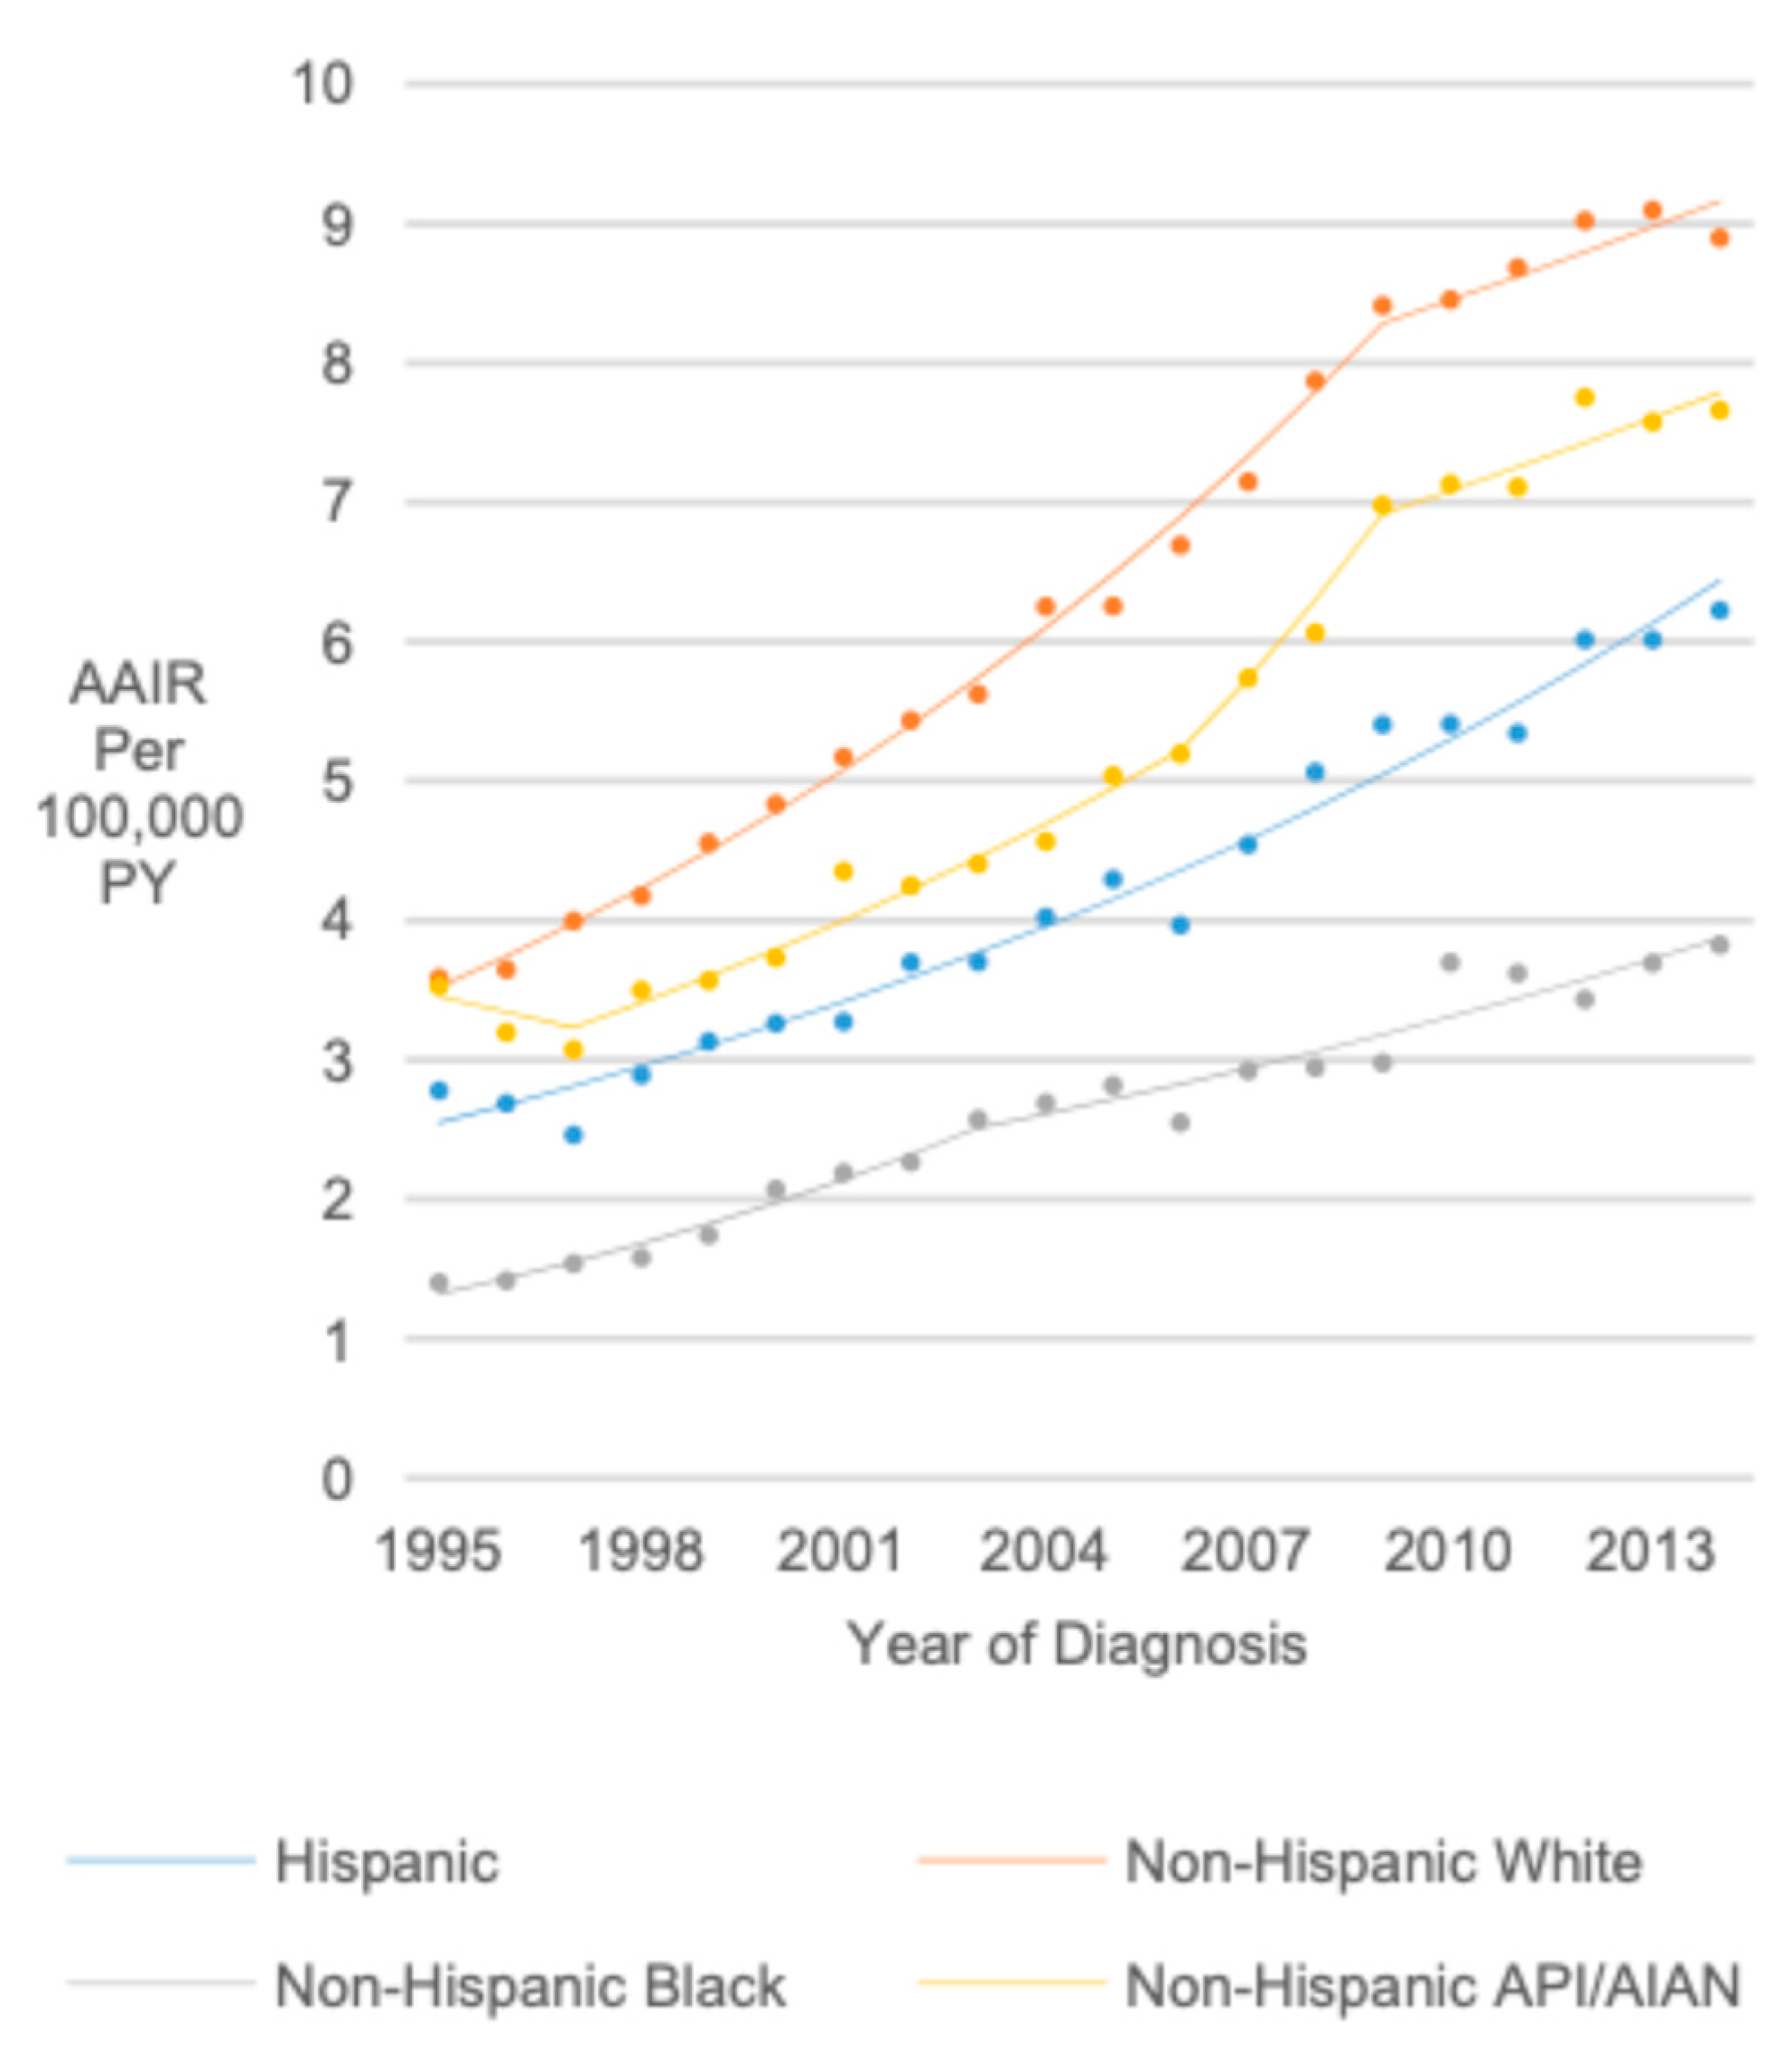

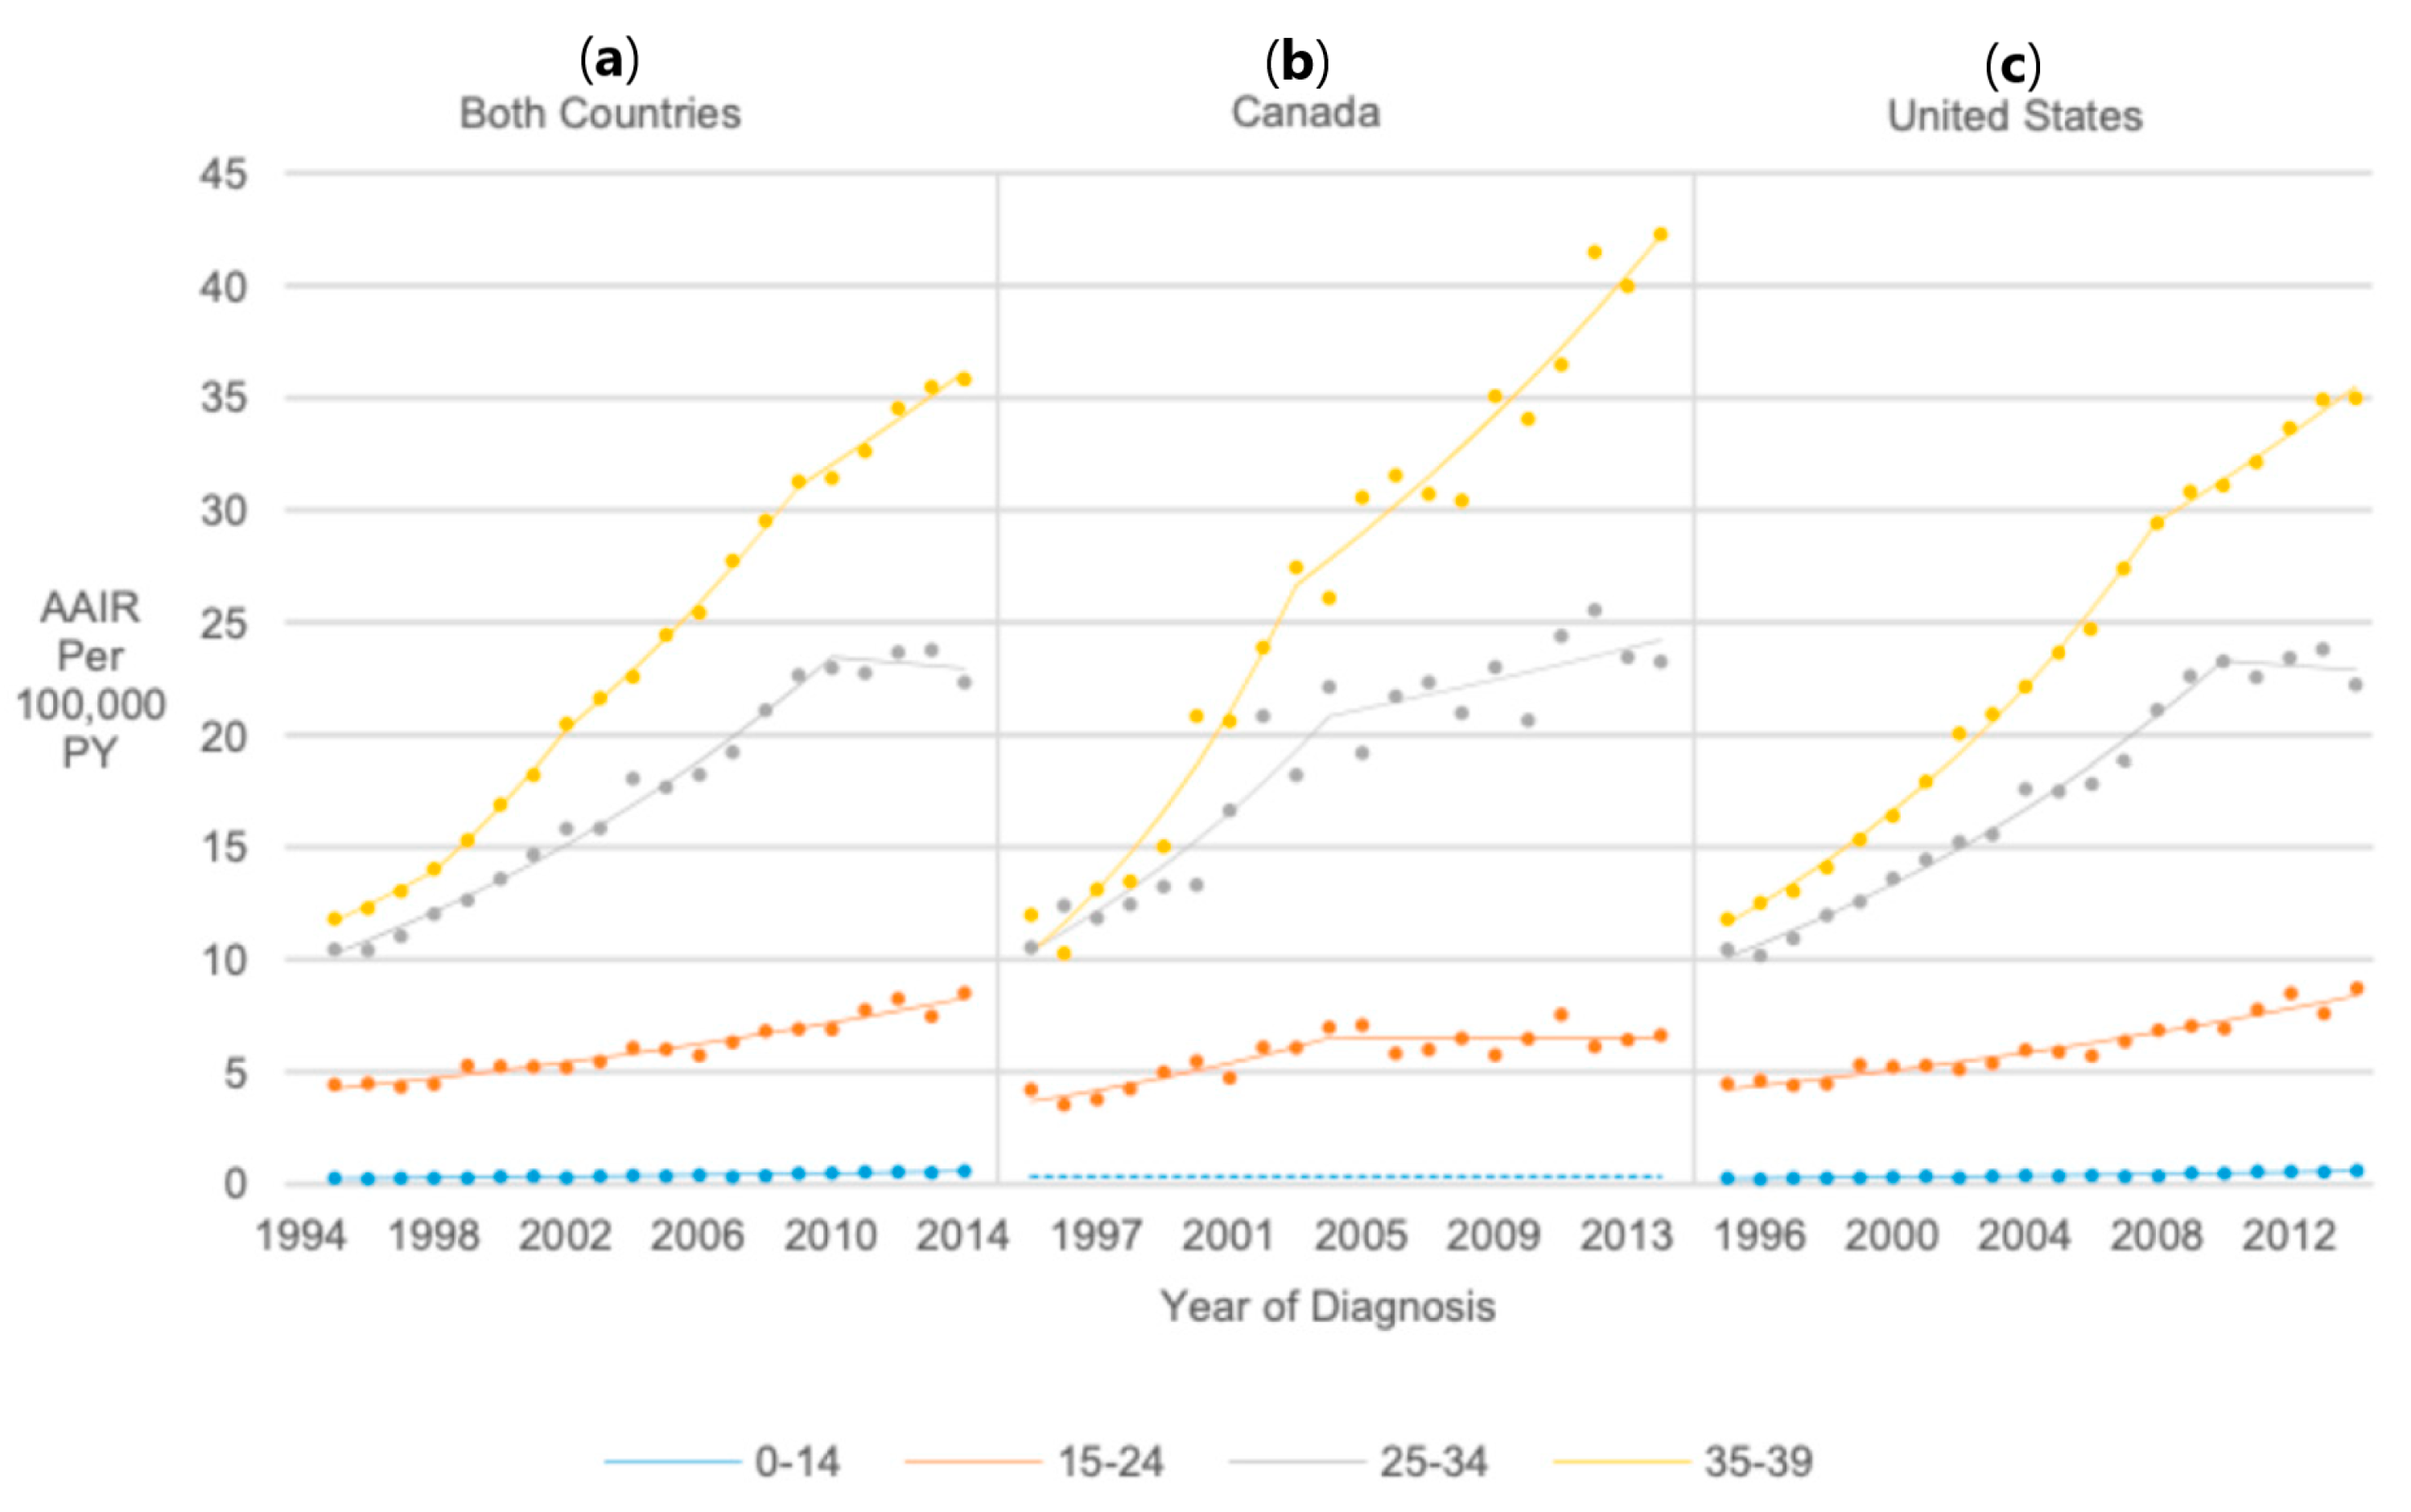
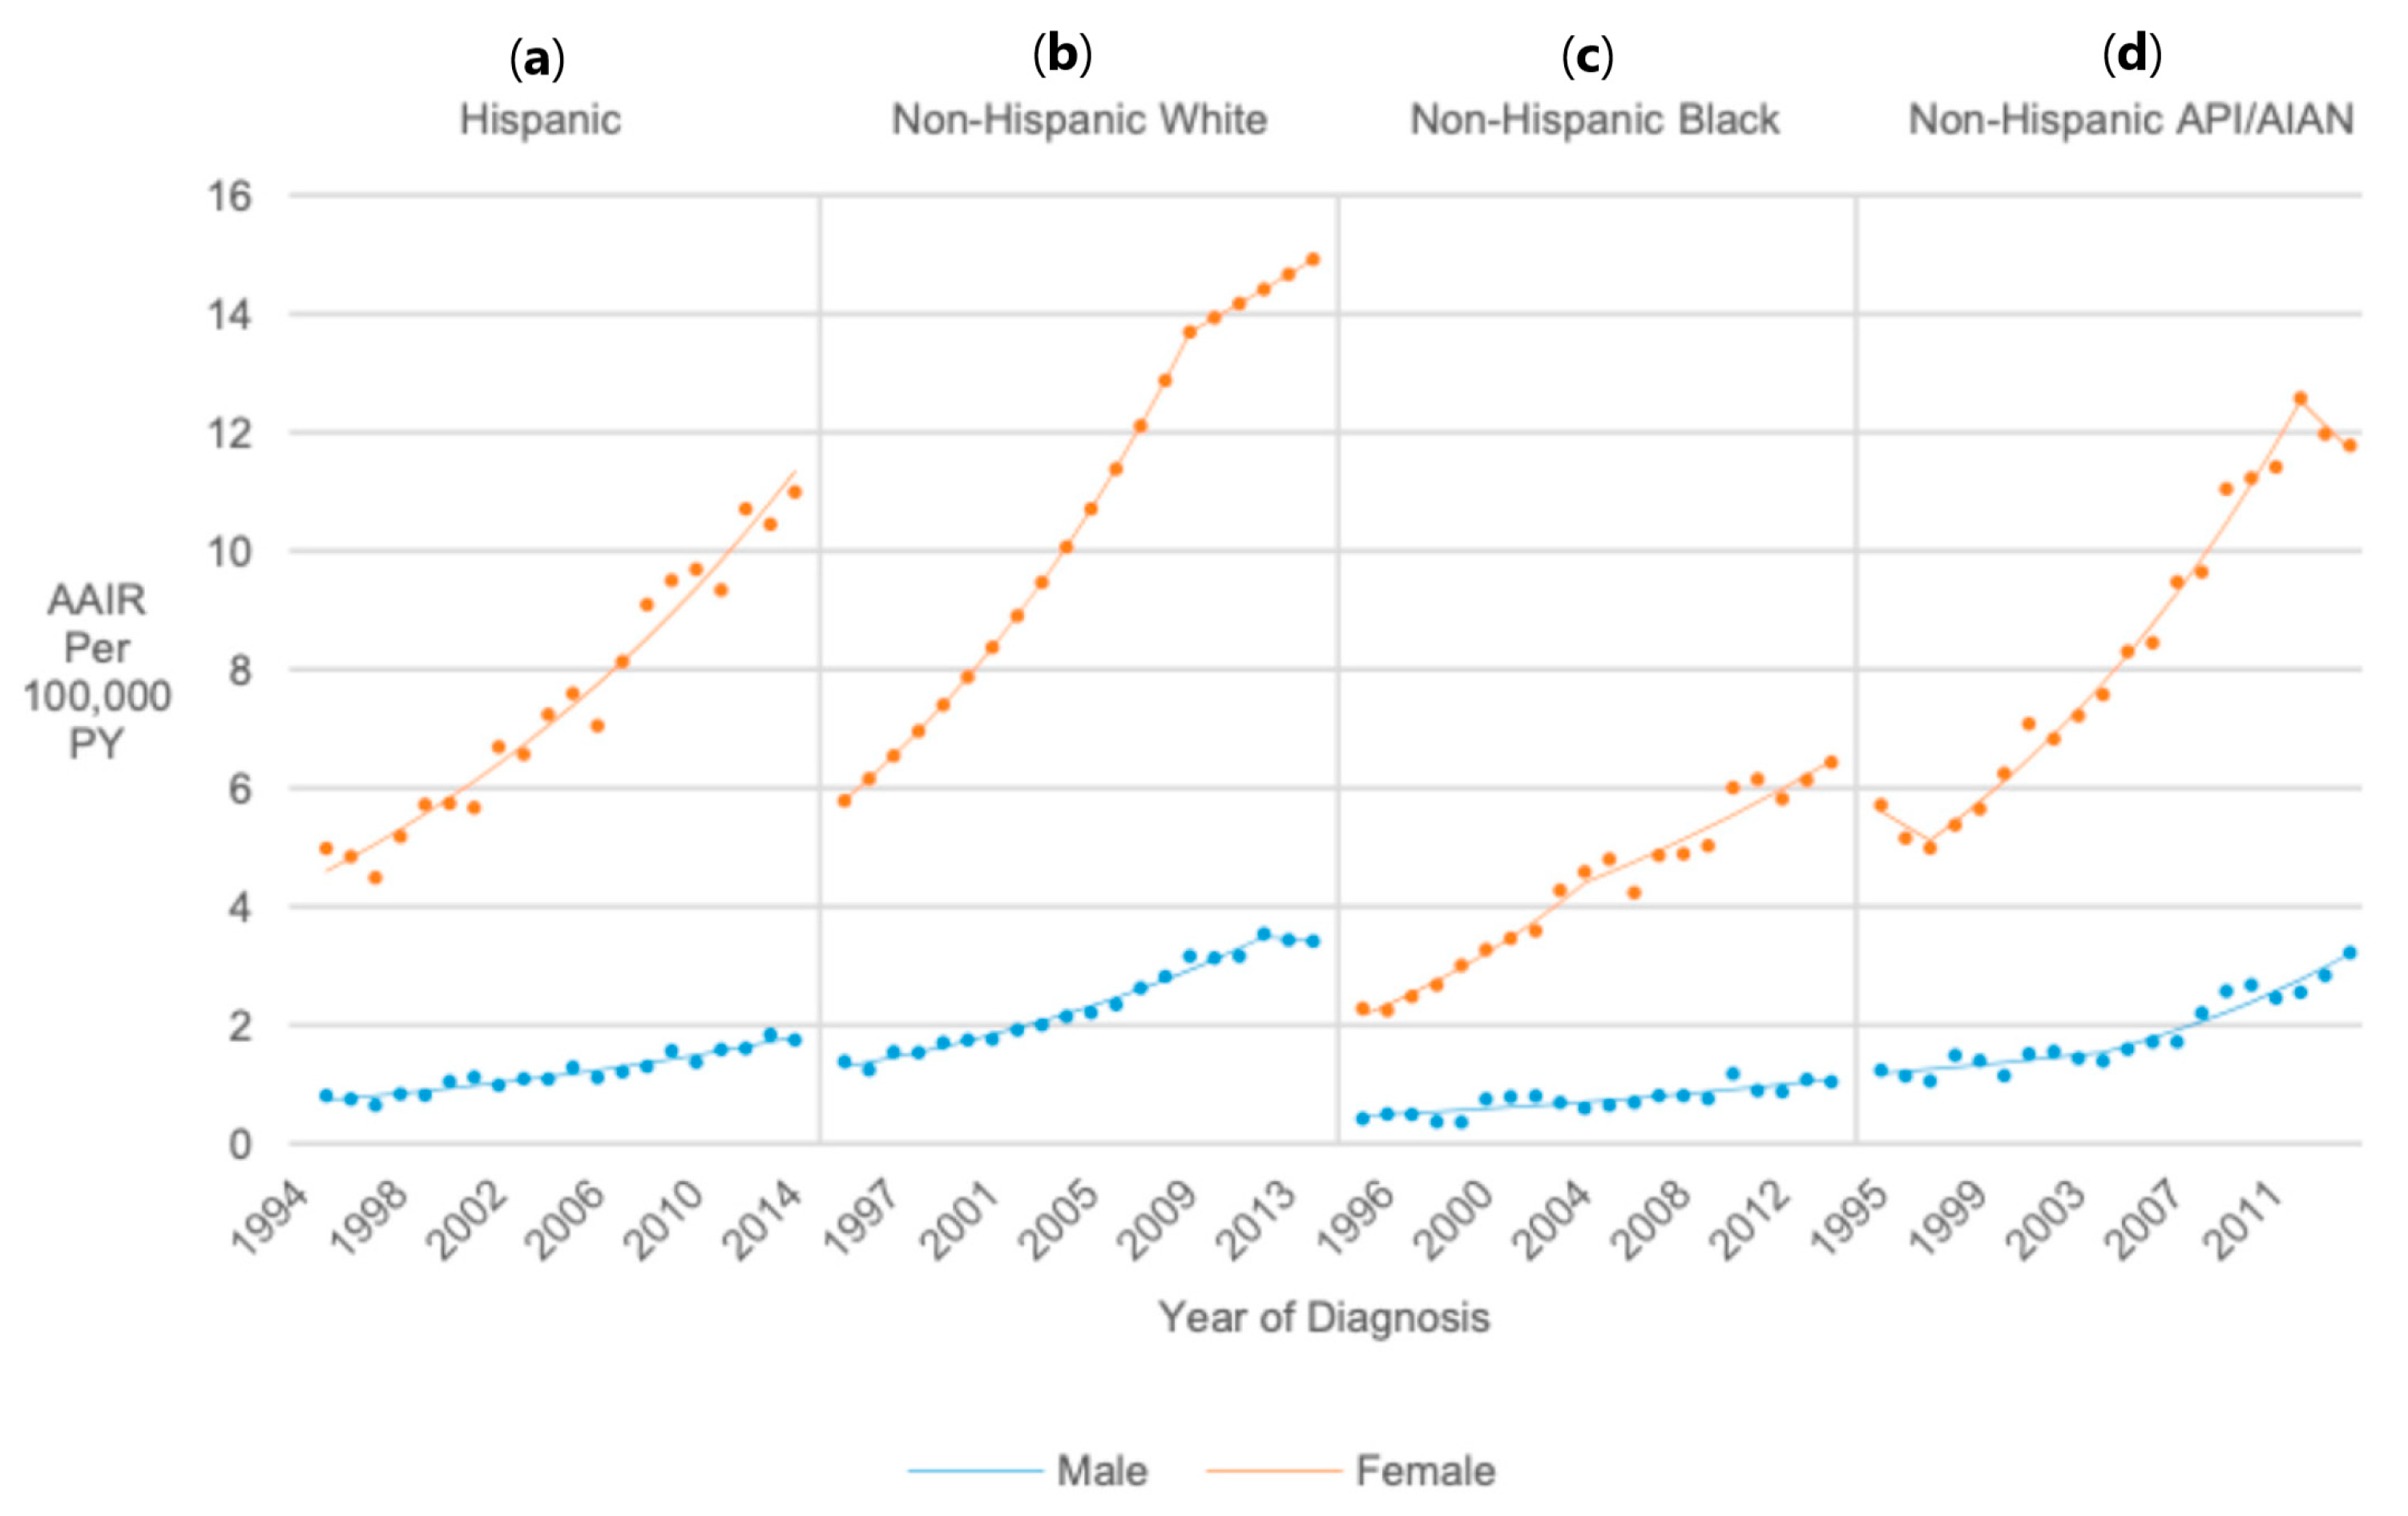
| Canada and United States Combined | Canada | United States | |||||||
|---|---|---|---|---|---|---|---|---|---|
| Count (%) | Age-Adjusted Incidence Rate per 100,000 Person-Years (95% Confidence Interval) | Rate Ratio (95% Confidence Interval) | Count (%) | Age-Adjusted Incidence Rate per 100,000 Person-Years (95% Confidence Interval) | Rate Ratio (95% Confidence Interval) | Count (%) | Age-Adjusted Incidence Rate per 100,000 Person-Years (95% Confidence Interval) | Rate Ratio (95% Confidence Interval) | |
| Overall | 133,808 | 5.48 (5.45, 5.51) | - | 15,492 | 5.94 (5.85, 6.04) | - | 118,316 | 5.42 (5.39, 5.45) | - |
| Age | |||||||||
| 0–14 | 2306 (1.7%) | 0.26 (0.25, 0.27) | Reference | 201 (1.3%) | 0.24 (0.20, 0.27) | Reference | 2105 (1.8%) | 0.26 (0.25, 0.27) | Reference |
| 15–24 | 22,036 (16.5%) | 3.55 (3.50, 3.59) | 13.73 (13.15, 14.34) | 2213 (14.3%) | 3.47 (3.33, 3.62) | 14.71 (12.72, 17.08) | 19,823 (16.8%) | 3.56 (3.51, 3.60) | 13.63 (13.03, 14.27) |
| 25–34 | 63,427 (47.4%) | 10.42 (10.34, 10.50) | 40.33 (38.69, 42.06) | 7377 (47.6%) | 11.37 (11.11, 11.64) | 48.23 (41.91, 55.76) | 56,050 (47.4%) | 10.30 (10.22, 10.39) | 39.51 (37.83, 41.29) |
| 35–39 | 46,039 (34.4%) | 14.38 (14.25, 14.51) | 55.66 (53.38, 58.06) | 5701 (36.8%) | 16.25 (15.83, 16.68) | 68.91 (59.85, 79.72) | 40,338 (34.1%) | 14.15 (14.01, 14.29) | 54.26 (51.93, 56.71) |
| Sex | |||||||||
| Male | 23,520 (17.6%) | 1.92 (1.89, 1.94) | Reference | 2830 (18.3%) | 2.17 (2.09, 2.25) | Reference | 20,690 (17.5%) | 1.89 (1.86, 1.92) | Reference |
| Female | 110,288 (82.4%) | 9.10 (9.04, 9.15) | 4.74 (4.67, 4.81) | 12,662 (81.7%) | 9.76 (9.59, 9.93) | 4.51 (4.32, 4.69) | 97,626 (82.5%) | 9.02 (8.96, 9.07) | 4.77 (4.70, 4.84) |
| Histology | |||||||||
| Papillary | 120,433 (90.0%) | 4.93 (4.90, 4.96) | Reference | 13,966 (90.1%) | 5.36 (5.27, 5.45) | Reference | 106,467 (90.0%) | 4.88 (4.85, 4.91) | Reference |
| Follicular | 9232 (6.9%) | 0.38 (0.37, 0.38) | 0.08 (0.07, 0.08) | 665 (4.3%) | 0.26 (0.24, 0.28) | 0.05 (0.04, 0.05) | 8567 (7.2%) | 0.39 (0.38, 0.40) | 0.08 (0.08, 0.08) |
| Medullary | 1802 (1.3%) | 0.07 (0.07, 0.08) | 0.02 (0.01, 0.02) | 183 (1.2%) | 0.07 (0.06, 0.08) | 0.01 (0.01, 0.02) | 1619 (1.4%) | 0.07 (0.07, 0.08) | 0.02 (0.01, 0.02) |
| Anaplastic/other | 1450 (1.1%) | 0.06 (0.06, 0.06) | 0.01 (0.01, 0.01) | 103 (0.7%) | 0.04 (0.03, 0.05) | 0.01 (0.01, 0.01) | 1347 (1.1%) | 0.06 (0.06, 0.07) | 0.01 (0.01, 0.01) |
| Non microscopically confirmed | 891 (0.7%) | 0.04 (0.03, 0.04) | 0.01 (0.01, 0.01) | 575 (3.7%) | 0.22 (0.20, 0.24) | 0.04 (0.04, 0.04) | 316 (0.3%) | 0.01 (0.01, 0.02) | 0.003 (0.003, 0.003) |
| Race/ethnicity | |||||||||
| Non-Hispanic White | - | 80,507 (68.0%) | 6.22 (6.18, 6.27) | Reference | |||||
| Hispanic | - | 20,767 (17.6%) | 4.38 (4.32, 4.44) | 0.70 (0.69, 0.71) | |||||
| Non-Hispanic Black | - | 6483 (5.5%) | 2.59 (2.52, 2.65) | 0.42 (0.41, 0.43) | |||||
| Non-Hispanic Other | - | 8733 (7.4%) | 5.43 (5.32, 5.55) | 0.87 (0.85, 0.89) | |||||
| Unknown | - | 1826 (1.5%) | - | - | |||||
| Both Countries | Canada | United States | |||||||
|---|---|---|---|---|---|---|---|---|---|
| Year Range | APC (95% CI) | 1995–2014 AAPC (95% CI) | Year Range | APC (95% CI) | 1995–2014 AAPC (95% CI) | Year Range | APC (95% CI) | 1995–2014 AAPC (95% CI) | |
| Overall | 1995–2009 | 5.87 (5.51, 6.24) | 4.95 (4.54, 5.36) | 1995–1998 | 2.69 (−5.40, 11.47) | 5.11 (3.21, 7.05) | 1995–2010 | 5.73 (5.41, 6.07) | 4.87 (4.43, 5.32) |
| 2009–2014 | 2.42 (1.11, 3.75) | - | 1998–2002 | 12.60 (4.82, 20.96) | 2010–2014 | 1.71 (−0.15, 3.60) | |||
| 2002–2014 | 3.32 (2.63, 4.02) | ||||||||
| Age | |||||||||
| 0–14 | 1995–2014 | 4.28 (3.36, 5.20) | 4.28 (3.36, 5.20) | 1995–2014 | Not calculated-insufficient data | - | 1995–2014 | 4.56 (3.58, 5.54) | 4.56 (3.58, 5.54) |
| 15–24 | 1995–2014 | 3.72 (3.34, 4.10) | 3.72 (3.34, 4.10) | 1995–2014 | 2.90 (1.87, 3.95) | 2.90 (1.87, 3.95) | 1995–2014 | 3.81 (3.38, 4.24) | 3.81 (3.38, 4.24) |
| 25–34 | 1995–2009 | 5.77 (5.30, 6.24) | 4.53 (4.01, 5.06) | 1995–2002 | 8.89 (4.92, 13.01) | 4.93 (3.40, 6.47) | 1995–2010 | 5.67 (5.22, 6.13) | 4.47 (3.86, 5.08) |
| 2009–2014 | 1.16 (−0.50, 2.85) | - | 2002–2014 | 2.68 (1.37, 4.01) | 2010–2014 | 0.08 (−2.43, 2.66) | |||
| 35–39 | 1995–1997 | 4.17 (−4.72, 13.89) | 5.99 (4.84, 7.15) | 1995–2003 | 11.35 (8.65, 14.12) | 7.61 (6.42, 8.81) | 1995–2009 | 7.13 (6.77, 7.48) | 5.91 (5.51, 6.30) |
| 1997–2002 | 9.06 (6.42, 11.77) | - | 2003–2014 | 4.97 (3.83, 6.12) | 2009–2014 | 2.56 (1.31, 3.83) | |||
| 2002–2009 | 6.41 (5.25, 7.57) | - | |||||||
| 2009–2014 | 3.15 (1.85, 4.47) | - | |||||||
| Sex | |||||||||
| Male | 1995–2014 | 5.22 (4.88, 5.55) | 5.22 (4.88, 5.55) | 1995–2014 | 5.50 (4.65, 6.35) | 5.50 (4.65, 6.35) | 1995–2014 | 5.17 (4.81, 5.53) | 5.17 (4.81, 5.53) |
| Female | 1995–2009 | 5.92 (5.53, 6.31) | 4.89 (4.45, 5.32) | 1995–1999 | 5.46 (0.54, 10.61) | 5.17 (3.03, 7.37) | 1995–2009 | 5.89 (5.54, 6.25) | 4.91 (4.51, 5.31) |
| 2009–2014 | 2.04 (0.65, 3.45) | - | 1999–2002 | 15.38 (1.50, 31.16) | 2009–2014 | 2.21 (0.94, 3.49) | |||
| 2002–2014 | 2.68 (2.04, 3.31) | ||||||||
| Histology | |||||||||
| Papillary | 1995–2009 | 6.49 (6.09, 6.89) | 5.50 (5.06, 5.94) | 1995–2004 | 9.13 (7.27, 11.02) | 6.44 (5.48, 7.41) | 1995–2009 | 6.41 (6.02, 6.80) | 5.44 (5.02, 5.87) |
| 2009–2014 | 2.78 (1.40, 4.19) | 2004–2014 | 4.08 (2.97, 5.20) | 2009–2014 | 2.78 (1.43, 4.15) | ||||
| Follicular | 1995–2006 | 2.00 (1.52, 2.49) | 0.21 (−0.62, 1.05) | 1995–2014 | −0.45 (−1.66, 0.77) | −0.45 (−1.66, 0.77) | 1995–2006 | 2.06 (1.51, 2.62) | 0.23 (−0.72, 1.18) |
| 2006–2012 | −0.55 (−2.03, 0.96) | 2006–2012 | −0.31 (−2.00, 1.41) | ||||||
| 2012–2014 | −7.00 (−13.33, −0.21) | 2012–2014 | −7.81 (−14.95, −0.06) | ||||||
| Medullary | 1995–2014 | 1.16 (0.47, 1.85) | 1.16 (0.47, 1.85) | 1995–2014 | Not calculated-insufficient data | - | 1995–2014 | 1.21 (0.49, 1.94) | 1.21 (0.49, 1.94) |
| Anaplastic/Other | 1995–2014 | 1.94 (0.68, 3.22) | 1.94 (0.68, 3.22) | 1995–2014 | Not calculated-insufficient data | - | 1995–2014 | 2.15 (0.89, 3.42) | 2.15 (0.89, 3.42) |
| Not microscopically confirmed | 1995–2003 | 6.62 (0.45, 13.18) | −5.60 (−8.97, −2.11) | 1995–2014 | Not calculated-insufficient data | - | 1995–2014 | −1.07 (−3.08, 0.97) | −1.07 (−3.08, 0.97) |
| 2003–2014 | −13.60 (−18.03, −8.92) | ||||||||
| Race/Ethnicity | |||||||||
| Hispanic | - | - | 1995–2014 | 4.99 (4.56, 5.43) | 4.99 (4.56, 5.43) | ||||
| Non-Hispanic White | - | - | 1995–2009 | 6.30 (5.96, 6.64) | 5.16 (4.77, 5.55) | ||||
| 2009–2014 | 2.03 (0.77, 3.30) | ||||||||
| Non-Hispanic Black | - | - | 1995–2003 | 8.36 (5.89, 10.88) | 5.81 (4.70, 6.94) | ||||
| 2003–2014 | 4.00 (2.88, 5.13) | ||||||||
| Non-Hispanic API/AIAN | - | - | 1995–1997 | −3.29 (−17.08, 12.79) | 4.37 (2.22, 6.56) | ||||
| 1997–2006 | 5.47 (4.00, 6.96) | ||||||||
| 2006–2009 | 9.83 (−0.51, 21.25) | ||||||||
| 2009–2014 | 2.40 (0.46, 4.37) | ||||||||
| Sex/Age | |||||||||
| Male 0–14 | 1995–2014 | 3.52 (1.72, 5.34) | 3.52 (1.72, 5.34) | 1995–2014 | Not calculated-insufficient data | - | 1995–2014 | 3.94 (2.10, 5.81) | 3.94 (2.10, 5.81) |
| Male 15–24 | 1995–2014 | 4.40 (3.58, 5.22) | 4.40 (3.58, 5.22) | 1995–2014 | 4.10 (1.85, 6.40) | 4.10 (1.85, 6.40) | 1995–2014 | 4.43 (3.56, 5.30) | 4.43 (3.56, 5.30) |
| Male 25–34 | 1995–2014 | 4.94 (4.50, 5.38) | 4.94 (4.50, 5.38) | 1995–2014 | 4.78 (3.42, 6.17) | 4.78 (3.42, 6.17) | 1995–2014 | 4.94 (4.43, 5.45) | 4.94 (4.43, 5.45) |
| Male 35–39 | 1995–2012 | 6.40 (5.85, 6.95) | 5.50 (4.25, 6.77) | 1995–2014 | 7.09 (5.95, 8.24) | 7.09 (5.95, 8.24) | 1995–2012 | 6.27 (5.71, 6.84) | 5.28 (3.97, 6.61) |
| 2012–2014 | −1.84 (−12.54, 10.18) | 2012–2014 | −2.79 (−13.89, 9.74) | ||||||
| Female 0–14 | 1995–2014 | 4.60 (3.76, 5.45) | 4.60 (3.76, 5.45) | 1995–2014 | Not calculated-insufficient data | 1995–2014 | 4.80 (3.95, 5.66) | 4.80 (3.95, 5.66) | |
| Female 15–24 | 1995–2014 | 3.59 (3.17, 4.00) | 3.59 (3.17, 4.00) | 1995–2004 | 6.54 (3.48, 9.69) | 3.03 (1.40, 4.69) | 1995–2014 | 3.69 (3.23, 4.15) | 3.69 (3.23, 4.15) |
| 2004–2014 | −0.03 (−2.01, 1.98) | ||||||||
| Female 25–34 | 1995–2010 | 5.66 (5.19, 6.14) | 4.32 (3.69, 4.96) | 1995–2004 | 8.03 (5.39, 10.73) | 4.55 (3.15, 5.97) | 1995–2010 | 5.73 (5.25, 6.21) | 4.40 (3.75, 5.05) |
| 2010–2014 | −0.54 (−3.16, 2.14) | 2004–2014 | 1.52 (−0.18, 3.24) | 2010–2014 | −0.46 (−3.12, 2.27) | ||||
| Female 35–39 | 1995–1998 | 5.98 (2.87, 9.18) | 6.12 (5.39, 6.86) | 1995–2003 | 12.61 (9.59, 15.71) | 7.70 (6.38, 9.03) | 1995–2008 | 7.44 (7.08, 7.80) | 6.07 (5.73, 6.40) |
| 1998–2002 | 9.81 (7.02, 12.67) | 2003–2014 | 4.26 (3.04, 5.51) | 2008–2014 | 3.16 (2.32, 4.00) | ||||
| 2002–2009 | 6.30 (5.53, 7.08) | ||||||||
| 2009–2014 | 3.09 (2.21, 3.98) | ||||||||
| Race/Sex | |||||||||
| Hispanic Male | - | - | 1995–2014 | 4.81 (4.09, 5.54) | 4.81 (4.09, 5.54) | ||||
| Hispanic Female | - | - | 1995–2014 | 4.86 (4.40, 5.34) | 4.86 (4.40, 5.34) | ||||
| Non-Hispanic White Male | - | - | 1995–2012 | 5.99 (5.46, 6.52) | 5.22 (3.96, 6.49) | ||||
| 2012–2014 | −1.13 (−12.05, 11.14) | ||||||||
| Non-Hispanic White Female | - | - | 1995–2009 | 6.34 (5.99, 6.69) | 5.11 (4.71, 5.51) | ||||
| 2009–2014 | 1.73 (0.43, 3.04) | ||||||||
| Non-Hispanic Black Male | - | - | 1995–2014 | 4.49 (2.96, 6.05) | 4.49 (2.96, 6.05) | ||||
| Non-Hispanic Black Female | - | - | 1995–2004 | 8.19 (6.29, 10.13) | 5.92 (4.91, 6.94) | ||||
| 2004–2014 | 3.92 (2.72, 5.13) | ||||||||
| Non-Hispanic API/AIAN Male | - | - | 1995–2004 | 2.94 (−0.56, 6.57) | 5.36 (3.48, 7.28) | ||||
| 2004–2014 | 7.59 (5.43, 9.80) | ||||||||
| Non-Hispanic API/AIAN Female | - | - | 1995–1997 | −4.53 (−18.25, 11.49) | 3.94 (2.18, 5.74) | ||||
| 1997–2012 | 6.15 (5.58, 6.72) | ||||||||
| 2012–2014 | −3.31 (−11.12, 5.19) | ||||||||
Disclaimer/Publisher’s Note: The statements, opinions and data contained in all publications are solely those of the individual author(s) and contributor(s) and not of MDPI and/or the editor(s). MDPI and/or the editor(s) disclaim responsibility for any injury to people or property resulting from any ideas, methods, instructions or products referred to in the content. |
© 2025 by the authors. Licensee MDPI, Basel, Switzerland. This article is an open access article distributed under the terms and conditions of the Creative Commons Attribution (CC BY) license (https://creativecommons.org/licenses/by/4.0/).
Share and Cite
Gao, M.Z.; Omer, T.M.; Miller, K.M.; Simpson, M.C.; Bukatko, A.R.; Gedion, K.; Adjei Boakye, E.; Kost, K.M.; Dickinson, J.A.; Varvares, M.A.; et al. Thyroid Cancer Incidence and Trends in United States and Canadian Pediatric, Adolescent, and Young Adults. Cancers 2025, 17, 1429. https://doi.org/10.3390/cancers17091429
Gao MZ, Omer TM, Miller KM, Simpson MC, Bukatko AR, Gedion K, Adjei Boakye E, Kost KM, Dickinson JA, Varvares MA, et al. Thyroid Cancer Incidence and Trends in United States and Canadian Pediatric, Adolescent, and Young Adults. Cancers. 2025; 17(9):1429. https://doi.org/10.3390/cancers17091429
Chicago/Turabian StyleGao, May Z., Tariq M. Omer, Katherine M. Miller, Matthew C. Simpson, Aleksandr R. Bukatko, Kalipa Gedion, Eric Adjei Boakye, Karen M. Kost, James A. Dickinson, Mark A. Varvares, and et al. 2025. "Thyroid Cancer Incidence and Trends in United States and Canadian Pediatric, Adolescent, and Young Adults" Cancers 17, no. 9: 1429. https://doi.org/10.3390/cancers17091429
APA StyleGao, M. Z., Omer, T. M., Miller, K. M., Simpson, M. C., Bukatko, A. R., Gedion, K., Adjei Boakye, E., Kost, K. M., Dickinson, J. A., Varvares, M. A., & Osazuwa-Peters, N. (2025). Thyroid Cancer Incidence and Trends in United States and Canadian Pediatric, Adolescent, and Young Adults. Cancers, 17(9), 1429. https://doi.org/10.3390/cancers17091429


