
Understanding the Impact of Deep Learning Model Parameters on Breast Cancer Histopathological Classification Using ANOVA

 ,
,  ,
,  and
and
Simple Summary
Abstract
1. Introduction
2. Materials and Methodology
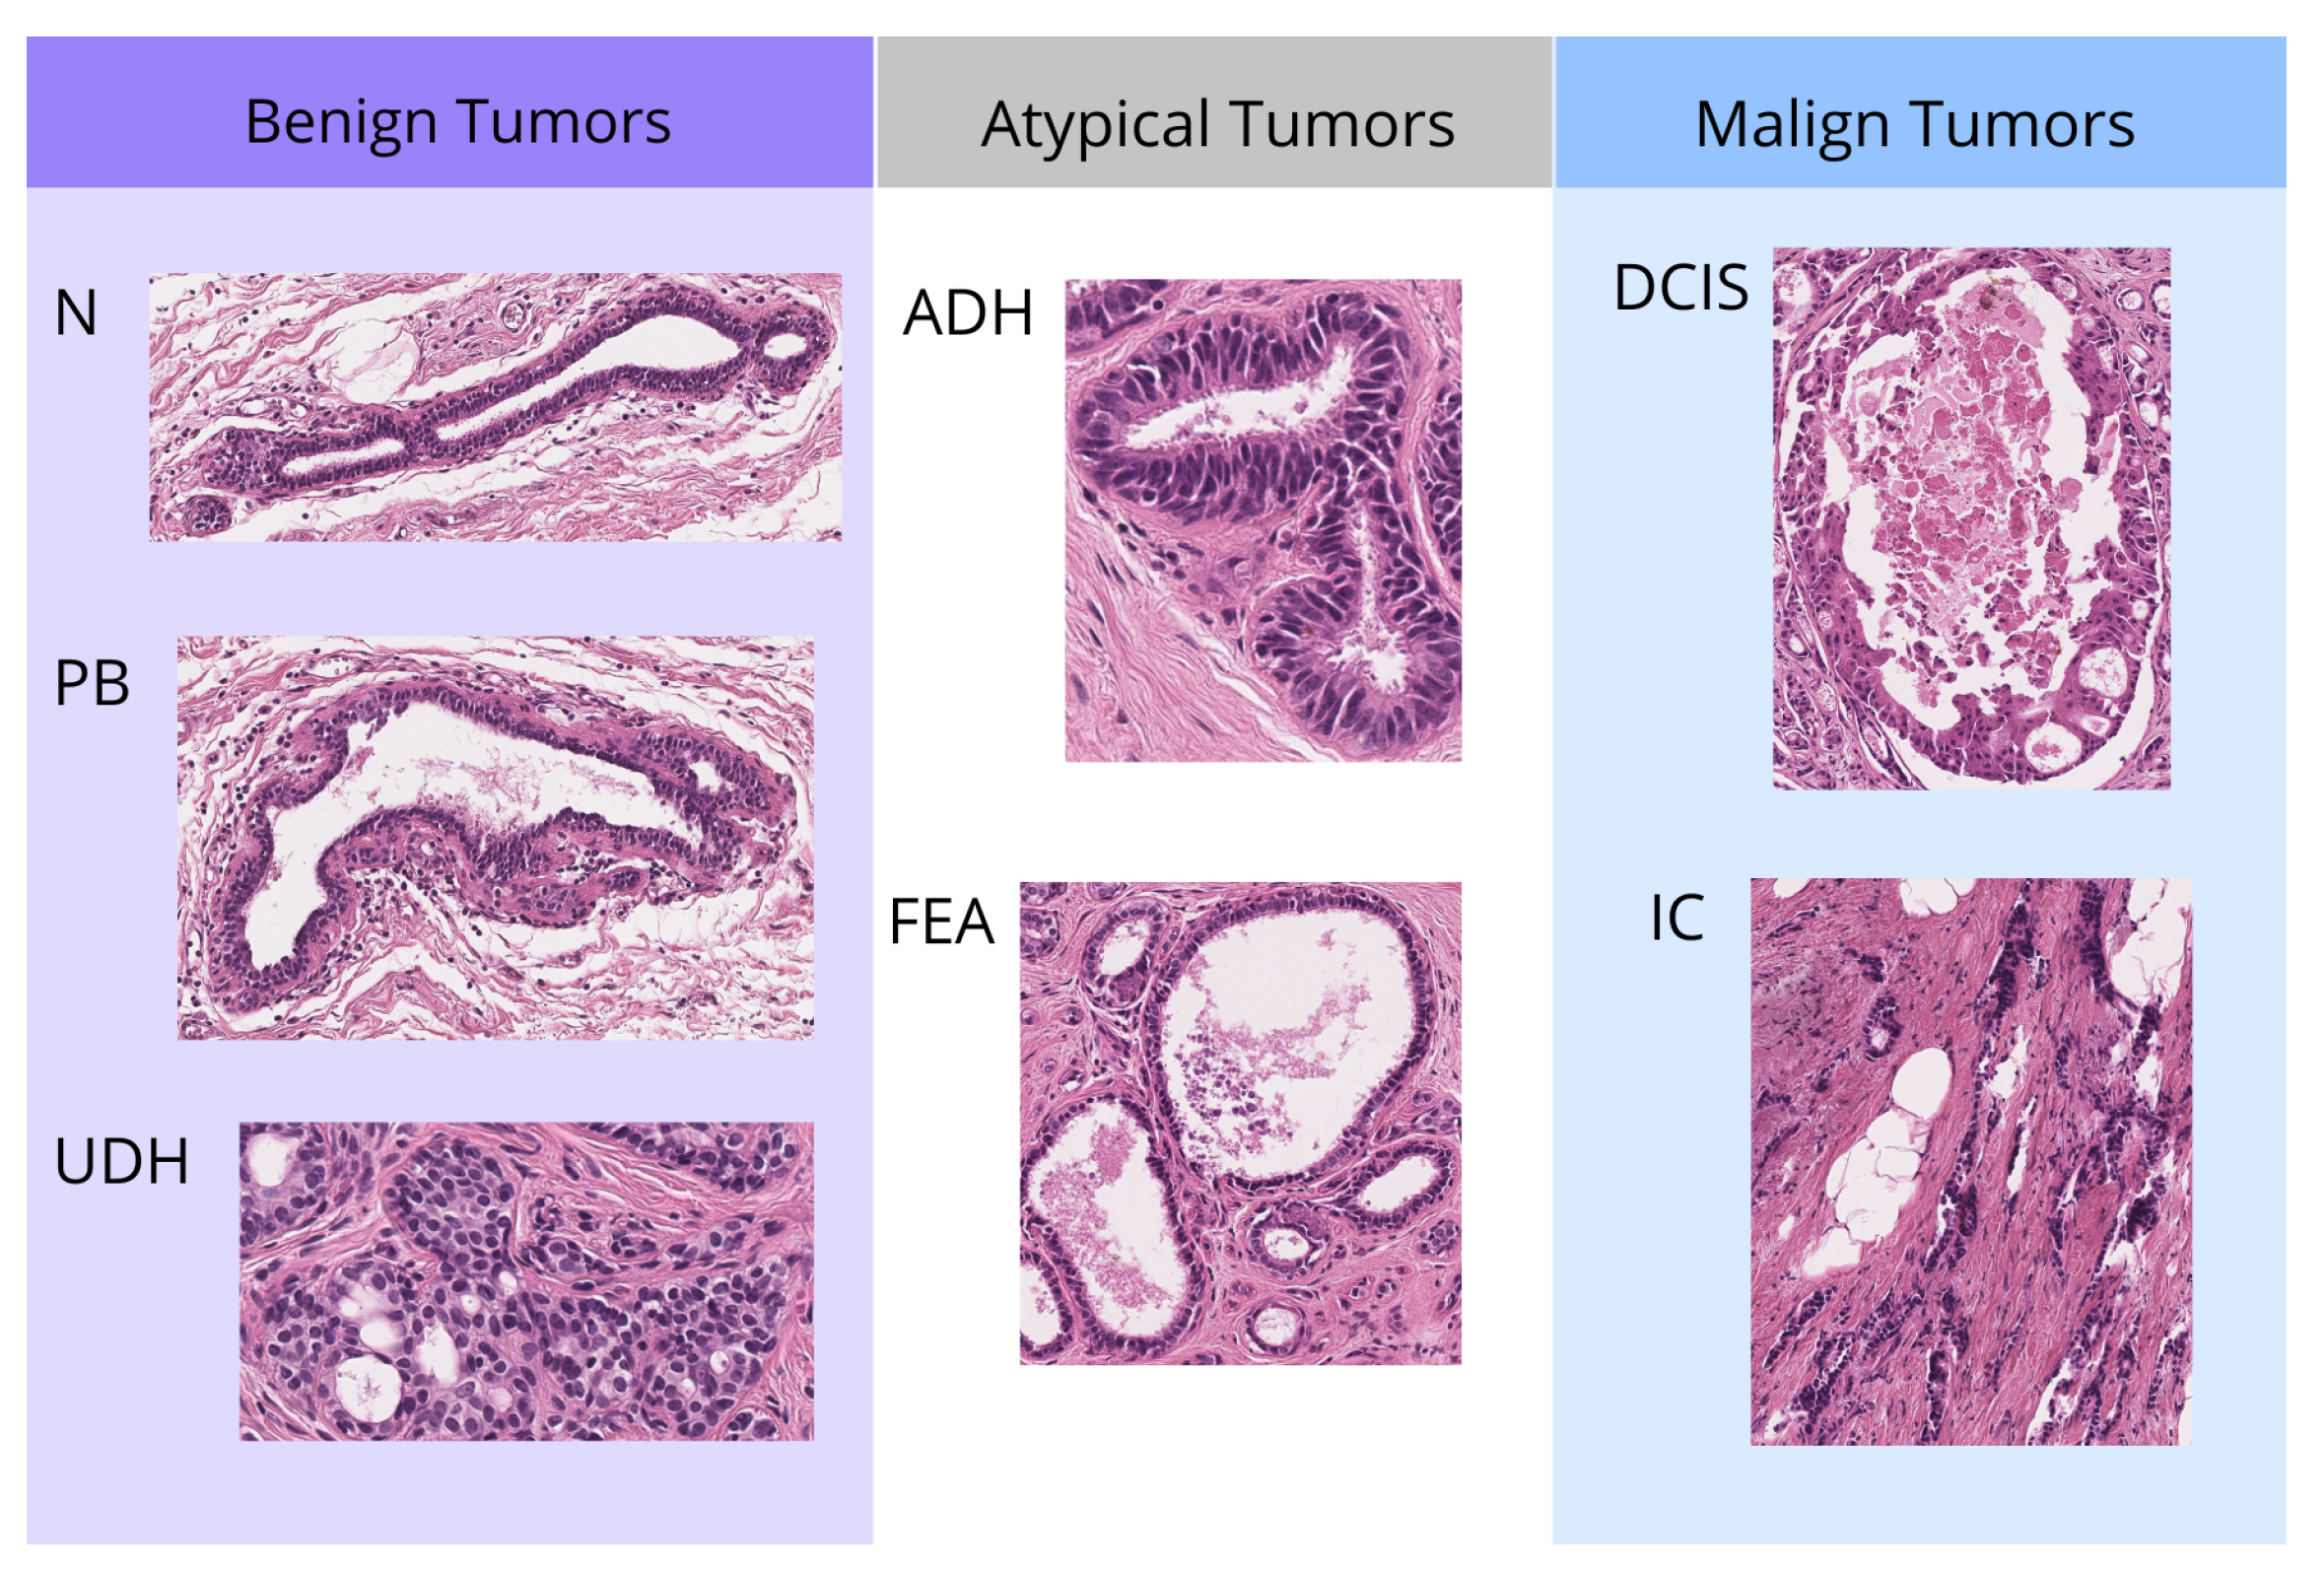
2.1. Data Resource
2.2. Model
2.3. Statistic Analysis
2.3.1. Factor and Level Definitions
- Weight decay: regularization during training that penalizes large weights in the model.
Weight Decay (Wd) Level 0.1 0.0 - Layers: the number of layers in the MLP classifier.
Hidden Layers (Ly) Level Neurons 3 256, 128, 64 2 128, 64 1 64 - Dropout: percentage of neurons randomly deactivated in these layers to avoid overfitting. Initially, the dropout rates of the first, second, and third neural network layers were included as independent factors in the analysis. However, statistical evaluation revealed that their effects on the outcome variables were not significantly different, indicating analogous behavior across the three layers. To reduce model complexity and avoid redundancy, only the dropout rate of the first layer was retained as a representative factor in the final analysis.
Dropout (Dp) Level 0.2 0.5 0.8 - Number of top instances: is the number of top patches that are finally used for classification. We divide the images into small fragments or patches of a certain size and train the models with these. This particular model is able to identify the most discriminative or distinctive patches between classes and only uses a certain number for the classification of the whole image.
N Top (Nt) Level 5 10 20 40 - Number of bottom instances: is the number of bottom patches that are finally used for classification. After the MinMax layer, the patches at the bottom will have the lowest class activation score. These patches will represent what we call “negative evidence”. This term refers to the inclusion of information that indicates the absence of a specific class in an instance or region, as opposed to only considering the presence of positive classes.
N Bottom (Nb) Level 0 5 10 20
2.3.2. Outcome Selection
- F1-score: is the harmonic mean of precision and recall. Precision measures the proportion of true positives among all instances that the model has labeled as positive. Recall measures the proportion of true positives among all instances that are actually positive. F1-score is a useful metric when a balance between these two aspects is desired and is especially valuable in scenarios with unbalanced classes. Accuracy can be high even if the model does not detect minority classes well. Therefore, the F1 score will help to better assess how the model is performing in those less frequent classes.
- AUC-ROC (“Area Under the Curve” of the “Receiver Operating Characteristic”): in a multiclass classification problem, the One-vs-Rest (OvR) technique evaluates the model’s performance for each class individually. This technique generates an ROC curve for each class, treating it as the positive class and grouping the other classes as negative. The AUC value, which is the area under this curve, measures the model’s ability to distinguish between classes. An AUC value close to 1 indicates excellent performance, while a value close to 0.5 suggests performance similar to chance. The average of the AUC values across all classes provides an overall measure of the model’s performance in multiclass classification.
- Execution Time: measures the total time the model takes to perform the training. It indicates the efficiency of the model in terms of computational resources and time.
2.3.3. Model Training and Data Collection
2.3.4. Assumption Validation and Outlier Detection
2.3.5. ANOVA Analysis
- Null hypothesis (): The means of the accuracies for the different parameter values are equal.
- Alternative Hypothesis (): At least one of the means of the accuracies is different.
3. Results and Discussion
3.1. Model Assumption Validation
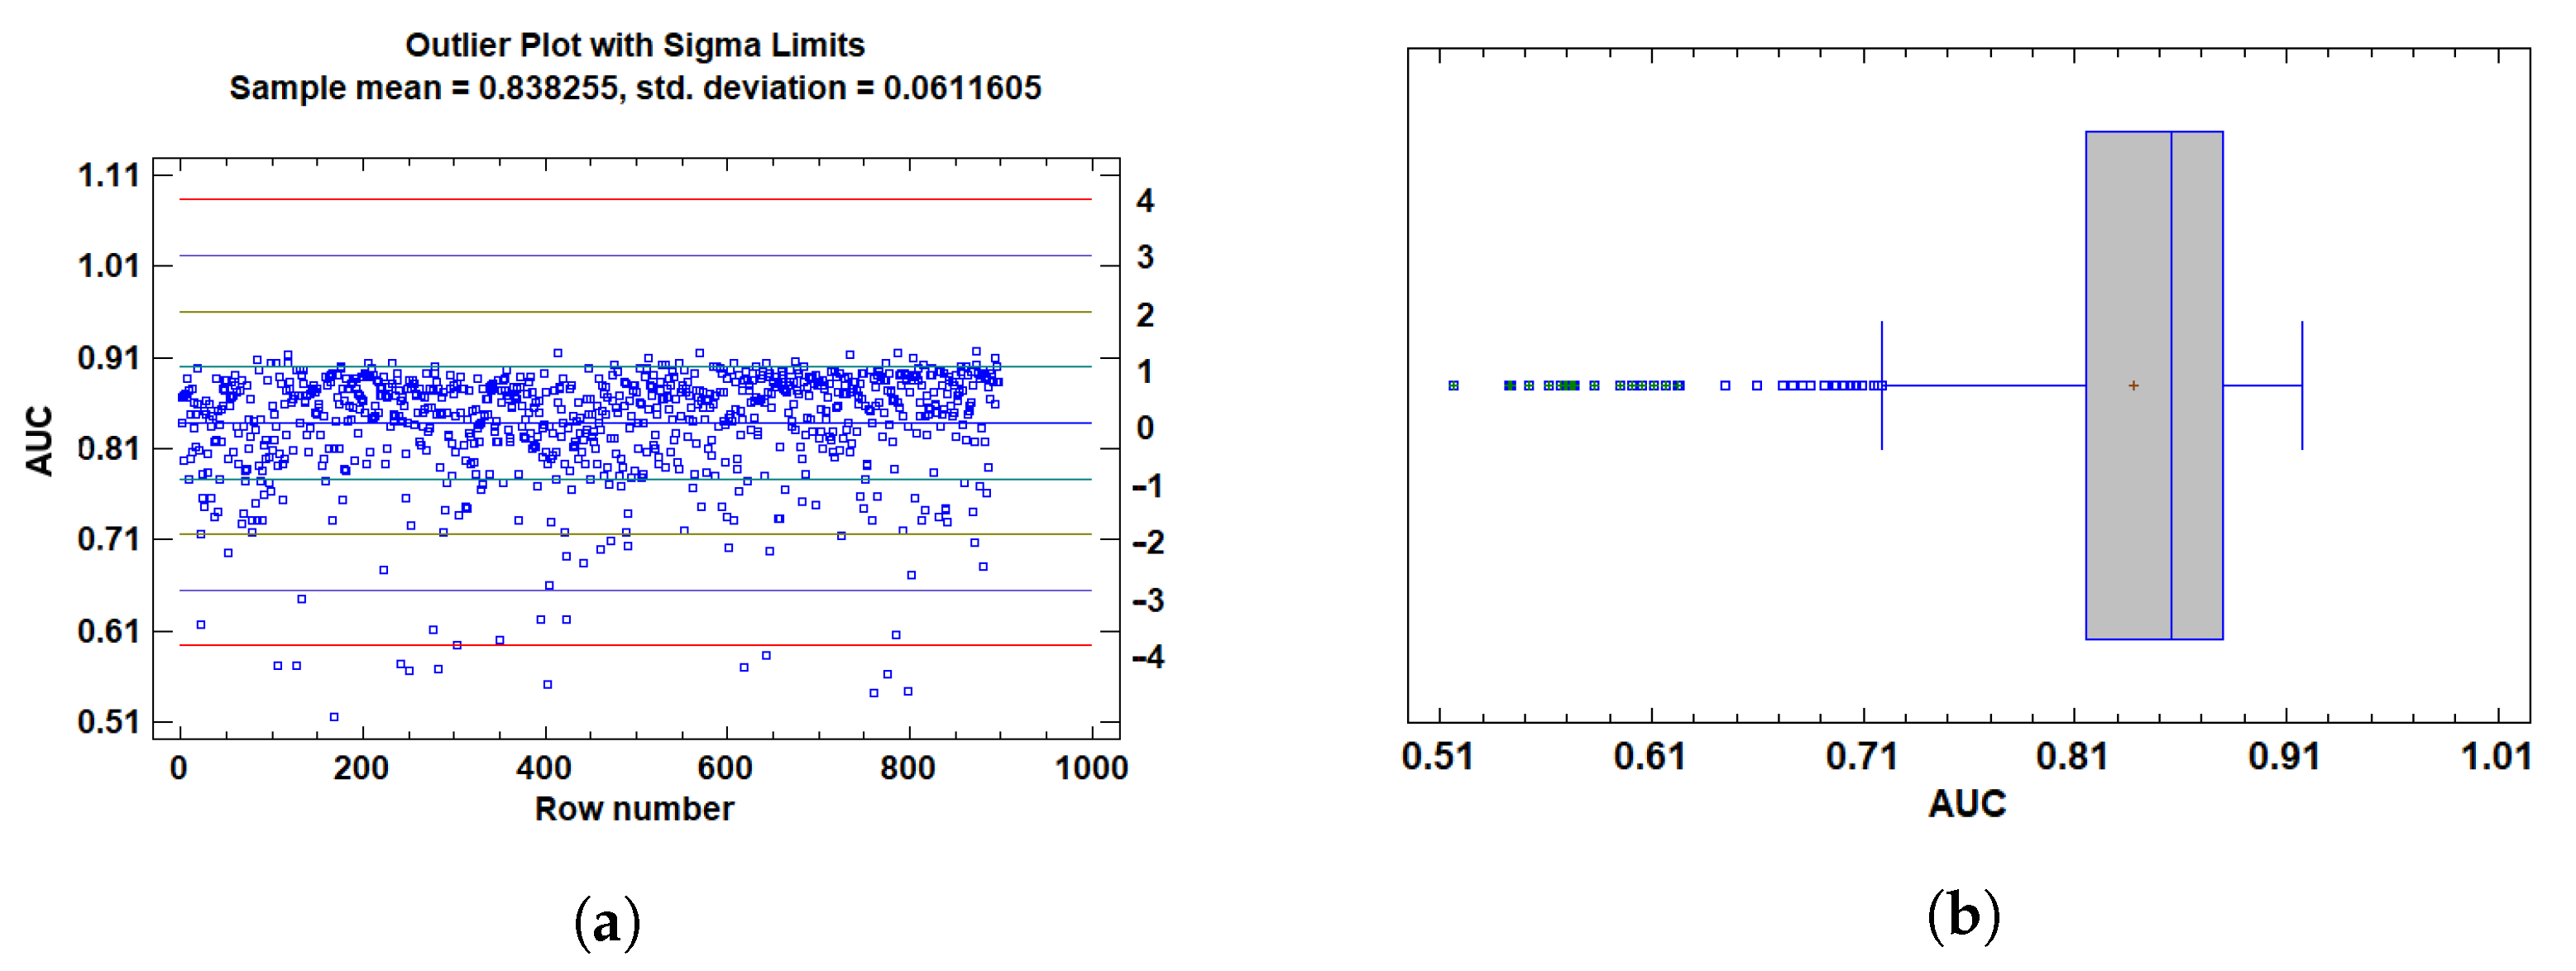
3.1.1. Outlier Detection
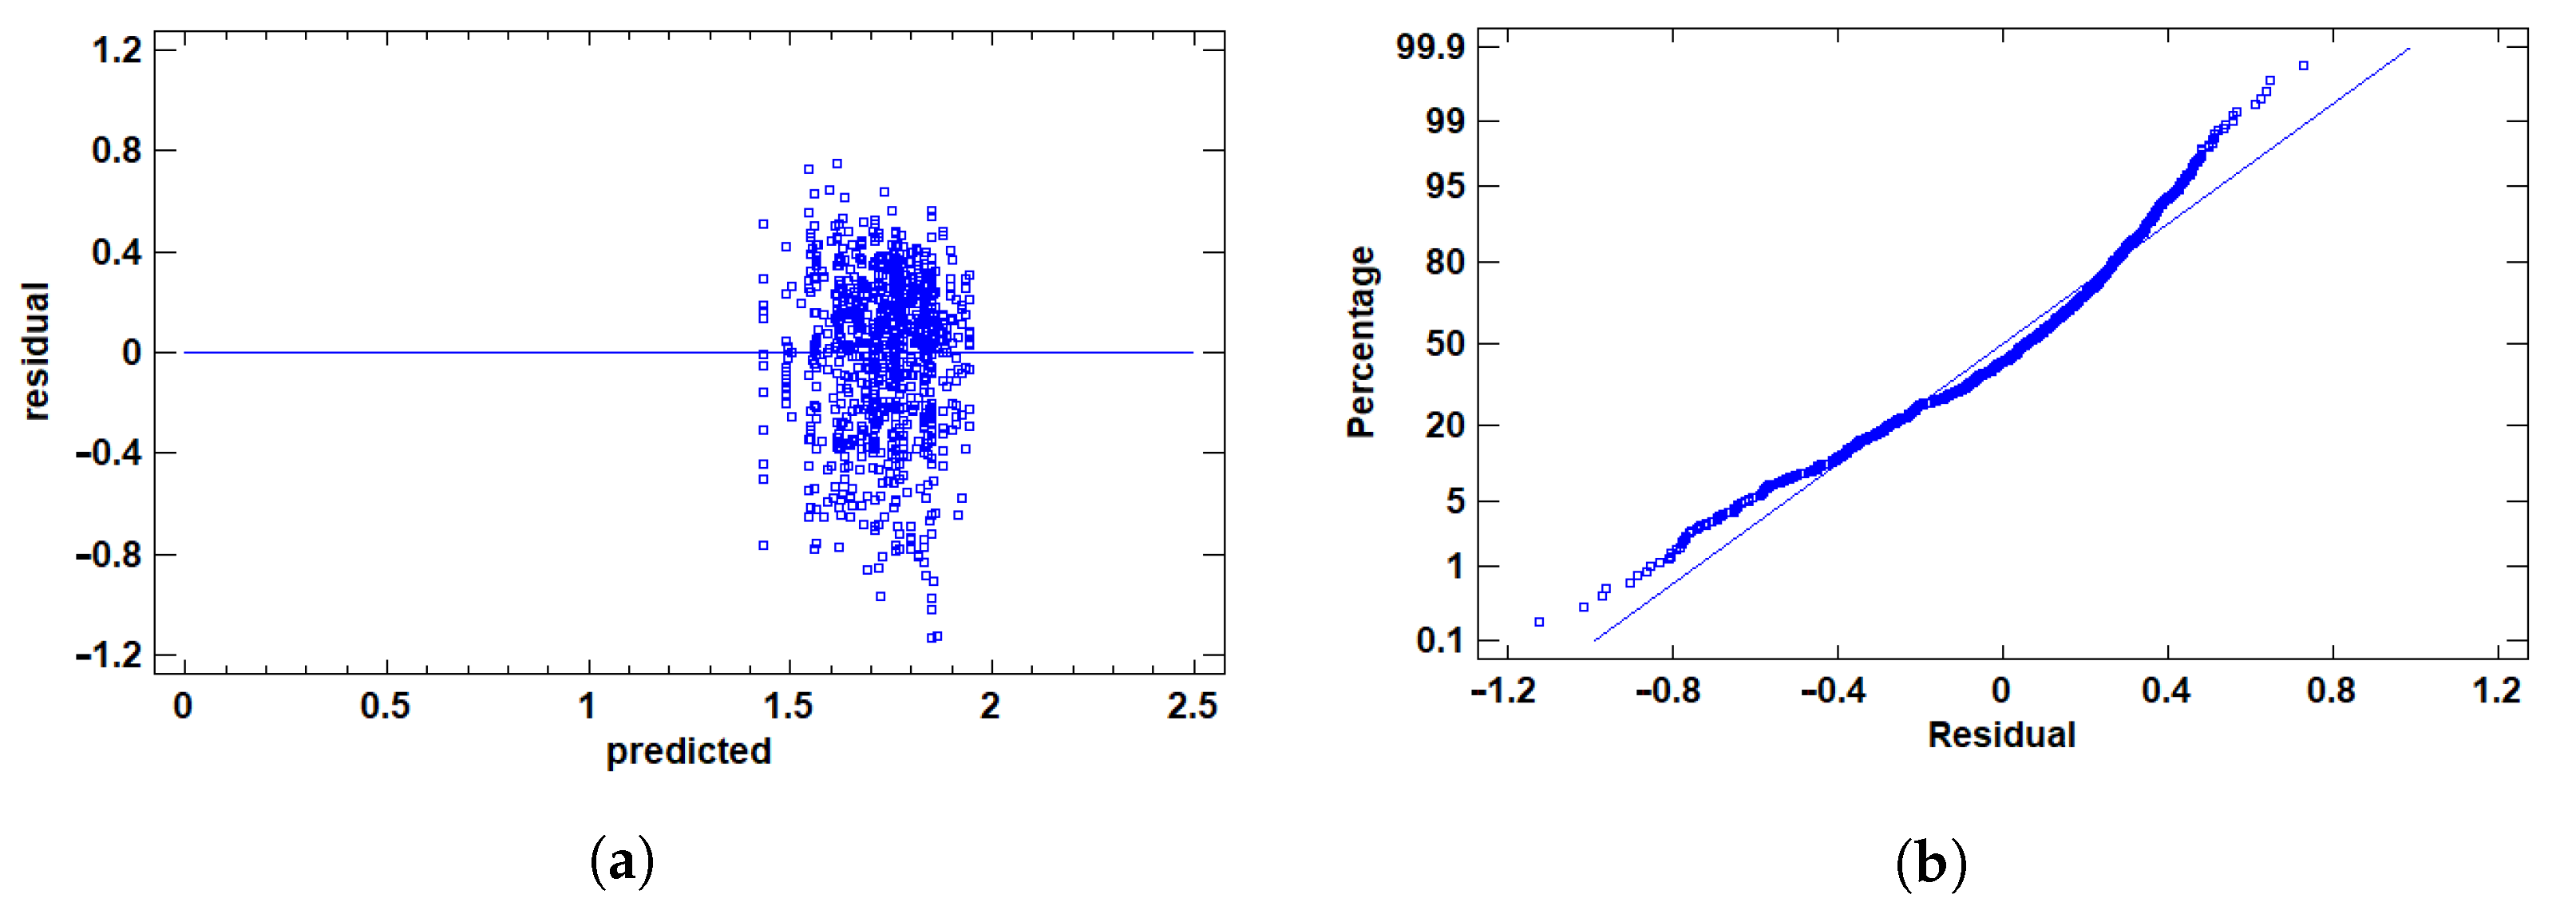
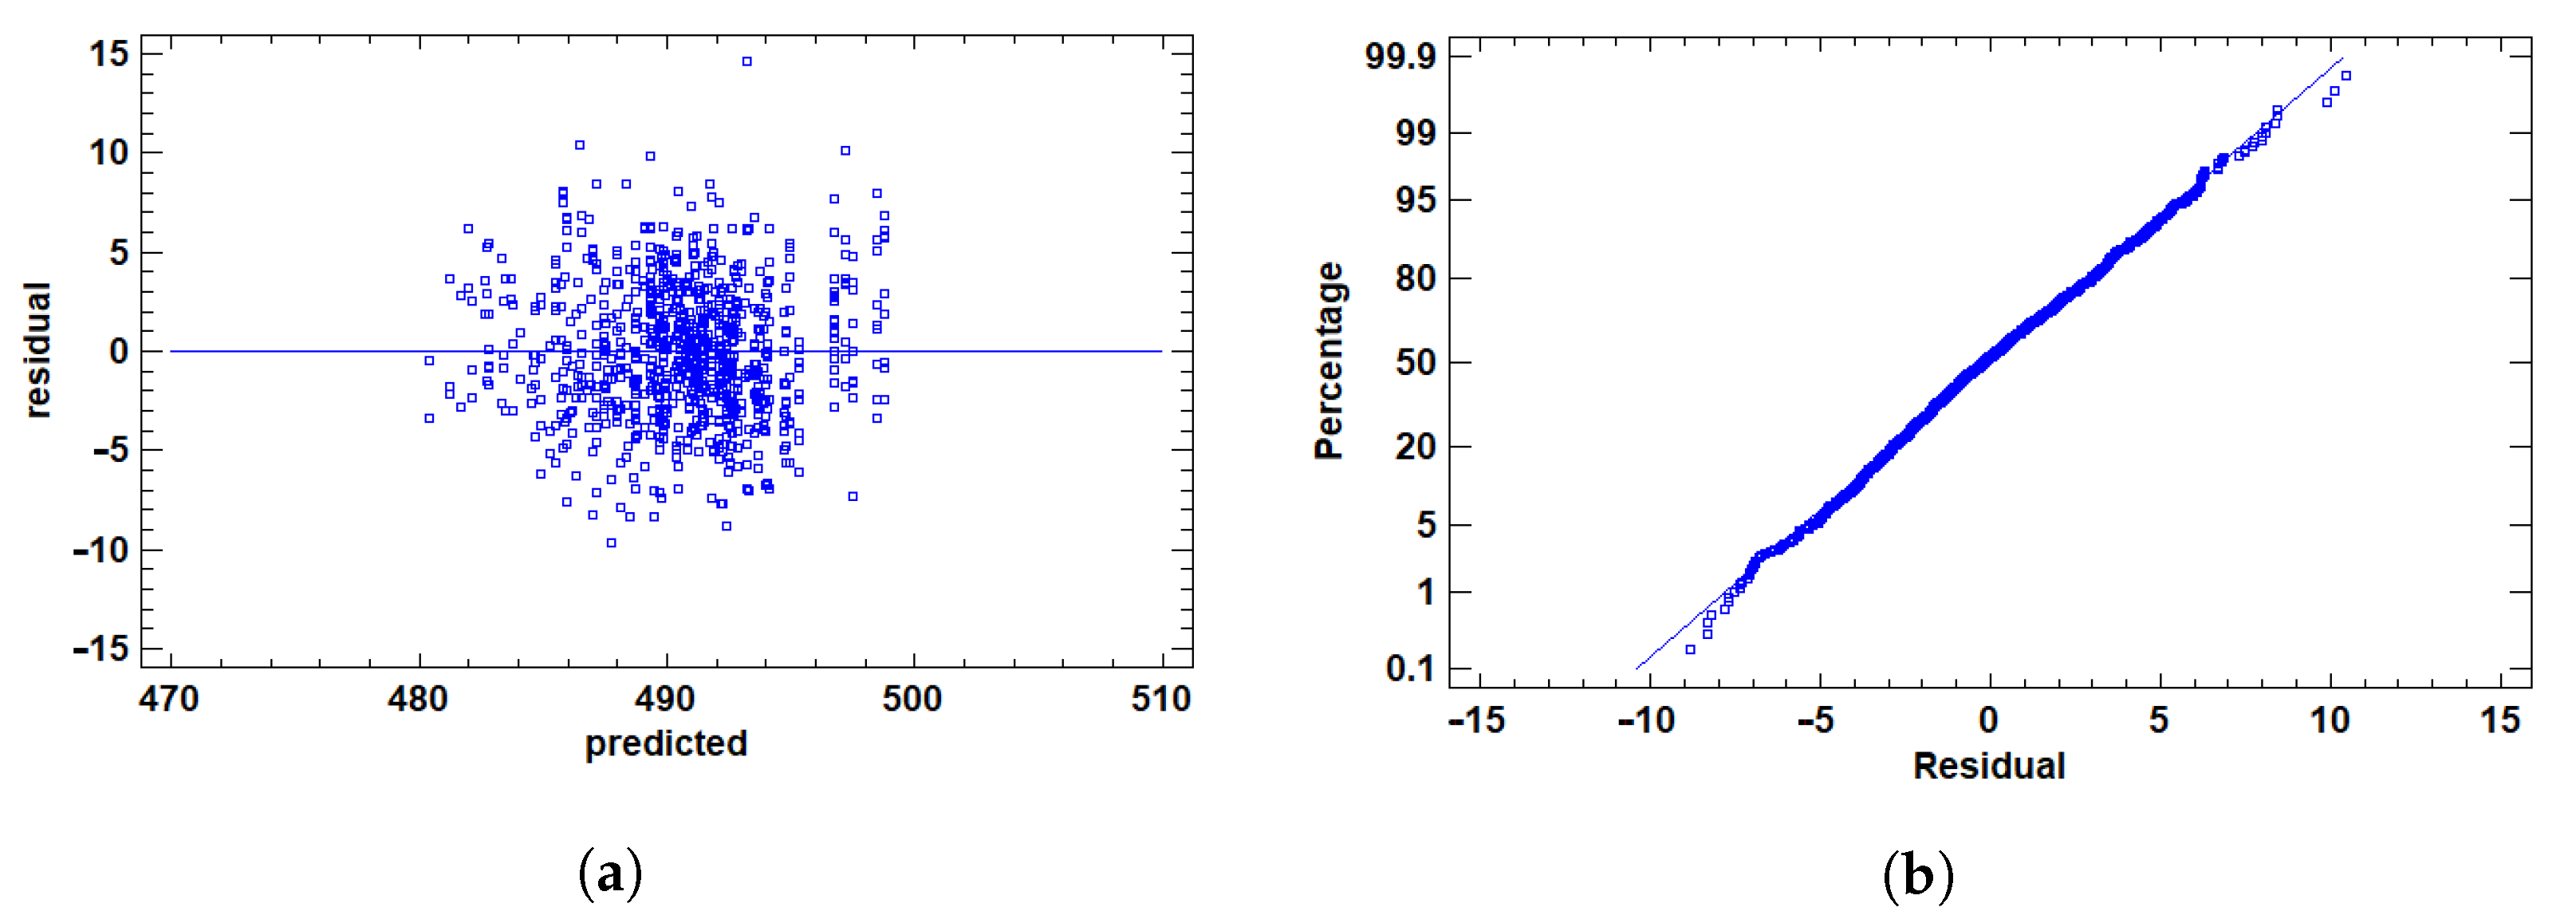
3.1.2. Residual Validation
3.2. Analysis of Variance for F1 Score
3.2.1. Multiple Range Tests for F1 by Ly
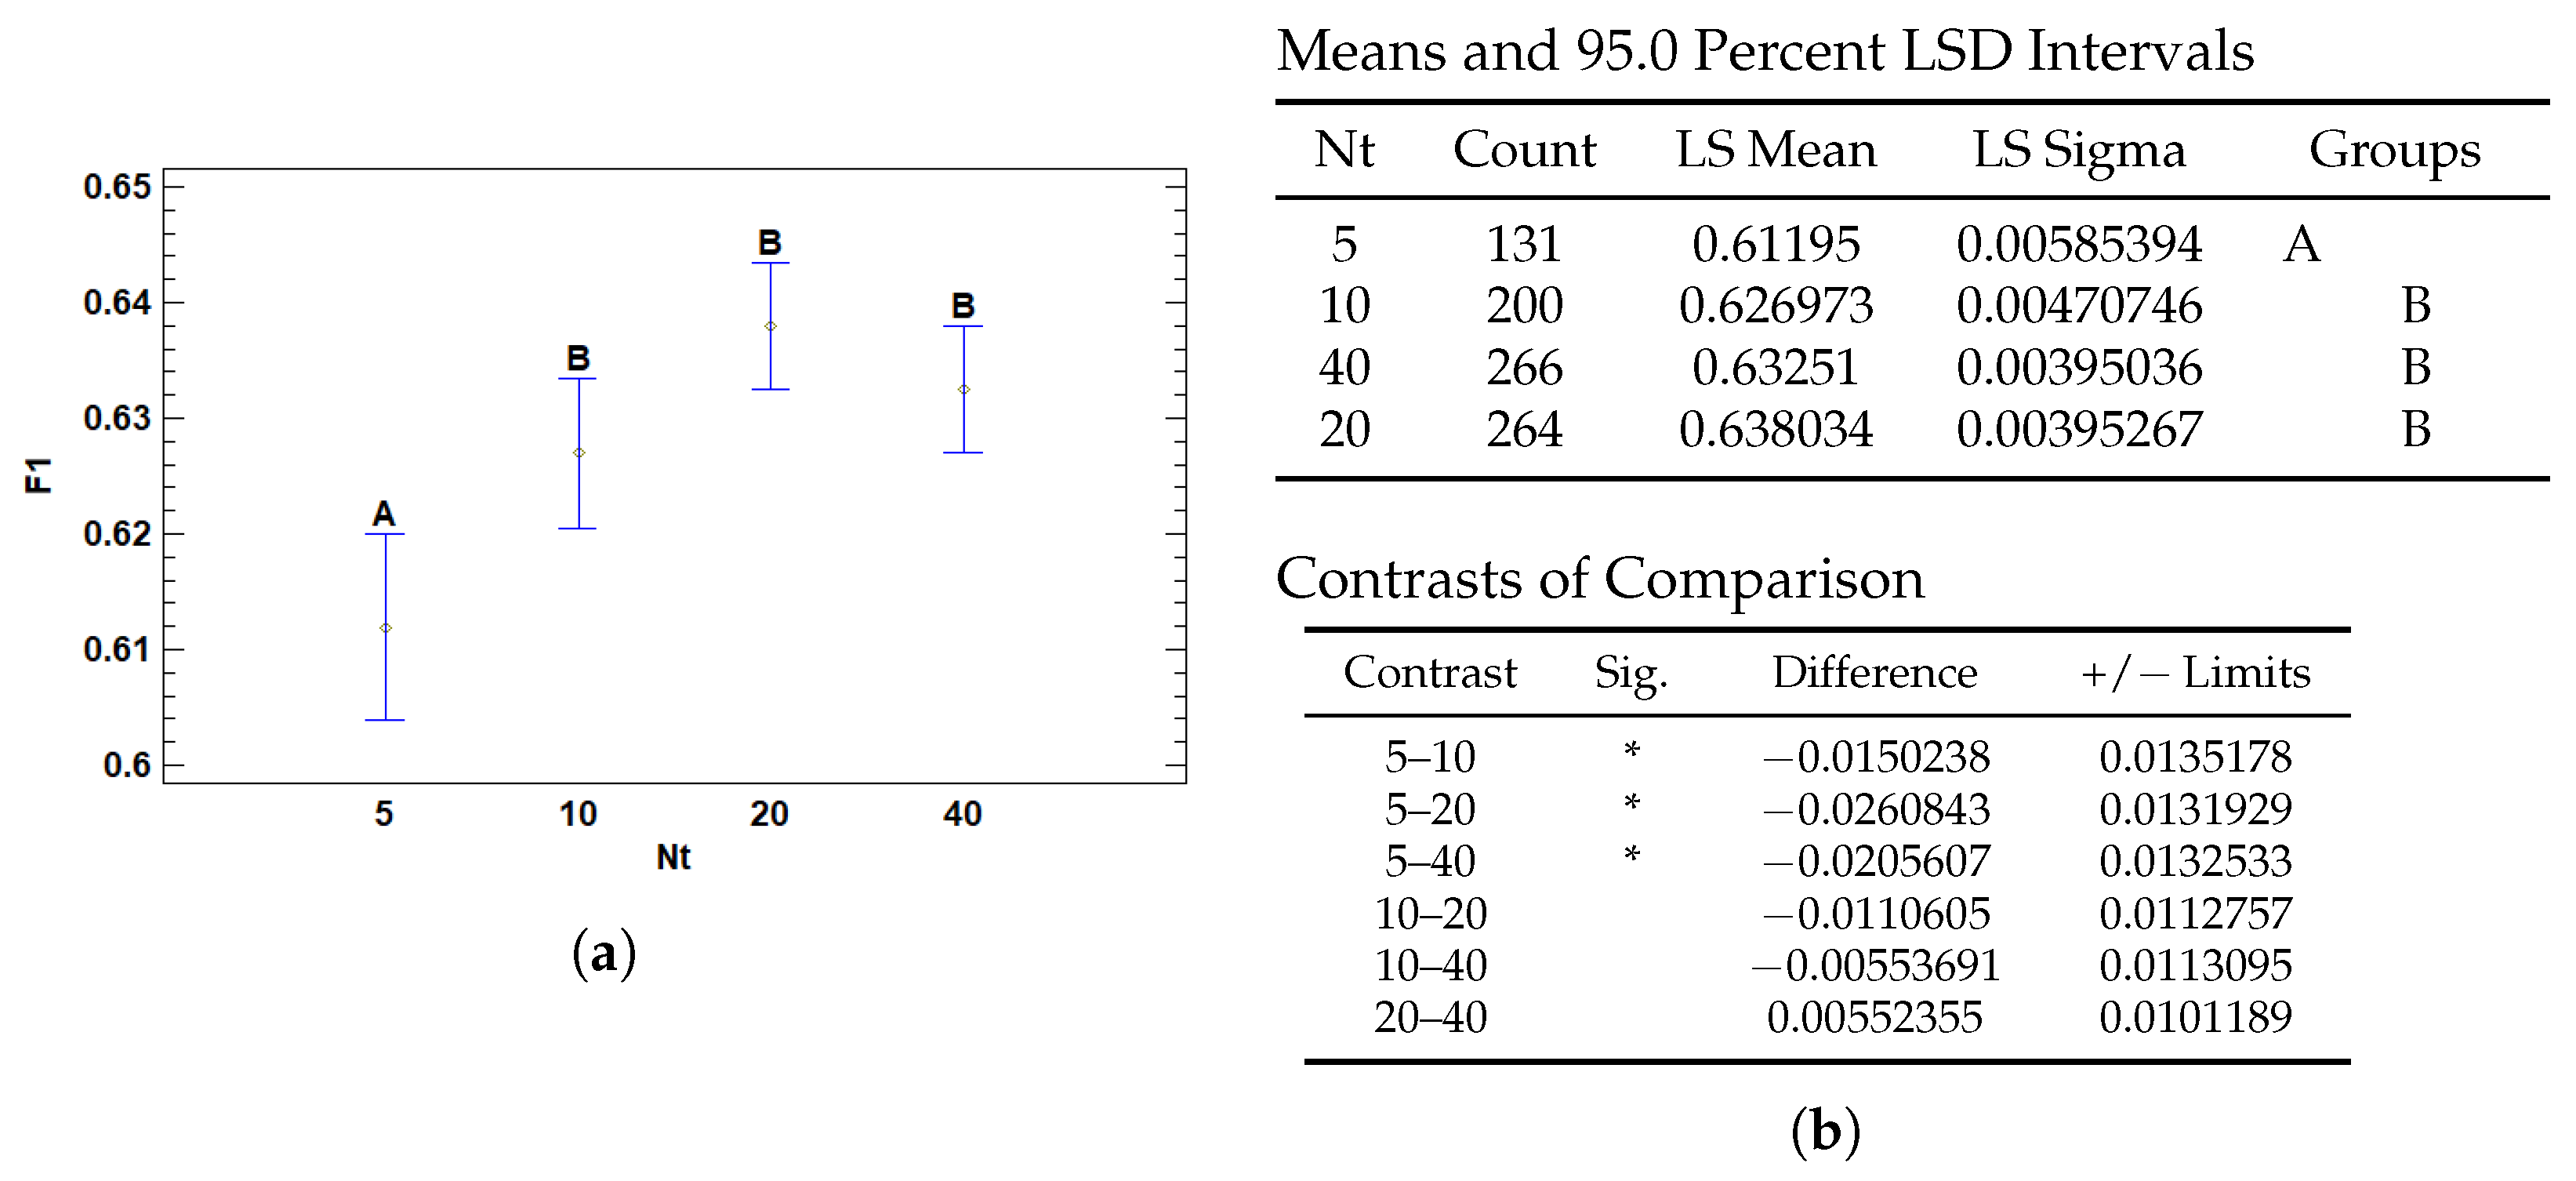
3.2.2. Multiple Range Tests for F1 by Nt
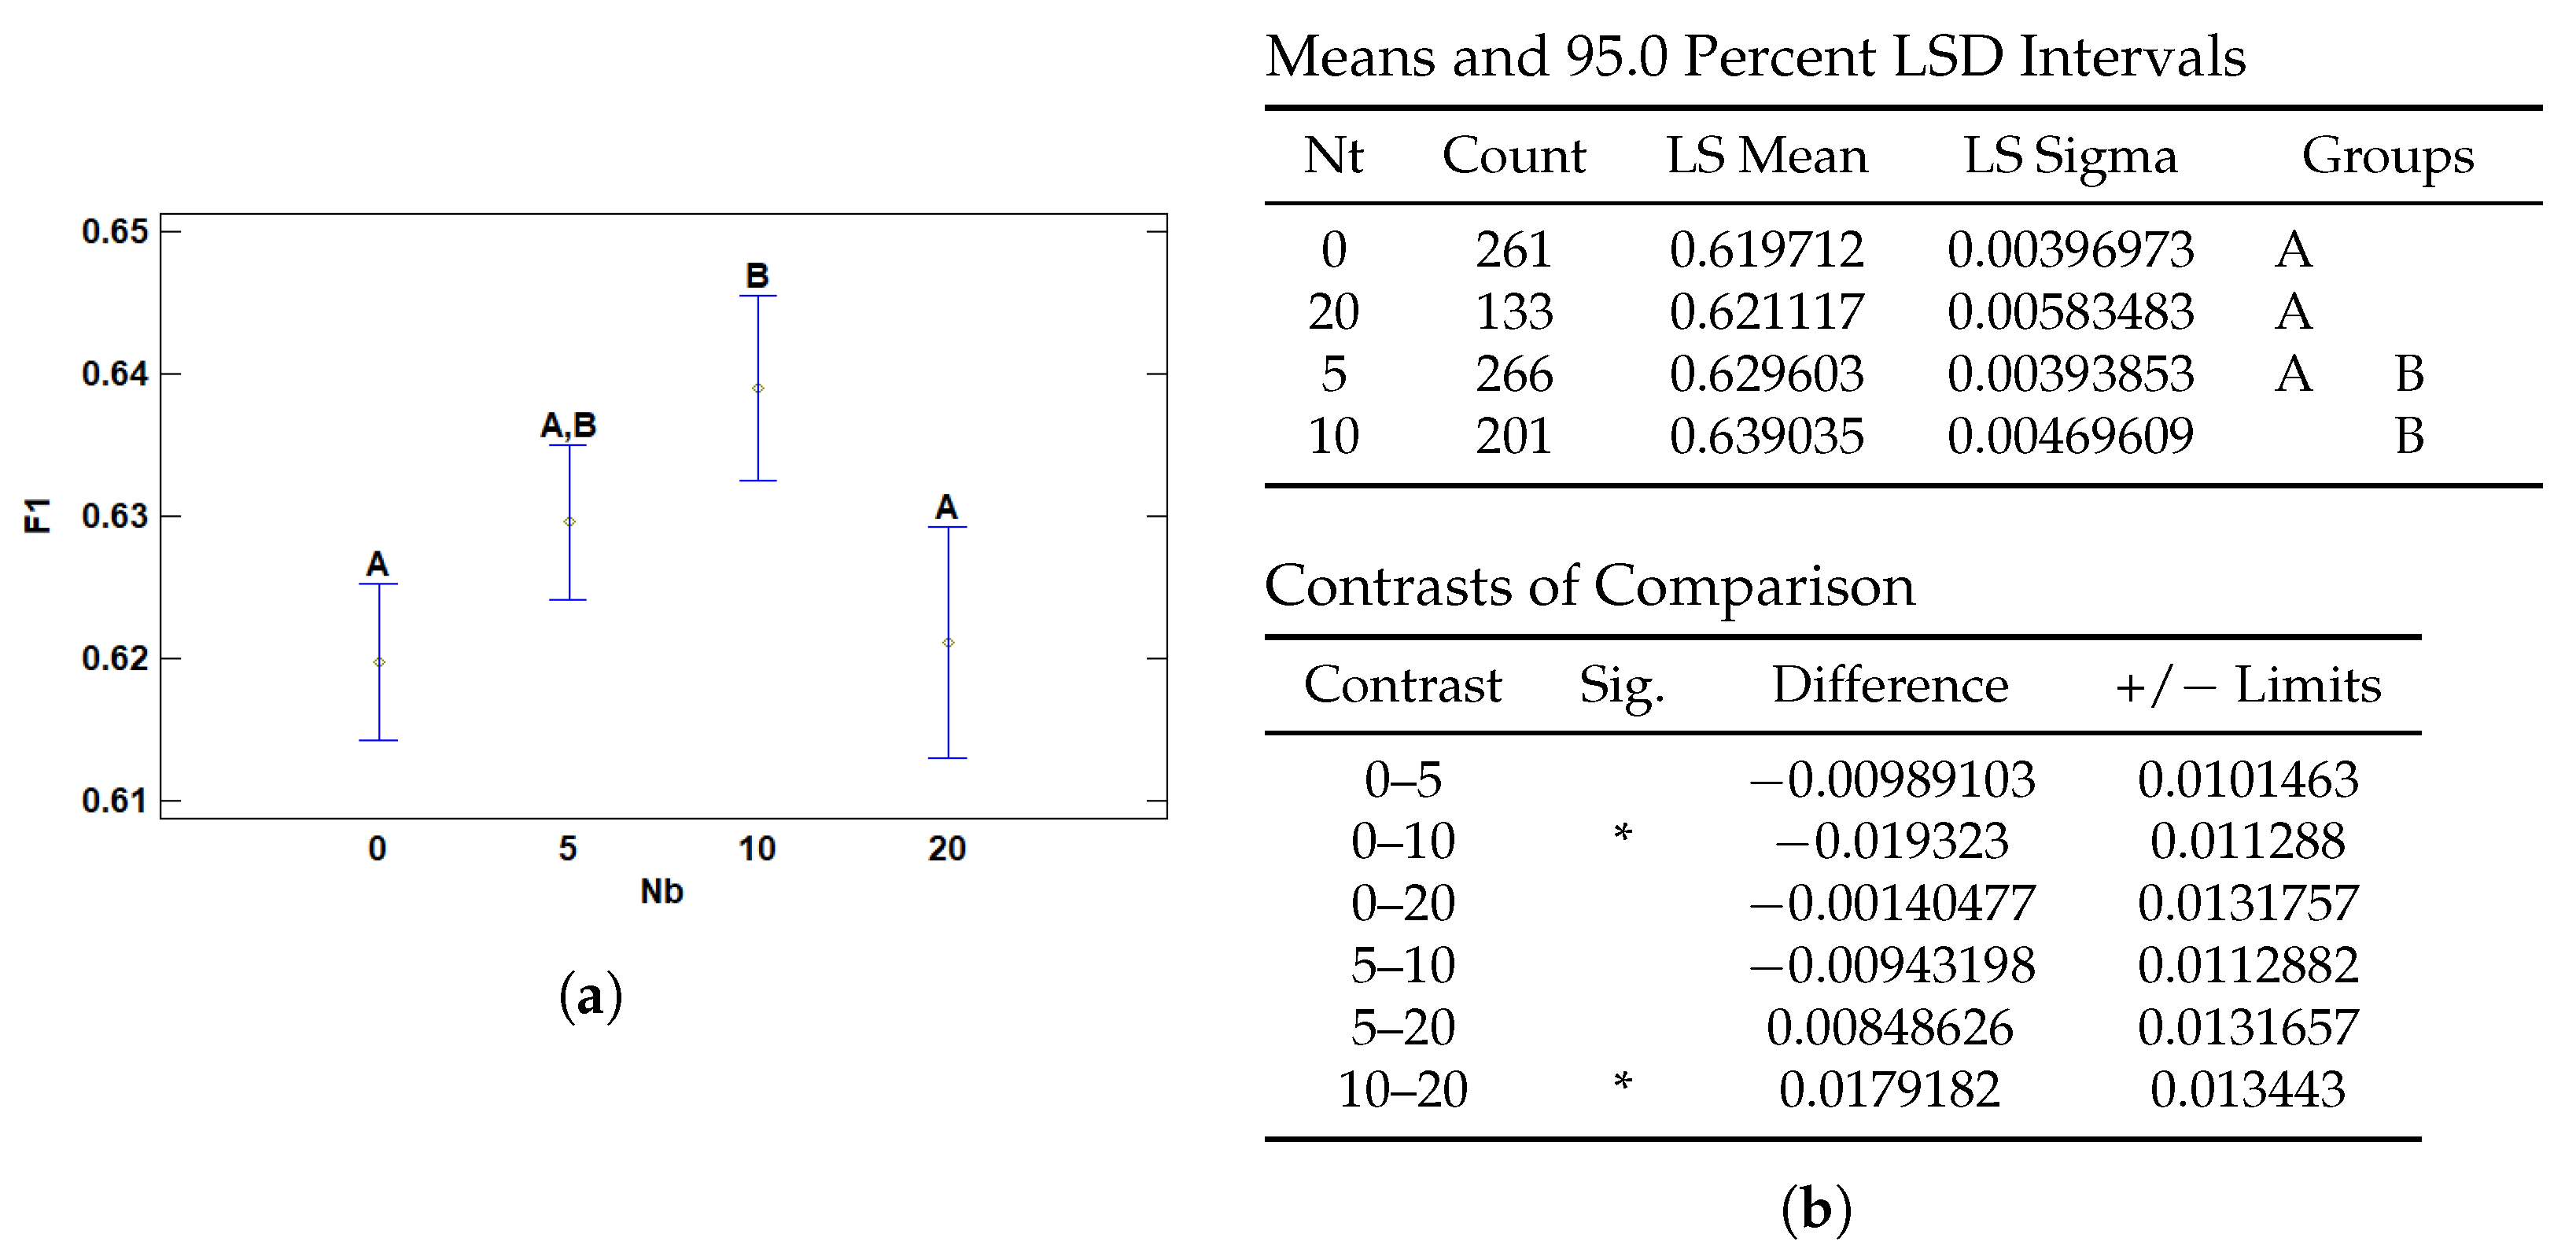
3.2.3. Multiple Range Tests for F1 by Nb
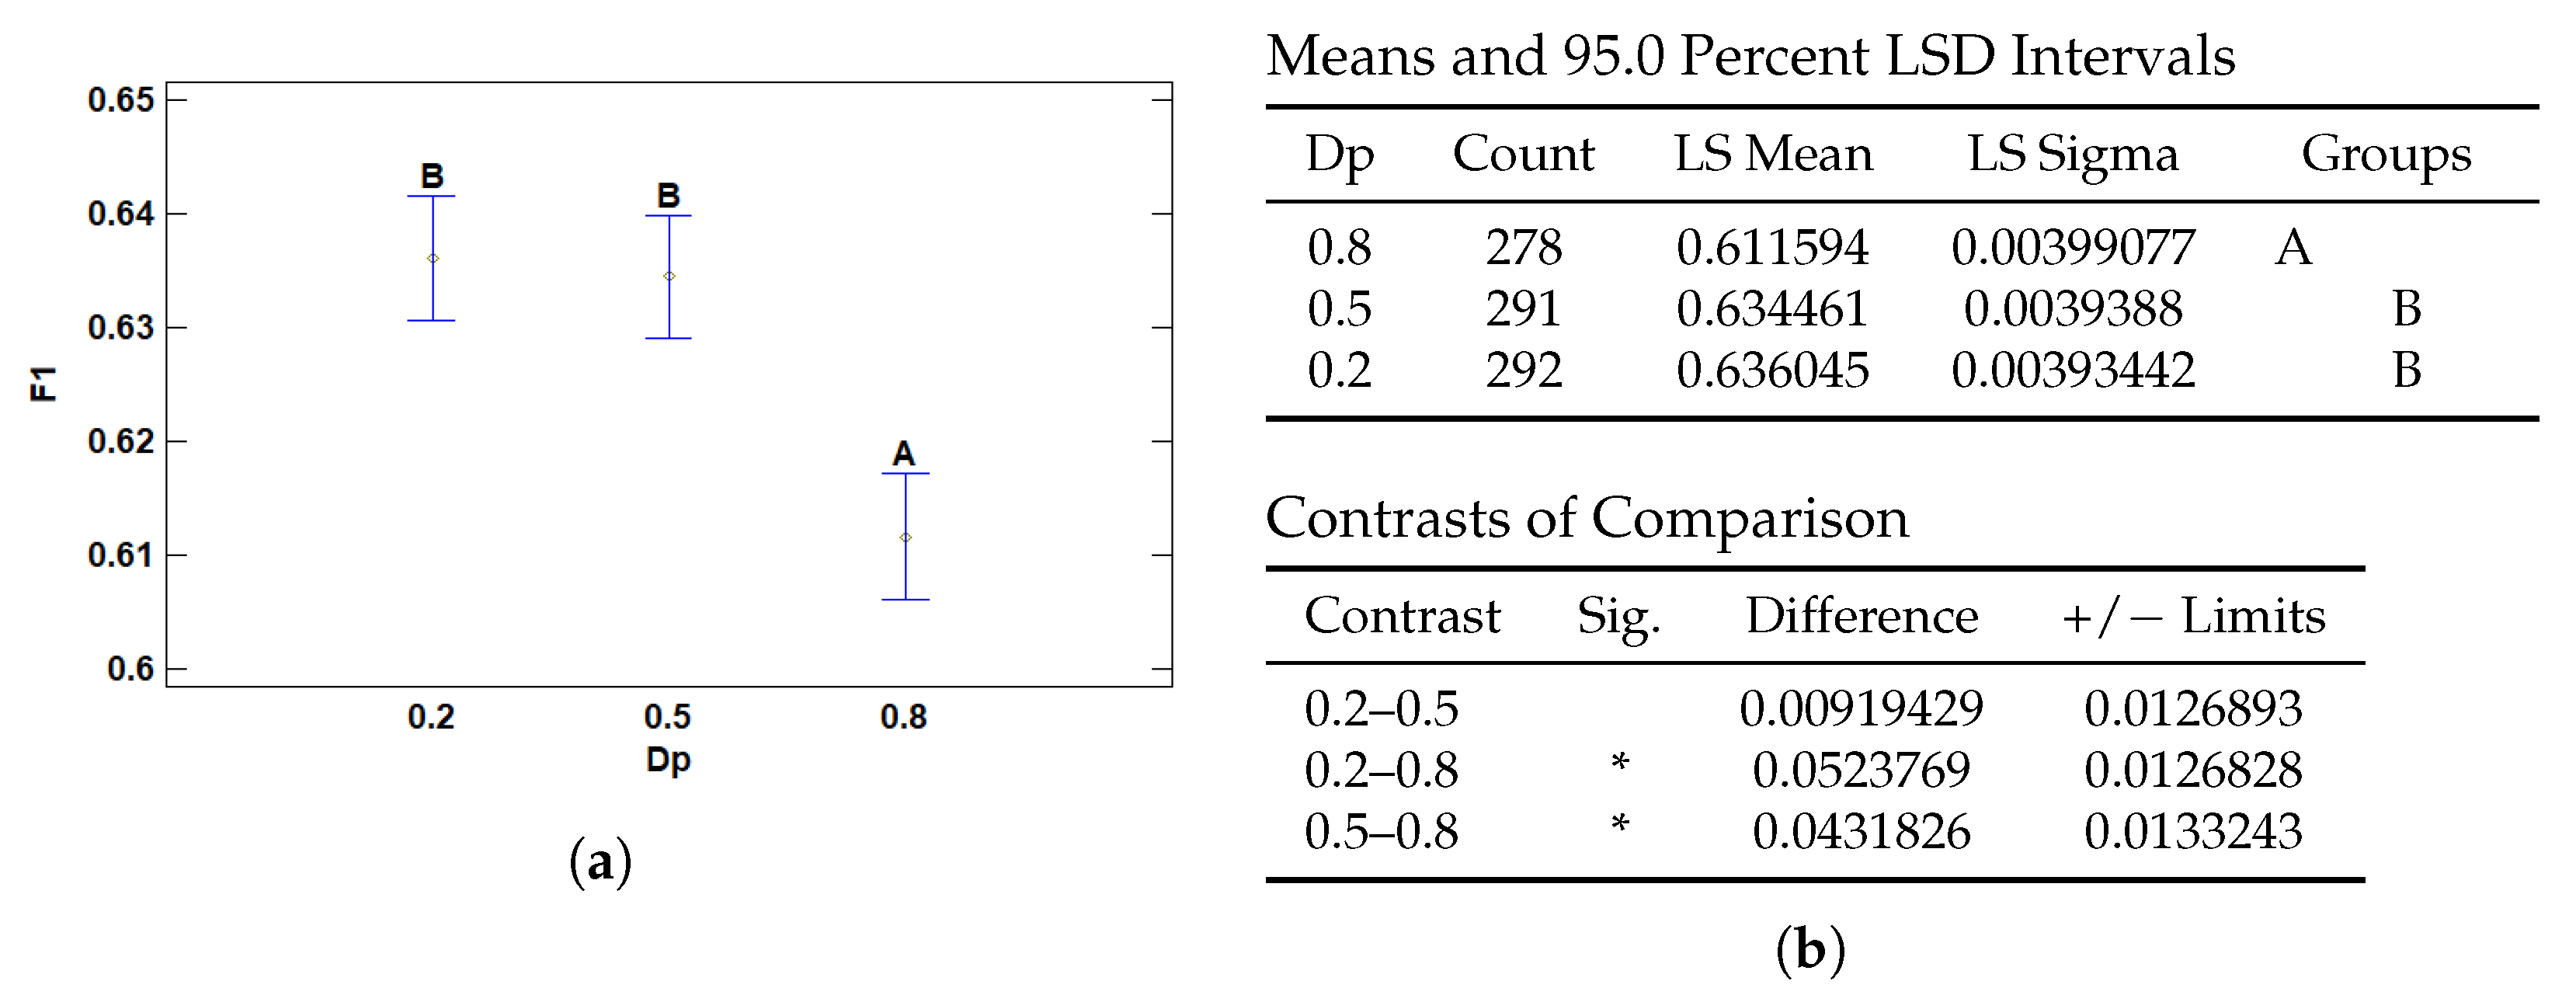
3.2.4. Multiple Range Tests for F1 by Dp
3.3. Analysis of Variance for AUC-ROC
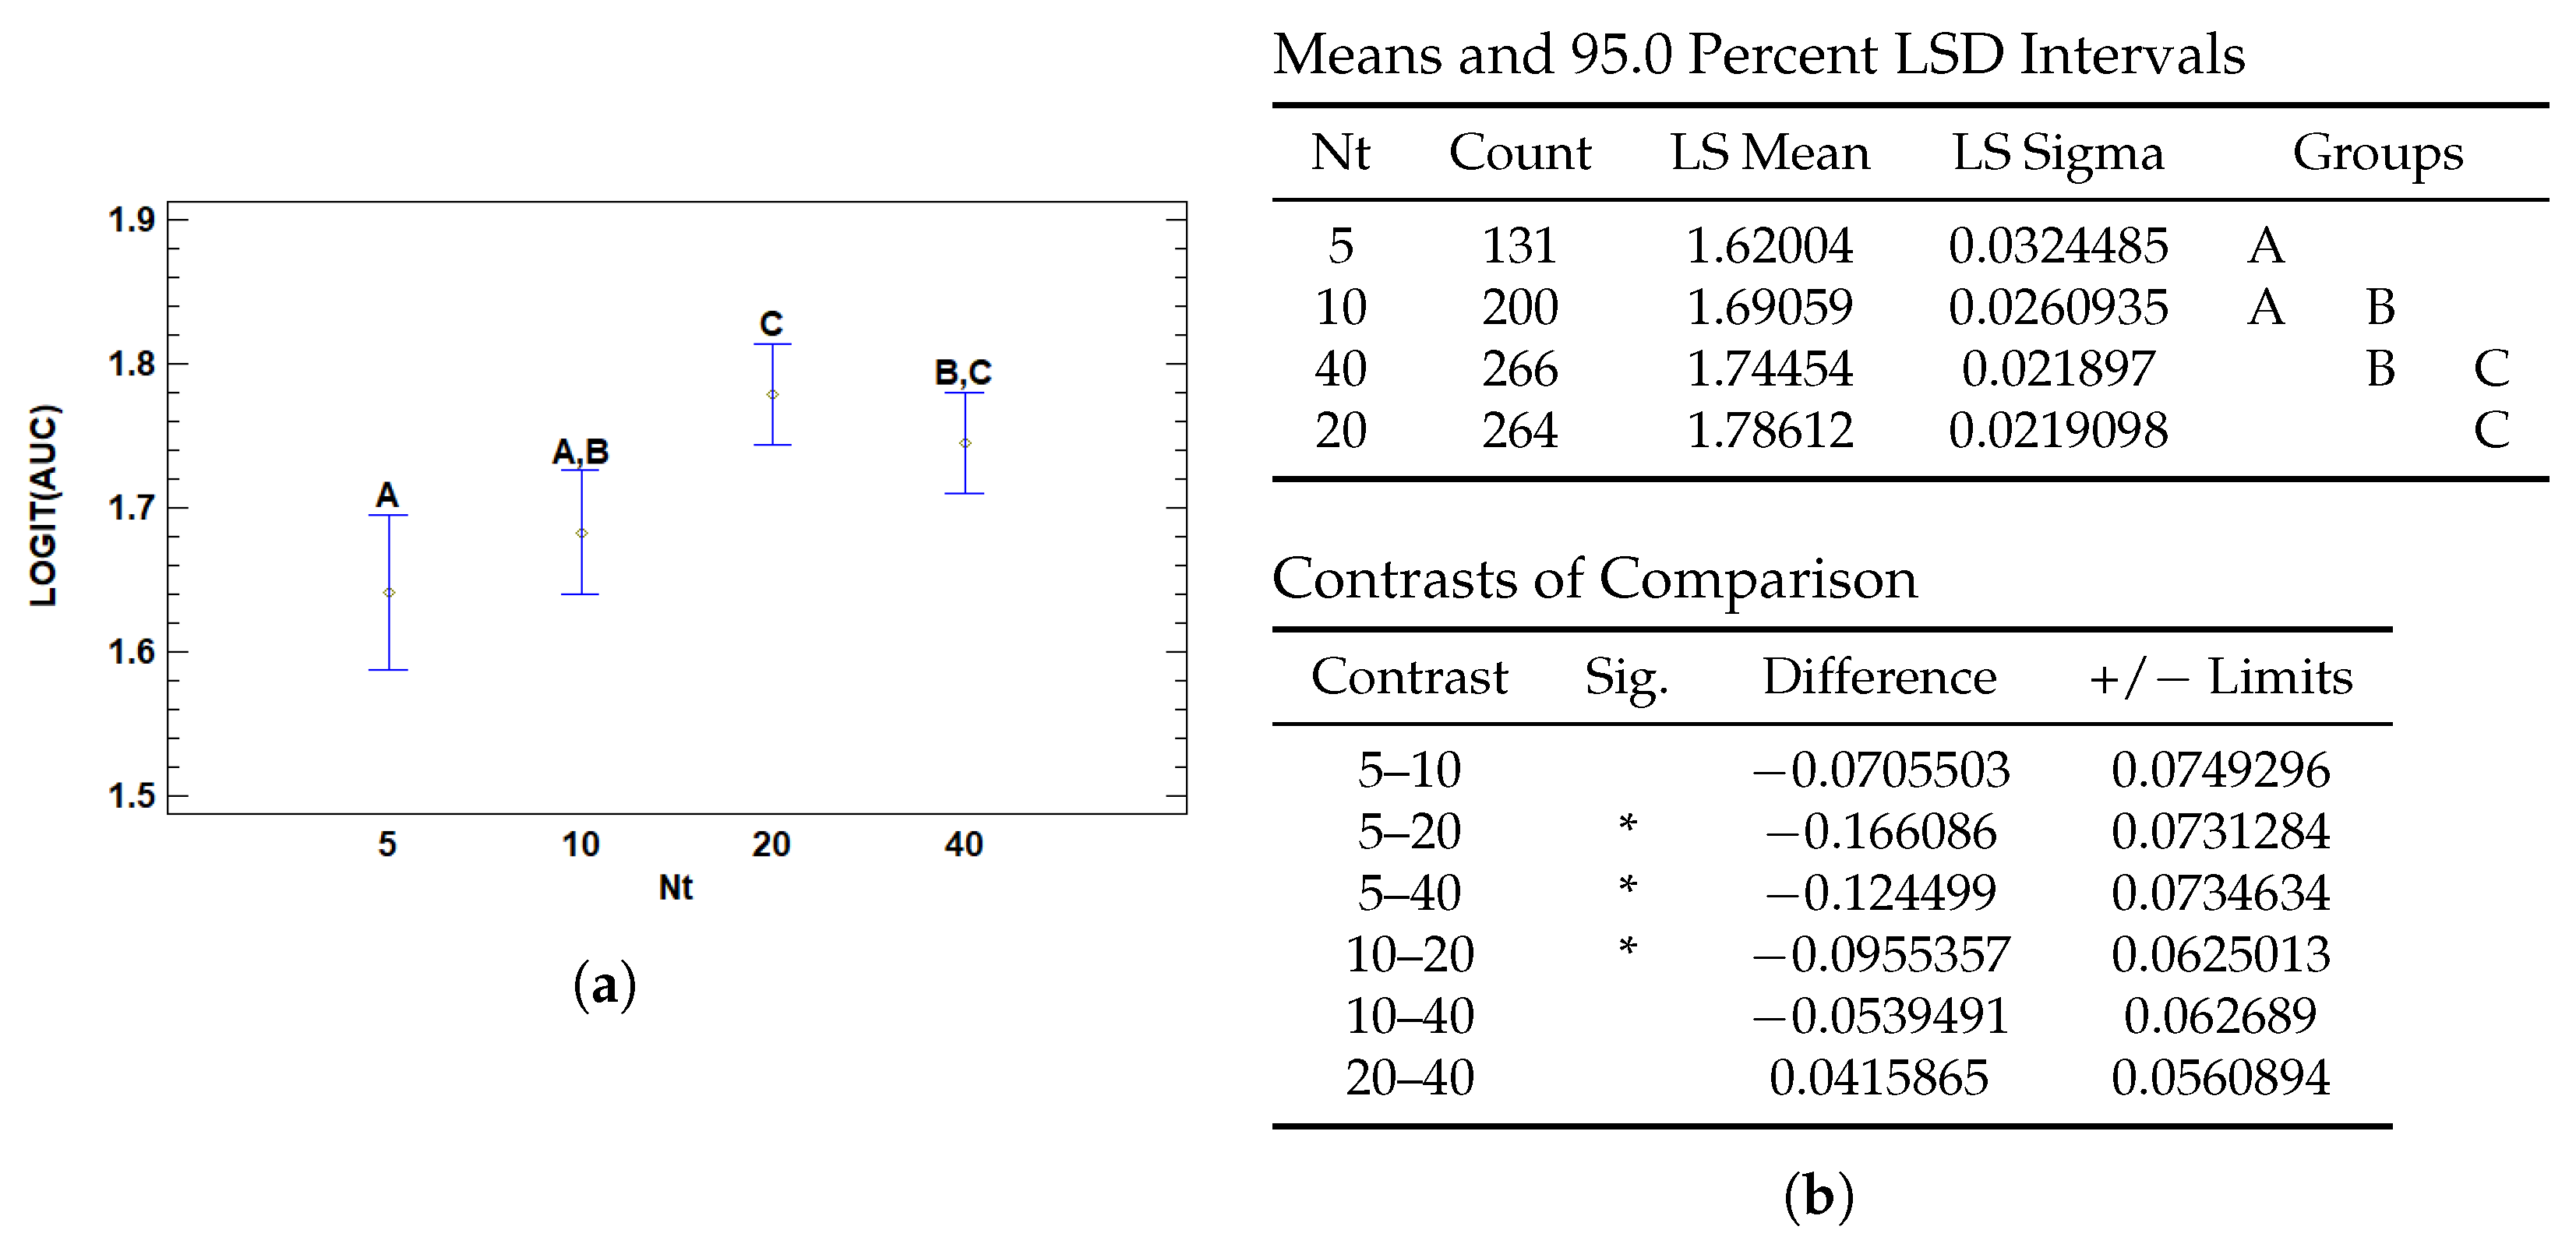
3.3.1. Multiple Range Tests for AUC by Nt
3.3.2. Multiple Range Tests for AUC by Nb
3.4. Analysis of Variance for T (s)
3.4.1. Multiple Range Tests for T (s) by Wd
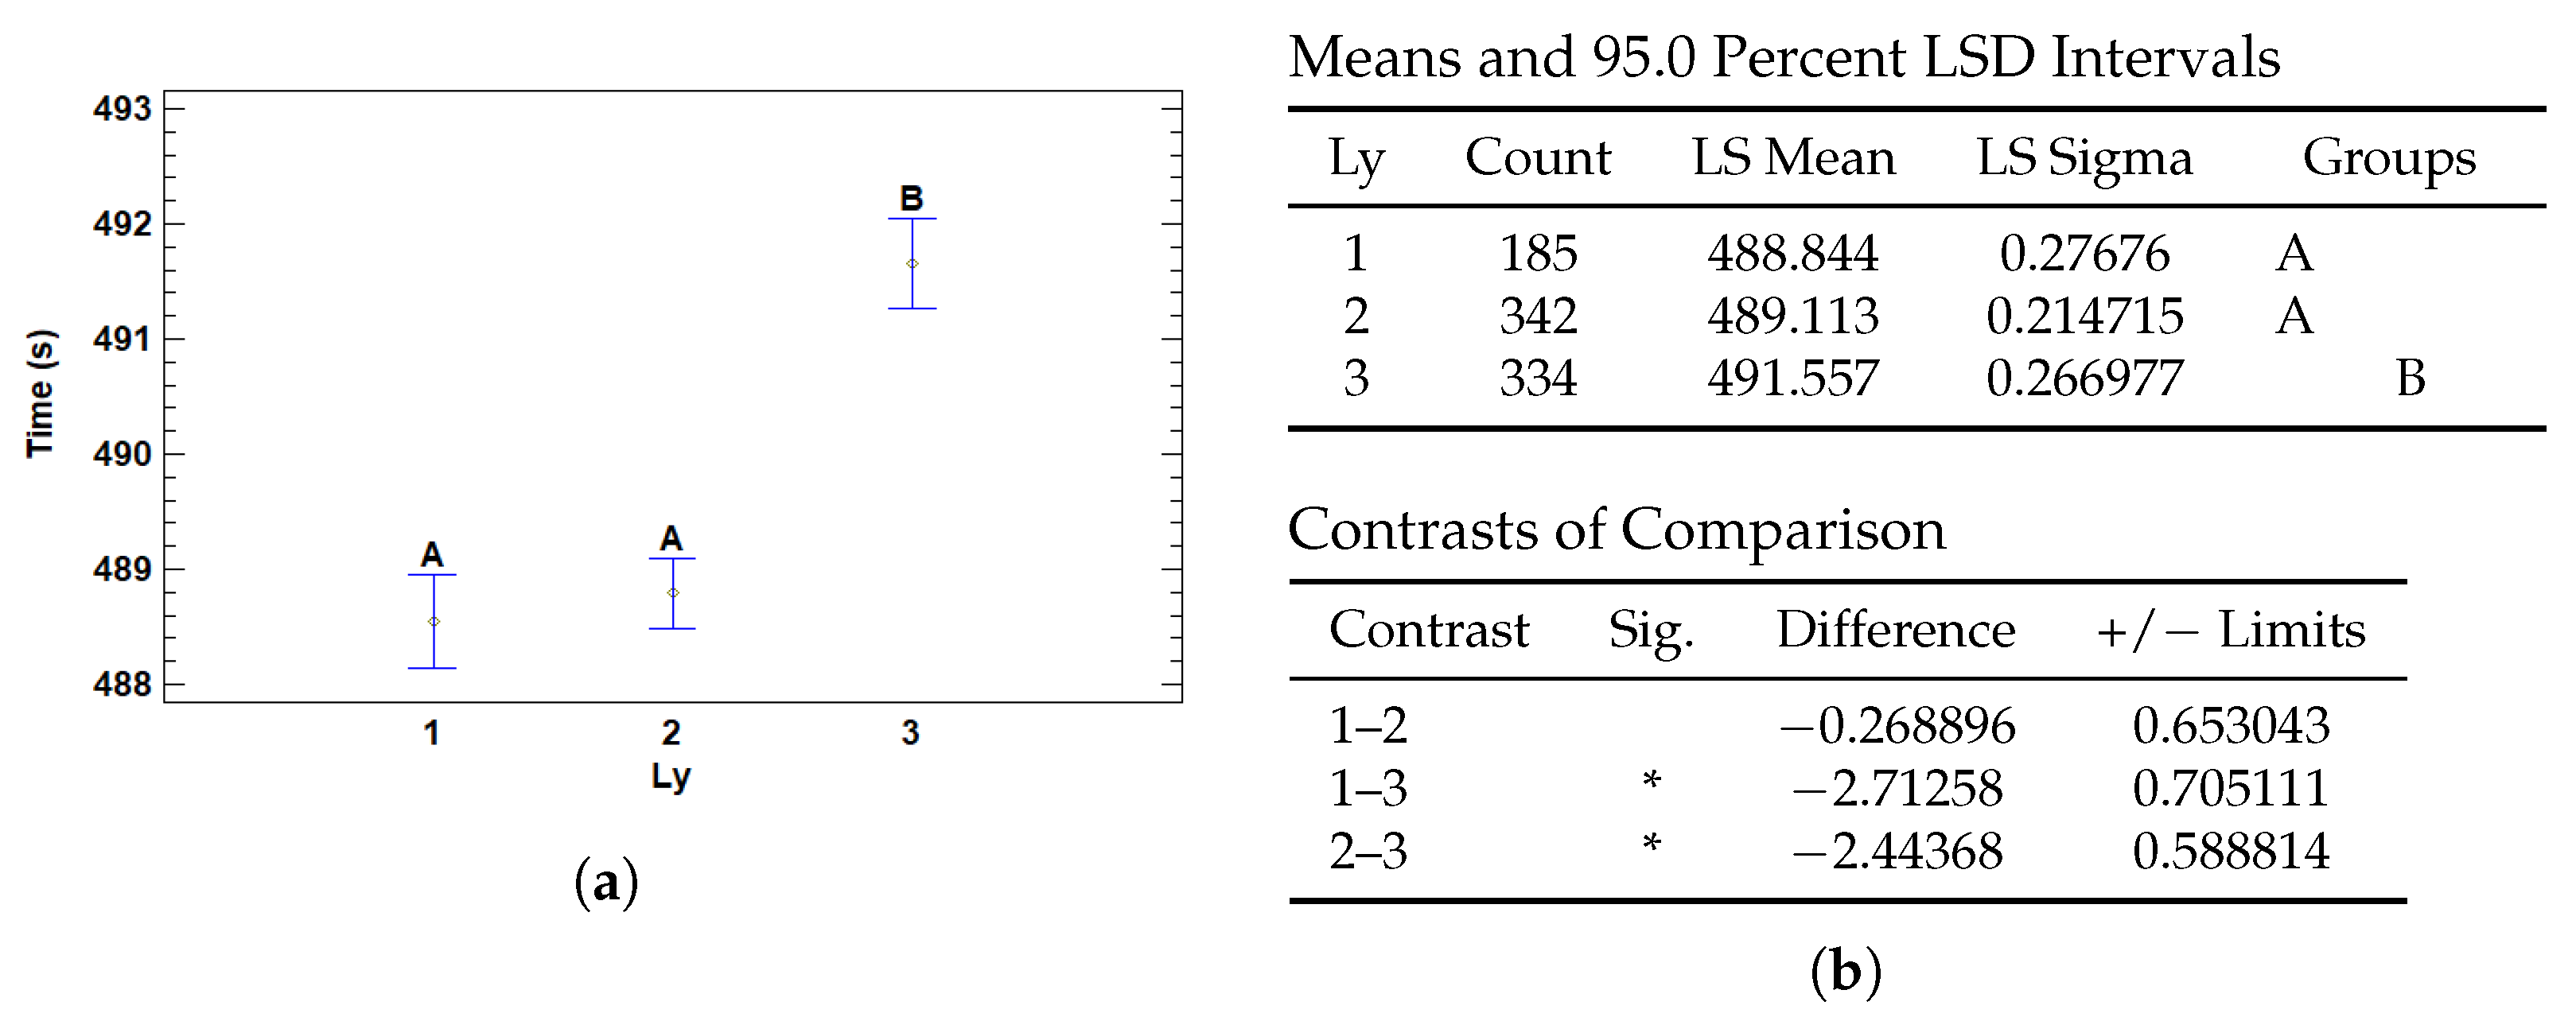
3.4.2. Multiple Range Tests for T (s) by Ly
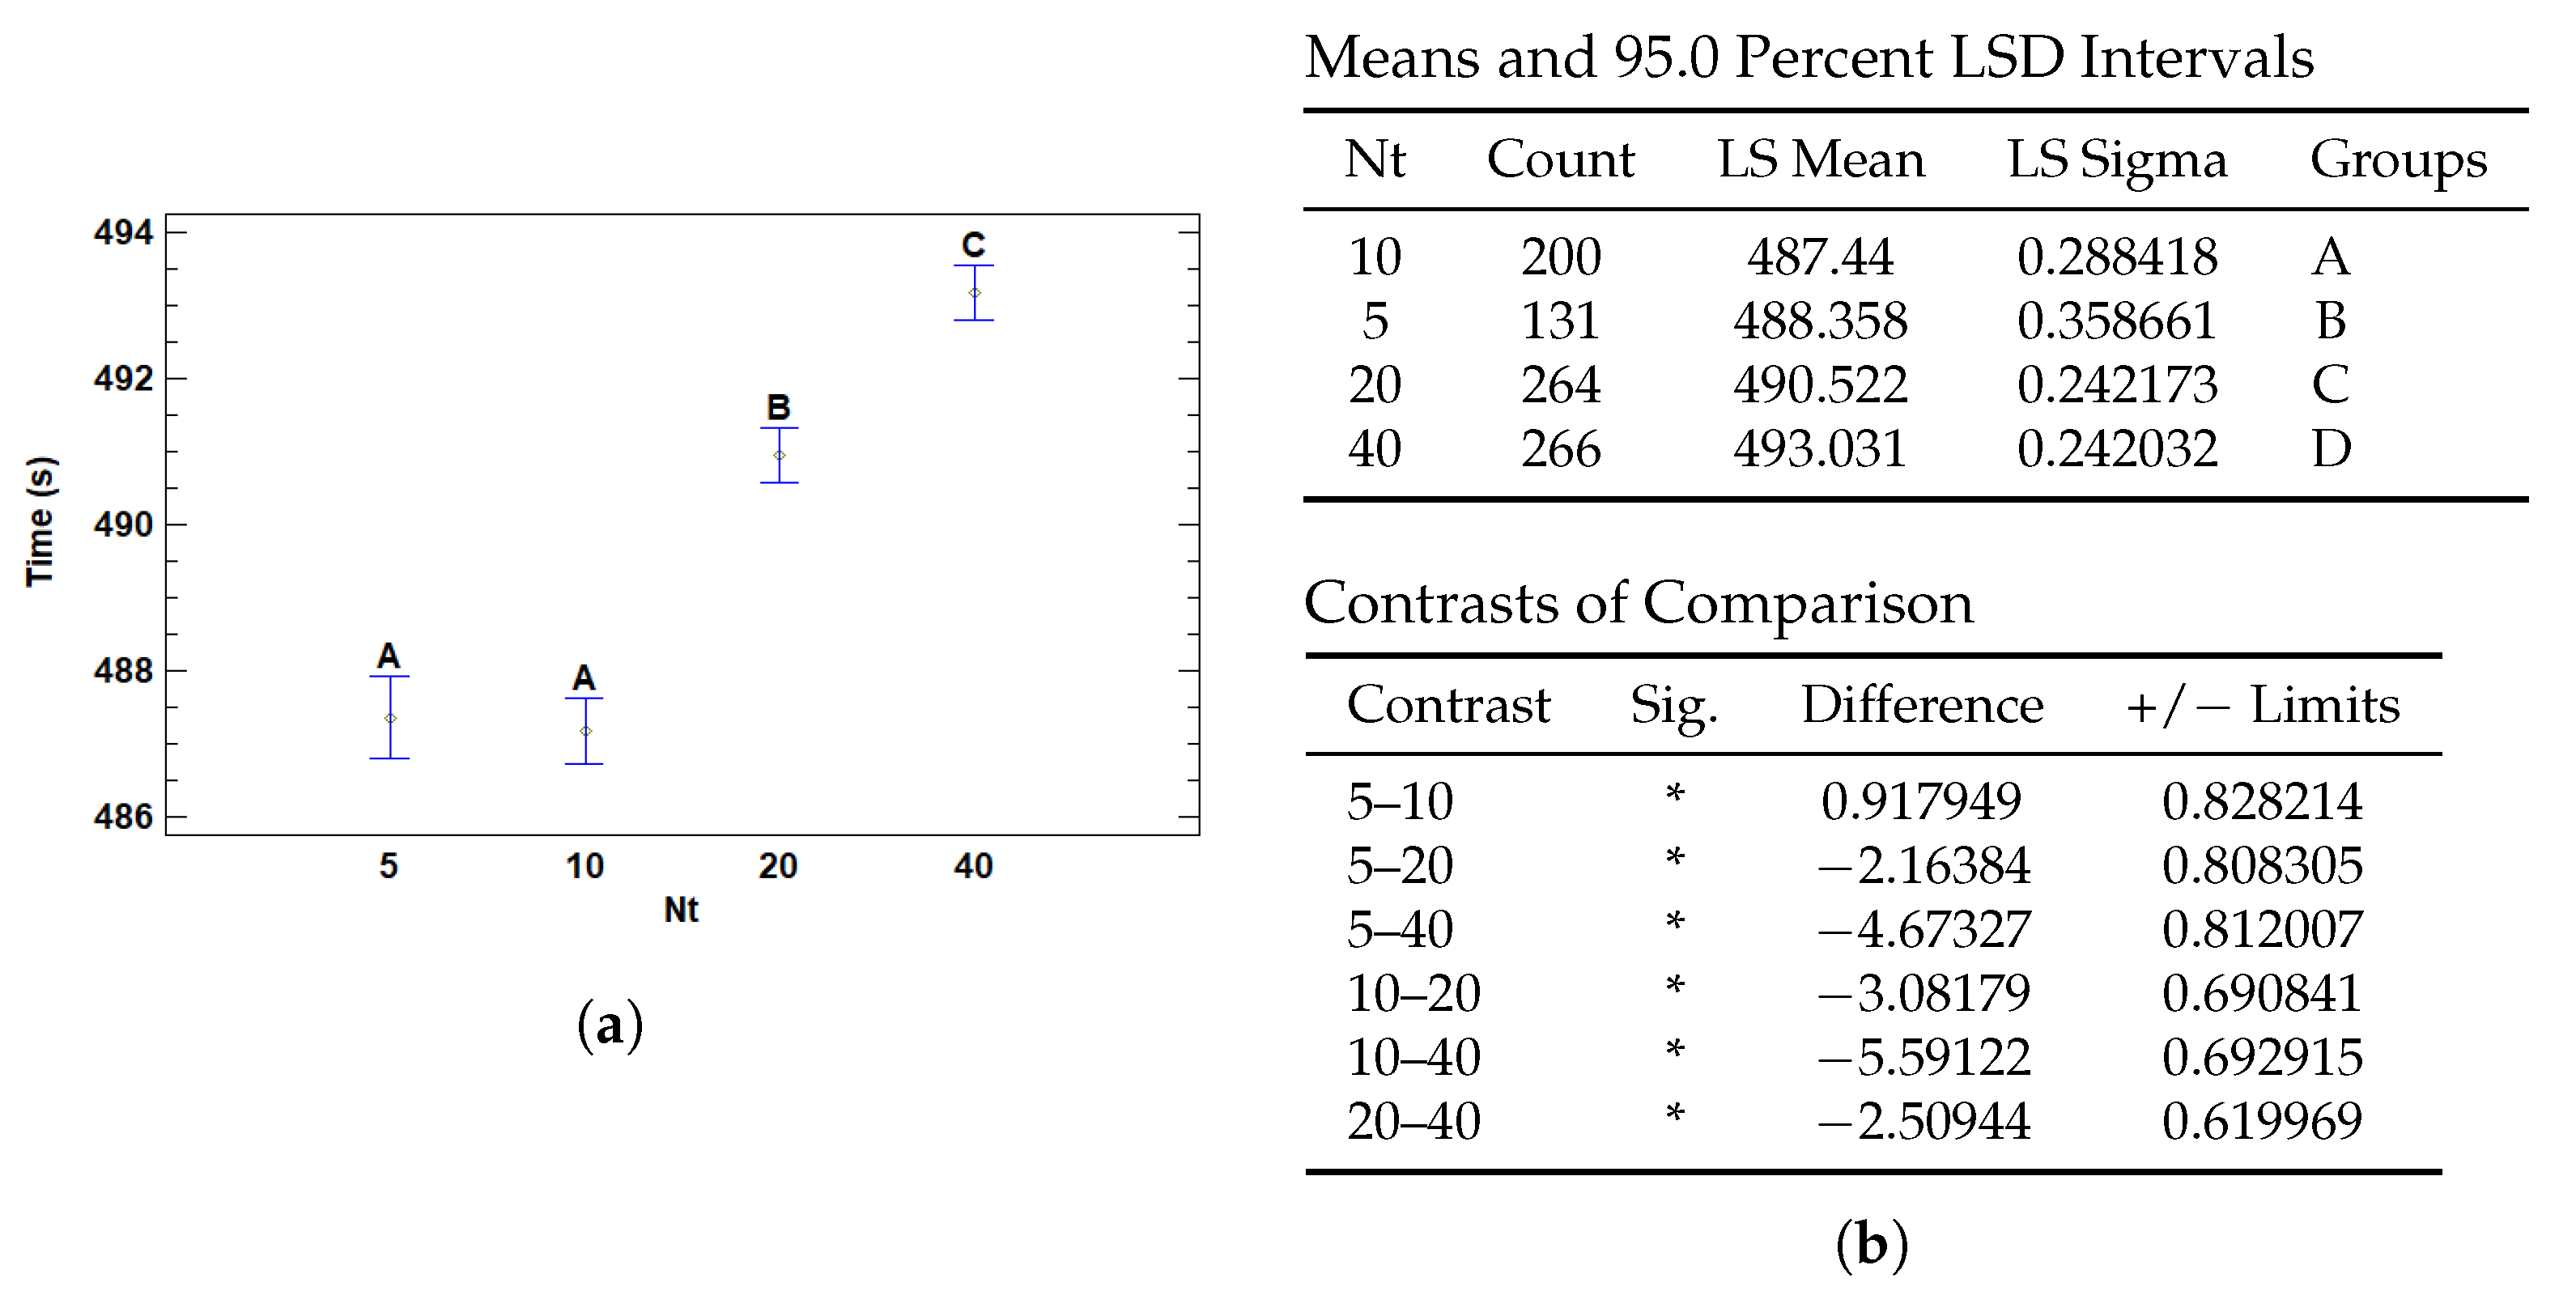
3.4.3. Multiple Range Tests for T (s) by Nt
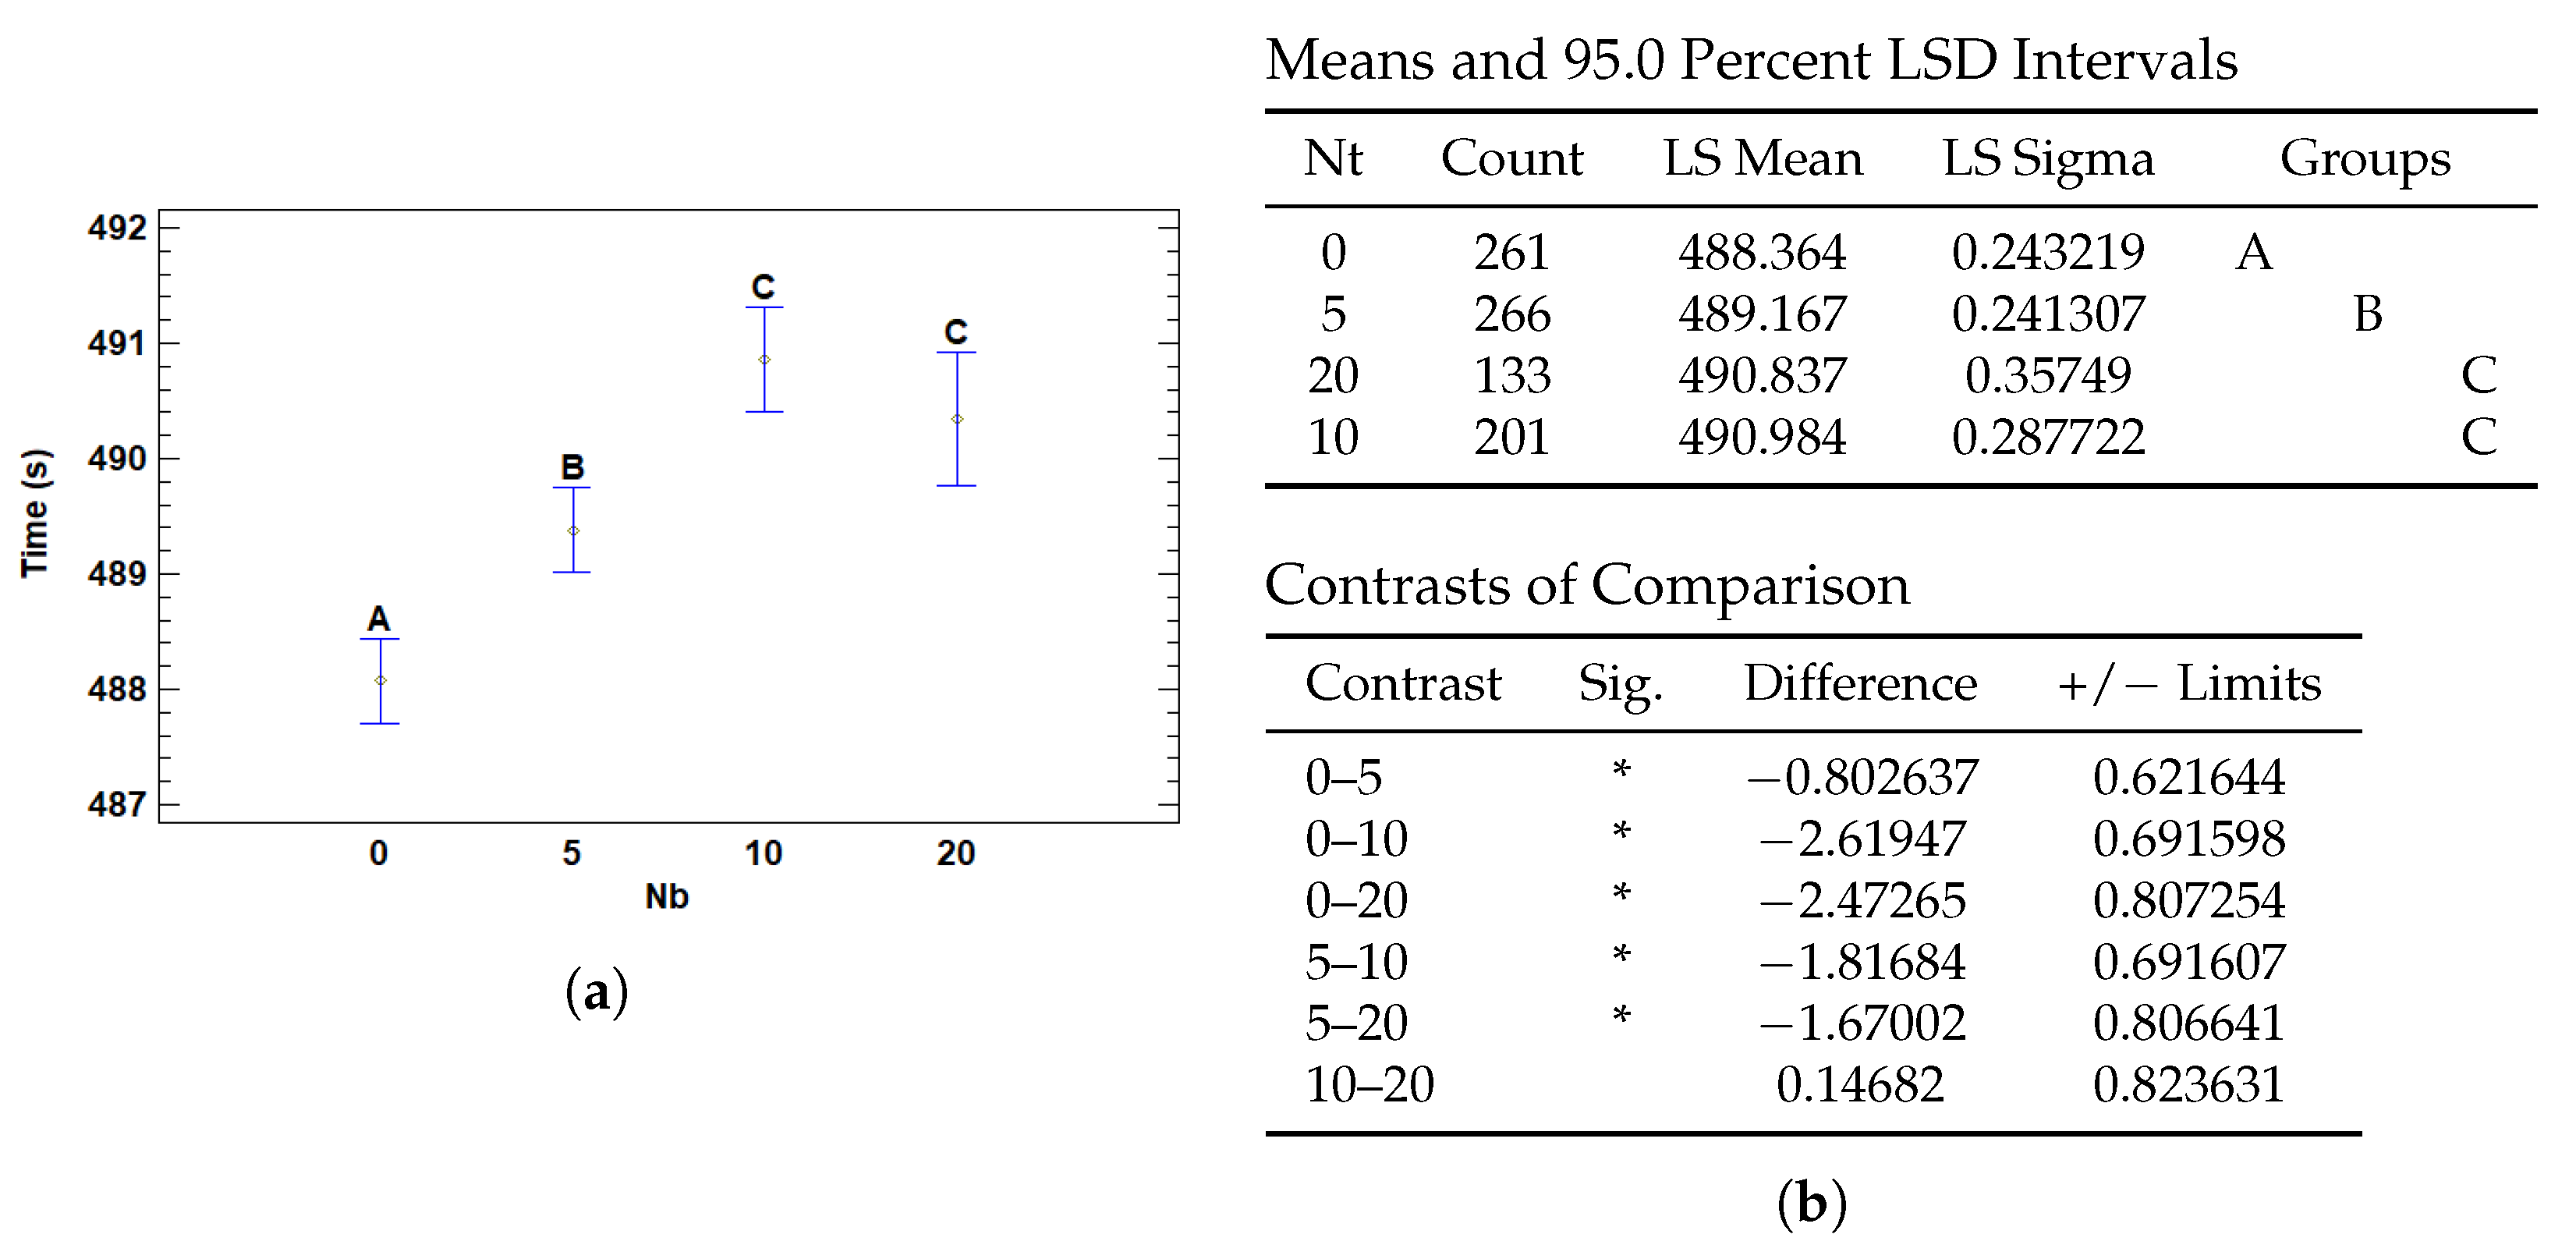
3.4.4. Multiple Range Tests for T (s) by Nb
4. Conclusions
Author Contributions
Funding
Institutional Review Board Statement
Informed Consent Statement
Data Availability Statement
Conflicts of Interest
References
- Bray, F.; Laversanne, M.; Sung, H.; Ferlay, J.; Siegel, R.L.; Soerjomataram, I.; Jemal, A. Global cancer statistics 2022: GLOBOCAN estimates of incidence and mortality worldwide for 36 cancers in 185 countries. CA Cancer J. Clin. 2024, 74, 229–263. [Google Scholar] [CrossRef] [PubMed]
- Mills, S. Histology for Pathologists; Wolters Kluwer: Alphen aan den Rijn, The Netherlands, 2019. [Google Scholar]
- Chan, J.K.C. The Wonderful Colors of the Hematoxylin–Eosin Stain in Diagnostic Surgical Pathology. Int. J. Surg. Pathol. 2014, 22, 12–32. [Google Scholar] [CrossRef] [PubMed]
- Farahani, N.; Parwani, A.; Pantanowitz, L. Whole slide imaging in pathology: Advantages, limitations, and emerging perspectives. Pathol. Lab. Med. Int. 2015, 7, 23–33. [Google Scholar] [CrossRef]
- Ghaznavi, F.; Evans, A.; Madabhushi, A.; Feldman, M. Digital Imaging in Pathology: Whole-Slide Imaging and Beyond. Annu. Rev. Pathol. Mech. Dis. 2013, 8, 331–359. [Google Scholar] [CrossRef]
- Jahn, S.; Plass, M.; Moinfar, F. Digital Pathology: Advantages, Limitations and Emerging Perspectives. J. Clin. Med. 2020, 9, 3697. [Google Scholar] [CrossRef]
- Kumar, N.; Gupta, R.; Gupta, S. Whole Slide Imaging (WSI) in Pathology: Current Perspectives and Future Directions. J. Digit. Imaging 2020, 33, 1034–1040. [Google Scholar] [CrossRef]
- Bera, K.; Schalper, K.; Rimm, D.; Velcheti, V.; Madabhushi, A. Artificial intelligence in digital pathology—New tools for diagnosis and precision oncology. Nat. Rev. Clin. Oncol. 2019, 16, 703–715. [Google Scholar] [CrossRef]
- Song, A.; Jaume, G.; Williamson, D.; Lu, M.Y.; Vaidya, A.; Miller, T.R.; Mahmood, F. Artificial intelligence for digital and computational pathology. Nat. Rev. Bioeng. 2023, 1, 930–949. [Google Scholar] [CrossRef]
- Cooper, M.; Ji, Z.; Krishnan, R.G. Machine learning in computational histopathology: Challenges and opportunities. Genes Chromosom. Cancer 2023, 62, 540–556. [Google Scholar] [CrossRef]
- Cui, M.; Zhang, D. Artificial intelligence and computational pathology. Lab. Investig. 2021, 101, 412–422. [Google Scholar] [CrossRef]
- Cruz-Roa, A.; Basavanhally, A.; González, F.; Gilmore, H.; Feldman, M.; Ganesan, S.; Shih, N.; Tomaszewski, J.; Madabhushi, A. Automatic detection of invasive ductal carcinoma in whole slide images with convolutional neural networks. In Proceedings of the Medical Imaging 2014: Digital Pathology, San Diego, CA, USA, 15–20 February 2014; Gurcan, M.N., Madabhushi, A., Eds.; International Society for Optics and Photonics, SPIE: Bellingham, WA, USA, 2014; Volume 9041, p. 904103. [Google Scholar] [CrossRef]
- Hou, L.; Samaras, D.; Kurc, T.; Gao, Y.; Davis, J.; Saltz, J. Patch-Based Convolutional Neural Network for Whole Slide Tissue Image Classification. In Proceedings of the 2016 IEEE Conference on Computer Vision and Pattern Recognition (CVPR), Las Vegas, NV, USA, 27–30 June 2016; Volume 2016. [Google Scholar] [CrossRef]
- Campanella, G.; Hanna, M.G.; Geneslaw, L.; Miraflor, A.; Werneck Krauss Silva, V.; Busam, K.J.; Brogi, E.; Reuter, V.E.; Klimstra, D.S.; Fuchs, T.J. Clinical-grade computational pathology using weakly supervised deep learning on whole slide images. Nat. Med. 2019, 25, 1301–1309. [Google Scholar] [CrossRef]
- Lu, M.Y.; Williamson, D.F.K.; Chen, T.Y.; Chen, R.J.; Barbieri, M.; Mahmood, F. Data-efficient and weakly supervised computational pathology on whole-slide images. Nat. Biomed. Eng. 2021, 5, 555–570. [Google Scholar] [CrossRef] [PubMed]
- Kanavati, F.; Toyokawa, G.; Momosaki, S.; Rambeau, M.; Kozuma, Y.; Shoji, F.; Yamazaki, K.; Takeo, S.; Iizuka, O.; Tsuneki, M. Weakly-supervised learning for lung carcinoma classification using deep learning. Sci. Rep. 2020, 10, 9297. [Google Scholar] [CrossRef] [PubMed]
- Carbonneau, M.A.; Cheplygina, V.; Granger, E.; Gagnon, G. Multiple instance learning: A survey of problem characteristics and applications. Pattern Recognit. 2018, 77, 329–353. [Google Scholar] [CrossRef]
- Ilse, M.; Tomczak, J.M.; Welling, M. Attention-based Deep Multiple Instance Learning. arXiv 2018, arXiv:1802.04712. [Google Scholar] [CrossRef]
- Schirris, Y.; Gavves, E.; Nederlof, I.; Horlings, H.M.; Teuwen, J. DeepSMILE: Contrastive self-supervised pre-training benefits MSI and HRD classification directly from H&E whole-slide images in colorectal and breast cancer. Med. Image Anal. 2022, 79, 102464. [Google Scholar] [CrossRef]
- Shao, Z.; Bian, H.; Chen, Y.; Wang, Y.; Zhang, J.; Ji, X.; Zhang, Y. TransMIL: Transformer based Correlated Multiple Instance Learning for Whole Slide Image Classication. arXiv 2021, arXiv:2106.00908. [Google Scholar]
- Naik, N.; Madani, A.; Esteva, A.; Keskar, N.S.; Press, M.F.; Ruderman, D.; Agus, D.B.; Socher, R. Deep learning-enabled breast cancer hormonal receptor status determination from base-level H&E stains. Nat. Commun. 2020, 11, 5727. [Google Scholar] [CrossRef]
- Li, J.; Li, W.; Sisk, A.; Ye, H.; Wallace, W.D.; Speier, W.; Arnold, C.W. A multi-resolution model for histopathology image classification and localization with multiple instance learning. Comput. Biol. Med. 2021, 131, 104253. [Google Scholar] [CrossRef]
- Ho, J.; Parwani, A.; Jukic, D.; Yagi, Y.; Anthony, L.; Gilbertson, J. Use of whole slide imaging in surgical pathology quality assurance: Design and pilot validation studies. Hum. Pathol. 2006, 37, 322–331. [Google Scholar] [CrossRef]
- Wang, D.; Khosla, A.; Gargeya, R.; Irshad, H.; Beck, A.H. Deep Learning for Identifying Metastatic Breast Cancer. arXiv 2016, arXiv:1606.05718. [Google Scholar] [CrossRef]
- Sandarenu, P.; Millar, E.K.A.; Song, Y.; Browne, L.; Beretov, J.; Lynch, J.; Graham, P.H.; Jonnagaddala, J.; Hawkins, N.; Huang, J.; et al. Survival prediction in triple negative breast cancer using multiple instance learning of histopathological images. Sci. Rep. 2022, 12, 14527. [Google Scholar] [CrossRef] [PubMed]
- Durand, T.; Thome, N.; Cord, M. WELDON: Weakly Supervised Learning of Deep Convolutional Neural Networks. In Proceedings of the 2016 IEEE Conference on Computer Vision and Pattern Recognition (CVPR), Las Vegas, NV, USA, 27–30 June 2016; pp. 4743–4752. [Google Scholar] [CrossRef]
- Courtiol, P.; Tramel, E.; Sanselme, M.; Wainrib, G. Classification and Disease Localization in Histopathology Using Only Global Labels: A Weakly-Supervised Approach. arXiv 2018, arXiv:1802.02212. [Google Scholar] [CrossRef]
- Fisher, R.A. Statistical Methods for Research Workers. In Breakthroughs in Statistics: Methodology and Distribution; Kotz, S., Johnson, N.L., Eds.; Springer: New York, NY, USA, 1992; pp. 66–70. [Google Scholar] [CrossRef]
- Brancati, N.; Anniciello, A.M.; Pati, P.; Riccio, D.; Scognamiglio, G.; Jaume, G.; De Pietro, G.; Di Bonito, M.; Foncubierta, A.; Botti, G.; et al. BRACS: A Dataset for BReAst Carcinoma Subtyping in H&E Histology Images. Database 2022, 2022, baac093. [Google Scholar] [CrossRef]
- He, K.; Zhang, X.; Ren, S.; Sun, J. Deep Residual Learning for Image Recognition. In Proceedings of the 2016 IEEE Conference on Computer Vision and Pattern Recognition (CVPR), Las Vegas, NV, USA, 27–30 June 2016; pp. 770–778. [Google Scholar] [CrossRef]
- Filiot, A.; Ghermi, R.; Olivier, A.; Jacob, P.; Fidon, L.; Kain, A.M.; Saillard, C.; Schiratti, J.B. Scaling Self-Supervised Learning for Histopathology with Masked Image Modeling. medRxiv 2023. [Google Scholar] [CrossRef]
- Aslam, M. Introducing Grubbs’s test for detecting outliers under neutrosophic statistics—An application to medical data. J. King Saud Univ.-Sci. 2020, 32, 2696–2700. [Google Scholar] [CrossRef]


| Source | Sum of Squares | Df | Mean Square | F-Ratio | p-Value |
|---|---|---|---|---|---|
| Main Effects | |||||
| A: Wd | 0.000697502 | 1 | 0.000697502 | 0.20 | 0.6566 |
| B: Ly | 0.224158 | 2 | 0.112079 | 31.76 | 0.0000 |
| C: Nt | 0.054888 | 3 | 0.018296 | 5.19 | 0.0015 |
| D: Nb | 0.0474815 | 3 | 0.0158272 | 4.49 | 0.0039 |
| E: Dp | 0.105687 | 2 | 0.0528436 | 14.98 | 0.0000 |
| Residual | 2.99578 | 849 | 0.0035286 | ||
| Total | 3.47639 | 860 |
| Factor | Level | Mean | Stnd. Error | Lower Limit | Upper Limit |
|---|---|---|---|---|---|
| Grand Mean | 0.627367 | ||||
| Wd | 0.0 | 0.626161 | 0.00472293 | 0.616904 | 0.635418 |
| 0.1 | 0.628573 | 0.0026989 | 0.623283 | 0.633863 | |
| Ly | 1 | 0.637587 | 0.00451719 | 0.628734 | 0.646441 |
| 2 | 0.64099 | 0.0035045 | 0.634121 | 0.647859 | |
| 3 | 0.603523 | 0.0043575 | 0.594983 | 0.612064 | |
| Nt | 5 | 0.61195 | 0.00585394 | 0.600476 | 0.623423 |
| 10 | 0.626973 | 0.00470746 | 0.617747 | 0.6362 | |
| 20 | 0.638034 | 0.00395267 | 0.630287 | 0.645781 | |
| 40 | 0.63251 | 0.00395036 | 0.624768 | 0.640253 | |
| Nb | 0 | 0.619712 | 0.00396973 | 0.611932 | 0.627493 |
| 5 | 0.629603 | 0.00393853 | 0.621884 | 0.637323 | |
| 10 | 0.639035 | 0.00469609 | 0.629831 | 0.648239 | |
| 20 | 0.621117 | 0.00583483 | 0.609681 | 0.632553 | |
| Dp | 0.2 | 0.636045 | 0.00393442 | 0.628334 | 0.643757 |
| 0.5 | 0.634461 | 0.0039388 | 0.626741 | 0.642181 | |
| 0.8 | 0.611594 | 0.00399077 | 0.603773 | 0.619416 |
| Source | Sum of Squares | Df | Mean Square | F-Ratio | p-Value |
|---|---|---|---|---|---|
| Main Effects | |||||
| A: Wd | 0.0720822 | 1 | 0.0720822 | 0.66 | 0.4148 |
| B: Ly | 0.417128 | 2 | 0.208564 | 1.92 | 0.1467 |
| C: Nt | 2.40306 | 3 | 0.801019 | 7.39 | 0.0001 |
| D: Nb | 1.54485 | 3 | 0.514949 | 4.75 | 0.0027 |
| E: Dp | 0.145252 | 2 | 0.0726261 | 0.67 | 0.5120 |
| Residual | 92.0456 | 849 | 0.108417 | ||
| Total | 97.7375 | 860 |
| Factor | Level | Mean | Stnd. Error | Lower Limit | Upper Limit |
|---|---|---|---|---|---|
| Grand Mean | 1.71032 | ||||
| Wd | 0.0 | 1.69806 | 0.0261793 | 1.64675 | 1.74937 |
| 0.1 | 1.72258 | 0.0149601 | 1.69326 | 1.7519 | |
| Ly | 1 | 1.67482 | 0.0250389 | 1.62575 | 1.7239 |
| 2 | 1.73297 | 0.0194255 | 1.6949 | 1.77105 | |
| 3 | 1.72316 | 0.0241537 | 1.67582 | 1.7705 | |
| Nt | 5 | 1.62004 | 0.0324485 | 1.55644 | 1.68363 |
| 10 | 1.69059 | 0.0260935 | 1.63944 | 1.74173 | |
| 20 | 1.78612 | 0.0219098 | 1.74318 | 1.82907 | |
| 40 | 1.74454 | 0.021897 | 1.70162 | 1.78745 | |
| Nb | 0 | 1.6471 | 0.0220043 | 1.60397 | 1.69023 |
| 5 | 1.72697 | 0.0218313 | 1.68418 | 1.76975 | |
| 10 | 1.75967 | 0.0260306 | 1.70865 | 1.81069 | |
| 20 | 1.70754 | 0.0323426 | 1.64415 | 1.77093 | |
| Dp | 0.2 | 1.70784 | 0.0218086 | 1.66509 | 1.75058 |
| 0.5 | 1.72737 | 0.0218329 | 1.68458 | 1.77016 | |
| 0.8 | 1.69576 | 0.0221209 | 1.6524 | 1.73911 |
| Source | Sum of Squares | Df | Mean Square | F-Ratio | p-Value |
|---|---|---|---|---|---|
| Main Effects | |||||
| A: Wd | 271.83 | 1 | 271.83 | 20.52 | 0.0000 |
| B: Ly | 1087.5 | 2 | 543.749 | 41.05 | 0.0000 |
| C: Nt | 3696.49 | 3 | 1232.16 | 93.02 | 0.0000 |
| D: Nb | 914.478 | 3 | 304.826 | 23.01 | 0.0000 |
| E: Dp | 10.8907 | 2 | 5.44534 | 0.41 | 0.6630 |
| Residual | 11,245.6 | 849 | 13.2457 | ||
| Total (Corrected) | 19,650.1 | 860 |
| Factor | Level | Mean | Stnd. Error | Lower Limit | Upper Limit |
|---|---|---|---|---|---|
| Grand Mean | 489.838 | ||||
| Wd | 0.0 | 489.085 | 0.289366 | 488.518 | 489.652 |
| 0.1 | 490.591 | 0.165357 | 490.267 | 490.915 | |
| Ly | 1 | 488.844 | 0.27676 | 488.302 | 489.386 |
| 2 | 489.113 | 0.214715 | 488.692 | 489.534 | |
| 3 | 491.557 | 0.266977 | 491.033 | 492.08 | |
| Nt | 5 | 488.358 | 0.358661 | 487.655 | 489.061 |
| 10 | 487.44 | 0.288418 | 486.875 | 488.005 | |
| 20 | 490.522 | 0.242173 | 490.047 | 490.996 | |
| 40 | 493.031 | 0.242032 | 492.557 | 493.506 | |
| Nb | 0 | 488.364 | 0.243219 | 487.887 | 488.841 |
| 5 | 489.167 | 0.241307 | 488.694 | 489.64 | |
| 10 | 490.984 | 0.287722 | 490.42 | 491.547 | |
| 20 | 490.837 | 0.35749 | 490.136 | 491.537 | |
| Dp | 0.2 | 489.701 | 0.241055 | 489.228 | 490.173 |
| 0.5 | 489.974 | 0.241324 | 489.501 | 490.447 | |
| 0.8 | 489.839 | 0.244507 | 489.359 | 490.318 |
Disclaimer/Publisher’s Note: The statements, opinions and data contained in all publications are solely those of the individual author(s) and contributor(s) and not of MDPI and/or the editor(s). MDPI and/or the editor(s) disclaim responsibility for any injury to people or property resulting from any ideas, methods, instructions or products referred to in the content. |
© 2025 by the authors. Licensee MDPI, Basel, Switzerland. This article is an open access article distributed under the terms and conditions of the Creative Commons Attribution (CC BY) license (https://creativecommons.org/licenses/by/4.0/).
Share and Cite
Hernandez, N.; Carrillo-Perez, F.; Ortuño, F.M.; Rojas, I.; Valenzuela, O. Understanding the Impact of Deep Learning Model Parameters on Breast Cancer Histopathological Classification Using ANOVA. Cancers 2025, 17, 1425. https://doi.org/10.3390/cancers17091425
Hernandez N, Carrillo-Perez F, Ortuño FM, Rojas I, Valenzuela O. Understanding the Impact of Deep Learning Model Parameters on Breast Cancer Histopathological Classification Using ANOVA. Cancers. 2025; 17(9):1425. https://doi.org/10.3390/cancers17091425
Chicago/Turabian StyleHernandez, Nerea, Francisco Carrillo-Perez, Francisco M. Ortuño, Ignacio Rojas, and Olga Valenzuela. 2025. "Understanding the Impact of Deep Learning Model Parameters on Breast Cancer Histopathological Classification Using ANOVA" Cancers 17, no. 9: 1425. https://doi.org/10.3390/cancers17091425
APA StyleHernandez, N., Carrillo-Perez, F., Ortuño, F. M., Rojas, I., & Valenzuela, O. (2025). Understanding the Impact of Deep Learning Model Parameters on Breast Cancer Histopathological Classification Using ANOVA. Cancers, 17(9), 1425. https://doi.org/10.3390/cancers17091425