Article

Prognostic Value of SOX2 and NANOG Expression in Recurrent Oral Squamous Cell Carcinoma

1
Department of Oral and Maxillofacial Surgery, Head and Neck Cancer Center, University Hospital Schleswig-Holstein, 23562 Lübeck, Germany
2
Department of Internal Medicine II, Klinikum Rechts der Isar, TUM School of Medicine and Health, Technical University of Munich, 81675 Munich, Germany
3
Derby Clinical Trials Support Unit, University Hospitals of Derby and Burton NHS Foundation Trust, Derby DE22 3NE, UK
4
Institute of Pathology, University Hospital Schleswig-Holstein, 23562 Lübeck, Germany
5
Department of Radiation Oncology, University Hospital Schleswig-Holstein, 23562 Lübeck, Germany
6
Department of Oral and Maxillofacial Surgery, Helios Medical Center Schwerin, 19055 Schwerin, Germany
*
Author to whom correspondence should be addressed.
Cancers 2025, 17(7), 1181; https://doi.org/10.3390/cancers17071181
Submission received: 4 March 2025 / Revised: 18 March 2025 / Accepted: 26 March 2025 / Published: 31 March 2025
(This article belongs to the Special Issue Head and Neck Cancer Metastases)

Simple Summary

Recurrent oral squamous cell carcinoma often leads to poor outcomes and limited treatment options. In this study, we examined two proteins, SOX2 and NANOG, which are involved in the growth and survival of cancer stem cells. We analyzed tumor samples from 94 patients to assess how the levels of these proteins change between the primary tumor and the recurrence, and whether these changes are linked to patient survival. We found that higher levels of SOX2 in recurrent tumors were associated with better survival. In contrast, NANOG levels decreased in recurrent tumors, especially in patients treated with surgery alone, but this decrease was not significantly associated with survival outcomes. These findings suggest that SOX2 could serve as a valuable marker for predicting prognosis in patients with recurrent oral squamous cell carcinoma. Identifying such markers may support more personalized treatment decisions and ultimately improve care for patients facing this aggressive disease.

Abstract

Background: Recurrent oral squamous cell carcinoma (re-OSCC) poses a serious therapeutic challenge and is linked to poor survival outcomes. SOX2 and NANOG, key transcription factors in cancer stem cell biology, may drive tumor progression and therapy resistance. However, their prognostic value in re-OSCC and their relationship to adjuvant therapy remain unclear. Methods: We retrospectively analyzed a single-center cohort of 94 patients with re-OSCC treated with curative intent via (1) surgery alone, (2) surgery plus adjuvant radiotherapy (RT), or (3) surgery plus adjuvant radiochemotherapy (RCT). Tissue microarrays (TMAs) were constructed from matched primary and recurrent tumors and immunohistochemical (IHC) staining for SOX2, and NANOG was quantified using H-scores. Post-recurrence overall survival (prOS) and post-recurrence disease-free survival (prDFS) were evaluated using Kaplan–Meier analysis and Cox proportional hazards models. Results: SOX2 expression and survival: Elevated SOX2 expression (H-score > 14) in re-OSCC was significantly associated with improved prOS (p = 0.013) and prDFS (p = 0.026). Notably, patients who had received adjuvant therapy (particularly RCT) showed higher SOX2 levels in recurrent tumors compared to those treated with surgery alone. NANOG expression and therapy: NANOG expression declined markedly from primary to recurrent tumors (median H-score 42.2 vs. 8.7; p < 0.001). This decline was most pronounced in patients treated with surgery alone. Despite this dynamic change, NANOG expression did not correlate significantly with prOS or prDFS. Other prognostic factors include advanced tumor stage (rT2–rT4) and lymph node involvement (rN+/x)m which remained significant predictors of worse survival in the recurrent setting, regardless of adjuvant therapy. Conclusion: SOX2 overexpression in re-OSCC correlates with better survival, suggesting a unique prognostic role distinct from primary disease. Adjuvant therapy, especially RCT, appears to maintain or elevate SOX2 levels, potentially contributing to improved treatment response. In contrast, although NANOG expression decreases in recurrence, particularly in patients who undergo surgery alone, it does not significantly affect survival outcomes. These findings underscore the importance of context-specific biomarker assessments and provide a rationale for incorporating SOX2 status into personalized treatment strategies for re-OSCC.

1. Introduction

Oral squamous cell carcinoma (OSCC) is a prevalent and aggressive cancer type, which comprises about 90% of all malignancies in the oral cavity [1]. Despite the progress made in treatment strategies, OSCC continues to be associated with poor survival outcomes and high recurrence rates, underscoring the necessity of dependable prognostic biomarkers to enhance patient management [2,3].
In contrast to primary tumors, recurrent OSCC (re-OSCC) presents a distinctive set of challenges. The mechanisms that drive recurrence are not completely understood and the biology of recurrent tumors can differ significantly from that of the primary tumor [4]. The occurrence of lymph node metastases in the neck in oral cancer is associated with a worse prognosis, complicating the management of re-OSCC [5,6]. Higher tumor depth of invasion (DOI) is associated with a greater chance of lymph node metastasis, recurrence, and lower survival chances in early-stage oral squamous cell carcinoma [7]. Patients with re-OSCC frequently encounter limited therapy alternatives and reduced survival rates, necessitating an understanding of the expression patterns of these markers in recurrent illness [8]. As a result, the therapeutic strategies employed for re-OSCC are distinct from those employed for primary malignancies. Although surgical resection is the standard approach to initial OSCC management, recurrent cases frequently necessitate multimodal strategies, such as salvage surgery, re-irradiation, chemotherapy, or targeted therapies, that are tailored to the tumor’s changing biology and the patient’s previous treatments [9,10,11].
Re-OSCC frequently exhibits distinct biological characteristics compared to primary tumors, including increased resistance to apoptosis, enhanced invasiveness and alterations in gene expression, which contribute to its more aggressive nature [9,12,13]. Borsetto et al. examined key prognostic factors in the locoregional recurrence of OSCC, demonstrating that tumor size at initial diagnosis, the extent of recurrent disease, and positive surgical margins at primary surgery are strong predictors of poor overall survival [14]. Their results underscore the clinical challenge of re-OSCC, as patients with extensive locoregional recurrence have a substantially shorter survival rate than those with isolated local recurrence [15].
Cancer stem cells (CSCs) have emerged as key participants in tumor initiation, development, metastasis, and recurrence. These cells have self-renewal capacities and the ability to differentiate into various tumor types, making them important targets for therapeutic intervention [16]. Abnormal expression of transcription factors SOX2 (SRY-related HMG-box gene 2), NANOG, and OCT4 is known to have different functions in tumor initiation and metastasis [17,18,19,20]. NANOG is critical for maintaining CSC self-renewal, regulating cell proliferation via cyclin D interactions, decreasing E-cadherin to increase migration and disrupting p53 to avoid apoptosis [21]. SOX2, located on 3q26.3–q27, is identified as a major oncogene in OSCC [13], associated with tumor proliferation, metastasis, therapeutic resistance, and the facilitation of epithelial–mesenchymal transition (EMT) [17,22,23].
High expression of these markers is frequently related to higher tumor aggressiveness and poor clinical outcomes [12,24]. The significance of SOX2 in radioresistance is intricate, with research yielding conflicting results. Some study indicates that SOX2 amplifies the effects of irradiation, resulting in a better prognosis for patients receiving radiotherapy, whereas other evidence suggests that suppressing SOX2 may generate a radioresistant phenotype [25]. Nanog signaling augments radioresistance in ALDH-positive breast cancer cells by increasing ALDH activity and promoting double-strand break (DSB) repair, possibly through the Notch1 and Akt pathways [26]. While the involvement of SOX2 and NANOG in primary OSCC has been explored [4,11,13,27,28,29,30], their prognostic significance in re-OSCC remains largely understudied.
The purpose of this study is to examine the expression patterns of SOX2 and NANOG in both primary and re-OSCC, with an emphasis on how adjuvant therapy affects their expression dynamics. Furthermore, we evaluate the prognostic importance of these markers by examining their expression in re-OSCC and their relationship with post-recurrence overall survival (prOS) and post-recurrence disease-free survival (prDFS) in a well-defined, prospectively collected single-center cohort. This study seeks to improve risk assessment and facilitate the development of customized treatment regimens for patients with re-OSCC by clarifying the roles of SOX2 and NANOG in OSCC progression and medication response.

2. Methods

2.1. Patient Cohort

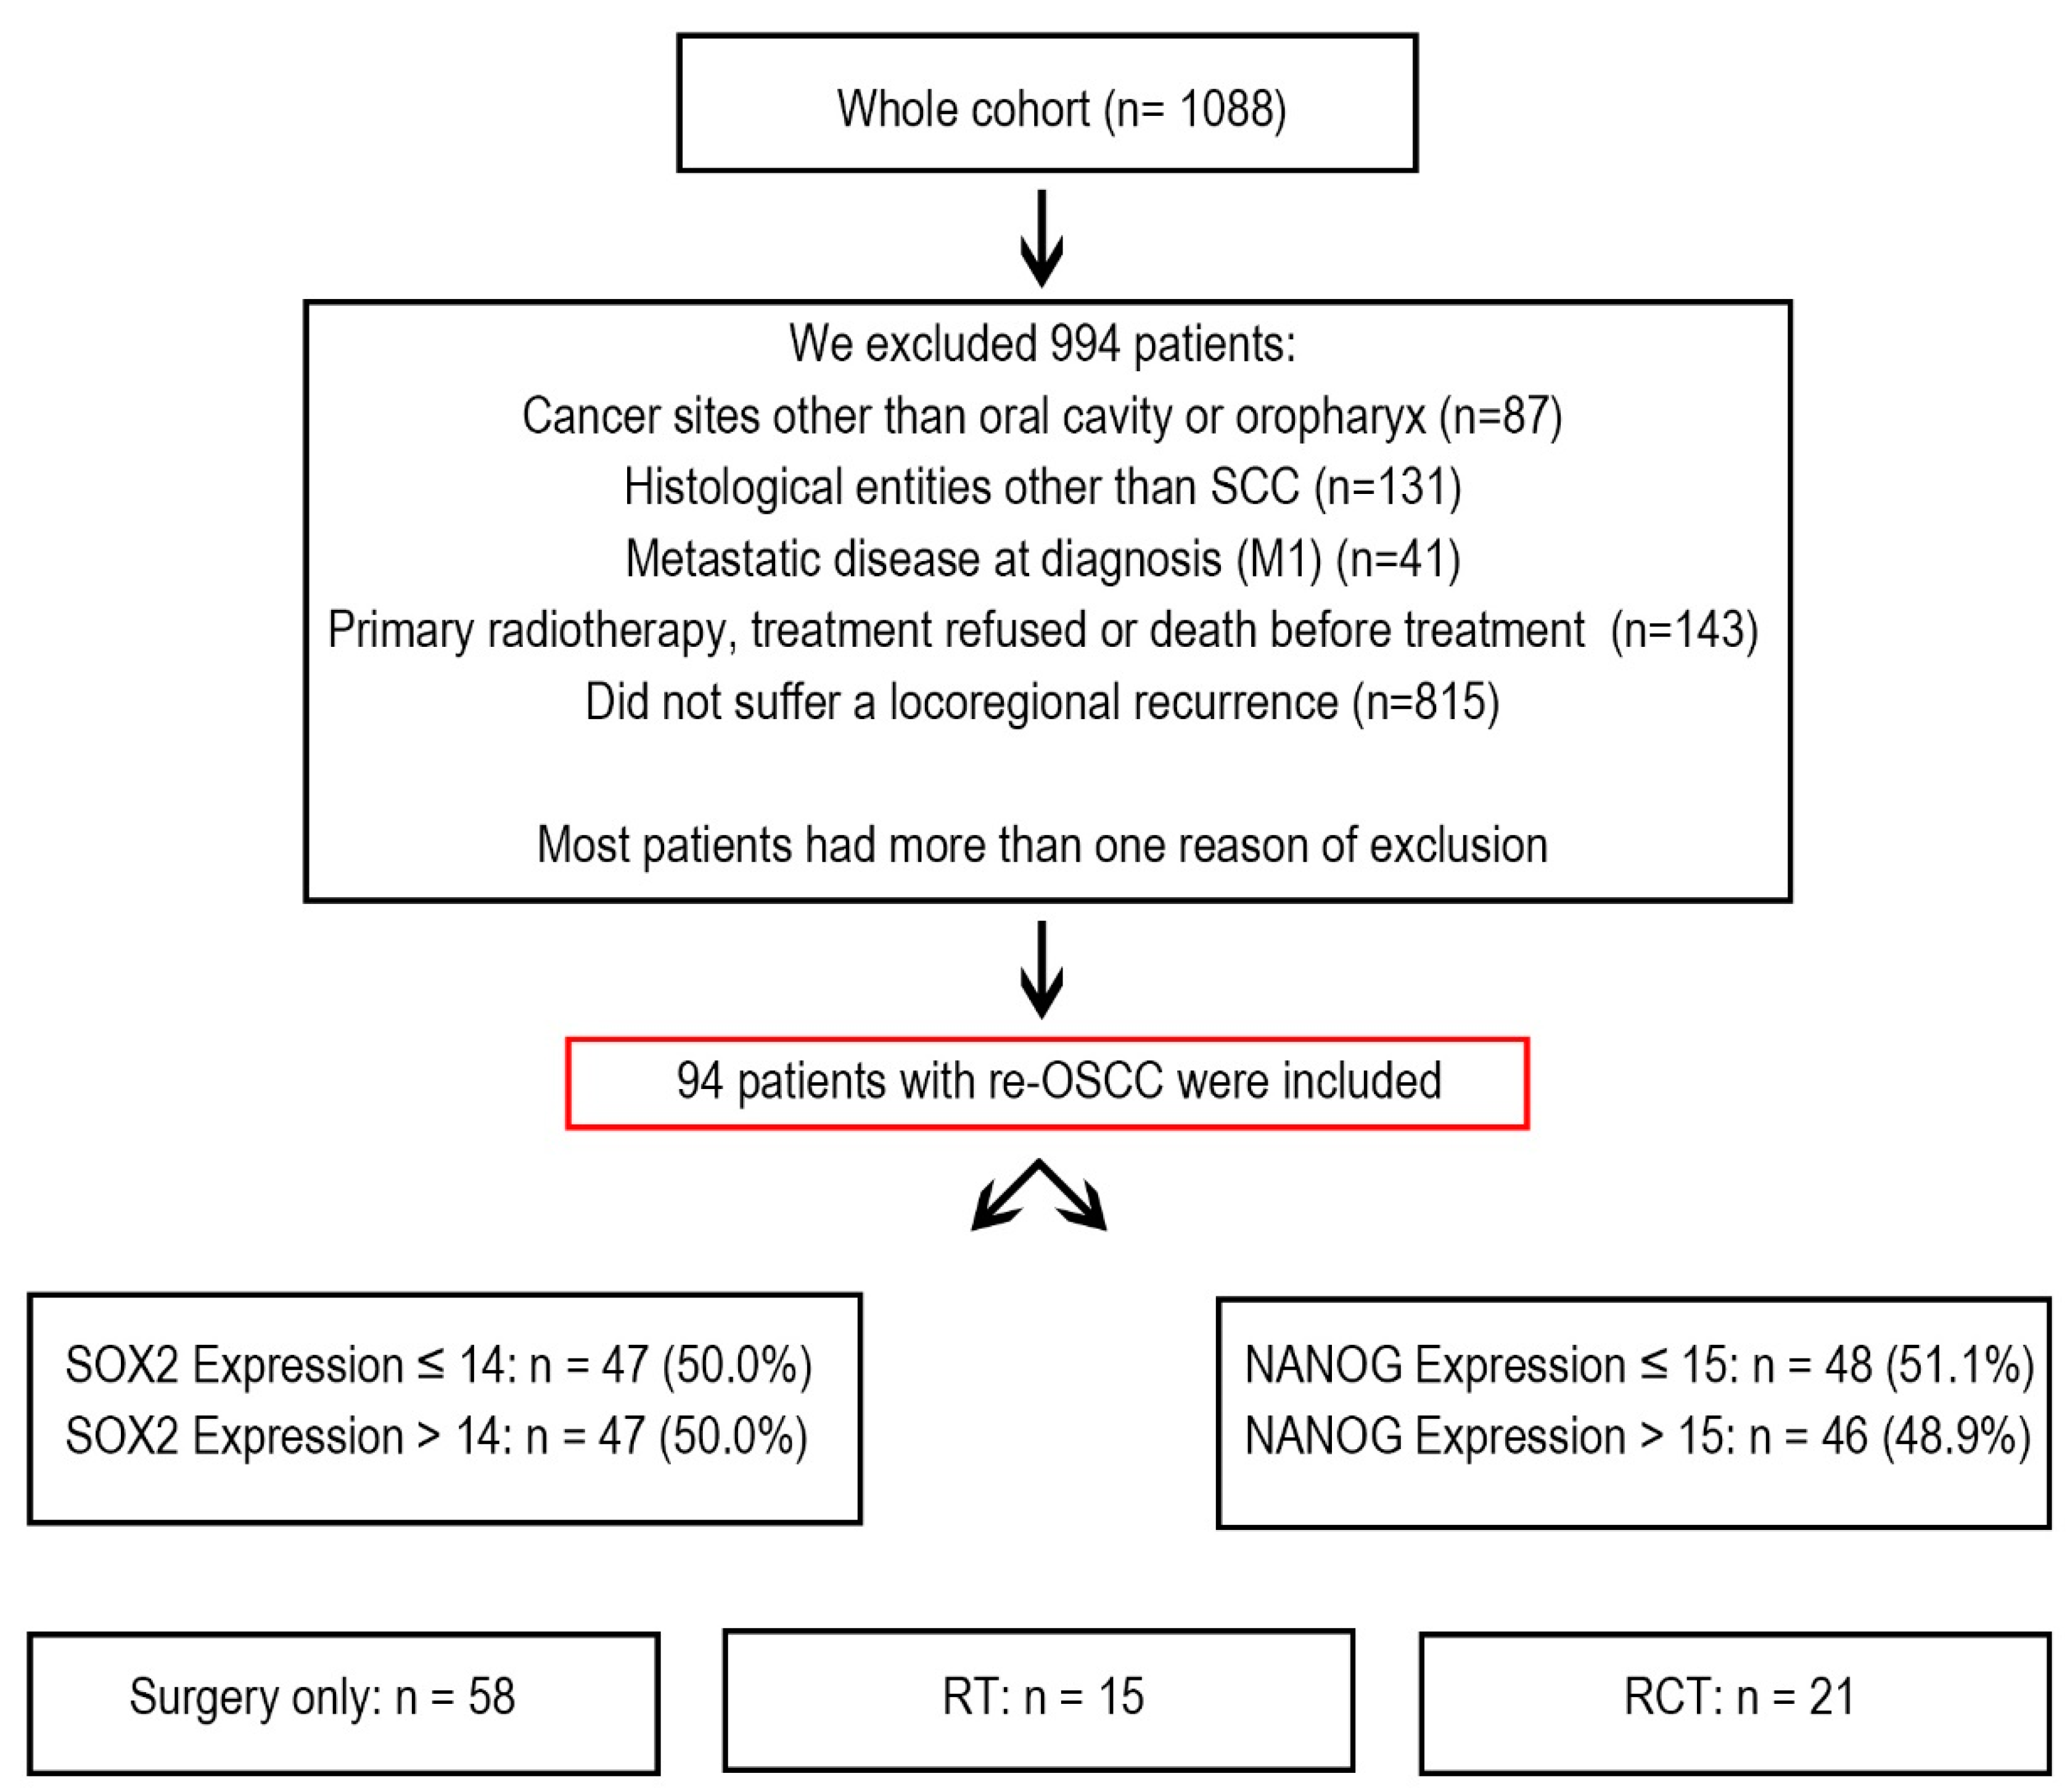
Between 1992 and 2019, the Department of Maxillofacial Surgery at the University Medical Centre of Lübeck in Germany treated 1088 cancer patients. From this group, we selected 94 patients who developed re-OSCC and underwent treatment with curative intent. These patients underwent multiple treatments, including surgery, radiotherapy (RT), chemoradiotherapy (RCT), or a combination of these (Figure 1).
Patients were excluded if they had oropharyngeal carcinoma, a histological diagnosis other than squamous cell carcinoma, metastatic disease at the time of diagnosis, or if they declined treatment or passed away before therapy could begin. Additionally, patients who did not develop locoregional recurrence were excluded from the study.
All eligible patients were registered in a structured recall system to ensure continuous follow-up for five years after treatment. Follow-up appointments were scheduled every three months for the first two years, then every six months following. At each visit, demographic information, risk factors, clinical tumor features, and therapy details were carefully documented. Each patient’s general health state was assessed using the Charlson Comorbidity Index (CCI) [31], incorporating tumor staging and additional prognostic variables into the cohort analysis [32].

Tissue Microarray and Immunohistochemical Staining

Before analysis, each tissue punch was visually inspected for tissue folds, staining artifacts, low tissue quality, or insufficient tumor content. Any punches that did not meet quality standards were excluded.
Tissue microarrays (TMAs) were constructed using a manual Tissue Arrayer MTA-1 (AlphaMetrix Biotech, Rödermark, Germany). Tumor regions from formalin-fixed, paraffin-embedded (FFPE) tissue blocks were cut out using 1.2 mm punches and subsequently transferred to recipient blocks. To guarantee the precise representation of intratumoral intricacy, three punches from each tissue block were incorporated into the TMAs. The recipient blocks were sliced to a thickness of 4 μm using a Microm HM355S microtome (Thermo Scientific, Boston, MA, USA). The slices were subsequently positioned on slides, immersed in a 50 °C water bath and incubated in a 60 °C hot air oven for 1 h prior to additional processing. Immunohistochemical (IHC) staining protocols were modified from prior studies and refined with positive and negative controls to guarantee dependable outcomes [32]. Antibodies used in the study are listed in Table 1.
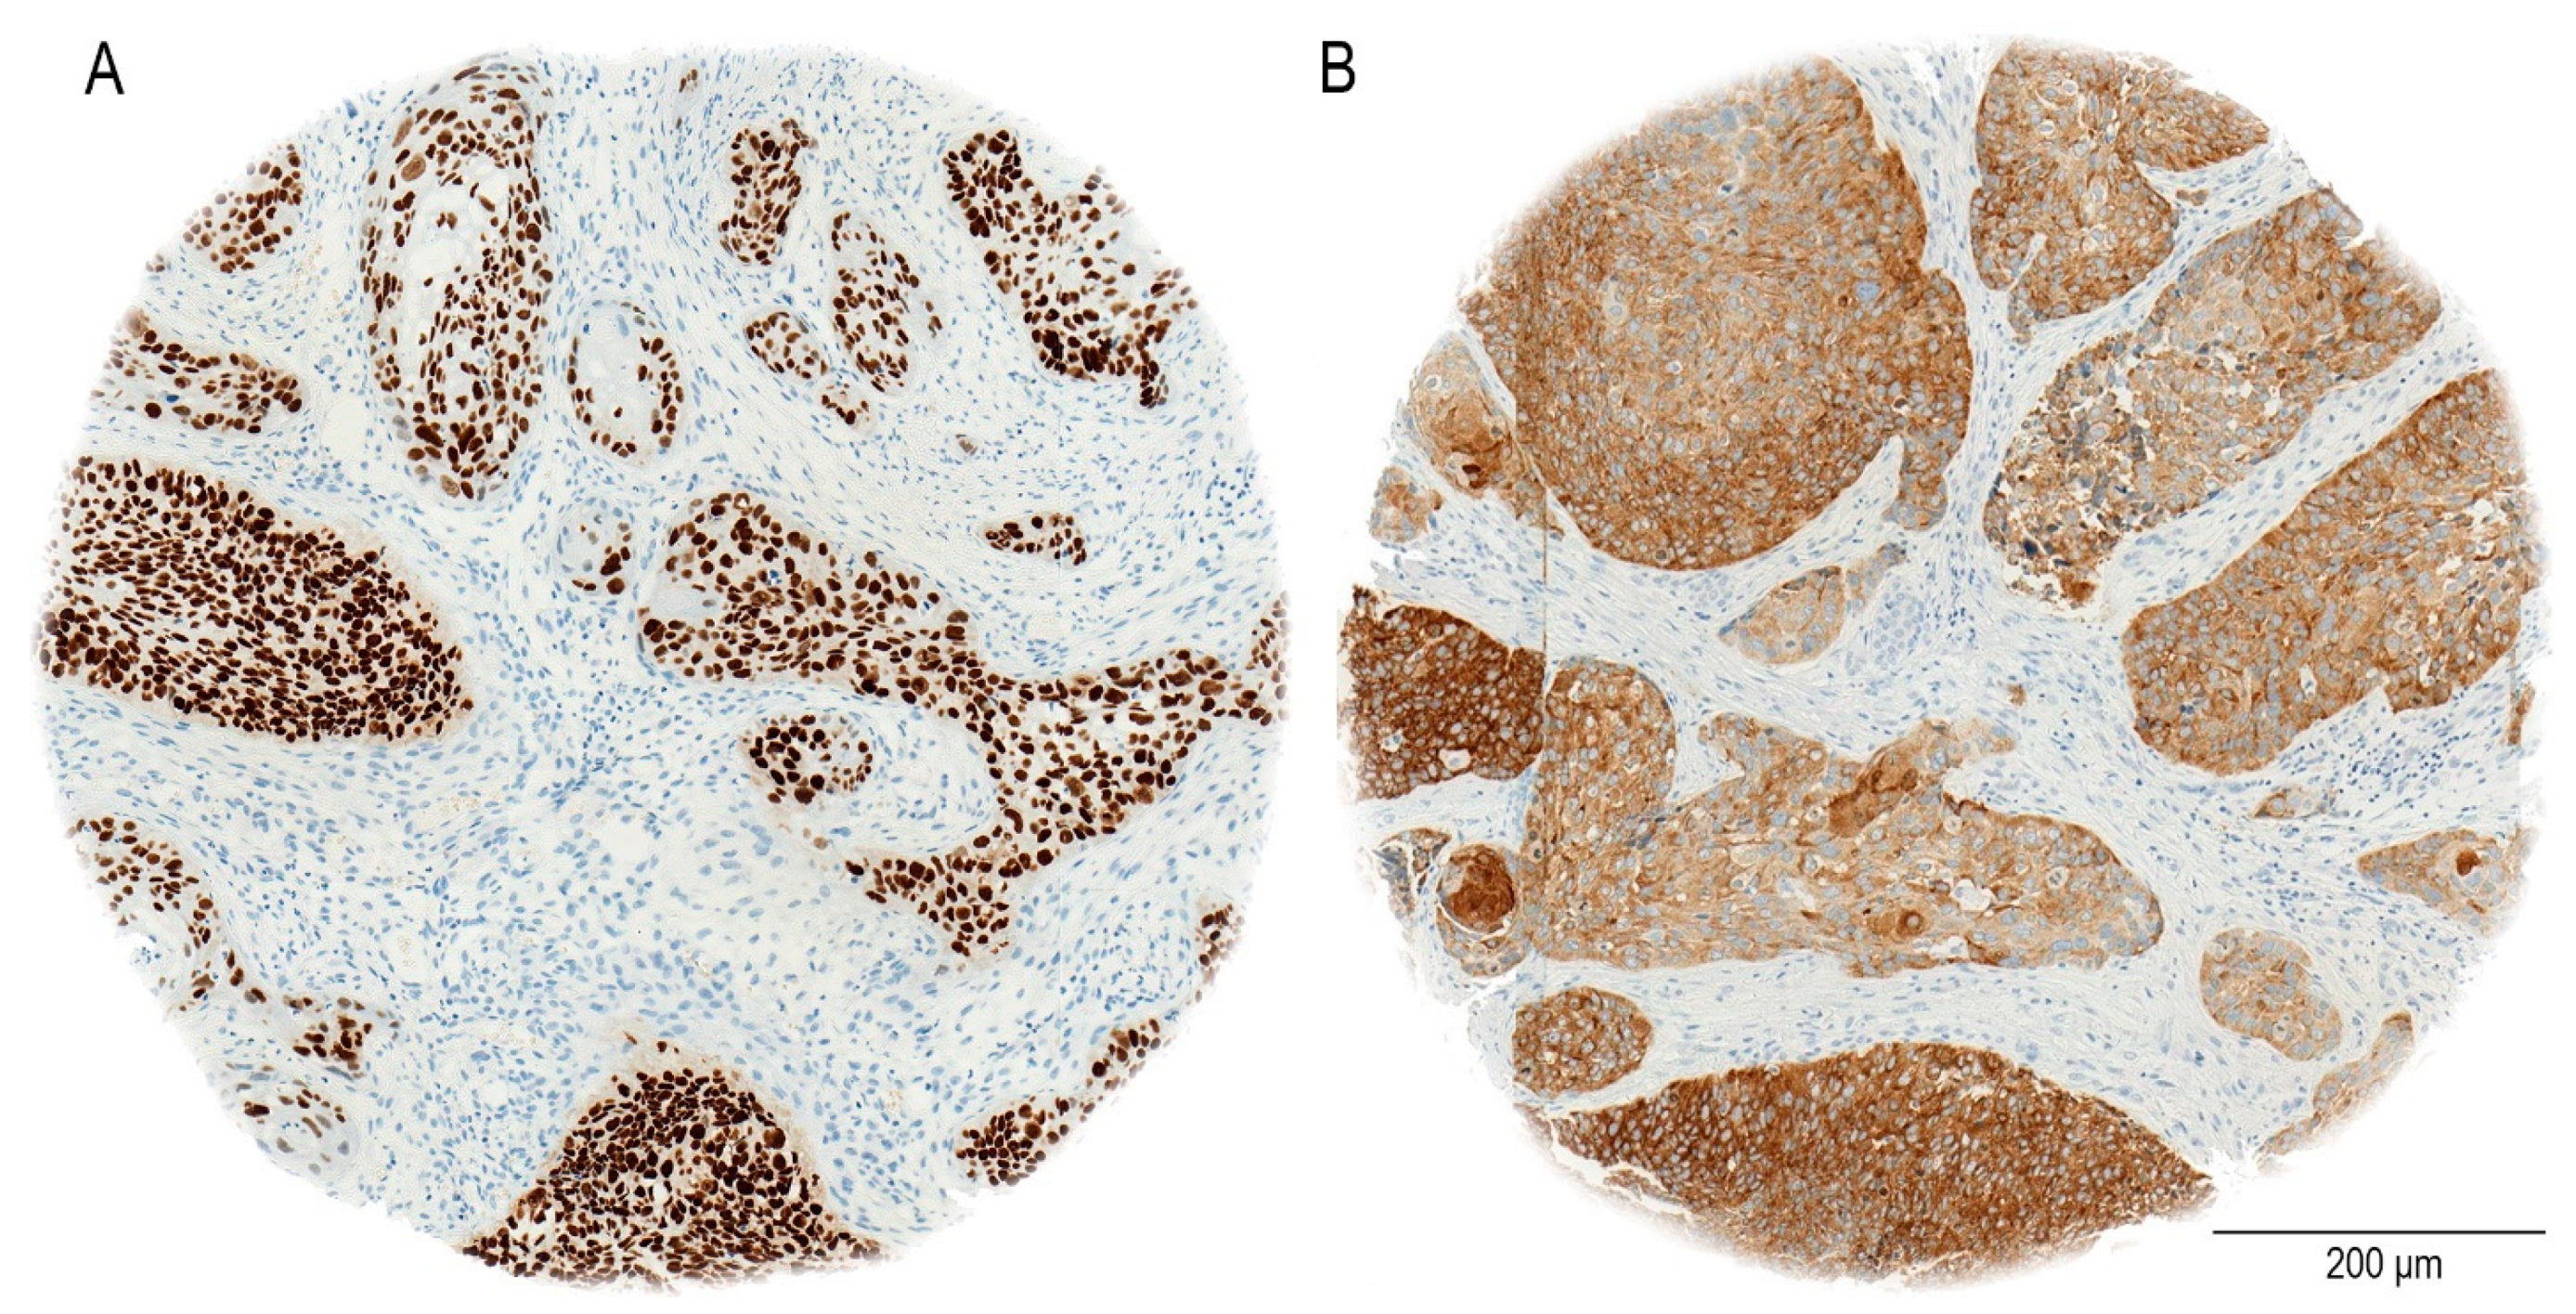
The staining procedure was entirely automated utilizing the Ventana BenchMark system (Roche, Basel, Switzerland). In our study, the immunohistochemical analysis demonstrates that SOX2 exhibits nuclear staining, as previously reported [33], NANOG shows a cytoplasmic staining pattern in oral OSCC patients, as seen in our cohort (Figure 2). In particular, NANOG has strong cytoplasmic staining in a considerable majority of OSCC cases, in contrast to the nuclear localization seen in germ cell malignancies [34,35].
Antigen retrieval for SOX2 staining was conducted using heat-mediated retrieval in sodium citrate buffer (pH 6.0) at 92 °C for 32 min. The sections were treated with anti-SOX2 antibody (dilution 1 µg/mL) at ambient temperature, and thereafter, detected with a biotin-conjugated secondary antibody and streptavidin–peroxidase solution. Counterstaining was conducted with hematoxylin.
Antigen retrieval for NANOG staining was performed using sodium citrate buffer (pH 6.0) at 92 °C for 32 min. The slides were treated with anti-NANOG antibody at a dilution of 1:1000 to 1:2500 at room temperature. After the primary antibody incubation, a biotin-conjugated secondary antibody was administered for 30 min, succeeded by streptavidin–peroxidase incubation. The staining was observed utilizing 3′,3-diaminobenzidine tetrahydrochloride (DAB) and counterstained with hematoxylin.
Positive controls for SOX2 included human glioblastoma tissue and NCCIT (human pluripotent embryonal carcinoma) cell line samples. Positive controls for NANOG staining included NCCIT cells and embryonic carcinoma tissue.
Negative controls were prepared by omitting the primary antibodies during the staining process to confirm specificity.
For digital analysis, slides were scanned using a Ventana iScan HT Scanner (Ventana, Tucson, AZ, USA). Image analysis was conducted using the open-source software QuPath (Version 0.2.3) [36]. TMA cores were selected using the integrated TMA dearrayer function in QuPath software. Patient data were imported from prepared Excel spreadsheets to ensure that each core was correctly matched to the corresponding patient. Regions of interest, including tumor cells, immune cells, and stromal compartments, were manually annotated for analysis. Positive cell detection was performed using the Optical Density Sum (OD Sum) method to reduce nucleus fragmentation. Parameters such as requested pixel size, background radius, median filter radius, nucleus size thresholds, intensity threshold, and cell expansion were optimized to ensure accurate detection of cells. The smoothed measurement heat maps function was subsequently generated to visualize classification-relevant cellular features. A Random Forest classifier was trained based on the annotated regions to facilitate accurate automated classification of tumor cells. Finally, cellular measurements were exported via the TMA Data Viewer, allowing for the calculation and validation of the H-score.
We utilized QuPath for image processing and H-score quantification, leveraging its demonstrated reliability in several tumor biology studies [22,32,37]. The cited research validates the reproducibility of QuPath for H-score assessments across different tumor contexts. Two independent pathologists supervised the process to minimize subjectivity.
Digitized image files were imported into QuPath as .tif files for further examination on a Windows 10-based system with a 12.3″ display (2736 × 1824 pixels resolution).

2.2. Statistical Analysis

Descriptive statistics were summarized using frequencies, percentages, medians, and ranges. Continuous data are presented as means (SD) and medians with an interquartile range (IQR) for a comprehensive representation of data distribution.
For survival analysis, the Kaplan–Meier method was applied to estimate prDFS and prOS probabilities.
prDFS was defined as the time from the first recurrence until a second recurrence, death, or last follow-up, whichever occurred first. During this period, the patient remained disease-free.
prOS was defined as the time from the first recurrence to death from any cause or the last follow-up date, whichever came first.
Group comparisons were conducted using univariate analysis with the log-rank test and Schoenfeld residuals were examined to verify the proportional hazards assumption.
To determine optimal cutoff points for marker expression, the “rolr” package was used, specifically its “rhier” function, which identifies the best two-group split based on survival outcomes. Cutoff points were selected based on median values where appropriate.
Kaplan–Meier plots were generated using a combination of “survival”, “survminer”, “ggplot2”, and “plotly” packages. Hazard ratios (HR), confidence intervals (CI), and p-values were estimated using the “coxph” function from the “survival” package.
All statistical tests were two-tailed, with significance set at p < 0.05. Results were reported with 95% confidence intervals (CI). Statistical analyses were conducted using R Core Team (2023), R: A Language and Environment for Statistical Computing (R Foundation for Statistical Computing, Vienna, Austria) (https://www.R-project.org/ (accessed on 29 July 2024)).
This study is among the first to examine survival outcomes in recurrent OSCC by analyzing SOX2 and NANOG expression using semi-automated immunohistochemical marker analysis with QuPath software. The applied method assessed post-recurrence survival in high-risk groups by correlating standardized H-score-based IHC expression with clinical follow-up data.
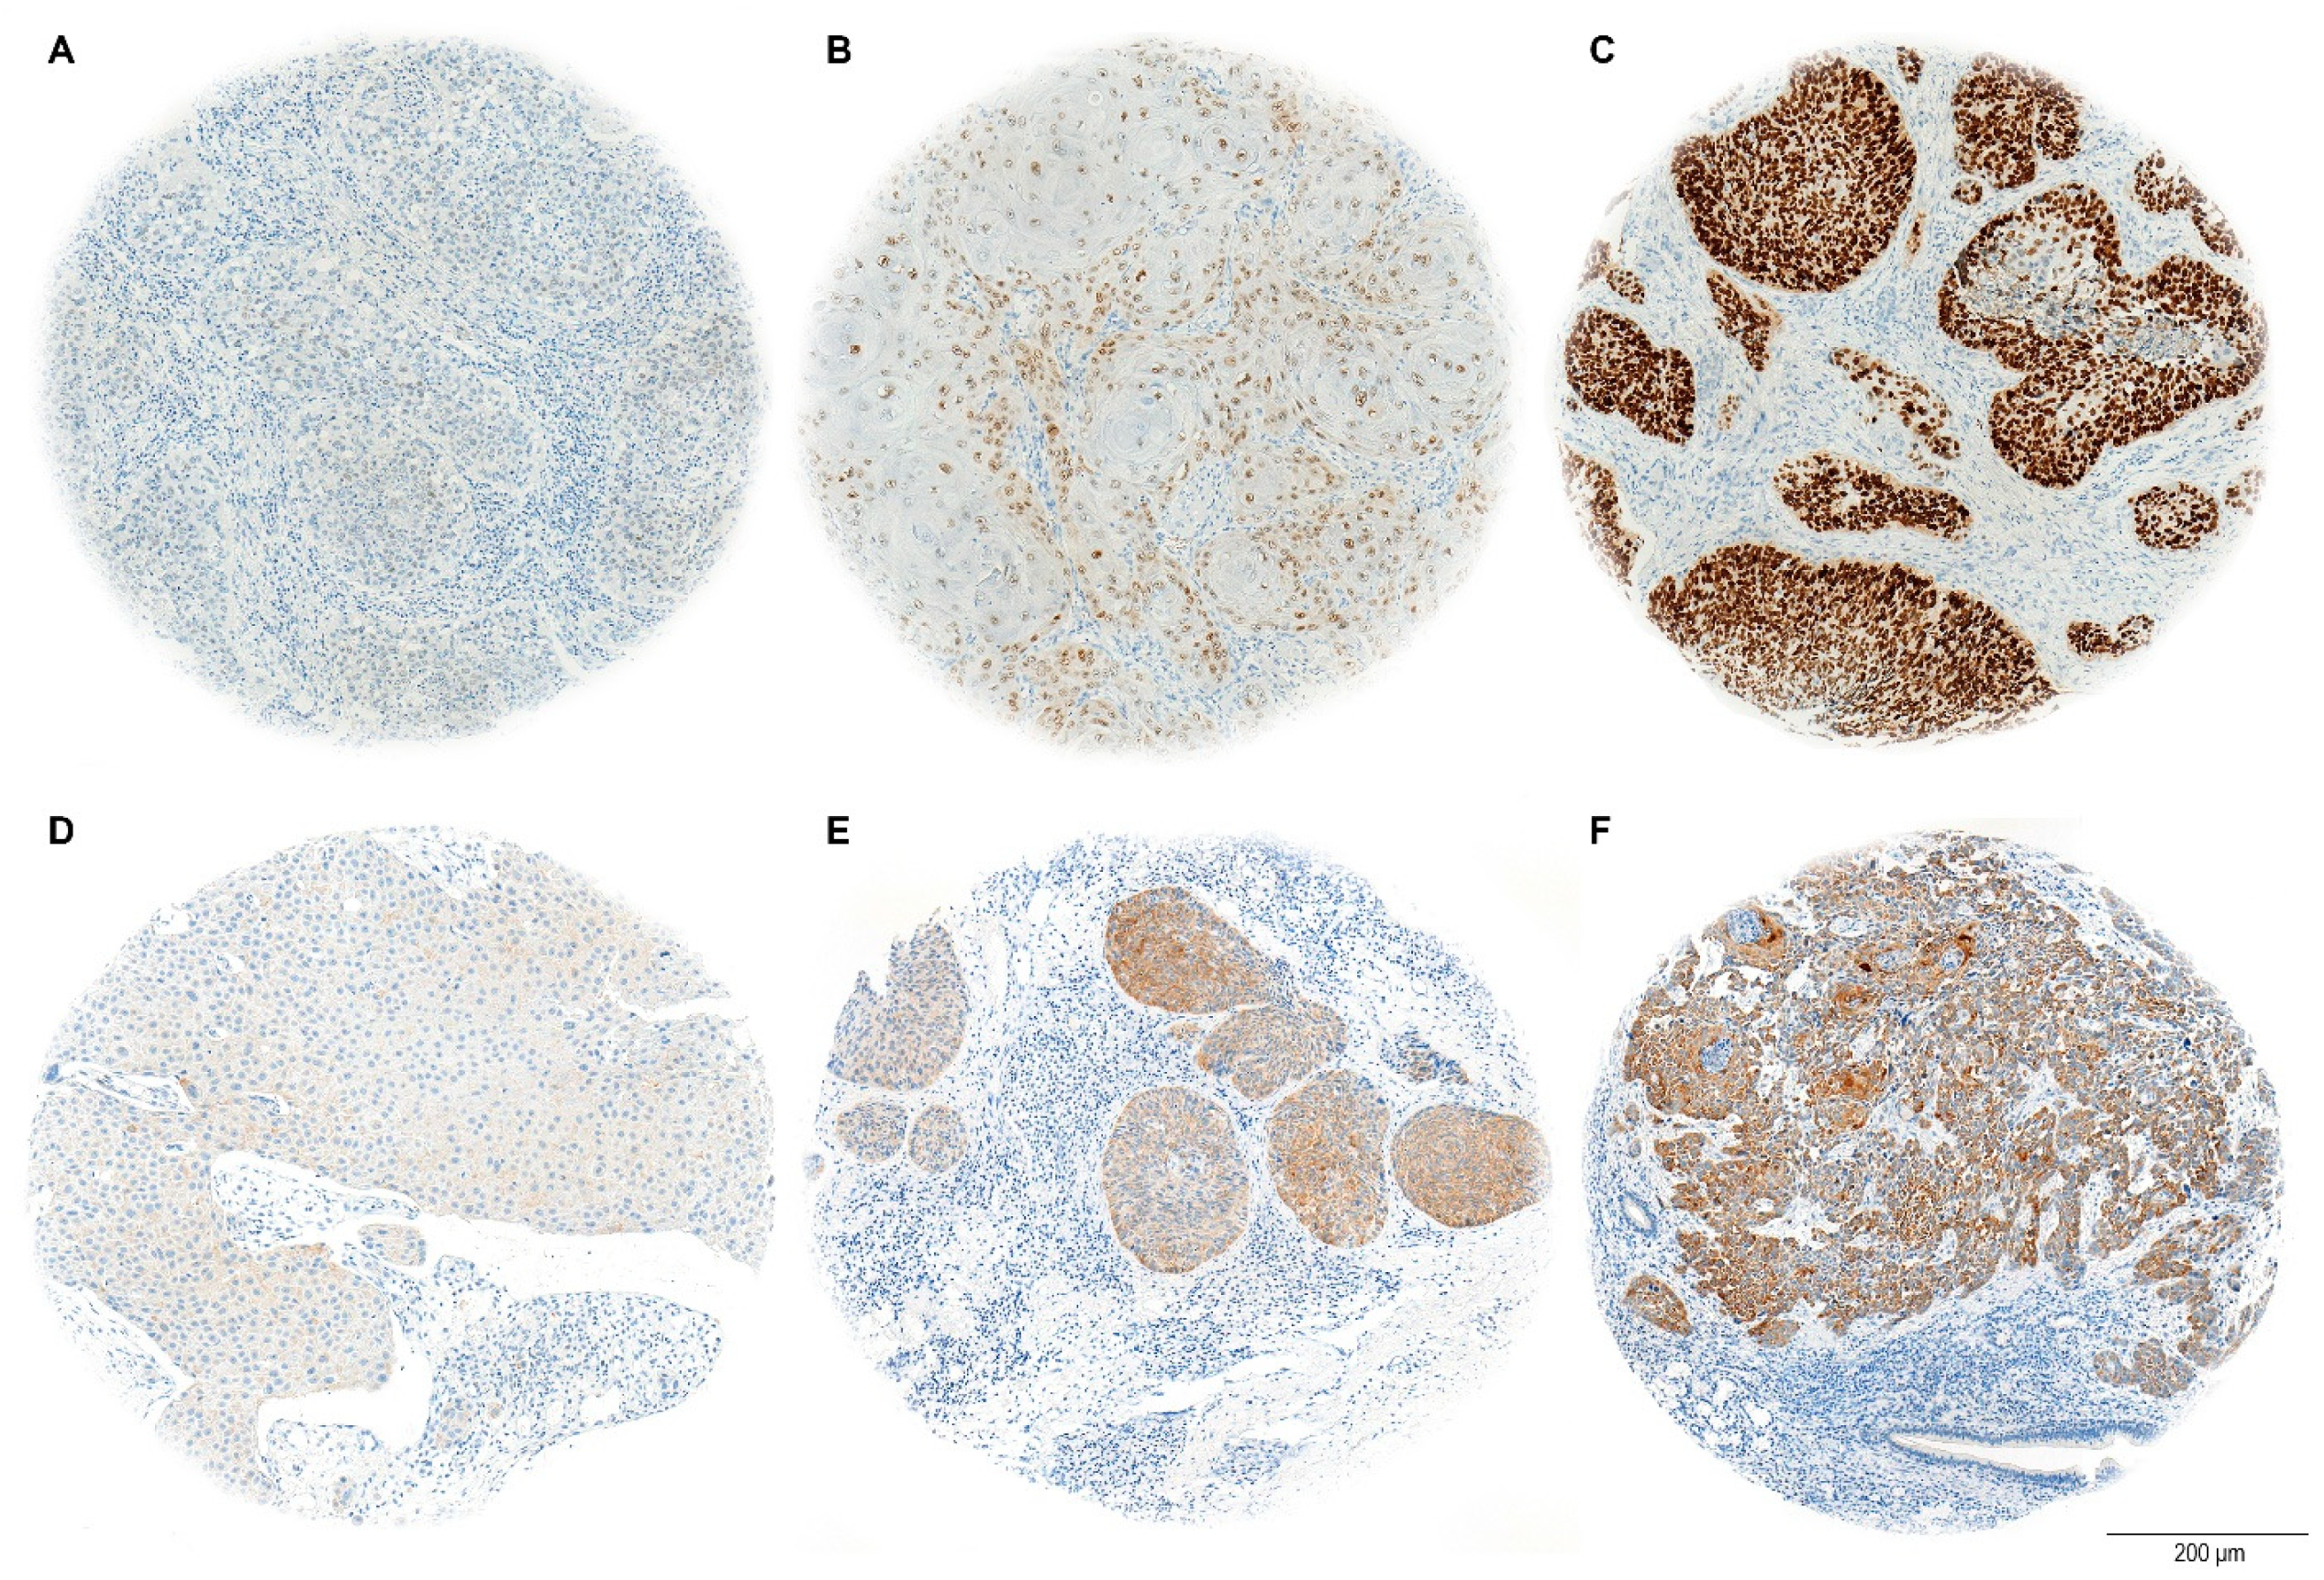
The H-score evaluation of immunostaining quantifies protein expression in tissue samples, with a maximum possible score of 300. This score is calculated by adding the weighted contributions of stained cells based on their intensity: strongly stained cells are weighted at 3, moderately stained cells at 2, and weakly stained cells at 1. Cells without expression are weighted at 0 (Figure 3). The percentage of positively stained tumor cells was considered relative to the total tumor area [38].
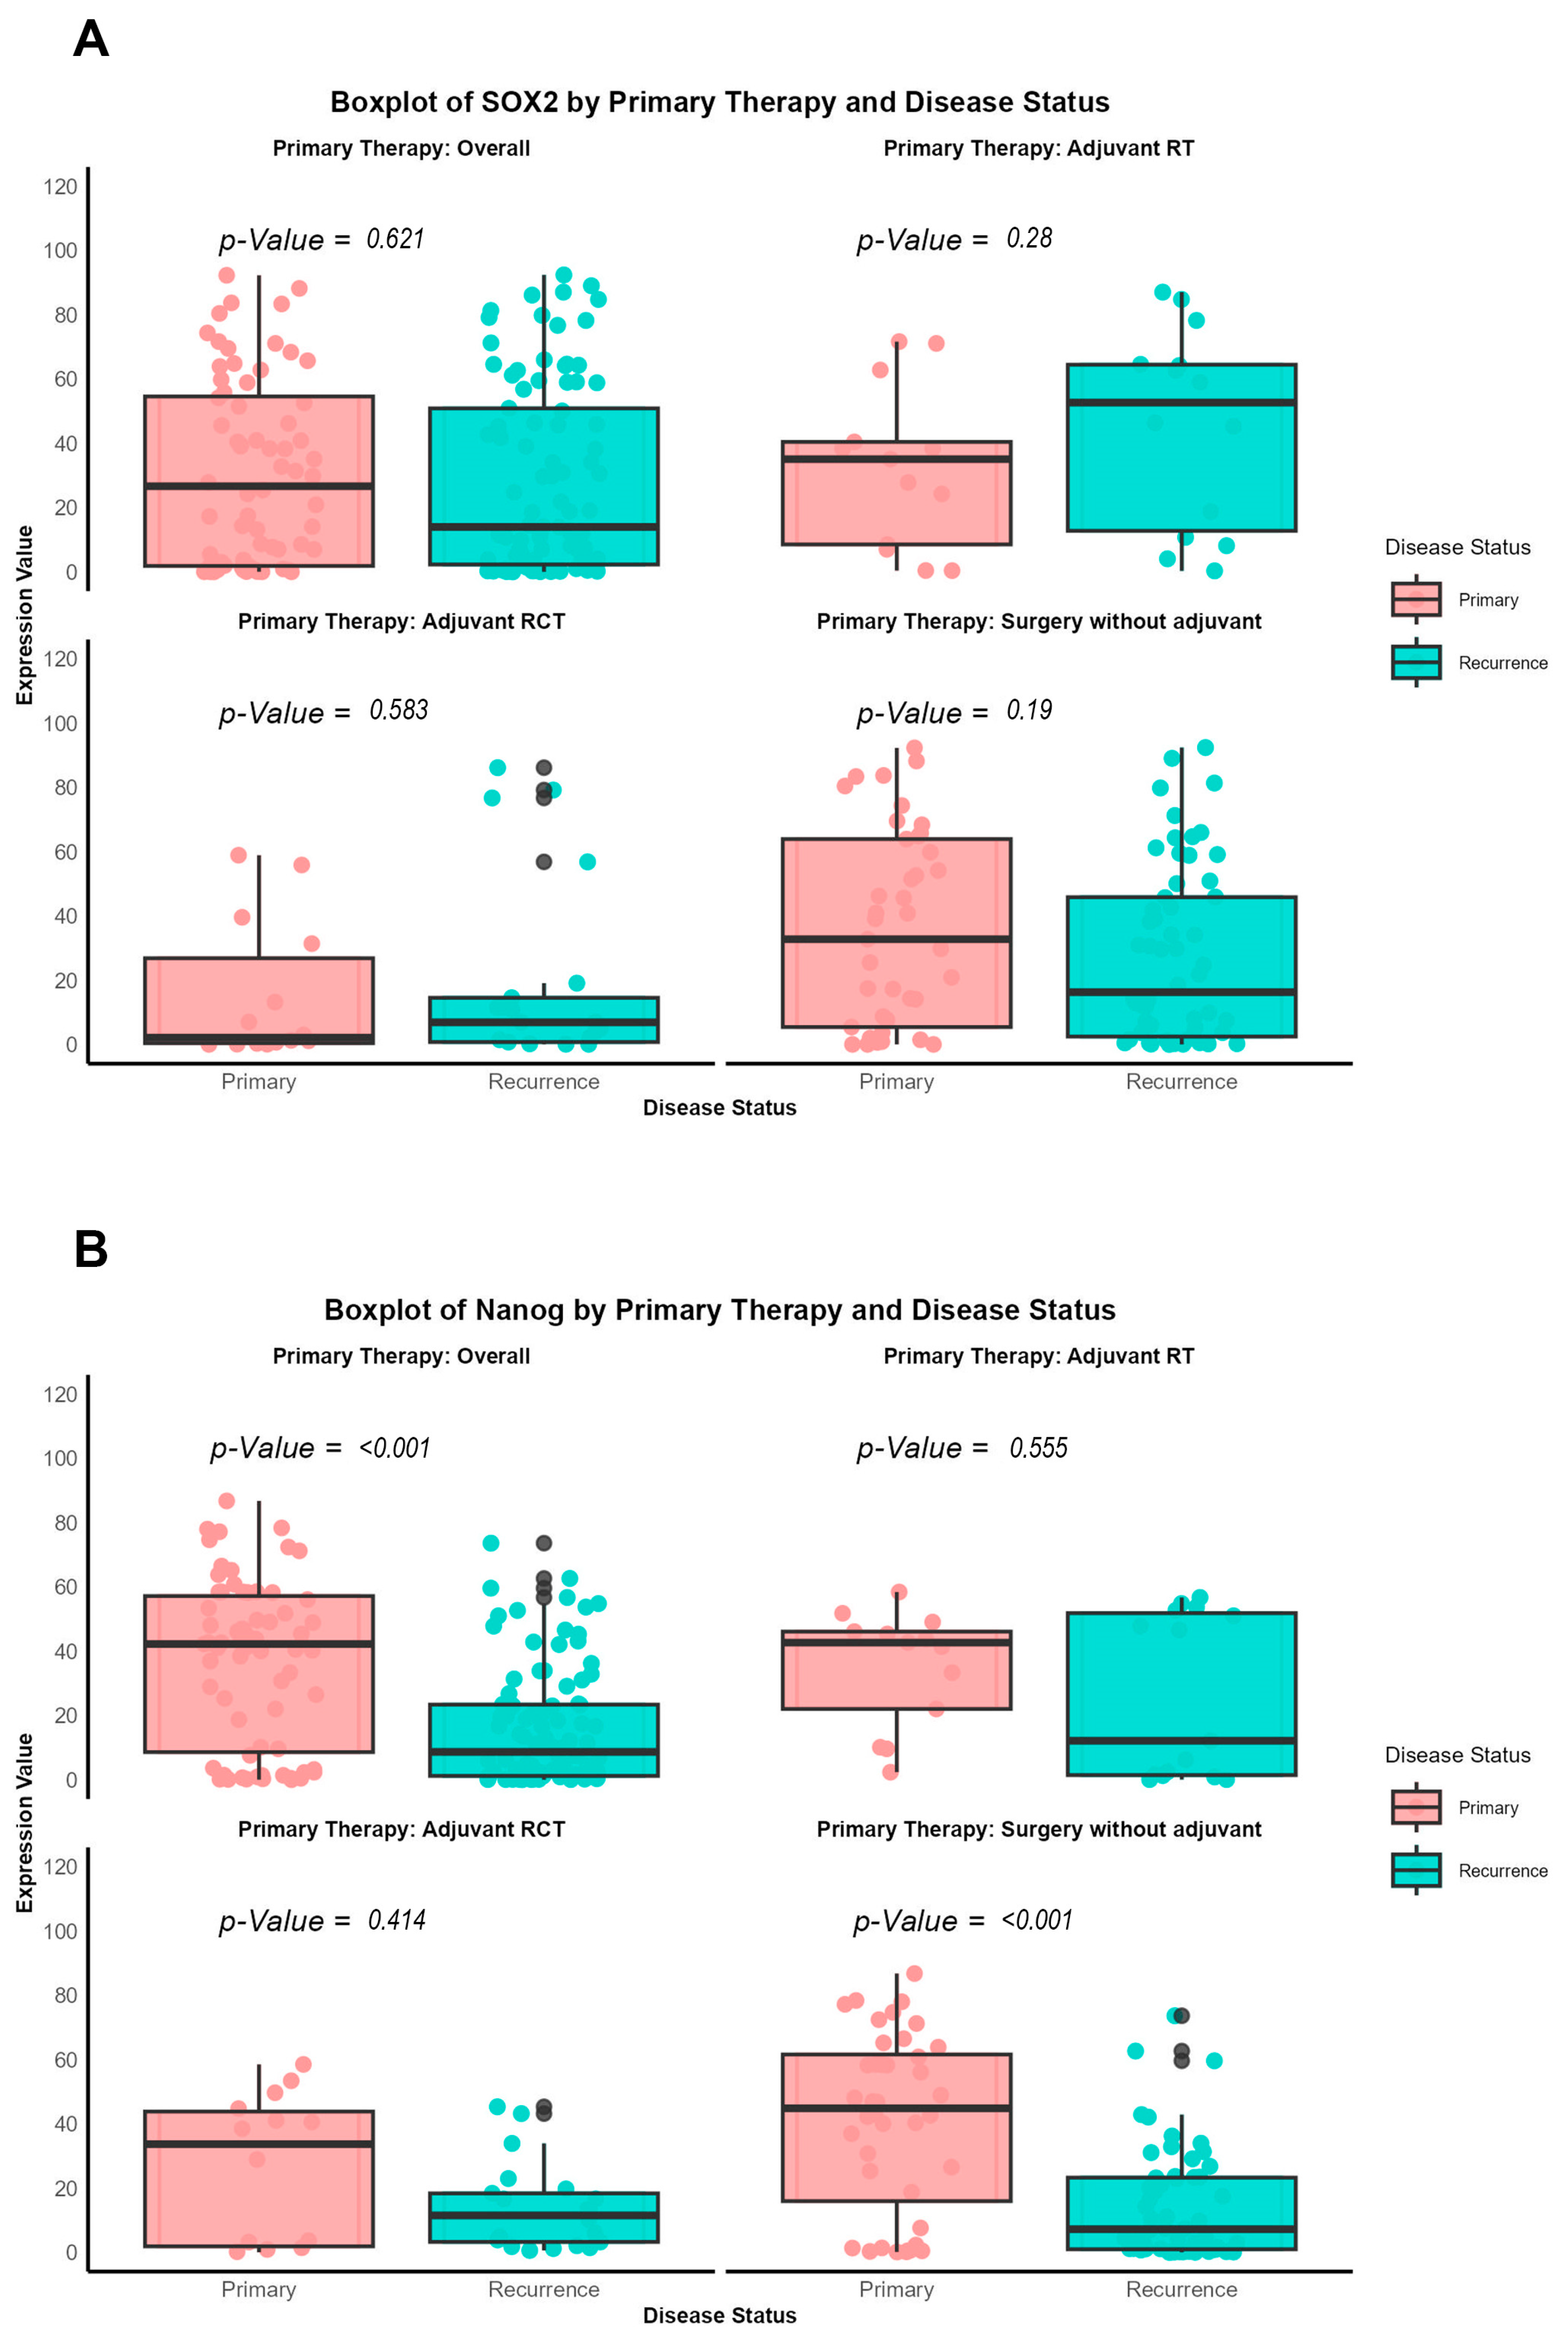
Additionally, a direct comparison of antibody expression between primary and recurrent tumors was performed, categorized according to the specific therapeutic approaches (surgery alone, adjuvant radiotherapy, or radiochemotherapy), using the nonparametric Wilcoxon signed-rank test, as the data were not normally distributed.

Ethics

Upon admission, all participants signed consent forms authorizing the collection and anonymous use of their data for academic research. The study (ID: 16-272A) was approved by the ethics review committee of the University of Lübeck in April 2017.

3. Results

3.1. The Floor of the Mouth Is the Most Common Site of Recurrence Among OSCC Patients

This study examined a cohort of 94 patients with re-OSCC, describing demographic and clinical characteristics that highlight issues of recurring disease (Table 2). The median patient age was 62 years, with the majority (68%) being male. Notably, 78% were previous or current smokers, with 60% reporting heavy alcohol usage, indicating high exposure to known carcinogens. Comorbidities were distributed as follows: 63% had a Charlson Comorbidity Index (CCI) of 0, whereas 37% had a CCI of 1. The most common recurrence site was the floor of the mouth (41%) and a majority (68%) showed lymph node involvement at recurrence (rN+/x). At the tumor level, 31% of patients had rT4 lesions and 11% had rT3, emphasizing the aggressive nature of re-OSCC; only 8.8% presented with distant metastases (rM1). These variables collectively indicate a population with advanced, high-risk recurring disease, emphasizing the intricate therapeutic decision-making required for this group.

3.2. High SOX2 Expression Predicts Better Survival, While NANOG Shows No Impact

Survival data revealed that 71% of patients had died from any cause (Table 3). Mortality was higher among patients with a SOX2 H-score of ≤14 (83%) compared to those with scores >14 (60%). Deaths attributed specifically to oral cancer were observed in 70% of the low SOX2 group, whereas this was lower at 51% in the high SOX2 group. In relation to prDFS, 43% of the patients showing low SOX2 expression died from oral cancer, in contrast to 34% in the high SOX2 cohort. Locoregional recurrence rates were similar between groups, occurring in 33% of patients.
Analysis of NANOG expression revealed that individuals with an H-score ≤ 15 had a greater overall mortality rate (77%) compared to those with scores > 15 (65%) (Table 4). Mortality from oral cancer was more prevalent in the low NANOG group (63%) than in the high NANOG group (59%). The percentage of patients who died to oral cancer during prDFS was comparable between the NANOG expression groups. Locoregional recurrence was observed in 29% of patients exhibiting low NANOG expression and 37% of those with elevated expression.

3.3. SOX2 and NANOG Show Divergent Prognostic Roles

Cox regression analysis (Table 5 and Table 6) identified larger recurrent tumor size (rT2–rT4) and lymph node involvement (rN+/x) as significant predictors of worse outcomes in both prDFS and prOS. In Table 5, which focuses on SOX2 expression, patients with rT2 had a hazard ratio (HR) of 3.51 (95% confidence interval [CI]: 1.53–8.07) for prDFS and 3.56 (95% CI: 1.36–9.31) for prOS, while rT3 (HR: 3.01 for prDFS; HR: 5.70 for prOS) and rT4 (HR: 2.48 for prDFS; HR: 3.58 for prOS) further demonstrated a significantly increased risk. Similarly, Table 6, which examines NANOG expression, confirmed these associations, with rT2 showing an even higher HR of 4.77 (95% CI: 2.07–11.0) for prDFS and 4.91 (95% CI: 1.86–13.0) for prOS. The trend persisted for rT3 (HR: 3.19 for prDFS; HR: 5.93 for prOS) and rT4 (HR: 3.08 for prDFS; HR: 4.39 for prOS), reinforcing that advanced tumor stage at recurrence is strongly linked to poorer survival outcomes in OSCC. Furthermore, lymph node involvement (rN+/x) was consistently associated with increased mortality risk, with HR values of 1.95 for prDFS (p = 0.021) and 2.87 for prOS (p = 0.001) in Table 5 and similar effects observed in Table 7 (HR: 1.92 for prDFS; HR: 2.85 for prOS).
Regarding biomarker expression, SOX2 and NANOG displayed contrasting prognostic significance. In Table 5, SOX2 overexpression (H-score > 14) was associated with a significantly lower risk of death (HR: 0.54, 95% CI: 0.31–0.94, p = 0.030), suggesting its potential as a favorable prognostic biomarker in recurrent OSCC. In contrast, Table 7 demonstrated that NANOG expression (H-score > 15) was not significantly correlated with either prDFS (HR: 1.11, p = 0.7) or prOS (HR: 1.06, p = 0.8), indicating its limited prognostic value. These findings highlight that while larger tumor size and lymph node involvement remain the strongest predictors of poor prognosis, SOX2 overexpression may confer a survival advantage, whereas NANOG expression does not appear to influence recurrence-related outcomes.

3.4. SOX2 Stays Stable, NANOG Expression Decreases in Primary vs. Recurrent Tumors Across Treatments

A comparison of SOX2 and NANOG expression between primary and recurrent tumors across different treatment modalities (Table 7 and Table 8 and Figure 4) showed that SOX2 expression did not significantly differ between primary (median expression: 26.631, IQR: 1.832–54.559) and recurrence tumors (median expression, IQR: 2.270–50.861; p = 0.621). However, in patients who received adjuvant radiotherapy (RT), SOX2 expression was higher in recurrent tumors (median expression, IQR: 12.753–64.455) compared to primary tumors (median expression: 35.061, IQR: 8.521–40.421; p = 0.280). In contrast, NANOG expression significantly decreased from primary to recurrent tumors in the overall cohort (primary median expression: 42.221, IQR: 8.585–57.148; recurrent median expression: 8.652, IQR: 1.177–23.368; p < 0.001). This decrease in expression was most notable in patients who underwent surgery without adjuvant therapy (primary median expression: 44.814, IQR: 15.930–61.558; recurrent median expression: 7.187, IQR: 0.943–23.241; p < 0.001). These findings suggest that treatment modalities may influence the expression patterns of SOX2 and NANOG in recurrent OSCC.
We investigated the effects of RT and RCT on tumor biology, specifically CSC features. Patients who underwent surgery without adjuvant therapy served as the control group because their tumors had not been exposed to RT or RCT. This method enables the assessment of tumor development without the altering effects of adjuvant therapy. Importantly, all primary tumor samples were acquired from patients who had not previously undergone adjuvant therapy, resulting in a consistent baseline for comparing primary and recurrent disease.

3.5. SOX2 Overexpression Significantly Improves prOS and prDFS

The Kaplan–Meier survival analysis (Figure 5 and Figure 6) underscored the predictive significance of SOX2 and NANOG expression. Patients exhibiting elevated SOX2 expression (H-score > 14) had markedly prolonged progression-free overall survival compared to those with decreased expression (H-score ≤ 14), with a log-rank test p-value of 0.013. In a similar manner, elevated SOX2 expression was associated with prolonged prDFS (p = 0.026). NANOG expression did not significantly influence prOS (p = 0.25) or prDFS, as the survival curves for high (>15) and low (≤15) NANOG expression groups were almost indistinguishable.
SOX2 expression in recurrent cancers is associated with better survival, where a SOX2 H-score above 14 is connected to reduced mortality and prolonged progression-free overall survival (prOS). Increased tumor size and regional lymph node involvement forecast unfavorable outcomes. NANOG expression exhibited no significant effect on survival but reduced markedly in recurring tumors, especially following surgery alone. These data indicate SOX2 as a possible predictive biomarker, but alterations in NANOG expression may signify tumor biology in re-OSCC.

4. Discussion

A growing body of evidence highlights the complexity of re-OSCC, which frequently exhibits more aggressive biological behavior and poorer survival outcomes than primary tumors. The underlying mechanisms causing these differences are only partially understood. In this context, understanding the prognostic roles of pluripotency transcription factors, particularly SOX2 and NANOG, in re-OSCC is critical, given their established links to CSC biology and tumor progression.
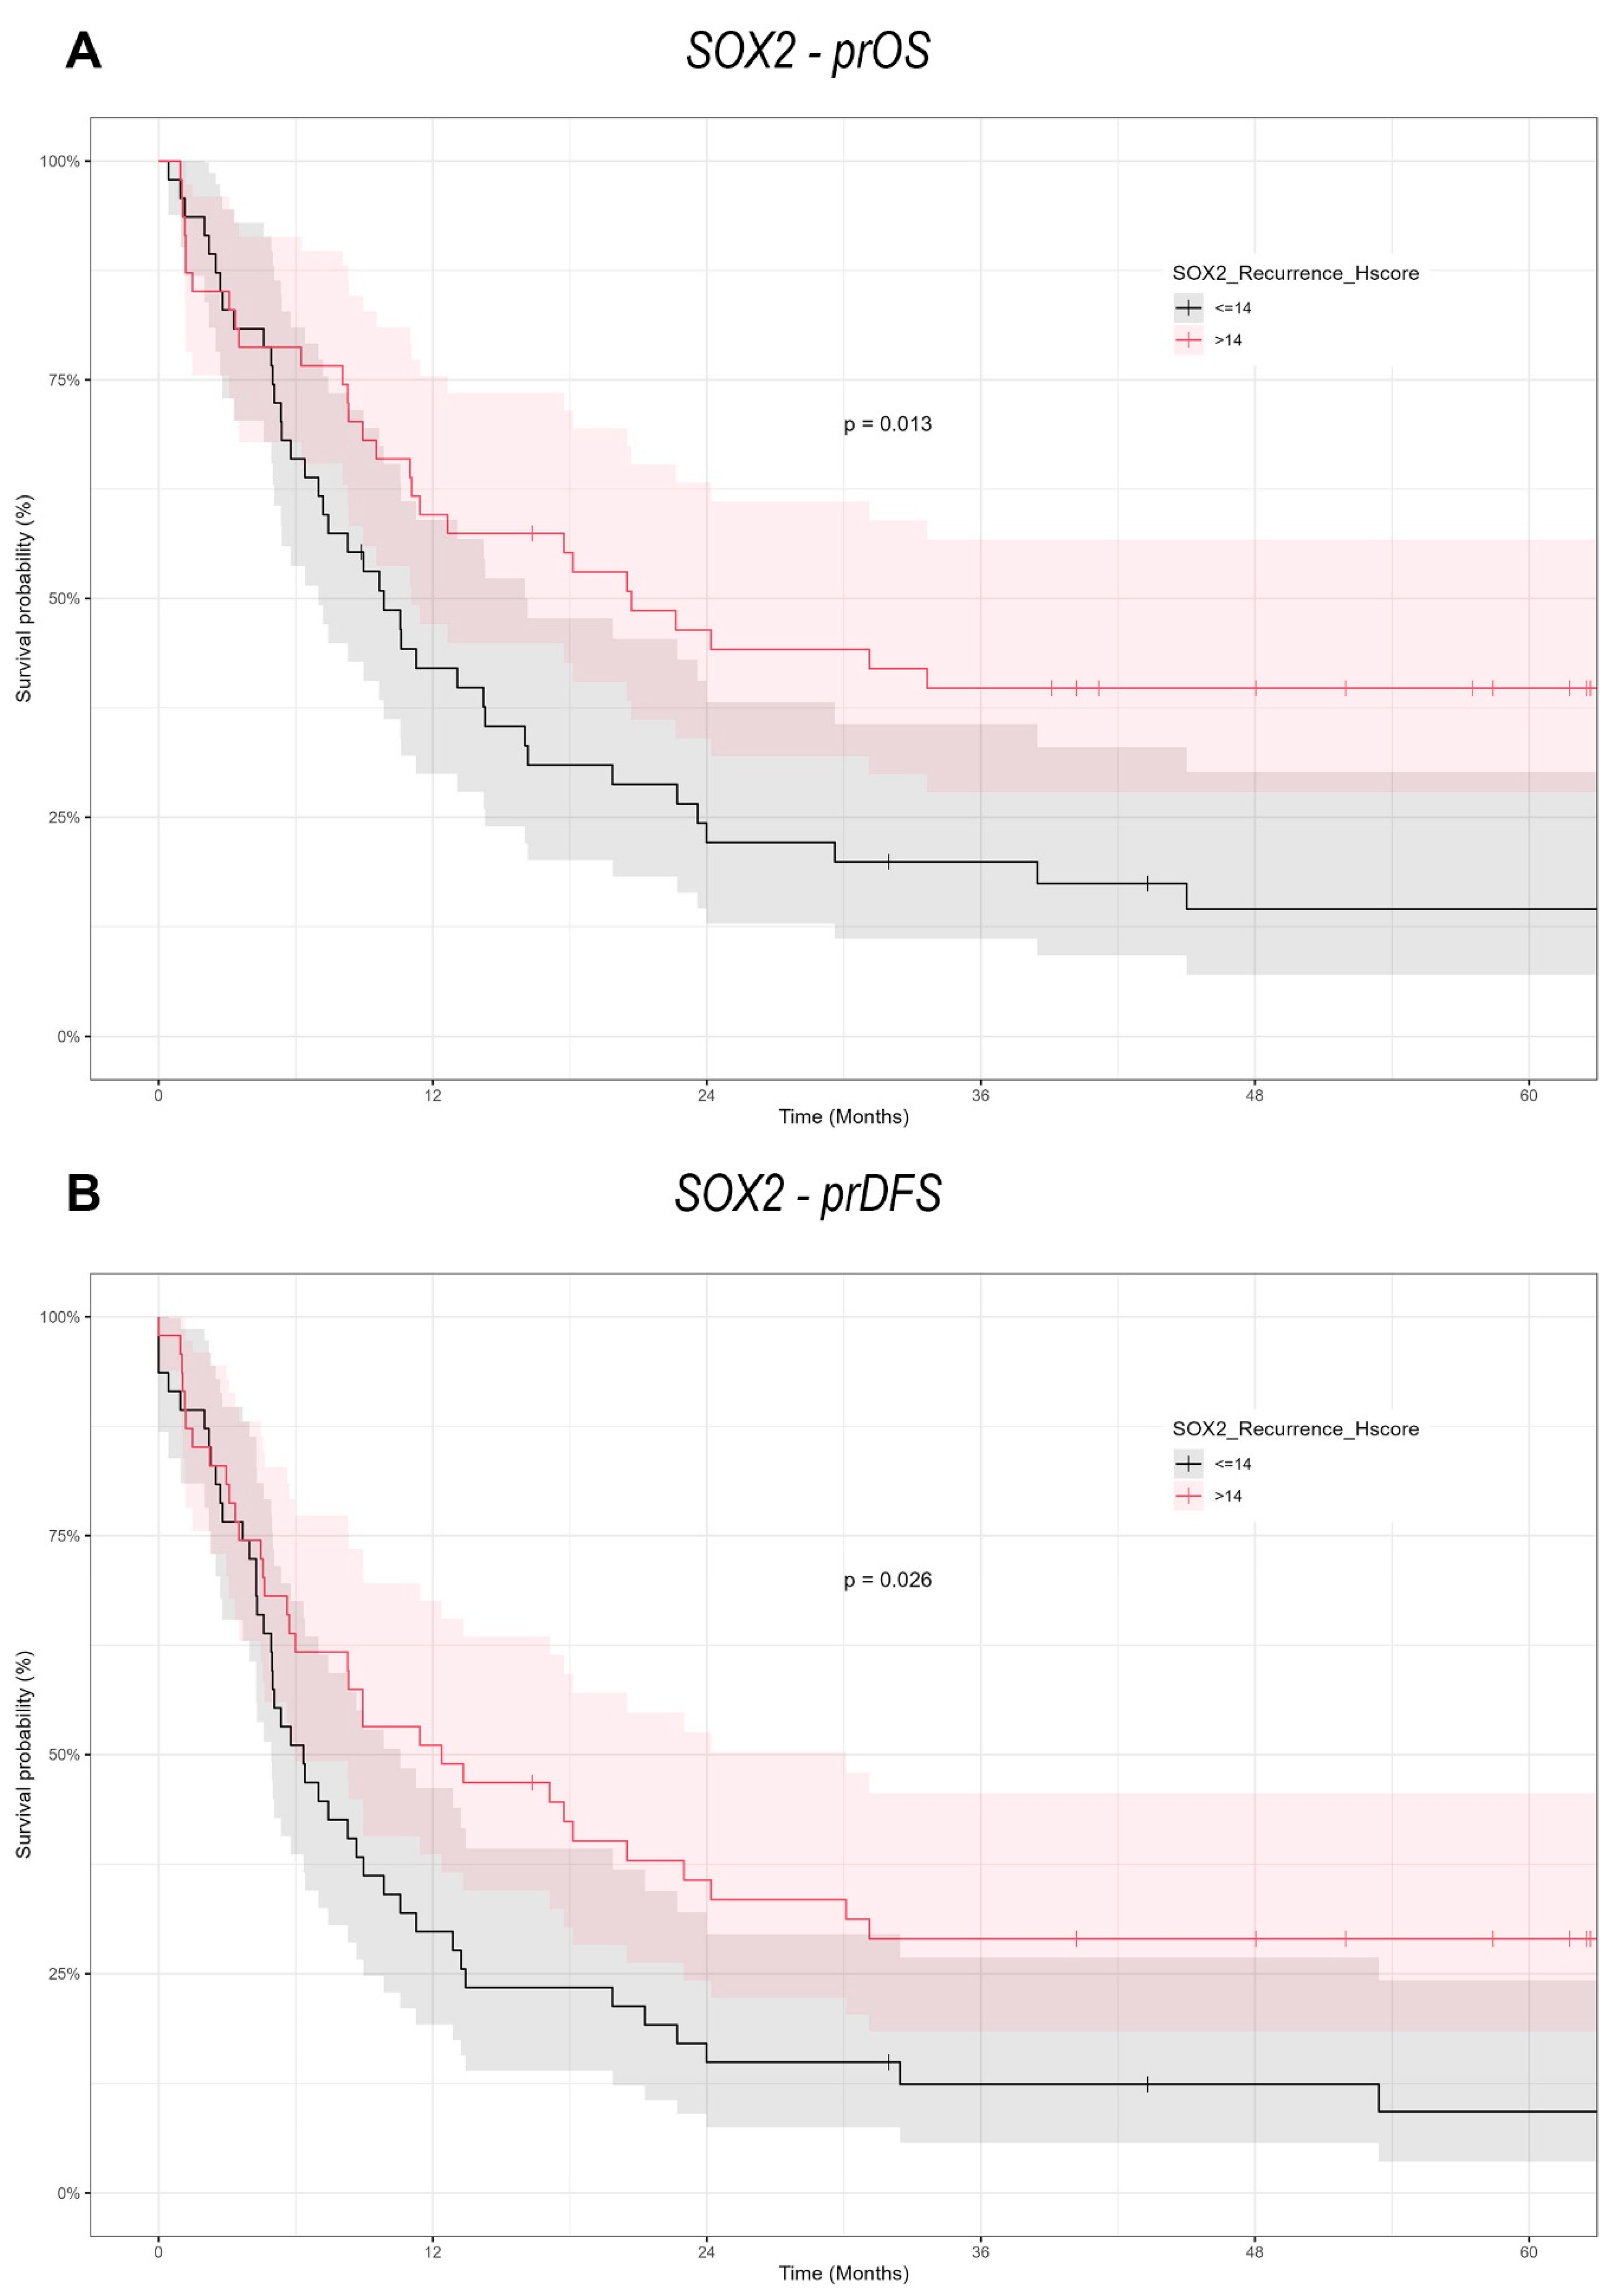
Our findings provide a notable contrast to the prevailing literature, which often associates high expression of pluripotency-associated transcription factors (NANOG and SOX2) with increased metastatic potential in tumor cells. In the context of re-OSCC, however, we observed that elevated SOX2 expression correlates with better prognosis, including improved prOS and prDFS. This discrepancy may stem from the distinct biological features of recurrent versus primary malignancies, suggesting that markers like SOX2 could behave differently depending on a tumor’s evolutionary history.
The involvement of SOX2 and NANOG in OSCC has been thoroughly examined in primary tumors. Our study is focused on recurrent oral cavity tumors. This distinction is crucial, as prior research frequently grouped HNSCC from different anatomical locations (e.g., oropharynx, larynx), which could suggest varying biological behaviors [25,39,40,41]. By refining our cohort to re-OSCC, we want to find out whether the expression patterns of these CSC markers vary at recurrence and how this may influence patient outcomes.
This study is especially important for CSC-marker research because it suggests that recurrence-specific tumor biology influences the prognostic implications of NANOG and SOX2. Although these factors are generally implicated in stemness and tumor progression, their roles may differ across clinical stages and disease contexts [27].
Several investigations on SOX2 in OSCC have yielded mixed or conflicting prognostic results. Züllig et al. examined 120 patients with early-stage OSCC, investigated SOX2 by immunohistochemistry on TMA, assessed by an Intensity/Reactivity Score (IRS ≥ 8). Elevated SOX2 expression was associated with an absence of lymph node metastasis, indicating a potential protective function in original tumors. The present investigation on re-OSCC, utilizing the H-score for SOX2 assessment, indicates that overexpression correlates with enhanced post-recurrence survival, underscoring its prognostic relevance in primary versus recurrent disease and accentuating the necessity for context-specific biomarker evaluation [13].
Freier et al. examined SOX2 changes in OSCC, revealing gene copy number amplification in 52% of 223 tumors and elevated SOX2 protein expression in 18% of 271 cases via immunohistochemistry. Their findings indicate that SOX2 functions as a proto-oncogene in primary OSCC [42].
Sacco et al. examined 24 OSCC patients, assessing SOX2 expression using qRT-PCR and Western blot analysis. SOX2 was found to be elevated in both the tumor core and close margin, correlating with tumor size and lymph node involvement, indicating a potential role in local dissemination [43]. However, our data reveals a distinct prognostic significance in re-OSCC, wherein SOX2 overexpression is associated with enhanced post-recurrence survival, indicating a change in its biological role between primary and recurrent disease.
Steen et al. examined 222 OSCC patients, including 75 matched lymph node metastases and 33 recurrent tumors, to measure SOX2 expression using immunohistochemistry on tissue microarrays and entire histological slices. The authors used QuPath for digital pathology scoring, with an H-score cutoff of 12 (low: 0–11, high: ≥12). Their findings revealed no significant relationship between SOX2 expression and overall survival, whereas SOX9 overexpression and the SOX2lowSOX9high subgroup were associated with a poor prognosis. Our study, using an H-score cutoff of 14 (low: ≤14, high: >14), demonstrated that SOX2 overexpression in re-OSCC was linked with improved survival. These disparities demonstrate how variations in cutoff criteria and tumor context may influence SOX2’s prognostic relevance, stressing the importance of standardizing scoring techniques in OSCC research [22].
In other malignancies, such as colorectal cancer (CRC) and small cell lung cancer (SCLC), SOX2 often correlates with worse survival, chiefly through its roles in promoting stemness, chemoresistance, and EMT [44,45]. These differences further highlight the context-dependent roles of SOX2 and the necessity of examining its effects in specific clinical contexts, such as re-OSCC.
NANOG, another important stemness factor, is similarly involved in CSC maintenance and therapeutic resistance [27,30,46]. However, its prognostic importance in OSCC continues to be a topic of debate. Some studies correlate NANOG overexpression with OSCC progression, lymph node metastases and cisplatin resistance [30,47]. Others claim more complex roles, such as potential tumor-suppressive effects or involvement primarily in the early phases [
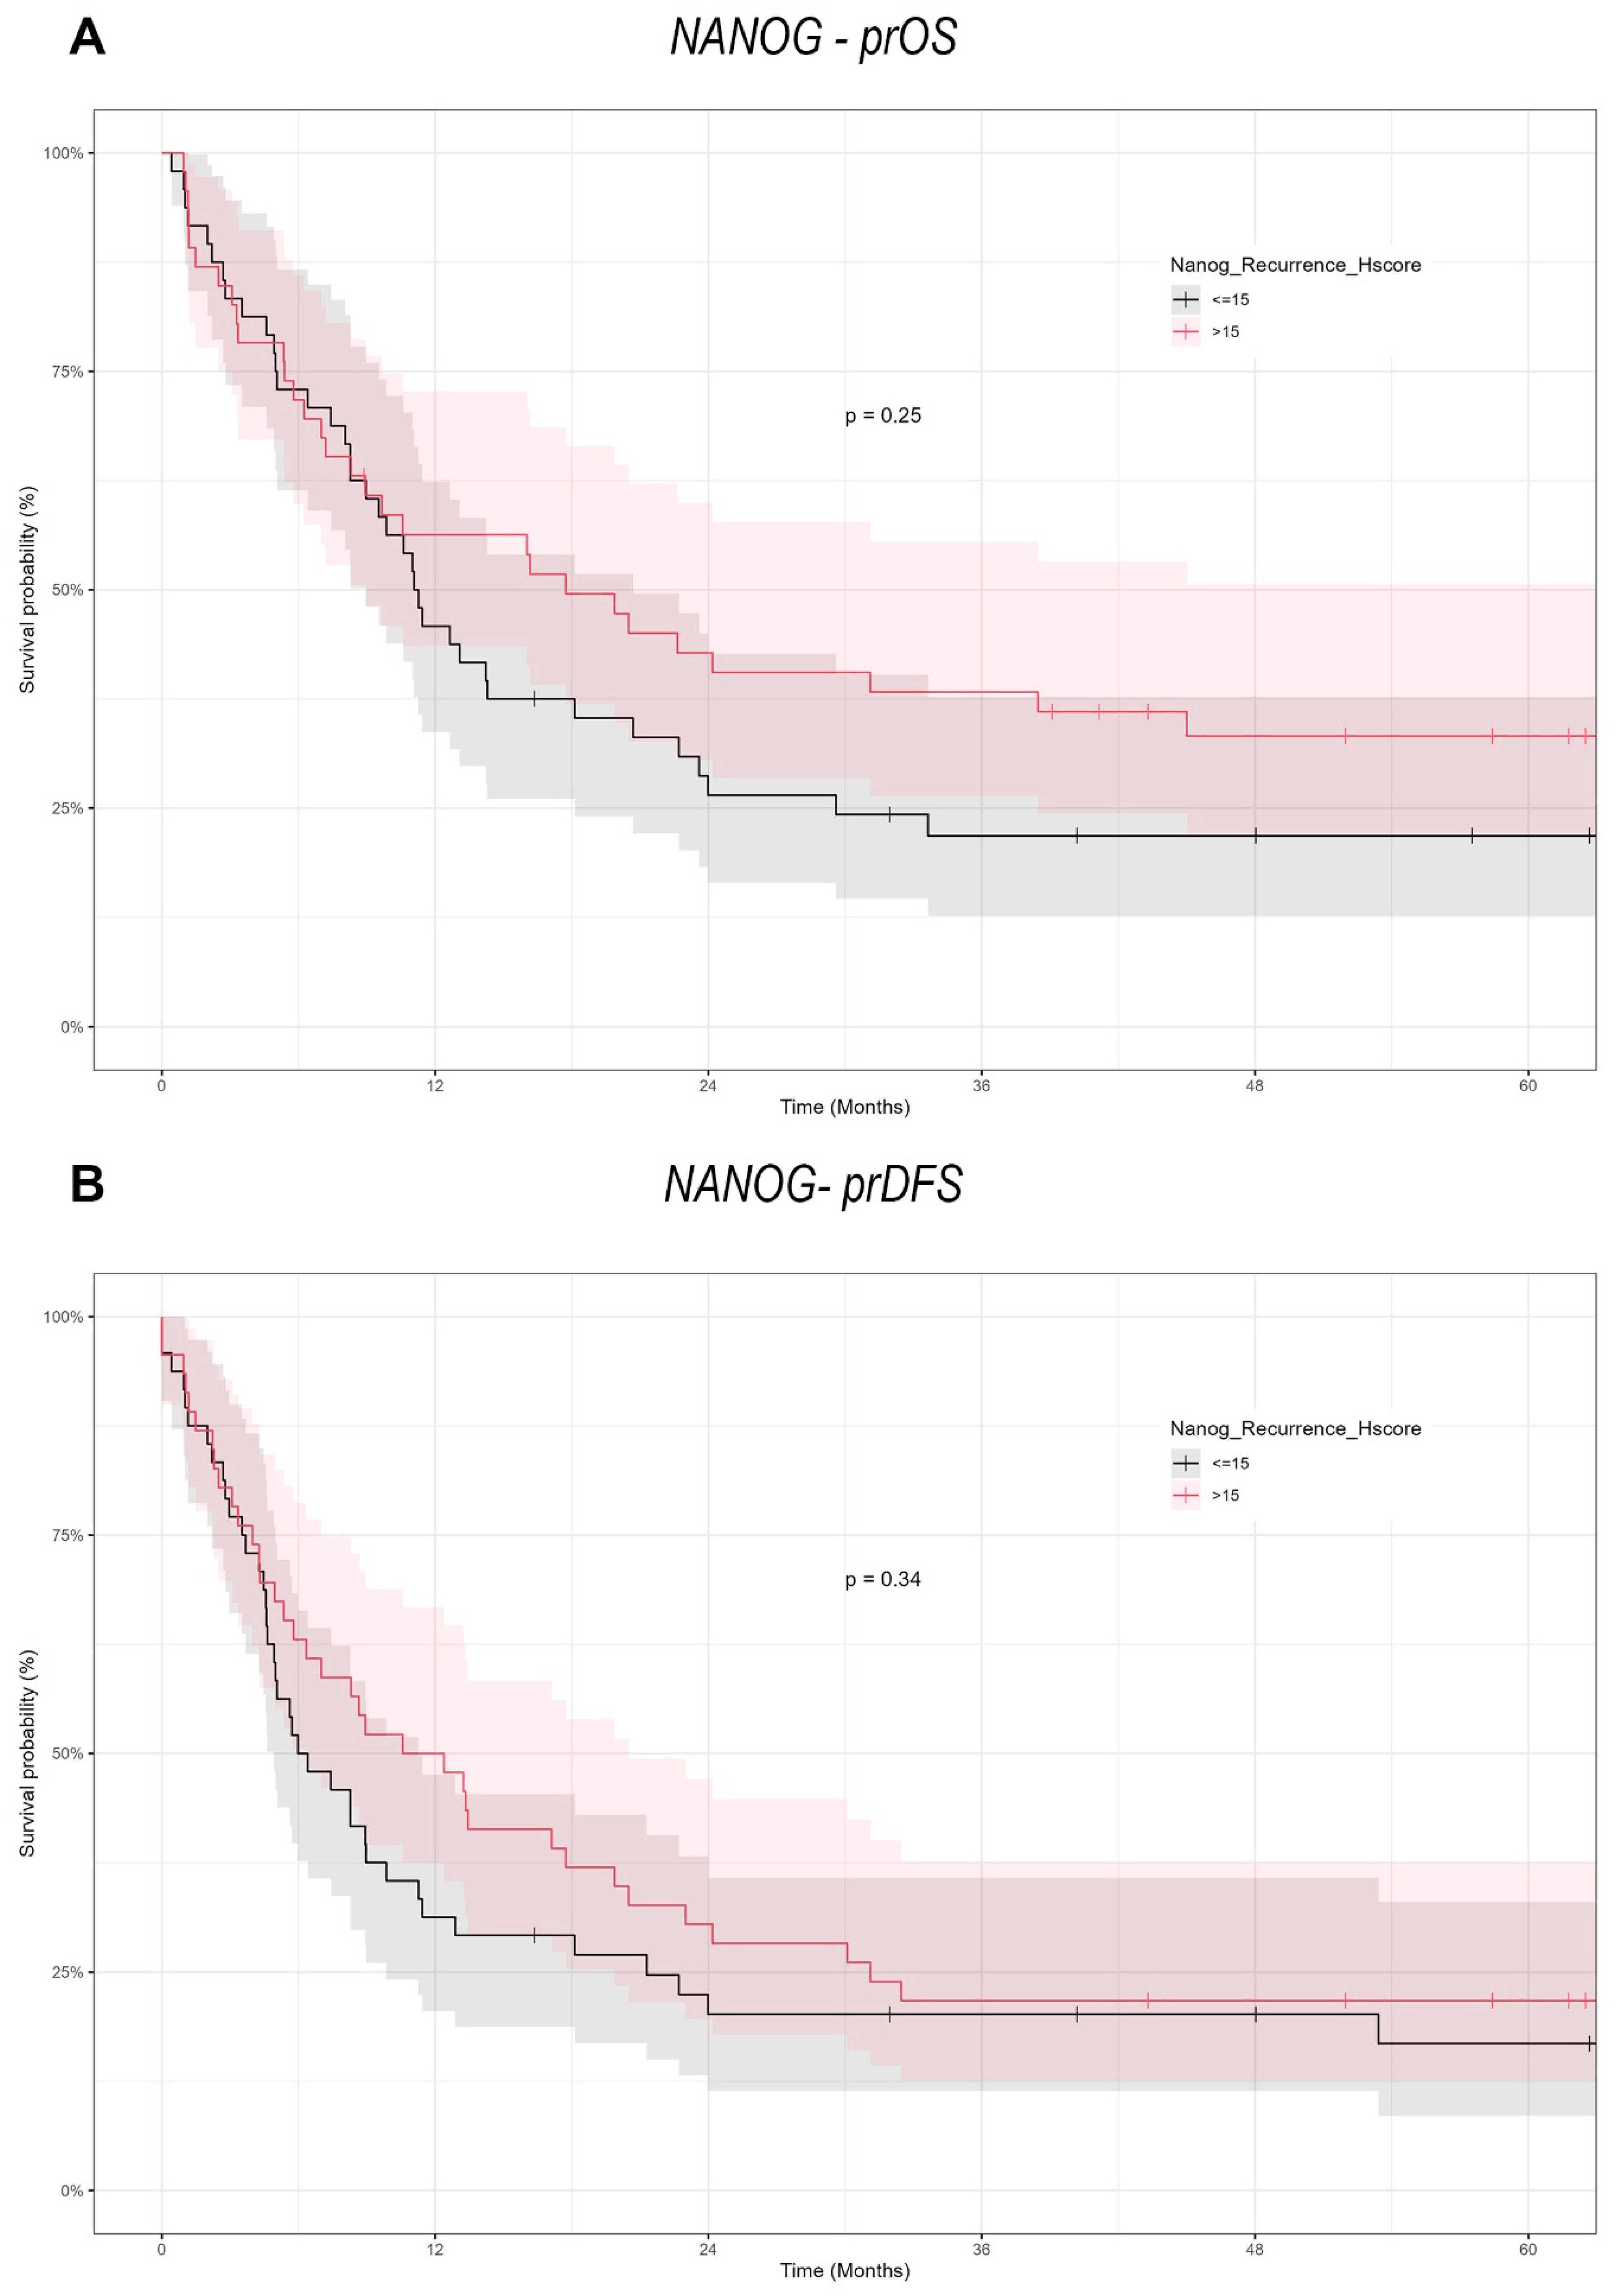
27]. Our results did not reveal a significant association between NANOG expression and survival in recurrent OSCC, suggesting its impact may be more relevant in tumor initiation or primary disease settings than at recurrence. For instance, while one group found that NANOG and Midkine overexpression correlated with advanced stages and poor prognosis, we did not observe a similar relationship in re-OSCC [48]. Similarly, Kashyap et al. identified NANOG as a driver of OSCC aggressiveness and cisplatin resistance, yet our data imply that in the recurrent context, NANOG expression does not predict survival [47]. In addition, studies by Lee et al. highlight that the co-expression of NANOG and mutant p53 is particularly detrimental for survival in primary OSCC [28]. However, such combined molecular interactions were not explored in our study of re-OSCC, pointing to additional complexities in NANOG-mediated pathways that might require further investigation.
While most evidence portrays SOX2 as an oncogenic driver in primary OSCC, our study suggests it may serve as a favorable prognostic biomarker in re-OSCC. One hypothesis is that elevated SOX2 expression at recurrence could reflect a more differentiated, therapy-responsive subpopulation, rather than one prone to unchecked aggression. Alternatively, SOX2 might activate pathways that specifically enhance sensitivity to second-line treatments or radiotherapy at recurrence.
In support of this, several meta-analyses have shown that SOX2 expression in non–small cell lung cancer (NSCLC) and esophageal squamous cell carcinoma (ESCC) correlates with better survival outcomes [49,50,51]. A similar pattern may be emerging in re-OSCC. By contrast, NANOG seems more strongly implicated in primary tumor aggressiveness and therapy resistance, particularly in facilitating radioresistance and cisplatin resistance [26,52].
Our findings further indicate that SOX2 expression is higher in recurrent tumors of patients who received adjuvant radiotherapy, implying a potential link between SOX2 status and therapy responsiveness. Silencing SOX2 or suppressing related signals, such as β-catenin and hedgehog, may improve therapeutic efficacy and overcome resistance in re-OSCC [41,53,54,55].
SOX2 is well known for its relationship with a number of druggable pathways, the most notable being the Notch pathway. According to Hao Wu et al., Notch1 and SOX2 have a positive feedback regulation mechanism, showing a strong relationship between the two components. This link suggests that targeting the Notch pathway could be a possible therapeutic option in SOX2-related diseases like glioma [56]. NANOG interacts with a variety of druggable pathways, including HA-CD44, STAT3, PKC, and metabolic pathways, which all contribute to drug resistance and tumor progression. Focusing on these interactions may enable novel treatment techniques to improve chemosensitivity and more effectively treat cancer [57,58,59].
Despite the fact that this study offers valuable insights into the prognostic significance of SOX2 and NANOG in re-OSCC, it is important to recognize its drawbacks. Initially, the data were obtained from a single-center cohort, which could affect the overall validity of the results. In order to verify these findings, it is necessary to conduct multicenter studies with more diverse and extensive patient populations. Secondly, the study lacks to provide mechanistic insights into how SOX2 influences tumor biology or treatment response, despite the fact that it demonstrates an association between SOX2 expression and improved survival. In order to investigate the functional role of SOX2 in re-OSCC, future research should incorporate in vitro and in vivo models. Furthermore, the investigation mainly utilizes immunohistochemical analysis, neglecting molecular profiling methodologies such as gene expression analysis or RNA sequencing, which could offer a more thorough comprehension of the regulatory pathways that regulate SOX2 and NANOG expression.
A data-driven methodology employing survival-based optimization established the H-score threshold for SOX2 in our samples. This threshold successfully categorized patients into prognostically separate categories, although it may not be universally relevant to other cohorts. Distinct datasets may demonstrate divergent distributions of SOX2 expression, requiring validation in different cohorts to ascertain its prognostic relevance. The fact that the majority of re-OSCC tumors demonstrate diminished SOX2 expression (median H-score ~14) underscores the significance of context-specific cutoff determination in biomarker research. The same applies to NANOG. At present, there is no universal agreement on the ideal H-score cutoffs for both SOX2 and NANOG in re-OSCC. The survival-based cutoff selection guarantees statistical validity, although it may not accurately represent biological thresholds that have practical relevance. Future research should focus on standardizing cutoff definitions utilizing multi-institutional data.
In conclusion, our study demonstrates the context-dependent functions of SOX2 and NANOG in re-OSCC. In contrast to many primary OSCC reports, which tend to indicate a poor prognosis due to SOX2 overexpression, we observed a significant positive correlation between SOX2 expression and prOS/prDFS in re-OSCC cells. On the other hand, NANOG lacked prognostic significance in this recurrent setting, which means that it may be more critical during the early stages of tumorigenesis. These results reinforce the necessity of conducting larger, multicenter trials to independently confirm the recurrent disease-specific functions of these CSC markers and to determine whether targeted inhibition or modulation of SOX2 and NANOG can enhance outcomes in re-OSCC. It will be essential to learn about the process in which CSC-related factors transition between primary and recurrent disease in order to create more personalized, effective therapeutic strategies for OSCC.

Author Contributions

M.F., J.R.-I. and S.G.H. conceptualized the study, while J.R.-I. and C.K. developed the methods. C.T., S.H., J.J. and M.F. acquired histological and follow-up data. A.P. conducted statistical analyses. Visualization was performed by M.F., C.K., M.R., D.R. and S.G.H. M.F. and S.G.H. interpreted the results and drafted the main manuscript. S.G.H. supervised the study. All authors have read and agreed to the published version of the manuscript.

Funding

This research and the authors listed received no external funding.

Institutional Review Board Statement

The study was conducted in accordance with the Declaration of Helsinki, and approved by the Institutional Review Board (Ethics Committee of the University of Lübeck—ID: 16-272A).

Informed Consent Statement

Informed consent was obtained from all subjects involved in the study.

Data Availability Statement

The data supporting the findings of this study are not publicly available due to privacy and ethical restrictions.

Conflicts of Interest

The authors have no conflict of interest to declare.

References

  1. Chamoli, A.; Gosavi, A.S.; Shirwadkar, U.P.; Wangdale, K.V.; Behera, S.K.; Kurrey, N.K.; Kalia, K.; Mandoli, A. Overview of oral cavity squamous cell carcinoma: Risk factors, mechanisms, and diagnostics. Oral Oncol. 2021, 121, 105451. [Google Scholar]
  2. Ballman, K.V. Biomarker: Predictive or Prognostic? J. Clin. Oncol. 2015, 33, 3968–3971. [Google Scholar]
  3. Weckx, A.; Riekert, M.; Grandoch, A.; Schick, V.; Zöller, J.E.; Kreppel, M. Time to recurrence and patient survival in recurrent oral squamous cell carcinoma. Oral Oncol. 2019, 94, 8–13. [Google Scholar]
  4. Mirzaei, S.; Paskeh, M.D.A.; Entezari, M.; reza Mirmazloomi, S.; Hassanpoor, A.; Aboutalebi, M.; Rezaei, S.; Hejazi, E.S.; Kakavand, A.; Heidari, H.; et al. SOX2 function in cancers: Association with growth, invasion, stemness and therapy response. Biomed. Pharmacother. 2022, 156, 113860. [Google Scholar]
  5. Giacomarra, V.; Tirelli, G.; Papanikolla, L.; Bussani, R. Predictive factors of nodal metastases in oral cavity and oropharynx carcinomas. Laryngoscope 1999, 109, 795–799. [Google Scholar]
  6. Wenzel, S.; Sagowski, C.; Kehrl, W.; Metternich, F.U. The prognostic impact of metastatic pattern of lymph nodes in patients with oral and oropharyngeal squamous cell carcinomas. Eur. Arch. Otorhinolaryngol. 2004, 261, 270–275. [Google Scholar]
  7. Caldeira, P.; Soto, A.M.L.; Aguiar, M.; Martins, C. Tumor depth of invasion and prognosis of early-stage oral squamous cell carcinoma: A meta-analysis. Oral Dis. 2019, 26, 1357–1365. [Google Scholar]
  8. Kim, M.J.; Ahn, K.-M. Prognostic factors of oral squamous cell carcinoma: The importance of recurrence and pTNM stage. Maxillofac. Plast. Reconstr. Surg. 2024, 46, 8. [Google Scholar]
  9. Shetty, K.; Kurle, V.; Greeshma, P.; Ganga, V.; Murthy, S.; Thammaiah, S.; Prasad, P.; Chavan, P.; Halkud, R.; Krishnappa, R. Salvage Surgery in Recurrent Oral Squamous Cell Carcinoma. Front. Oral Health 2022, 2, 815606. [Google Scholar]
  10. Jehn, P.; Dittmann, J.; Zimmerer, R.; Stier, R.; Jehn, M.; Gellrich, N.-C.; Tavassol, F.; Spalthoff, S. Survival Rates According to Tumour Location in Patients with Surgically Treated Oral and Oropharyngeal Squamous Cell Carcinoma. Anticancer. Res. 2019, 39, 2527–2533. [Google Scholar]
  11. Tsai, L.-L.; Yu, C.-C.; Chang, Y.-C.; Yu, C.-H.; Chou, M.-Y. Markedly increased Oct4 and Nanog expression correlates with cisplatin resistance in oral squamous cell carcinoma. J. Oral Pathol. Med. 2011, 40, 621–628. [Google Scholar]
  12. Fu, T.-Y.; Hsieh, I.-C.; Cheng, J.-T.; Tsai, M.-H.; Hou, Y.-Y.; Lee, J.-H.; Liou, H.-H.; Huang, S.-F.; Chen, H.-C.; Yen, L.-M.; et al. Association of OCT4, SOX2, and NANOG expression with oral squamous cell carcinoma progression. J. Oral Pathol. Med. 2016, 45, 89–95. [Google Scholar]
  13. Züllig, L.; Roessle, M.; Weber, C.; Graf, N.; Haerle, S.K.; Jochum, W.; Stoeckli, S.J.; Moch, H.; Huber, G.F. High sex determining region Y-box 2 expression is a negative predictor of occult lymph node metastasis in early squamous cell carcinomas of the oral cavity. Eur. J. Cancer 2013, 49, 1915–1922. [Google Scholar]
  14. Borsetto, D.; Higginson, J.A.; Aslam, A.; Al-Qamachi, L.; Dhanda, J.; Marioni, G.; Franchella, S.; Frigo, A.; Praveen, P.; Martin, T.; et al. Factors affecting prognosis in locoregional recurrence of oral squamous cell carcinoma. J. Oral Pathol. Med. 2019, 48, 206–213. [Google Scholar]
  15. Mücke, T.; Wagenpfeil, S.; Kesting, M.; Hölzle, F.; Wolff, K. Recurrence interval affects survival after local relapse of oral cancer. Oral Oncol. 2009, 45, 687–691. [Google Scholar]
  16. Snyder, V.; Reed-Newman, T.; Arnold, L.; Thomas, S.; Anant, S. Cancer Stem Cell Metabolism and Potential Therapeutic Targets. Front. Oncol. 2018, 8, 203. [Google Scholar]
  17. Kim, B.W.; Cho, H.; Choi, C.H.; Ylaya, K.; Chung, J.-Y.; Kim, J.-H.; Hewitt, S.M. Clinical significance of OCT4 and SOX2 protein expression in cervical cancer. BMC Cancer 2015, 15, 1015. [Google Scholar]
  18. Lee, S.H.; Oh, S.Y.; Do, S.I.; Lee, H.J.; Kang, H.J.; Rho, Y.S.; Bae, W.J.; Lim, Y.C. SOX2 regulates self-renewal and tumorigenicity of stem-like cells of head and neck squamous cell carcinoma. Br. J. Cancer 2014, 111, 2122–2130. [Google Scholar]
  19. Bourguignon, L.Y.; Wong, G.; Earle, C.; Chen, L. Hyaluronan-CD44v3 interaction with Oct4-Sox2-Nanog promotes miR-302 expression leading to self-renewal, clonal formation, and cisplatin resistance in cancer stem cells from head and neck squamous cell carcinoma. J. Biol. Chem. 2012, 287, 32800–32824. [Google Scholar]
  20. de Vicente, J.C.; Rodríguez-Santamarta, T.; Rodrigo, J.P.; Allonca, E.; Vallina, A.; Singhania, A.; Donate-Pérez del Molino, P.; García-Pedrero, J.M. The Emerging Role of NANOG as an Early Cancer Risk Biomarker in Patients with Oral Potentially Malignant Disorders. J. Clin. Med. 2019, 8, 1376. [Google Scholar] [CrossRef]
  21. Wang, M.L.; Chiou, S.H.; Wu, C.W. Targeting cancer stem cells: Emerging role of Nanog transcription factor. OncoTargets Ther. 2013, 6, 1207–1220. [Google Scholar]
  22. Steen, S.; Horn, D.; Flechtenmacher, C.; Hoffmann, J.; Freier, K.; Ristow, O.; Hess, J.; Moratin, J. Expression analysis of SOX2 and SOX9 in patients with oral squamous cell carcinoma. Head Neck 2025, 47, 437–451. [Google Scholar] [CrossRef]
  23. Zhang, S.; Xiong, X.; Sun, Y. Functional characterization of SOX2 as an anticancer target. Signal Transduct. Target. Ther. 2020, 5, 135. [Google Scholar] [CrossRef]
  24. Pedregal-Mallo, D.; Hermida-Prado, F.; Granda-Díaz, R.; Montoro-Jiménez, I.; Allonca, E.; Pozo-Agundo, E.; Álvarez-Fernández, M.; Álvarez-Marcos, C.; García-Pedrero, J.M.; Rodrigo, J.P. Prognostic Significance of the Pluripotency Factors NANOG, SOX2, and OCT4 in Head and Neck Squamous Cell Carcinomas. Cancers 2020, 12, 1794. [Google Scholar] [CrossRef]
  25. Barbosa, S.; Laureano, N.K.; Hadiwikarta, W.W.; Visioli, F.; Bonrouhi, M.; Pajdzik, K.; Conde-Lopez, C.; Herold-Mende, C.; Eidt, G.; Langie, R.; et al. The Role of SOX2 and SOX9 in Radioresistance and Tumor Recurrence. Cancers 2024, 16, 439. [Google Scholar] [CrossRef]
  26. Harati, M.D.; Rodemann, H.; Toulany, M. Nanog Signaling Mediates Radioresistance in ALDH-Positive Breast Cancer Cells. Int. J. Mol. Sci. 2019, 20, 1151. [Google Scholar] [CrossRef]
  27. Swain, N.; Thakur, M.; Pathak, J.; Swain, B. SOX2, OCT4 and NANOG: The core embryonic stem cell pluripotency regulators in oral carcinogenesis. J. Oral Maxillofac. Pathol. 2020, 24, 368–373. [Google Scholar] [CrossRef]
  28. Lee, H.-J.; Kang, Y.-H.; Lee, J.-S.; Byun, J.-H.; Kim, U.-K.; Jang, S.-J.; Rho, G.-J.; Park, B.-W. Positive expression of NANOG, mutant p53, and CD44 is directly associated with clinicopathological features and poor prognosis of oral squamous cell carcinoma. BMC Oral Health 2015, 15, 153. [Google Scholar] [CrossRef]
  29. Kołodziej-Rzepa, M.; Biesaga, B.; Słonina, D.; Mucha-Małecka, A. Nanog expression in patients with squamous cell carcinoma of oropharynx in relation to immunohistochemical score. Pol. J. Pathol. 2022, 73, 60–71. [Google Scholar] [CrossRef]
  30. Grubelnik, G.; Boštjančič, E.; Aničin, A.; Dovšak, T.; Zidar, N. MicroRNAs and Long Non-Coding RNAs as Regulators of NANOG Expression in the Development of Oral Squamous Cell Carcinoma. Front. Oncol. 2021, 10, 579053. [Google Scholar] [CrossRef]
  31. Charlson, M.E.; Pompei, P.; Ales, K.L.; MacKenzie, C.R. A new method of classifying prognostic comorbidity in longitudinal studies: Development and validation. J. Chronic Dis. 1987, 40, 373–383. [Google Scholar] [CrossRef]
  32. Hakim, S.G.; Taubitz, C.; Hoppe, S.; Steller, D.; Rades, D.; Ribbat-Idel, J.; Alsharif, U.; Falougy, M. Prognostic impact of the loss of E-cadherin and de novo expression of N-cadherin at the invasive front of primary and recurrent oral squamous cell carcinoma. Front. Oncol. 2023, 13, 1151879. [Google Scholar] [CrossRef]
  33. de Vicente, J.C.; Donate-Pérez Del Molino, P.; Rodrigo, J.P.; Allonca, E.; Hermida-Prado, F.; Granda-Díaz, R.; Rodríguez Santamarta, T.; García-Pedrero, J.M. SOX2 Expression Is an Independent Predictor of Oral Cancer Progression. J. Clin. Med. 2019, 8, 1744. [Google Scholar] [CrossRef]
  34. Grubelnik, G.; Boštjančič, E.; Grošelj, A.; Zidar, N. Expression of NANOG and Its Regulation in Oral Squamous Cell Carcinoma. BioMed Res. Int. 2020, 2020, 8573793. [Google Scholar]
  35. Rizzo, D.; Graziani, C.; Gallus, R.; Zannoni, G.; Lucchetti, D.; Parrilla, C.; Boninsegna, A.; Galli, J.; Paludetti, G.; Bussu, F.; et al. Stem cell markers in oral and oropharyngeal squamous cell carcinomas in relation to the site of origin and HPV infection: Clinical implications. Acta Otorhinolaryngol. Ital. 2020, 40, 90–98. [Google Scholar] [CrossRef]
  36. Bankhead, P.; Loughrey, M.B.; Fernández, J.A.; Dombrowski, Y.; McArt, D.G.; Dunne, P.D.; McQuaid, S.; Gray, R.T.; Murray, L.J.; Coleman, H.G.; et al. QuPath: Open source software for digital pathology image analysis. Sci. Rep. 2017, 7, 16878. [Google Scholar] [CrossRef]
  37. Jagomast, T.; Idel, C.; Klapper, L.; Kuppler, P.; Proppe, L.; Beume, S.; Falougy, M.; Steller, D.; Hakim, S.G.; Offermann, A.; et al. Comparison of manual and automated digital image analysis systems for quantification of cellular protein expression. Histol. Histopathol. 2022, 37, 527–541. [Google Scholar]
  38. Meyerholz, D.K.; Beck, A.P. Principles and approaches for reproducible scoring of tissue stains in research. Lab. Investig. 2018, 98, 844–855. [Google Scholar] [CrossRef]
  39. Wang, X.; Liang, Y.; Chen, Q.; Xu, H.-M.; Ge, N.; Luo, R.-Z.; Shao, J.-Y.; He, Z.; Zeng, Y.-X.; Kang, T.; et al. Prognostic Significance of SOX2 Expression in Nasopharyngeal Carcinoma. Cancer Investig. 2012, 30, 79–85. [Google Scholar]
  40. Bayo, P.; Jou, A.; Stenzinger, A.; Shao, C.; Gross, M.; Jensen, A.; Grabe, N.; Mende, C.H.; Rados, P.V.; Debus, J.; et al. Loss of SOX2 expression induces cell motility via vimentin up-regulation and is an unfavorable risk factor for survival of head and neck squamous cell carcinoma. Mol. Oncol. 2015, 9, 1704–1719. [Google Scholar] [CrossRef]
  41. Chung, J.H.; Jung, H.R.; Jung, A.R.; Lee, Y.C.; Kong, M.; Lee, J.-S.; Eun, Y.-G. SOX2 activation predicts prognosis in patients with head and neck squamous cell carcinoma. Sci. Rep. 2018, 8, 1677. [Google Scholar]
  42. Freier, K.; Knoepfle, K.; Flechtenmacher, C.; Pungs, S.; Devens, F.; Toedt, G.; Hofele, C.; Joos, S.; Lichter, P.; Radlwimmer, B. Recurrent copy number gain of transcription factor SOX2 and corresponding high protein expression in oral squamous cell carcinoma. Genes Chromosomes Cancer 2010, 49, 9–16. [Google Scholar]
  43. Sacco, A.; Battaglia, A.M.; Santamaria, G.; Buffone, C.; Barone, S.; Procopio, A.; Lavecchia, A.M.; Aversa, I.; Giorgio, E.; Petriaggi, L.; et al. SOX2 promotes a cancer stem cell-like phenotype and local spreading in oral squamous cell carcinoma. PLoS ONE 2023, 18, e0293475. [Google Scholar]
  44. Zhu, Y.; Huang, S.; Chen, S.; Chen, J.; Wang, Z.; Wang, Y.; Zheng, H. SOX2 promotes chemoresistance, cancer stem cells properties, and epithelial–mesenchymal transition by β-catenin and Beclin1/autophagy signaling in colorectal cancer. Cell Death Dis. 2021, 12, 449. [Google Scholar]
  45. Yang, F.; Gao, Y.; Geng, J.; Qu, D.; Han, Q.; Qi, J.; Chen, G. Elevated expression of SOX2 and FGFR1 in correlation with poor prognosis in patients with small cell lung cancer. Int. J. Clin. Exp. Pathol. 2013, 6, 2846–2854. [Google Scholar]
  46. Jeter, C.R.; Liu, B.; Liu, X.; Chen, X.; Liu, C.; Calhoun-Davis, T.; Repass, J.; Zaehres, H.; Shen, J.J.; Tang, D.G. NANOG promotes cancer stem cell characteristics and prostate cancer resistance to androgen deprivation. Oncogene 2011, 30, 3833–3845. [Google Scholar]
  47. Kashyap, T.; Nath, N.; Mishra, P.; Jha, A.; Nagini, S.; Mishra, R. Pluripotency transcription factor Nanog and its association with overall oral squamous cell carcinoma progression, cisplatin-resistance, invasion and stemness acquisition. Head. Neck 2020, 42, 3282–3294. [Google Scholar]
  48. Kim, H.-M.; Kang, Y.-H.; Byun, J.-H.; Jang, S.-J.; Rho, G.-J.; Lee, J.-S.; Park, B.-W. Midkine and NANOG Have Similar Immunohistochemical Expression Patterns and Contribute Equally to an Adverse Prognosis of Oral Squamous Cell Carcinoma. Int. J. Mol. Sci. 2017, 18, 2339. [Google Scholar] [CrossRef]
  49. Chen, Y.; Huang, Y.; Huang, Y.; Chen, J.; Wang, S.; Zhou, J. The Prognostic Value of SOX2 Expression in Non-Small Cell Lung Cancer: A Meta-Analysis. PLoS ONE 2013, 8, e71140. [Google Scholar]
  50. Li, Q.; Liu, F.; Zhang, Y.; Fu, L.; Wang, C.; Chen, X.; Guan, S.-H.; Meng, X. Association of SOX2 and Nestin DNA amplification and protein expression with clinical features and overall survival in non-small cell lung cancer: A systematic review and meta-analysis. Oncotarget 2016, 7, 34520–34531. [Google Scholar]
  51. Wang, H.; Zhou, Y.; Liu, Q.; Xu, J.; Ma, Y. Prognostic value of SOX2, Cyclin D1, P53, and ki-67 in patients with esophageal squamous cell carcinoma. OncoTargets Ther. 2018, 11, 5171–5181. [Google Scholar]
  52. Tanno, B.; Leonardi, S.; Babini, G.; Giardullo, P.; De Stefano, I.; Pasquali, E.; Saran, A.; Mancuso, M. Nanog-driven cell-reprogramming and self-renewal maintenance in Ptch1+/− granule cell precursors after radiation injury. Sci. Rep. 2017, 7, 14238. [Google Scholar]
  53. Chou, M.; Hu, F.-W.; Yu, C.H.; Yu, C.-C. Sox2 expression involvement in the oncogenicity and radiochemoresistance of oral cancer stem cells. Oral Oncol. 2015, 51, 31–39. [Google Scholar]
  54. Hägerstrand, D.; He, X.; Lindh, M.B.; Hoefs, S.; Hesselager, G.; Östman, A.; Nistér, M. Identification of a SOX2-dependent subset of tumor- and sphere-forming glioblastoma cells with a distinct tyrosine kinase inhibitor sensitivity profile. Neuro-Oncology 2011, 13, 1178–1191. [Google Scholar]
  55. Wang, S.; Li, Z.; Li, P.-P.; Li, L.; Liu, Y.; Feng, Y.-L.; Li, R.; Xia, S. SOX2 Promotes Radioresistance in Non-small Cell Lung Cancer by Regulating Tumor Cells Dedifferentiation. Int. J. Med. Sci. 2023, 20, 781–796. [Google Scholar] [PubMed]
  56. Wu, H.; Wei, M.; Li, Y.; Zhang, H. Research Progress on the Regulation Mechanism of Key Signal Pathways Affecting the Prognosis of Glioma. Front. Mol. Neurosci. 2022, 15, 910543. [Google Scholar]
  57. Bourguignon, L.Y.W.; Spevak, C.C.; Wong, G.; Xia, W.; Gilad, E. Hyaluronan-CD44 Interaction with Protein Kinase Cε Promotes Oncogenic Signaling by the Stem Cell Marker Nanog and the Production of MicroRNA-21, Leading to Down-regulation of the Tumor Suppressor Protein PDCD4, Anti-apoptosis, and Chemotherapy Resistance in Breast Tumor Cells. J. Biol. Chem. 2009, 284, 26533–26546. [Google Scholar]
  58. Bourguignon, L.; Earle, C.; Wong, G.; Spevak, C.; Krueger, K. Stem Cell Marker (Nanog) and Stat-3 Signaling Promote MicroRNA-21 Expression and Chemoresistance in Hyaluronan/CD44-activated Head and Neck Squamous Cell Carcinoma Cells. Oncogene 2011, 31, 149–160. [Google Scholar]
  59. Chen, C.-L.; Kumar, D.U.; Punj, V.; Xu, J.; Sher, L.; Tahara, S.; Hess, S.; Machida, K. NANOG Metabolically Reprograms Tumor-Initiating Stem-like Cells through Tumorigenic Changes in Oxidative Phosphorylation and Fatty Acid Metabolism. Cell Metab. 2016, 23, 206–219. [Google Scholar]
Figure 1. Flowchart illustrating patient selection and stratification. Cancer patients treated at the University Hospital of Lübeck were screened, with the majority excluded based on predefined criteria. The final cohort consisted of patients with re-OSCC who underwent curative treatment. These patients were further categorized based on SOX2 and NANOG expression levels and stratified by treatment modality, including surgery alone, RT, and RCT.
Cancers 17 01181 g001
Figure 2. An example of an immunohistochemical staining of OSCC TMA cores (A) SOX2 expression with nuclear staining. (B) NANOG expression with cytoplasmic staining. Bar = 200 µm.
Cancers 17 01181 g002
Figure 3. Representative images of stained TMA cores for SOX2 (AC) and NANOG (DF), showing weak (A,D), moderate (B,E), and strong (C,F) immunohistochemical staining. The scale bar indicates 200 µm.
Cancers 17 01181 g003
Figure 4. Box plots comparing SOX2 (A) and NANOG (B) expression between primary and recurrent OSCC tumors, stratified by therapy. Statistical differences were detected by the Wilcoxon rank sum test.
Cancers 17 01181 g004
Figure 5. Kaplan–Meier survival curves illustrating the impact of SOX2 expression on survival outcomes in re-OSCC patients. (A) Curves for prOS showing significantly worse survival in patients with lower SOX2 expression (H-score ≤ 14). (B) Curves for prDFS similarly indicating poorer survival associated with lower SOX2 expression levels.
Cancers 17 01181 g005
Figure 6. Kaplan–Meier survival curves illustrating the impact of NANOG expression on survival outcomes in re-OSCC patients. (A) Curves for prOS showing no significant difference in survival based on NANOG expression levels (H-score ≤ 15 vs. >15). (B) Curves for prDFS also demonstrating no significant survival differences related to NANOG expression.
Cancers 17 01181 g006
Table 1. Markers used for the immunohistochemical staining of the tissue blocks.
AntibodyIsotypeStaining PatternCompanyConcentration/
Dilution
SOX2IgG (Rabbit polyclonal)nuclearAbcam1 µg/mL
NANOGIgG (Rabbit monoclonal)cytoplasmicAbcam1:1000–1:2500
Table 2. Baseline demographics of all patients and their tumor characteristics.
CharacteristicN = 94
Median Age62 (52, 71)
Median Age at recurrence 63 (53, 72)
Sex
Female30 (32%)
Male64 (68%)
CCI score
059 (63%)
1≤34 (37%)
Missing1
Smoking status
Never20 (22%)
Former or current69 (78%)
Missing5
Alcohol consumption
None or moderate35 (40%)
Excessive52 (60%)
Missing7
Site of recurrence
Anterior tongue11 (12%)
Cheek/vestibule/retromolar13 (14%)
Floor of mouth39 (41%)
Lip2 (2.1%)
Neck only15 (16%)
Oropharynx11 (12%)
Palate3 (3.2%)
rT
rT124 (26%)
rT216 (18%)
rT310 (11%)
rT428 (31%)
rTx13 (14%)
Missing3
rN
rN029 (32%)
rN+/x63 (68%)
Missing2
rM
rM0/x83 (91%)
rM18 (8.8%)
Missing3
Resection margins
R019 (68%)
R1/2/x9 (32%)
Missing66
Grade
Well6 (8.8%)
Moderate40 (59%)
Poor22 (32%)
Missing26
Table 3. Survival events in the patients’ cohort according to the H-score-based cutoff by SOX2 expression.
CharacteristicOverall, N = 94 1≤14, N = 47 1>14, N = 47 1
Death of any cause
Alive or censored27 (29%)8 (17%)19 (40%)
Dead67 (71%)39 (83%)28 (60%)
Cause of death
Alive or censored27 (29%)8 (17%)19 (40%)
Death from oral cancer57 (61%)33 (70%)24 (51%)
Death from other causes10 (11%)6 (13%)4 (8.5%)
prDFS
Censored18 (19%)5 (11%)13 (28%)
Death from oral cancer36 (38%)20 (43%)16 (34%)
Death from other causes9 (9.6%)6 (13%)3 (6.4%)
Locoregional recurrence31 (33%)16 (34%)15 (32%)
1 n (%).
Table 4. Survival events in the patients’ cohort according to the H-score-based cutoff by NANOG expression.
CharacteristicOverall, N = 94 1≤15, N = 48 1>15, N = 46 1
Death of any cause
Alive or censored27 (29%)11 (23%)16 (35%)
Dead67 (71%)37 (77%)30 (65%)
Cause of death
Alive or censored27 (29%)11 (23%)16 (35%)
Death from oral cancer57 (61%)30 (63%)27 (59%)
Death from other causes10 (11%)7 (15%)3 (6.5%)
prDFS
Censored18 (19%)9 (19%)9 (20%)
Death from oral cancer36 (38%)18 (38%)18 (39%)
Death from other causes9 (9.6%)7 (15%)2 (4.3%)
Locoregional recurrence31 (33%)14 (29%)17 (37%)
1 n (%).
Table 5. Hazards ratios for different prognostic factors in recurrence specimens using the H-score-based cutoffs of SOX2.
prDFSprOS
CharacteristicHR 195% CI 1p-ValueHR 195% CI 1p-Value
Age at recurrence diagnosis1.011.00, 1.020.21.011.00, 1.020.3
CCI score
0
1≤1.360.80, 2.320.31.140.64, 2.010.7
rT
rT1
rT23.511.53, 8.070.0033.561.36, 9.310.010
rT33.011.22, 7.460.0175.702.09, 15.5<0.001
rT42.481.22, 5.040.0123.581.59, 8.050.002
rTx2.230.97, 5.120.0592.450.98, 6.150.056
rN
rN0
rN+/x1.951.11, 3.430.0212.871.52, 5.390.001
SOX2_recurrence_H-score
≤14
>140.600.35, 1.010.0540.540.31, 0.940.030
1 HR = Hazard Ratio, CI = Confidence Interval. Bold values indicate statistical significance.
Table 6. Hazards ratios for different prognostic factors in recurrence specimens using the H-score-based cutoffs of NANOG.
prDFSprOS
CharacteristicHR 195% CI 1p-ValueHR 195% CI 1p-Value
Age at recurrence diagnosis1.011.00, 1.020.141.010.99, 1.020.4
CCI score
0
1 ≤1.230.73, 2.090.41.000.57, 1.75>0.9
rT
rT1
rT24.772.07, 11.0<0.0014.911.86, 13.00.001
rT33.191.25, 8.170.0155.932.08, 16.9<0.001
rT43.081.52, 6.250.0024.391.91, 10.1<0.001
rTx2.491.09, 5.690.0312.791.11, 6.980.029
rN
rN0
rN+/x1.921.08, 3.430.0272.851.48, 5.460.002
NANOG_recurrence_H-score
≤15
>151.110.67, 1.850.71.060.61, 1.860.8
1 HR = Hazard Ratio, CI = Confidence Interval. Bold values indicate statistical significance.
Table 7. SOX2 expression in primary and recurrence tumors divided by therapy modality.
SOX2
Primary, N = 94 1Recurrence, N = 94 1p-Value 2
Median (IQR)26.631 (1.832, 54.559)13.963 (2.270, 50.861)0.621
Missing261
Adjuvant RT
Primary, N = 15 1Recurrence, N = 15 1p-Value 2
Median (IQR)35.061 (8.521, 40.421)52.670 (12.753, 64.455)0.28
Missing21
Adjuvant RCT
Primary, N = 21 1Recurrence, N = 21 1p-Value 2
Median (IQR)2.117 (0.394, 26.814)6.871 (0.738, 14.510)0.583
Missing70
Surgery without Adjuvant
Primary, N = 58 1Recurrence, N = 58 1p-Value 2
Median (IQR)32.745 (5.406, 63.892)16.262 (2.441, 45.815)0.19
Missing170
1 Median (IQR); 2 Wilcoxon rank sum test, RT: Radiotherapy, RCT: Radiochemotherapy.
Table 8. NANOG expression in primary and recurrence tumors divided by therapy modality.
NANOG
Primary, N = 94 1Recurrence, N = 94 1p-Value 2
Median (IQR)42.221 (8.585, 57.148)8.652 (1.177, 23.368)<0.001
Missing270
Adjuvant RT
Primary, N = 15 1Recurrence, N = 15 1p-Value 2
Median (IQR)42.663 (22.019, 46.080)12.123 (1.431, 51.833)0.555
Missing20
Adjuvant RCT
Median (IQR)Primary, N = 21 1Recurrence, N = 21 1p-Value 2
Missing33.654 (1.852, 43.796)11.479 (3.231, 18.331)0.414
70
Surgery without Adjuvant
Median (IQR)Primary, N = 58 1Recurrence, N = 58 1p-Value 2
Missing44.814 (15.930, 61.558)7.187 (0.943, 23.241)<0.001
180
1 Median (IQR); 2 Wilcoxon rank sum test, RT: Radiotherapy, RCT: Radiochemotherapy.
Disclaimer/Publisher’s Note: The statements, opinions and data contained in all publications are solely those of the individual author(s) and contributor(s) and not of MDPI and/or the editor(s). MDPI and/or the editor(s) disclaim responsibility for any injury to people or property resulting from any ideas, methods, instructions or products referred to in the content.

