
Predictors for Emergency Admission Among Homeless Metastatic Cancer Patients and Association of Social Determinants of Health with Negative Health Outcomes


Simple Summary
Abstract
1. Introduction
2. Methods
2.1. Study Design and Data Source
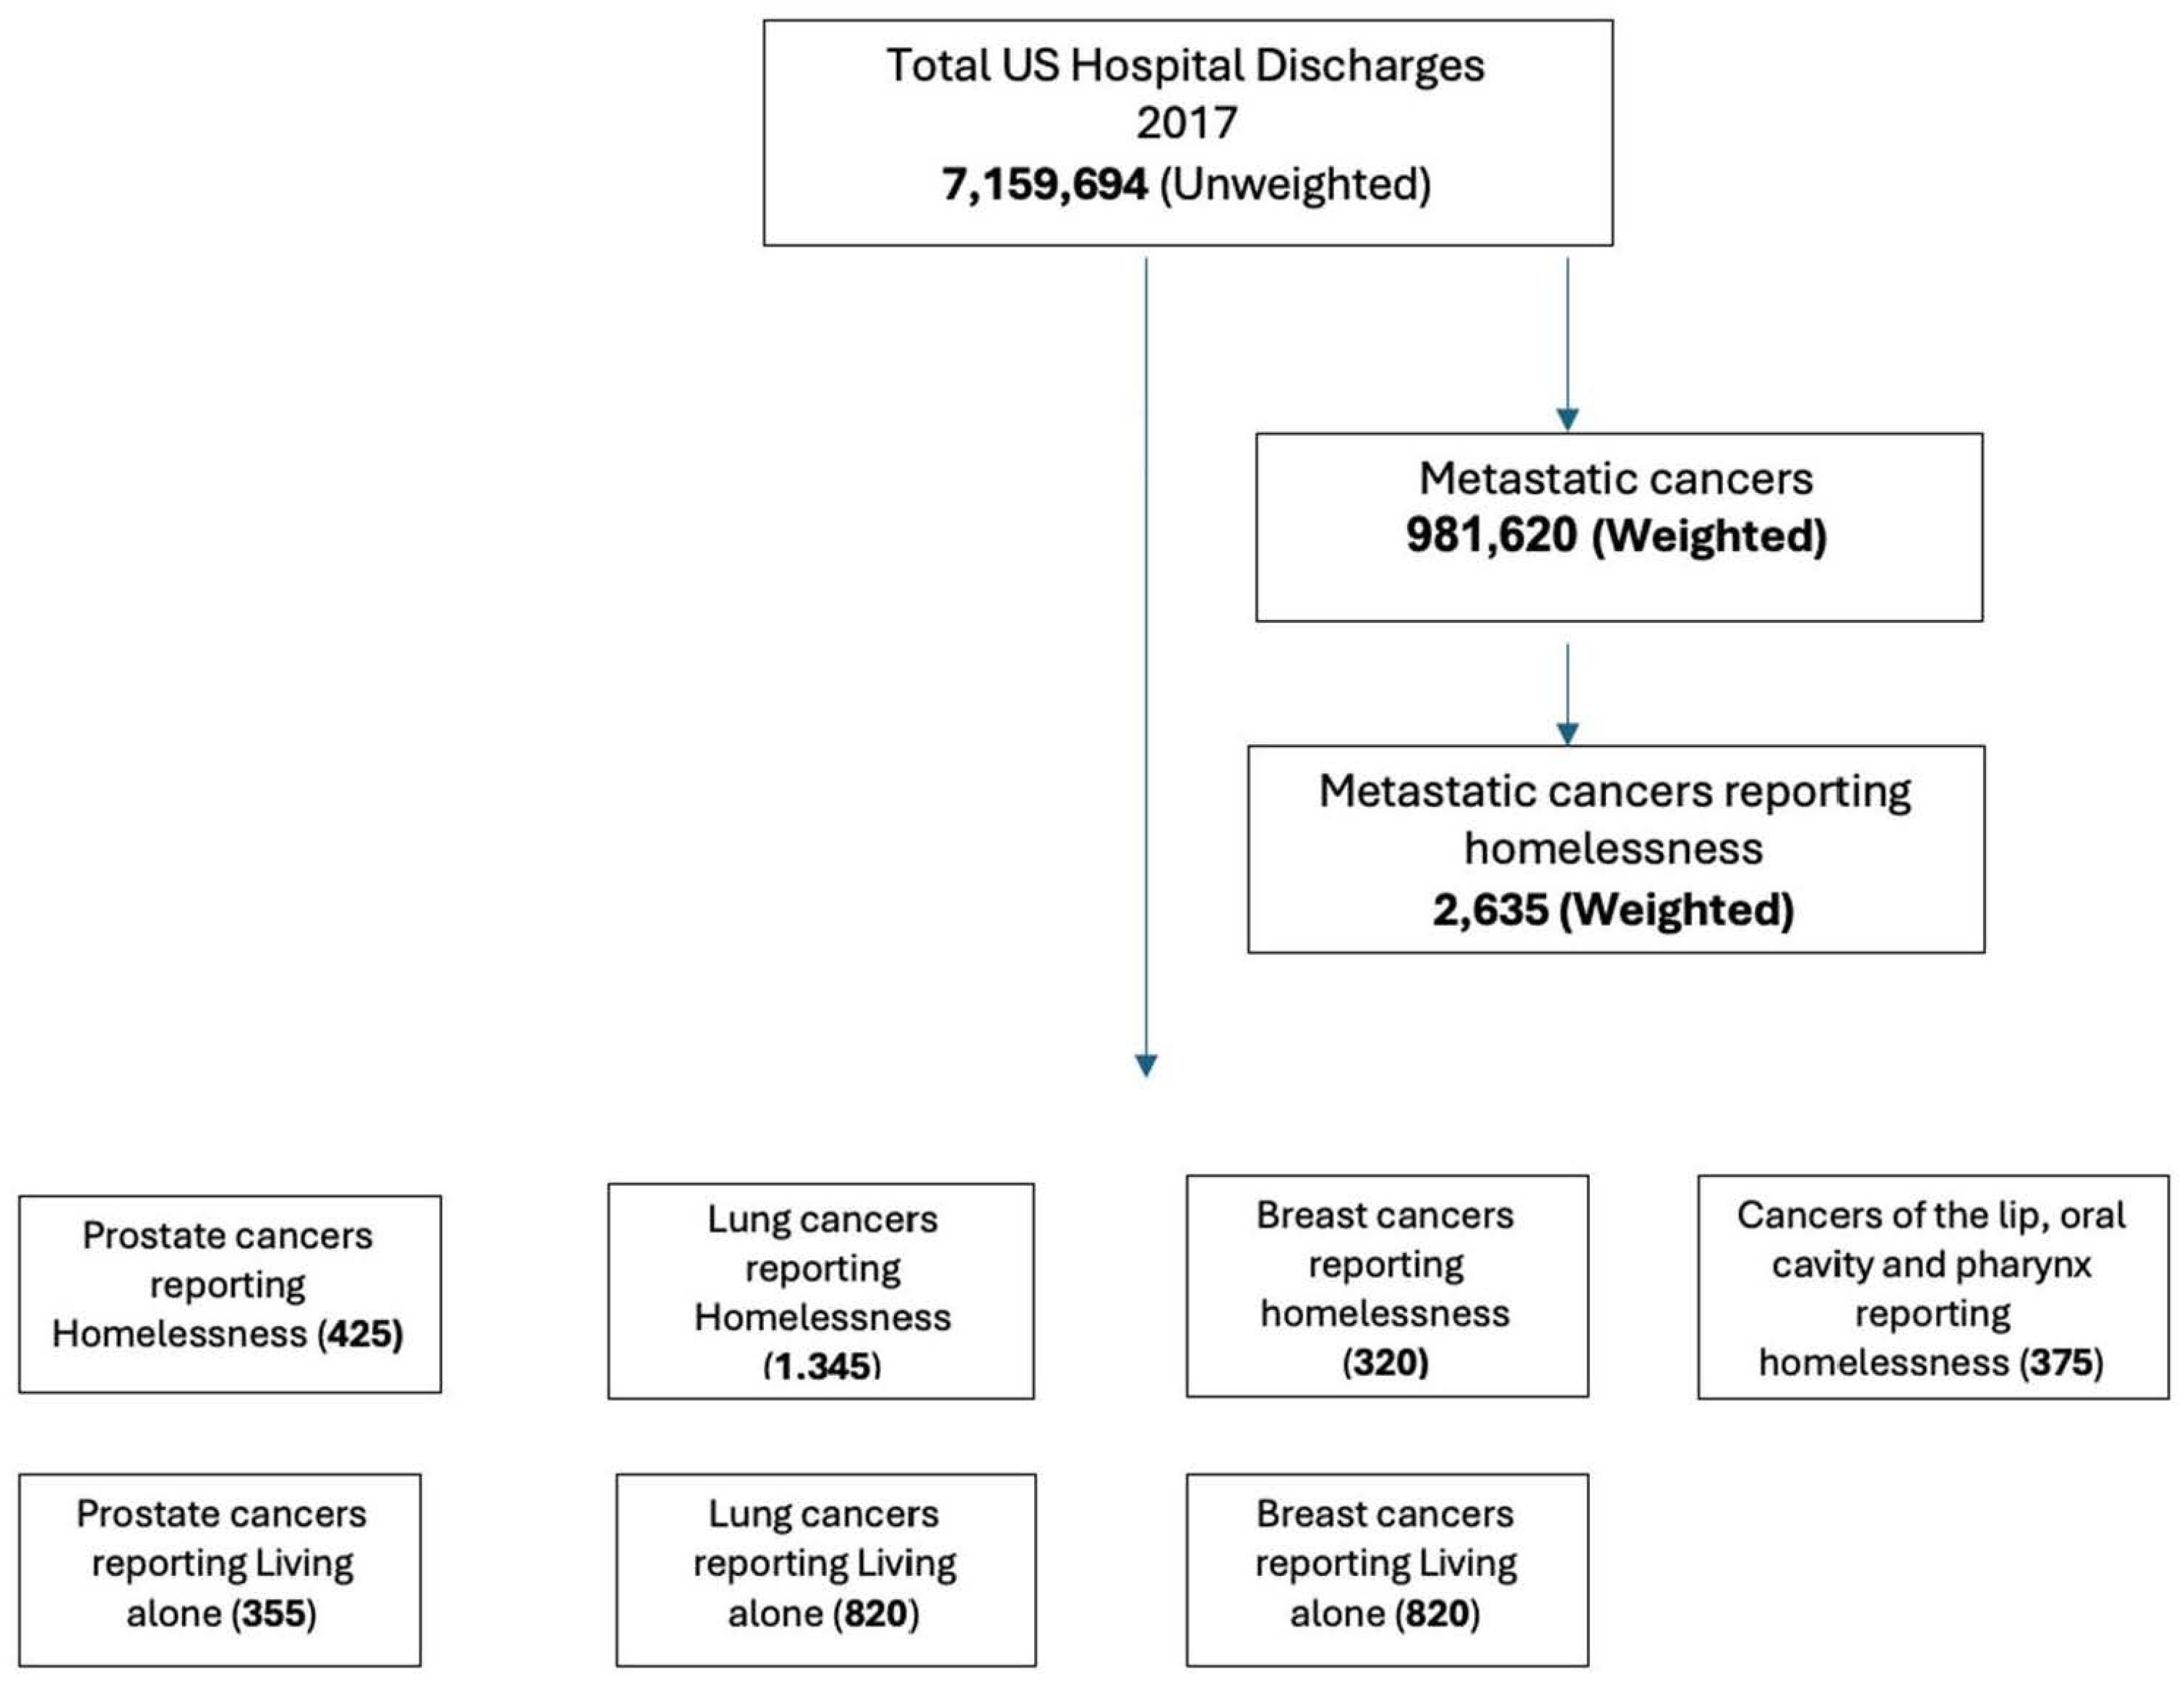
2.2. Study Population
2.3. Study Measurements
2.4. Statistical Analysis
2.4.1. Prediction Models and Risk Factor Analysis
2.4.2. Association with Outcomes
3. Results
3.1. Prediction Model and Risk Factors
3.2. PC Cohort and Homelessness
3.3. PC Cohort and PrbLA
3.4. BC Cohort and Homelessness
3.5. BC Cohort and PrbLA
3.6. LC Cohorts and Homelessness
3.7. LC Cohorts and PrbLA
3.8. CLOP Cohorts and Homelessness
3.9. Factors Associated with Risk of Homelessness and PrbLA and the Outcome of Anxiety and Depression and LOS Among PC, LC, BC, and CLOP Cancer Patients
4. Discussion
- While certain homeless individuals may seek treatment in hospitals either ambulatory or in-hospital admission care, others become ensnared in a detrimental cycle of homelessness and hospitalization [68,69]; nevertheless, this may not apply to cancer patients. However, the period preceding homelessness is associated with an increased likelihood of hospitalization [70]. Research shows that medical emergencies and SDOHs are associated with emergency admissions [70,71]. Furthermore, among cancer patients, this might be exacerbated by SDOHs and predictive factors such as transferred in or not from another facility, elective admission or not, deficiency anemia, alcohol dependence, weekend admission or not, and blood loss anemia. Additional research is needed to identify the outcome of infectious complications and healthcare-associated complications in this cohort that additionally impact the burden of illness among cancer patients.
- There is insufficient study on integrating data on homelessness with hospitalized or ambulatory care systems for cancer patients. Research on the financial demands and healthcare consumption patterns of cancer patients is limited, and the existing studies often concentrate on certain demographics or service categories. The current study indicates that patients utilized Medicaid or Medicare services more frequently before and after their enrollment in shelters, motels, relative housing, or their own residences, following recent housing insecurity that likely contributed to homelessness. Upon analyzing Medicaid, Medicare, and income-based housing status, it was found that residency in neighborhoods containing shelters, motels, relative housing, or personal housing—regardless of employment status—was frequently mandated.
- A deeper comprehension of the correlation between homelessness in cancer patients and healthcare systems should guide future initiatives. The use of hospitals during periods of homelessness may reveal the potential role of health systems in preventing or alleviating homelessness, the effects of housing instability on health and healthcare utilization, and the distinct implications of homelessness on healthcare consumption compared to standard hospitalization. This study addresses a significant information deficit by examining the temporal patterns of hospitalizations and emergency department visits related to individuals experiencing and getting out of homelessness.
- Homeless individuals frequently incur elevated healthcare expenses due to restricted access to primary care, increased dependence on emergency services, and heightened hospitalization rates for preventable conditions, resulting in substantial financial burdens for taxpayers and healthcare systems. Factors contributing to elevated healthcare expenditures encompass restricted access to primary care, resulting in several homeless individuals lacking health insurance, a primary care physician, or consistent healthcare access, which culminates in deferred treatment and exacerbated health issues. This elucidates the augmented utilization of emergency departments, resulting in recurrent visits and elevated expenses per patient.Homeless individuals exhibit a higher propensity for hospitalization, frequently for ailments that may be addressed in more economical environments, hence exacerbating overall healthcare expenditures related to mental health and substance addiction. Housing instability can aggravate health issues and result in increased healthcare consumption. A 2006 study revealed that the mean annual expenditure for a recurrent emergency department client facing homelessness was USD 64,000. Hospital expenses for homeless patients, both in total and per hospitalization, can be markedly greater than those for housed patients [72].Individuals experiencing housing instability are more prone to possess Medicaid coverage or lack insurance altogether, resulting in their care expenses frequently being borne by state programs and hospitals. In addition to direct healthcare expenses, homelessness incurs secondary economic consequences, including diminished productivity and heightened expenditures related to incarceration.
5. Conclusions
6. Limitations
Supplementary Materials
Author Contributions
Funding
Institutional Review Board Statement
Informed Consent Statement
Data Availability Statement
Acknowledgments
Conflicts of Interest
References
- Available online: https://health.gov/healthypeople/objectives-and-data/social-determinants-health (accessed on 23 March 2023).
- Penman-Aguilar, A.; Talih, M.; Huang, D.P.; Moonesinghe, R.P.; Bouye, K.; Beckles, G.M. Measurement of Health Disparities, Health Inequities, and Social Determinants of Health to Support the Advancement of Health Equity. J. Public Health Manag. Pract. 2016, 22, S33–S42. [Google Scholar] [CrossRef] [PubMed] [PubMed Central]
- Gottlieb, L.M.; Wing, H.; Adler, N.E. A Systematic Review of Interventions on Patients’ Social and Economic Needs. Am. J. Prev. Med. 2017, 53, 719–729. [Google Scholar] [CrossRef] [PubMed]
- Meyer, P.A.; Penman-Aguilar, A.; Campbell, V.A.; Graffunder, C.; O’Connor, A.E.; Yoon, P.W.; Centers for Disease Control and Prevention (CDC). Conclusion and future directions: CDC Health Disparities and Inequalities Report—United States, 2013. MMWR Suppl. 2013, 62, 184–186. [Google Scholar] [PubMed]
- Walter, L.A.; Schoenfeld, E.M.; Smith, C.H.; Shufflebarger, E.; Khoury, C.; Baldwin, K.; Hess, J.; Heimann, M.; Crosby, C.; Sontheimer, S.Y.; et al. Emergency department–based interventions affecting social determinants of health in the United States: A scoping review. Acad. Emerg. Med. 2020, 28, 666–674. [Google Scholar] [CrossRef] [PubMed] [PubMed Central]
- Available online: https://www.hud.gov/press/press_releases_media_advisories/HUD_No_22_253 (accessed on 23 March 2023).
- Hsu, H.E.; Ashe, E.M.; Silverstein, M.; Hofman, M.; Lange, S.J.; Razzaghi, H.; Mishuris, R.G.; Davidoff, R.; Parker, E.M.; Penman-Aguilar, A.; et al. Race/Ethnicity, Underlying Medical Conditions, Homelessness, and Hospitalization Status of Adult Patients with COVID-19 at an Urban Safety-Net Medical Center—Boston, Massachusetts, 2020. MMWR Morb. Mortal. Wkly. Rep. 2020, 69, 864–869. [Google Scholar] [CrossRef] [PubMed] [PubMed Central]
- Hanna, K.L.; Collins, P.F. Relationship between living alone and food and nutrient intake. Nutr. Rev. 2015, 73, 594–611. [Google Scholar] [CrossRef] [PubMed]
- Udell, J.A.; Steg, P.G.; Scirica, B.M.; Smith, S.C., Jr.; Ohman, E.M.; Eagle, K.A.; Goto, S.; Cho, J.I.; Bhatt, D.L. Reduction of Atherothrombosis for Continued Health (REACH) Registry Investigators. Living alone and cardiovascular risk in outpatients at risk of or with atherothrombosis. Arch. Intern. Med. 2012, 172, 1086–1095. [Google Scholar] [CrossRef] [PubMed]
- Russell, D. Living arrangements, social integration, and loneliness in later life: The case of physical disability. J. Health Soc. Behav. 2009, 50, 460–475. [Google Scholar] [CrossRef] [PubMed]
- Lim, A.; Benjasirisan, C.; Liu, X.; Ogungbe, O.; Himmelfarb, C.D.; Davidson, P.; Koirala, B. Social determinants of health and emergency department visits among older adults with multimorbidity: Insight from 2010 to 2018 National Health Interview Survey. BMC Public Health 2024, 24, 1153. [Google Scholar] [CrossRef] [PubMed] [PubMed Central]
- HCUP-US. NIS Overview. Available online: https://www.hcup-us.ahrq.gov/nisoverview.jsp (accessed on 25 February 2020).
- Lee, Y.H.; Bang, H.; Kim, D.J. How to Establish Clinical Prediction Models. Endocrinol. Metab. 2016, 31, 38–44. [Google Scholar] [CrossRef] [PubMed] [PubMed Central]
- Guyon, I.; Elisseeff, A. An introduction to variable and feature selection. J. Mach. Learn. Res. 2003, 3, 1157–1182. [Google Scholar]
- Kursa, M.B.; Rudnicki, W.R. Feature Selection with the Boruta Package. J. Stat. Softw. 2010, 36, 1–13. [Google Scholar] [CrossRef]
- Available online: https://cran.r-project.org/web/packages/parallelly/parallelly.pdf (accessed on 10 February 2023).
- Available online: https://stat.ethz.ch/R-manual/R-devel/library/parallel/doc/parallel.pdf (accessed on 10 February 2023).
- Available online: https://cran.r-project.org/web/packages/caret/caret.pdf (accessed on 10 February 2023).
- André, C.D.; Narula, S.C.; Elian, S.N.; Tavares, R.A. An overview of the variables selection methods for the minimum sum of absolute errors regression. Stat. Med. 2003, 22, 2101–2111. [Google Scholar] [CrossRef] [PubMed]
- Available online: https://cran.r-project.org/web/packages/iml/index.html (accessed on 10 February 2023).
- Greene, J.A.; Loscalzo, J. Putting the Patient Back Together—Social Medicine, Network Medicine, and the Limits of Reductionism. N. Engl. J. Med. 2017, 377, 2493–2499. [Google Scholar] [CrossRef] [PubMed]
- Social Determinants of Health—Healthy People 2030. Available online: https://odphp.health.gov/healthypeople/priority-areas/social-determinants-health (accessed on 23 March 2023).
- Addressing Social Determinants of Health in Federal Programs | ASPE. Available online: https://aspe.hhs.gov/topics/health-health-care/social-determinants-health/addressing-social-determinants-health-federal-programs (accessed on 23 March 2023).
- CMS. Available online: https://www.cms.gov/newsroom/press-releases/cms-issues-new-roadmap-states-address-social-determinants-health-improve-outcomes-lower-costs (accessed on 23 March 2023).
- Social Determinants of Health Are Our Life Circumstances—News & Events. Available online: https://odphp.health.gov/news/202207/social-determinants-health-are-our-life-circumstances (accessed on 23 March 2023).
- Alley, D.E.; Asomugha, C.N.; Conway, P.H.; Sanghavi, D.M. Accountable Health Communities--Addressing Social Needs through Medicare and Medicaid. N. Engl. J. Med. 2016, 374, 8–11. [Google Scholar] [CrossRef] [PubMed]
- Longworth, D.L. Accountable care organizations, the patient-centered medical home, and health care reform: What does it all mean? Clevel. Clin. J. Med. 2011, 78, 571–582. [Google Scholar] [CrossRef] [PubMed]
- McLellan, R.K.; Sherman, B.; Loeppke, R.R.; McKenzie, J.; Mueller, K.L.; Yarborough, C.M.; Grundy, P.; Allen, H.; Larson, P.W. Optimizing health care delivery by integrating workplaces, homes, and communities: How occupational and environmental medicine can serve as a vital connecting link between accountable care organizations and the patient-centered medical home. J. Occup. Environ. Med. 2012, 54, 504–512. [Google Scholar] [CrossRef] [PubMed]
- The 2017 Annual Homeless Assessment Report (AHAR) to Congress, Part 2: Esimtates of Homelessness in the U.S. Available online: https://www.huduser.gov/portal/datasets/ahar/2017-ahar-part-2-estimates-of-homelessness-in-the-us.html (accessed on 23 March 2023).
- Reeve, K.; On, B.I.; Havla, J.; Burns, J.; Gosteli-Peter, M.A.; Alabsawi, A.; Alayash, Z.; Götschi, A.; Seibold, H.; Mansmann, U.; et al. Prognostic models for predicting clinical disease progression, worsening and activity in people with multiple sclerosis. Cochrane Database Syst. Rev. 2023, 9, CD013606. [Google Scholar] [CrossRef] [PubMed] [PubMed Central]
- Anderson, A.B.; Grazal, C.F.; Balazs, G.C.; Potter, B.K.; Dickens, J.F.; Forsberg, J.A. Can Predictive Modeling Tools Identify Patients at High Risk of Prolonged Opioid Use After ACL Reconstruction? Clin. Orthop. Relat. Res. 2020, 478, 1619–1621. [Google Scholar] [CrossRef] [PubMed] [PubMed Central]
- Thio, Q.C.B.S.; Karhade, A.V.; Bindels, B.J.J.; Ogink, P.T.; Bramer, J.A.M.; Ferrone, M.L.; Calderón, S.L.; Raskin, K.A.; Schwab, J.H. Development and Internal Validation of Machine Learning Algorithms for Preoperative Survival Prediction of Extremity Metastatic Disease. Clin. Orthop. Relat. Res. 2020, 478, 322–333, Erratum in Clin. Orthop. Relat. Res. 2021, 479, 862. [Google Scholar] [CrossRef] [PubMed] [PubMed Central]
- Grazal, C.F.; Anderson, A.B.; Booth, G.J.; Geiger, P.G.; Forsberg, J.A.; Balazs, G.C. A Machine-Learning Algorithm to Predict the Likelihood of Prolonged Opioid Use Following Arthroscopic Hip Surgery. Arthroscopy 2022, 38, 839–847.e2. [Google Scholar] [CrossRef] [PubMed]
- Loerzel, V.W.; Hines, R.B.; Deatrick, C.W.; Geddie, P.I.; Clochesy, J.M. Unplanned emergency department visits and hospital admissions of older adults under treatment for cancer in the ambulatory/community setting. Support. Care Cancer 2021, 29, 7525–7533. [Google Scholar] [CrossRef] [PubMed]
- Lee Stirling, S.; Etland, C.; Connelly, C.D.; Calero, P.; Ecoff, L. Oncology Nurse Navigator Effect on Emergency Department Visits and Hospital Admissions of Adults with Cancer Post-Outpatient Chemotherapy. Oncol. Nurs. Forum 2022, 49, 595–612. [Google Scholar] [CrossRef] [PubMed]
- Lash, R.S.; Hong, A.S.; Bell, J.F.; Reed, S.C.; Pettit, N. Recognizing the emergency department’s role in oncologic care: A review of the literature on unplanned acute care. Emerg. Cancer Care 2022, 1, 6. [Google Scholar] [CrossRef] [PubMed] [PubMed Central]
- Gould Rothberg, B.E.; Quest, T.E.; Yeung, S.J.; Pelosof, L.C.; Gerber, D.E.; Seltzer, J.A.; Bischof, J.J.; Thomas, C.R., Jr.; Akhter, N.; Mamtani, M.; et al. Oncologic emergencies and urgencies: A comprehensive review. CA Cancer J. Clin. 2022, 72, 570–593. [Google Scholar] [CrossRef] [PubMed]
- Sangal, R.B.; Su, H.; Khidir, H.; Parwani, V.; Liebhardt, B.; Pinker, E.J.; Meng, L.; Venkatesh, A.K.; Ulrich, A. Sociodemographic Disparities in Queue Jumping for Emergency Department Care. JAMA Netw. Open 2023, 6, e2326338. [Google Scholar] [CrossRef] [PubMed] [PubMed Central]
- Kelly, D.; Altshuler, L. Why do cancer patients who are already on treatment transfer their care to another facility? J. Clin. Oncol. 2015, 33, e20568. [Google Scholar] [CrossRef]
- Kim, D.A.; Sanchez, L.D.; Chiu, D.; Brown, I.P. Social Determinants of Hallway Bed Use. West J. Emerg. Med. 2020, 21, 949–958. [Google Scholar] [CrossRef] [PubMed] [PubMed Central]
- Kreca, S.M.; Albers, I.S.; Musters, S.C.W.; van Dijkum, E.J.M.N.; Tuinman, P.R.; Eskes, A.M.; ARTIS Consortium. The effect of family-centered care on unplanned emergency room visits, hospital readmissions and intensive care admissions after surgery: A root cause analysis from a prospective multicenter study in The Netherlands. Patient Saf. Surg. 2024, 18, 14. [Google Scholar] [CrossRef] [PubMed] [PubMed Central]
- Leading Health Care Organizations Form Unique Collaboration to Support Recuperative Care for People Experiencing Homelessness in California—National Institute for Medical Respite Care. Available online: https://nimrc.org/collaboration_california/ (accessed on 23 March 2023).
- The National Institute for Medical Respite Care. Available online: https://nhchc.org/medical-respite/nimrc/ (accessed on 23 March 2023).
- Christ House. Available online: https://christhouse.org (accessed on 23 March 2023).
- Medical Respite Care—National Health Care for the Homeless Council. Available online: https://nhchc.org/ (accessed on 23 March 2023).
- Report (nimrc.org). Available online: https://nimrc.org/wp-content/uploads/2022/01/MRC-Literature-Review-Executive-Summary-1-18-2022.pdf (accessed on 23 March 2023).
- CHIP-Health-Services-Initiatives. Available online: https://macpac.gov (accessed on 23 March 2023).
- Wenzel, S.L.; Hsu, H.T.; Zhou, A.; Tucker, J.S. Are social network correlates of heavy drinking similar among black homeless youth and white homeless youth? J. Stud. Alcohol Drugs 2012, 73, 885–889. [Google Scholar] [CrossRef] [PubMed] [PubMed Central]
- Brown, S.M.; Barman-Adhikari, A.; Combs, K.M.; Rice, E. Sociodemographic and substance use characteristics associated with typologies and composition of social support networks among youth experiencing homelessness in Los Angeles, USA. Health Soc. Care Community 2020, 28, 533–543. [Google Scholar] [CrossRef] [PubMed]
- Wenzel, S.L.; Tucker, J.S.; Golinelli, D.; Green, H.D., Jr.; Zhou, A. Personal network correlates of alcohol, cigarette, and marijuana use among homeless youth. Drug Alcohol Depend. 2010, 112, 140–149. [Google Scholar] [CrossRef] [PubMed] [PubMed Central]
- Alexander-Eitzman, B.; Pollio, D.E.; North, C.S. The neighborhood context of homelessness. Am. J. Public Health 2013, 103, 679–685. [Google Scholar] [CrossRef] [PubMed] [PubMed Central]
- Mayo, Z.S.; Kilic, S.S.; Weleff, J.; Parker, S.M.; Strzalka, C.; Phelan, M.; Mian, O.Y.; Stephans, K.L.; Suh, J.H.; Tendulkar, R.D. Prostate Cancer Screening Disparities in Persons Experiencing Homelessness. JCO Oncol. Pract. 2022, 18, e1866–e1873. [Google Scholar] [CrossRef] [PubMed]
- Mayo, Z.S.; Campbell, S.R.; Shah, C.S.; Weleff, J.; Kilic, S.S. Improving Treatment Interventions and Cancer Outcomes in Persons Experiencing Homelessness: A Population Underrepresented in Equity Initiatives. Int. J. Radiat. Oncol. Biol. Phys. 2023, 115, 302–304. [Google Scholar] [CrossRef] [PubMed]
- Paasche-Orlow, M.K.; Wolf, M.S. The causal pathways linking health literacy to health outcomes. Am. J. Health Behav. 2007, 31 (Suppl. S1), S19–S26. [Google Scholar] [CrossRef] [PubMed]
- Asgary, R.; Alcabes, A.; Feldman, R.; Garland, V.; Naderi, R.; Ogedegbe, G.; Sckell, B. Human Papillomavirus Knowledge and Attitude among Homeless Women of New York City Shelters. Womens Health Issues 2015, 25, 727–731. [Google Scholar] [CrossRef] [PubMed] [PubMed Central]
- Asgary, R.; Sckell, B.; Alcabes, A.; Naderi, R.; Ogedegbe, G. Perspectives of cancer and cancer screening among homeless adults of New York City shelter-based clinics: A qualitative approach. Cancer Causes Control 2015, 26, 1429–1438. [Google Scholar] [CrossRef] [PubMed]
- Holowatyj, A.N.; Heath, E.I.; Pappas, L.M.; Ruterbusch, J.J.; Gorski, D.H.; Triest, J.A.; Park, H.K.; Beebe-Dimmer, J.L.; Schwartz, A.G.; Cote, M.L.; et al. The Epidemiology of Cancer Among Homeless Adults in Metropolitan Detroit. JNCI Cancer Spectr. 2019, 3, pkz006. [Google Scholar] [CrossRef] [PubMed] [PubMed Central]
- Adly, M.; Woo, T.E.; Traboulsi, D.; Klassen, D.; Hardin, J. Understanding Dermatologic Concerns Among Persons Experiencing Homelessness: A Scoping Review and Discussion for Improved Delivery of Care. J. Cutan. Med. Surg. 2021, 25, 616–626. [Google Scholar] [CrossRef] [PubMed] [PubMed Central]
- Lawrie, K.; Charow, R.; Giuliani, M.; Papadakos, J. Homelessness, Cancer and Health Literacy: A Scoping Review. J. Health Care Poor Underserved 2020, 31, 81–104. [Google Scholar] [CrossRef] [PubMed]
- Baggett, T.P.; Chang, Y.; Singer, D.E.; Porneala, B.C.; Gaeta, J.M.; O’Connell, J.J.; Rigotti, N.A. Tobacco-, alcohol-, and drug-attributable deaths and their contribution to mortality disparities in a cohort of homeless adults in Boston. Am. J. Public Health 2015, 105, 1189–1197. [Google Scholar] [CrossRef] [PubMed] [PubMed Central]
- Johnson, T.P.; Freels, S.A.; Parsons, J.A.; Vangeest, J.B. Substance abuse and homelessness: Social selection or social adaptation? Addiction 1997, 92, 437–445. [Google Scholar] [CrossRef] [PubMed]
- Johnson, T.P.; Fendrich, M. Homelessness and drug use: Evidence from a community sample. Am. J. Prev. Med. 2007, 32 (Suppl. S6), S211–S218. [Google Scholar] [CrossRef] [PubMed]
- Johnson, G.; Chamberlain, C. Homelessness and substance abuse: Which comes first? Aust. Soc. Work 2008, 61, 342–356. [Google Scholar] [CrossRef]
- Fazel, S.; Khosla, V.; Doll, H.; Geddes, J. The prevalence of mental disorders among the homeless in western countries: Systematic review and meta-regression analysis. PLoS Med. 2008, 5, e225. [Google Scholar] [CrossRef] [PubMed] [PubMed Central]
- Fischer, P.J.; Breakey, W.R. The epidemiology of alcohol, drug, and mental disorders among homeless persons. Am. Psychol. 1991, 46, 1115–1128. [Google Scholar] [CrossRef] [PubMed]
- Collins, S.E. Associations Between Socioeconomic Factors and Alcohol Outcomes. Alcohol Res. 2016, 38, 83–94. [Google Scholar] [PubMed] [PubMed Central]
- Eyrich-Garg, K.M.; Cacciola, J.S.; Carise, D.; Lynch, K.G.; McLellan, A.T. Individual characteristics of the literally homeless, marginally housed, and impoverished in a US substance abuse treatment-seeking sample. Soc. Psychiatry Psychiatr. Epidemiol. 2008, 43, 831–842. [Google Scholar] [CrossRef] [PubMed]
- Iacomacci, A.L.; Cunningham, A.; Jubanyik, K.J.; Jenq, G.Y. The revolving hospital door: Hospital readmissions among patients who are homeless. Med. Care 2013, 51, 767–773. [Google Scholar]
- O’Toole, T.P.; Conde-Martel, A.; Gibbon, J.L.; Hanusa, B.H.; Freyder, P.J.; Fine, M.J. Where do people go when they first become homeless? A survey of homeless adults in the USA. Health Soc. Care Community 2007, 15, 446–453. [Google Scholar] [CrossRef] [PubMed]
- Schanzer, B.; Dominguez, B.; Shrout, P.E.; Caton, C.L. Homelessness, health status, and health care use. Am. J. Public Health 2007, 97, 464–469. [Google Scholar] [PubMed]
- Metraux, S.; Byrne, T.; Culhane, D.P. Institutional discharges and subsequent shelter use among unaccompanied adults in New York City. J. Community Psychol. 2010, 38, 28–38. [Google Scholar]
- Ku, B.S.; Fields, J.M.; Santana, A.; Wasserman, D.; Borman, L.; Scott, K.C. The urban homeless: Super-users of the emergency department. Popul. Health Manag. 2014, 17, 366–371. [Google Scholar] [CrossRef] [PubMed]
- Nilsson, S.F.; Nordentoft, M.; Hjorthøj, C. Individual-Level Predictors for Becoming Homeless and Exiting Homelessness: A Systematic Review and Meta-analysis. J. Urban Health 2019, 96, 741–750. [Google Scholar] [CrossRef] [PubMed] [PubMed Central]
- Pecora, P.J.; Kessler, R.C.; O’Brien, K.; White, C.R.; Williams, J.; Hiripi, E.; English, D.; White, J.; Herrick, M.A. Educational and employment outcomes of adults formerly placed in foster care: Results from the Northwest Foster Care Alumni Study. Child. Youth Serv. Rev. 2006, 28, 1459–1481. [Google Scholar] [CrossRef]
- Nuñez, M.; Beal, S.J.; Jacquez, F. Resilience factors in youth transitioning out of foster care: A systematic review. Psychol. Trauma 2022, 14, S72–S81. [Google Scholar] [CrossRef] [PubMed] [PubMed Central]


| Metastatic Cancer Patients Reported with Homelessness | |
|---|---|
| n | 2635 |
| AGE (mean (SD)) | 56.83 (9.94) |
| Sex (%) | |
| Female | 695 (26.4) |
| RACE (%) | |
| White | 1560.0 (60.5) |
| Black | 665.0 (25.8) |
| Hispanic | 165.0 (6.4) |
| Asian and others | 190.0 (7.4) |
| Median household income (based on current year) | |
| 0–25th percentile | 945.0 (46.2) |
| 26th to 50th percentile | 400.0 (19.6) |
| 51st to 75th percentile | 380.0 (18.6) |
| 76th to 100th percentile | 320.0 (15.6) |
| Expected primary payer (%) | |
| Medicare | 745.0 (28.3) |
| Medicaid | 1495.0 (56.7) |
| Private insurance | 150.0 (5.7) |
| Self-pay, no charge, and other | 245.0 (9.3) |
| Patient Location: NCHS Urban–Rural Code (%) | |
| “Central” counties of metro areas of ≥1 million population | 1000.0 (46.3) |
| “Fringe” counties of metro areas of ≥1 million population | 400.0 (18.5) |
| Counties in metro areas of 250,000–999,999 population. | 515.0 (23.8) |
| Counties in metro areas of 50,000–249,999 population. | 110.0 (5.1) |
| Micropolitan counties and non-metropolitan or micropolitan counties | 135.0 (6.3) |
| Indicator of a transfer out of the hospital | |
| Transferred in | 330.0 (12.6) |
| Elective admission (%) | 510.0 (52.3) |
| Weekend admission (%) | 645.0 (24.5) |
| Emergency admission (%) | 2040.0 (77.4) |
| Weighted Elixhauser score (mean (SD)) | 22.25 (8.47) |
| Prostate Cancer Patients Without Homelessness (Weighted) | Prostate Cancer Patients with Homelessness (Weighted) | p-Value | Prostate Cancer Patients Without PrbLA (Weighted) | Prostate Cancer Patients with PrbLA (Weighted) | p-Value | |
|---|---|---|---|---|---|---|
| n | 208,985 | 425 | 209,055 | 355 | ||
| AGE (mean [SD]) | 71.5 (10.81) | 64.6 (8.55) | <0.001 | 71.5 (10.81) | 76.1 (10.20) | <0.001 |
| Age groups (%) | <0.001 | 0.07 | ||||
| 45–54 | 10,110 (5.1) | 35 (8.9) | ||||
| 55–64 | 44,790 (22.5) | 170 (43.0) | 44,900 (22.6) | 60 (17.1) | ||
| >65 | 143,919 (72.4) | 190 (48.1) | 143,820 (72.3) | 290 (82.9) | ||
| RACE (%) | <0.001 | 0.56 | ||||
| White | 140,409 (69.8) | 205 (50.0) | 140,375 (69.7) | 240 (69.6) | ||
| Black | 35,530 (17.7) | 160 (39.0) | 35,615 (17.7) | 75 (21.7) | ||
| Hispanic | 14,250 (7.1) | 20 (4.9) | 14,260 (7.1) | |||
| Other | 11,000 (5.5) | 25 (6.1) | 11,005 (5.5) | 20 (5.8) | ||
| Expected primary payer (%) | <0.001 | 0.003 | ||||
| Medicare | 13,7394 (65.8) | 245 (57.6) | 137,334 (65.8) | 305 (85.9) | ||
| Medicaid | 9305 (4.5) | 125 (29.4) | 9415 (4.5) | 15 (4.2) | ||
| Private insurance | 54,095 (25.9) | 30 (7.1) | 54,100 (25.9) | 25 (7.0) | ||
| Self-pay, no charge, and other | 7855 (3.8) | 25 (5.9) | 7870 (3.8) | |||
| Median household income (based on current year) | <0.001 | 0.28 | ||||
| 0–25th percentile | 52,215 (25.4) | 190 (58.5) | 52,290 (25.4) | 115 (32.9) | ||
| 26th to 50th percentile | 51,980 (25.3) | 65 (20.0) | 51,945 (25.3) | 100 (28.6) | ||
| 51st to 75th percentile | 50,665 (24.6) | 45 (13.8) | 50,630 (24.6) | 80 (22.9) | ||
| 76th to 100th percentile | 50,730 (24.7) | 25 (7.7) | 50,700 (24.7) | 55 (15.7) | ||
| Patient Location: NCHS Urban–Rural Code (%) | <0.001 | 0.31 | ||||
| “Central” counties of metro areas of ≥1 million population | 61,895 (29.7) | 185 (53.6) | 61,975 (29.8) | 105 (29.6) | ||
| “Fringe” counties of metro areas of ≥1 million population | 53,240 (25.6) | 65 (18.8) | 53,250 (25.6) | 55 (15.5) | ||
| Counties in metro areas of 250,000–999,999 population. | 40,360 (19.4) | 60 (17.4) | 40,325 (19.4) | 95 (26.8) | ||
| Counties in metro areas of 50,000–249,999 population | 19,265 (9.2) | 25 (7.2) | 19,250 (9.2) | 40 (11.3) | ||
| Micropolitan counties and non-metropolitan or micropolitan counties | 33,565 (16.1) | 33,515 (16.1) | 60 (16.9) | |||
| Admission type (%) | <0.001 | <0.001 | ||||
| Elective | 83,355 (40.0) | 55 (12.9) | 83,375 (40.0) | 35 (9.9) | ||
| Indicator of a transfer out of the hospital | 0.01 | <0.001 | ||||
| Transferred out | 39,385 (18.9) | 125 (29.8) | 39,380 (18.9) | 130 (36.6) | ||
| Weighted Elixhauser score mean (SD)) | 14.38 (10.93) | 13.62 (10.54) | 0.513 | 14.37 (10.93) | 17.8 (11.15) | 0.006 |
| Length of stay (geometric mean) | 2.5 days | 4.7 days | <0.001 | 2.5 days | 4.1 days | <0.001 |
| Total charge (geometric mean) | USD 41,476 | USD 46,340 | 0.7 | USD 41,476 | USD 31,652 | 0.02 |
| In-hospital mortality (%) | 6895 (3.3) | 6885 (3.3) | 15 (4.2) | 0.66 | ||
| Anxiety (%) | 14,345 (6.9) | 100 (23.5) | <0.001 | 14,390 (6.9) | 55 (15.5) | 0.005 |
| Depression (%) | 16,550.0 (7.9) | 95.0 (22.4) | <0.001 | 16,585 (7.9) | 60 (16.9) | 0.003 |
| Anxiety and depression (%) | 25,885.0 (12.4) | 155.0 (36.5) | <0.001 | 25,940 (12.4) | 100 (28.2) | <0.001 |
| Emergency admission (%) | 102,535 (49.1) | 310.0 (72.9) | <0.001 | 102,625 (49.1) | 220 (62.0) | 0.05 |
| Opioid abuse (%) | 1320.0 (0.6) | 20.0 (4.7) | <0.001 | |||
| Opioid long-term use (%) | 2385.0 (1.1) | 15.0 (3.5) | 0.04 | 3905 (1.9) | 20 (5.6) | 0.01 |
| aOR (95% CI) | Coefficient and 95% CIs (Back Transformed from Log Transformation) | ||
|---|---|---|---|
| Anxiety and Depression | LOS | ||
| PCa homelessness status Non-homelessness Homelessness | Reference 5.14 (3.17–8.35) | Reference 1.96 (1.03–3.74) | |
| Age | 0.99 (0.98–0.99) | 1.04 (1.00–1.01) | |
| RACE (%) | |||
| White | Reference | Reference | |
| Black | 0.57 (0.51–0.63) | 1.22 (1.14–1.30) | |
| Hispanic | 0.62 (0.54–0.72) | 1.07 (0.97–1.18) | |
| Asian and Native American and other | 0.65 (0.53–0.79) | 1.06 (0.95–1.18) | |
| Expected primary payer | |||
| Medicare | Reference | Reference | |
| Medicaid | 0.99 (0.85–1.15) | 1.23 (1.09–1.39) | |
| Private insurance | 0.64 (0.58–0.70) | 0.87 (0.82–0.92) | |
| Self-pay and no charge and other | 0.81 (0.68–0.98) | 0.76 (0.64–0.89) | |
| Patient Location: NCHS Urban–Rural Code | |||
| Central counties of metro areas of ≥1 million population | Reference | Reference | |
| “Fringe” counties of metro areas of ≥1 million population | 0.94 (0.86–1.03) | 0.97 (0.97–1.12) | |
| Counties in metro areas of 250,000–999,999 population. | 0.94 (0.85–1.04) | 0.96 (0.98–1.13) | |
| Counties in metro areas of 50,000–249,999 population. | 0.89 (0.79–1.02) | 0.73 (0.98–1.16) | |
| Micropolitan counties and non-metropolitan or micropolitan counties | 0.85 (0.76–0.94) | 0.71 (0.88–1.05) | |
| Elixhauser comorbidity score | 0.99 (0.99–1.00) | 1.07 (1.04–1.05) | |
| Median household income | |||
| 0–25th percentile | Reference | Reference | |
| 26th to 50th percentile | 0.97 (0.89–1.07) | 0.93 (0.68–1.28) | |
| 51st to 75th percentile | 0.98 (0.89–1.08) | 1.15 (0.83–1.58) | |
| 76th to 100th percentile | 0.95 (0.86–1.06) | 0.85 (0.59–1.24) | |
| Indicator of a transfer out of the hospital Not transferred out | Reference | ||
| Transferred out | 2.20 (2.07–2.34) | ||
| Breast Cancer Patients Without Homelessness (Weighted) | Breast Cancer Patients with Homelessness (Weighted) | p-Value | Breast Cancer Patients Without PrbLA (Weighted) | Breast Cancer Patients with PrbLA (Weighted) | p-Value | |
|---|---|---|---|---|---|---|
| n | 116,760 | 320 | 116,855 | 225 | ||
| AGE (mean [SD]) | 61.9 (14.19) | 54.7 (11.42) | <0.001 | 61.8 (14.19) | 70.8 (10.16) | <0.001 |
| Age groups (%) | 0.008 | 0.008 | ||||
| 45–54 | 21,475.0 (22.3) | 90.0 (40.0) | 21,550.0 (22.4) | 15.0 (7.0) | ||
| 55–64 | 26,995.0 (28.0) | 70.0 (31.1) | 27,020.0 (28.1) | 45.0 (20.9) | ||
| >65 | 47,790.0 (49.6) | 65.0 (28.9) | 47,700.0 (49.5) | 155.0 (72.1) | ||
| RACE (%) | 0.07 | |||||
| White | 74,400 (65.5) | 170.0 (53.1) | 74,401.0(65.5) | 165.0 (76.7) | ||
| Black | 19,630.0 (17.3) | 95.0 (29.7) | 19,690.0 (17.3) | 35.0 (16.3) | ||
| Hispanic | 10,280.0 (9.1) | 20.0 (6.2) | 10,295.0 (9.1) | |||
| Other | 9260.0 (8.2) | 35.0 (10.9) | 9285.0 (8.2) | 10.0 (4.7) | ||
| Expected primary payer (%) | ||||||
| Medicare | 52,950.0 (45.4) | 110.0 (34.9) | 52,895.0 (45.3) | 165.0 (73.3) | ||
| Medicaid | 15,620.0 (13.4) | 170.0 (54.0) | 15,770.0 (13.5) | 20.0 (8.9) | ||
| Private insurance | 43,685.0 (37.5) | 43,655.0 (37.4) | 40.0 (17.8) | |||
| Self-pay, no charge, and other | 4350.0 (3.7) | 25.0 (7.9) | 4375.0 (3.7) | |||
| Median household income (based on current year) | <0.001 | 0.44 | ||||
| 0–25th percentile | 29,230.0 (25.4) | 130.0 (52.0) | 29,310.0 (25.5) | 50.0 (22.7) | ||
| 26th to 50th percentile | 27,325.0 (23.7) | 50.0 (20.0) | 27,340.0 (23.8) | 35.0 (15.9) | ||
| 51st to 75th percentile | 28,225.0 (24.5) | 50.0 (20.0) | 28,220.0 (24.5) | 55.0 (25.0) | ||
| 76th to 100th percentile | 30,275.0 (26.3) | 20.0 (8.0) | 30,215.0 (26.3) | 80.0 (36.4) | ||
| Patient Location: NCHS Urban–Rural Code (%) | 0.36 | |||||
| “Central” counties of metro areas of ≥1 million population | 38,900.0 (33.4) | 105.0 (41.2) | 38,945.0 (33.4) | 60.0 (26.7) | ||
| “Fringe” counties of metro areas of ≥1 million population | 31,770.0 (27.3) | 80.0 (31.4) | 31,805.0 (27.3) | 45.0 (20.0) | ||
| Counties in metro areas of 250,000–999,999 population. | 21,715.0 (18.6) | 55.0 (21.6) | 21,725.0 (18.6) | 45.0 (20.0) | ||
| Counties in metro areas of 50,000–249,999 population | 8545.0 (7.3) | 8520.0 (7.3) | 25.0 (11.1) | |||
| Micropolitan counties and non-metropolitan or micropolitan counties | 15,539.9 (13.3) | 15.0 (5.9) | 15,504.9 (13.3) | 50.0 (22.2) | ||
| Admission type (%) | <0.001 | 0.46 | ||||
| Elective | 42,520.0 (36.5) | 25.0 (7.8) | 42,475.0 (36.4) | 70.0 (31.1) | ||
| Indicator of a transfer out of the hospital | <0.001 | <0.001 | ||||
| Transferred out | 16,385.0 (14.0) | 115.0 (35.9) | 16,430.0 (14.1) | 70.0 (31.1) | ||
| Weighted Elixhauser score mean (SD)) | 13.32 (10.20) | 13.67 (9.90) | 0.79 | 13.32 (10.20) | 14.89 (10.21) | 0.27 |
| Length of stay (geometric mean) | 2.6 days | 4.1 days | 0.2 | 2.6 days | 4.9 days | <0.001 |
| Total charge (geometric mean) | USD 40,622 | USD 48,644 | 0.2 | USD 40,622 | USD 34,636 | 0.18 |
| In-hospital mortality (%) | 3770.0 (3.2) | 15.0 (4.7) | 0.5 | 3780.0 (3.2) | ||
| Anxiety (%) | 18,505.0 (15.8) | 90.0 (28.1) | 0.009 | 18,555.0 (15.9) | 40.0 (17.8) | 0.74 |
| Depression (%) | 16,750.0 (14.3) | 55.0 (17.2) | 0.538 | 16,730.0 (14.3) | 75.0 (33.3) | <0.001 |
| Anxiety and depression (%) | 27,815.0 (23.8) | 115.0 (35.9) | 0.04 | 27,845.0 (23.8) | 85.0 (37.8) | 0.03 |
| Emergency admission (%) | 58,760 (50.3) | 265.0 (82.8) | <0.001 | 58,899.9 (50.4) | 125.0 (55.6) | 0.54 |
| Opioid abuse (%) | 825.0 (0.7) | 25.0 (7.8) | <0.001 | |||
| Opioid long-term use (%) | 3000.0 (2.6) | 20.0 (8.9) | 0.008 |
| aOR (95% CI) | |
|---|---|
| Anxiety | |
| Breast cancer homelessness status Non-homelessness Homelessness | Reference 2.07 (1.06–4.03) |
| Age | 0.97 (0.97–0.98) |
| RACE (%) | |
| White | Reference |
| Black | 0.47 (0.42–0.54) |
| Hispanic | 0.56 (0.48–0.66) |
| Asian and Native American and other | 0.44 (0.34–0.56) |
| Expected primary payer | |
| Medicare | Reference |
| Medicaid | 0.94 (0.81–1.09) |
| Private insurance | 0.76 (0.68–0.85) |
| Self-pay and no charge and other | 0.71 (0.57–0.88) |
| Patient Location: NCHS Urban–Rural Code | |
| Central counties of metro areas of ≥1 million population | Reference |
| Fringe” counties of metro areas of ≥1 million population | 1.15 (1.04–1.28) |
| Counties in metro areas of 250,000–999,999 population. | 1.10 (0.97–1.25) |
| Counties in metro areas of 50,000–249,999 population. | 1.05 (0.89–1.24) |
| Micropolitan counties and non-metropolitan or micropolitan counties | 0.99 (0.87–1.14) |
| Elixhauser comorbidity score | 0.99 (0.99–1.00) |
| Median household income | |
| 0–25th percentile | Reference |
| 26th to 50th percentile | 0.93 (0.84–1.04) |
| 51st to 75th percentile | 0.94 (0.84–1.05) |
| 76th to 100th percentile | 0.95 (0.85–1.08) |
| Lung Cancer Patients Without Homelessness (Weighted) | Lung Cancer Patients with Homelessness (Weighted) | p-Value | Lung Cancer Patients Without PrbLA (Weighted) | Lung Cancer Patients with PrbLA (Weighted) | p-Value | |
|---|---|---|---|---|---|---|
| n | 401,665 | 1345 | 402,190 | 820 | ||
| AGE (mean [SD]) | 69.09 (10.54) | 60.41 (8.27) | <0.001 | 69.06 (10.55) | 72.22 (9.59) | <0.001 |
| Age groups (%) | <0.001 | 0.04 | ||||
| 45–54 | 27,065.0 (7.2) | 255.0 (20.4) | 27,290.0 (7.2) | 30.0 (3.8) | ||
| 55–64 | 92,695.0 (24.6) | 675.0 (54.0) | 93,220.0 (24.7) | 150.0 (19.2) | ||
| >65 | 25,7625.0 (68.3) | 320.0 (25.6) | 257,345.0 (68.1) | 600.0 (76.9) | ||
| Sex (%) | <0.001 | 0.005 | ||||
| Female | 196,665.0 (49.0) | 265.0 (19.7) | 196,445.0 (48.8) | 485.0 (59.1) | ||
| Depression (%) | 51,775.0 (12.9) | 210.0 (15.6) | 0.22 | 51,840.0 (12.9) | 145.0 (17.7) | 0.07 |
| Anxiety (%) | 64,185.0 (16.0) | 265.0 (19.7) | 0.09 | 64,275.0 (16.0) | 175.0 (21.3) | 0.07 |
| Anxiety and depression (%) | 93,070.0 (23.2) | 400.0 (29.7) | <0.001 | 0.88 | ||
| Emergency admission (%) | 263,760.0 (65.7) | 1030.0 (76.6) | 0.88 | 264,245.0 (65.7) | 545.0 (66.5) | 0.88 |
| Opioid abuse (%) | 4955.0 (1.2) | 80.0 (5.9) | <0.001 | 5020.0 (1.2) | 15.0 (1.8) | 0.59 |
| Opioid long-term use (%) | 12,450.0 (3.1) | 50.0 (3.7) | 0.56 | 12,470.0 (3.1) | 30.0 (3.7) | 0.68 |
| RACE (%) | <0.001 | 0.53 | ||||
| White | 303,165.0 (77.6) | 855.0 (65.0) | 303,370.0 (77.5) | 650.0 (82.3) | ||
| Black | 48,210.0 (12.3) | 310.0 (23.6) | 48,435.0 (12.4) | 85.0 (10.8) | ||
| Hispanic | 17,900.0 (4.6) | 70.0 (5.3) | 17,950.0 (4.6) | 20.0 (2.5) | ||
| Other | 21,510.0 (5.5) | 80.0 (6.1) | 21,555.0 (5.5) | 35.0 (4.4) | ||
| Expected primary payer (%) | <0.001 | 0.015 | ||||
| Medicare | 267,405.0 (66.7) | 425.0 (31.6) | 267,190.0 (66.5) | 640.0 (78.0) | ||
| Medicaid | 39,045.0 (9.7) | 760.0 (56.5) | 39,755.0 (9.9) | 50.0 (6.1) | ||
| Private insurance | 775,25.0 (19.3) | 60.0 (4.5) | 77,480.0 (19.3) | 105.0 (12.8) | ||
| Self-pay, no charge, and other | 17,160.0 (4.3) | 100.0 (7.4) | 17,235.0 (4.3) | 25.0 (3.0) | ||
| Median household income (based on current year) | <0.001 | 0.537 | ||||
| 0–25th percentile | 119,805.1 (30.2) | 530.0 (48.6) | 120,130.1 (30.3) | 205.0 (25.5) | ||
| 26th to 50th percentile | 108,425.0 (27.4) | 185.0 (17.0) | 108,370.0 (27.3) | 240.0 (29.8) | ||
| 51st to 75th percentile | 91,905.0 (23.2) | 215.0 (19.7) | 91,910.0 (23.2) | 210.0 (26.1) | ||
| 76th to 100th percentile | 76,109.9 (19.2) | 160.0 (14.7) | 76,119.9 (19.2) | 150.0 (18.6) | ||
| Patient Location: NCHS Urban–Rural Code (%) | <0.001 | 0.472 | ||||
| “Central” counties of metro areas of ≥1 million population | 103,600.0 (25.8) | 440.0 (38.8) | 103,805.0 (25.9) | 235.0 (28.7) | ||
| “Fringe” counties of metro areas of ≥1 million population | 101,795.0 (25.4) | 240.0 (21.1) | 101,830.0 (25.4) | 205.0 (25.0) | ||
| Counties in metro areas of 250,000–999,999 population. | 80,565.0 (20.1) | 320.0 (28.2) | 807,55.0 (20.1) | 130.0 (15.9) | ||
| Counties in metro areas of 50,000–249,999 population | 40,145.0 (10.0) | 85.0 (7.5) | 401,10.0 (10.0) | 120.0 (14.6) | ||
| Micropolitan counties and non-metropolitan or micropolitan counties | 74,875.0 (18.7) | 50.0 (4.4) | 747,95.0 (18.6) | 130.0 (15.9) | ||
| Admission type (%) | <0.001 | 0.15 | ||||
| Elective | 75,095.0 (18.7) | 125.0 (9.3) | 75,105.0 (18.7) | 115.0 (14.0) | ||
| Indicator of a transfer out of the hospital | <0.001 | 0.04 | ||||
| Transferred out | 86,370.0 (21.5) | 475.0 (35.3) | 86,605.0 (21.6) | 240.0 (29.3) | ||
| Weighted Elixhauser score mean (SD)) | 19.10 (9.97) | 18.19 (9.79) | 0.14 | 19.10 (9.97) | 18.99 (9.51) | 0.88 |
| Length of stay (geometric mean) | 3.8 days | 6.2 days | <0.001 | 3.8 days | 4.4 days | 0.09 |
| Total charge (geometric mean) | USD 42,055 | USD 58,251 | <0.001 | USD 42,055 | USD 41,190 | 0.81 |
| In-hospital mortality (%) | 34,960.0 (8.7) | 110.0 (8.2) | 0.76 | 35,030.0 (8.7) | 40.0 (4.9) | 0.07 |
| Depression (%) | 51,775.0 (12.9) | 210.0 (15.6) | 0.22 | 51,840.0 (12.9) | 145.0 (17.7) | 0.07 |
| Anxiety (%) | 64,185.0 (16.0) | 265.0 (19.7) | 0.09 | 64,275.0 (16.0) | 175.0 (21.3) | 0.07 |
| Anxiety and depression (%) | 93,070.0 (23.2) | 400.0 (29.7) | <0.001 | 0.88 | ||
| Emergency admission (%) | 263,760.0 (65.7) | 1030.0 (76.6) | 0.88 | 264,245.0 (65.7) | 545.0 (66.5) | 0.88 |
| Opioid abuse (%) | 4955.0 (1.2) | 80.0 (5.9) | <0.001 | 5020.0 (1.2) | 15.0 (1.8) | 0.59 |
| Opioid long-term use (%) | 12,450.0 (3.1) | 50.0 (3.7) | 0.56 | 12,470.0 (3.1) | 30.0 (3.7) | 0.68 |
| aOR (95% CI) | Coefficient and 95% CIs (Back Transformed from Log Transformation) | |
|---|---|---|
| Anxiety and Depression | LOS | |
| Lung cancer homelessness status Non-homelessness Homelessness | Reference 1.38 (1.02–1.85) | Reference 1.84 (1.40–2.42) |
| Age | 0.97 (0.97–0.97) | 0.99 (0.99–0.99) |
| RACE (%) | ||
| White | Reference | Reference |
| Black | 0.51 (0.48–0.55) | 1.22 (1.05–1.17) |
| Hispanic | 0.66 (0.60–0.72) | 1.07 (0.93–1.09) |
| Asian and Native American and other | 0.53 (0.47–0.59) | 1.13 (1.04–1.23) |
| Expected primary payer | ||
| Medicare | Reference | Reference |
| Medicaid | 0.91 (0.85–0.97) | 0.91 (0.85–0.97) |
| Private insurance | 0.78 (0.74–0.83) | 0.89 (0.84–0.93) |
| Self-pay and no charge and other | 0.65 (0.59–0.72) | 0.67 (0.59–0.75) |
| Patient Location: NCHS Urban–Rural Code | ||
| Central counties of metro areas of ≥1 million population | Reference | Reference |
| Fringe” counties of metro areas of ≥1 million population | 1.03 (0.96–1.09) | 0.97 (0.92–1.02) |
| Counties in metro areas of 250,000–999,999 population. | 1.04 (0.96–1.12) | 1.00 (0.95–1.06) |
| Counties in metro areas of 50,000–249,999 population. | 1.03 (0.95–1.13) | 1.00 (0.94–1.08) |
| Micropolitan counties and non-metropolitan or micropolitan counties | 0.92 (0.85–0.99) | 0.88 (0.83–0.94) |
| Elixhauser comorbidity score | 0.98 (0.98–0.99) | 1.02 (1.02–1.03) |
| Median household income | ||
| 0–25th percentile | Reference | Reference |
| 26th to 50th percentile | 0.99 (0.95–1.05) | 0.95 (0.90–0.99) |
| 51st to 75th percentile | 1.01 (0.96–1.07) | 0.94 (0.89–0.99) |
| 76th to 100th percentile | 0.99 (0.93–1.07) | 0.93 (0.87–0.98) |
| Indicator of a transfer out of the hospital Non-transferred out | Reference | |
| Transferred out | 2.20 (2.07–2.34) |
| CLOP Patients Without Homelessness (Weighted) | CLOP Patients with Homelessness (Weighted) | p-Value | |
|---|---|---|---|
| n | 53,890 | 375 | |
| AGE (mean [SD]) | 64.06 (12.22) | 54.85 (8.53) | <0.001 |
| Female (%) | 0.001 | ||
| 15,540.0 (28.8) | 45.0 (12.0) | ||
| Age groups (%) | <0.001 | ||
| 45–54 | 7700.0 (16.1) | 130.0 (41.3) | |
| 55–64 | 15,970.0 (33.4) | 165.0 (52.4) | |
| >65 | 24,105.0 (50.5) | 20.0 (6.3) | |
| RACE (%) | 0.09 | ||
| White | 38,965.0 (74.9) | 245.0 (67.1) | |
| Black | 5500.0 (10.6) | 70.0 (19.2) | |
| Hispanic | 3360.0 (6.5) | 30.0 (8.2) | |
| Other | 4220.0 (8.1) | 20.0 (5.5) | |
| Expected primary payer (%) | <0.001 | ||
| Medicare | 27,195.0 (50.6) | 85.0 (22.7) | |
| Medicaid | 8130.0 (15.1) | 220.0 (58.7) | |
| Private insurance | 15,540.0 (28.9) | 25.0 (6.7) | |
| Self-pay, no charge, and other | 2930.0 (5.4) | 45.0 (12.0) | |
| Median household income (based on current year) | 0.415 | ||
| 0–25th percentile | 14,990.0 (28.3) | 115.0 (37.7) | |
| 26th to 50th percentile | 13,965.0 (26.4) | 75.0 (24.6) | |
| 51st to 75th percentile | 12,725.0 (24.0) | 60.0 (19.7) | |
| 76th to 100th percentile | 11,255.0 (21.3) | 55.0 (18.0) | |
| Patient Location: NCHS Urban–Rural Code (%) | 0.032 | ||
| “Central” counties of metro areas of ≥1 million population | 15,485.0 (28.8) | 115.0 (37.1) | |
| “Fringe” counties of metro areas of ≥1 million population | 13,835.0 (25.7) | 55.0 (17.7) | |
| Counties in metro areas of 250,000–999,999 population. | 10,960.0 (20.4) | 95.0 (30.6) | |
| Counties in metro areas of 50,000–249,999 population | 5150.0 (9.6) | 30.0 (9.7) | |
| Micropolitan counties and non-metropolitan or micropolitan counties | 8315.0 (15.5) | 15.0 (4.8) | |
| Admission type (%) | <0.001 | ||
| Elective | 19,600.0 (36.5) | 45.0 (12.0) | |
| Indicator of a transfer out of the hospital | 0.002 | ||
| Transferred out | 10,335.0 (19.2) | 125.0 (33.3) | |
| Weighted Elixhauser score mean (SD) | 15.71 (9.46) | 14.59 (10.76) | 0.370 |
| Length of stay (geometric mean) | 3.7 days | 8.01 days | <0.001 |
| Total charge (geometric mean) | USD 48,983 | USD 57,449 | 0.2 |
| Anxiety (%) | 7380.0 (13.7) | 105.0 (28.0) | <0.001 |
| Depression (%) | 6515.0 (12.1) | 80.0 (21.3) | 0.02 |
| Anxiety and depression (%) | 11,140.0 (20.7) | 145.0 (38.7) | <0.001 |
| Emergency admission (%) | 26,285.0 (48.8) | 245.0 (65.3) | <0.001 |
Disclaimer/Publisher’s Note: The statements, opinions and data contained in all publications are solely those of the individual author(s) and contributor(s) and not of MDPI and/or the editor(s). MDPI and/or the editor(s) disclaim responsibility for any injury to people or property resulting from any ideas, methods, instructions or products referred to in the content. |
© 2025 by the authors. Licensee MDPI, Basel, Switzerland. This article is an open access article distributed under the terms and conditions of the Creative Commons Attribution (CC BY) license (https://creativecommons.org/licenses/by/4.0/).
Share and Cite
Satheeshkumar, P.S.; Sonis, S.T.; Epstein, J.B.; Pili, R. Predictors for Emergency Admission Among Homeless Metastatic Cancer Patients and Association of Social Determinants of Health with Negative Health Outcomes. Cancers 2025, 17, 1121. https://doi.org/10.3390/cancers17071121
Satheeshkumar PS, Sonis ST, Epstein JB, Pili R. Predictors for Emergency Admission Among Homeless Metastatic Cancer Patients and Association of Social Determinants of Health with Negative Health Outcomes. Cancers. 2025; 17(7):1121. https://doi.org/10.3390/cancers17071121
Chicago/Turabian StyleSatheeshkumar, Poolakkad S., Stephen T. Sonis, Joel B. Epstein, and Roberto Pili. 2025. "Predictors for Emergency Admission Among Homeless Metastatic Cancer Patients and Association of Social Determinants of Health with Negative Health Outcomes" Cancers 17, no. 7: 1121. https://doi.org/10.3390/cancers17071121
APA StyleSatheeshkumar, P. S., Sonis, S. T., Epstein, J. B., & Pili, R. (2025). Predictors for Emergency Admission Among Homeless Metastatic Cancer Patients and Association of Social Determinants of Health with Negative Health Outcomes. Cancers, 17(7), 1121. https://doi.org/10.3390/cancers17071121