
Screening Mammography and Breast Cancer: Variation in Risk with Rare Deleterious or Predicted Deleterious Variants in DNA Repair Genes
 , , , , , , , , , , , , , , , ,
Simple Summary
Abstract
1. Introduction
2. Methods
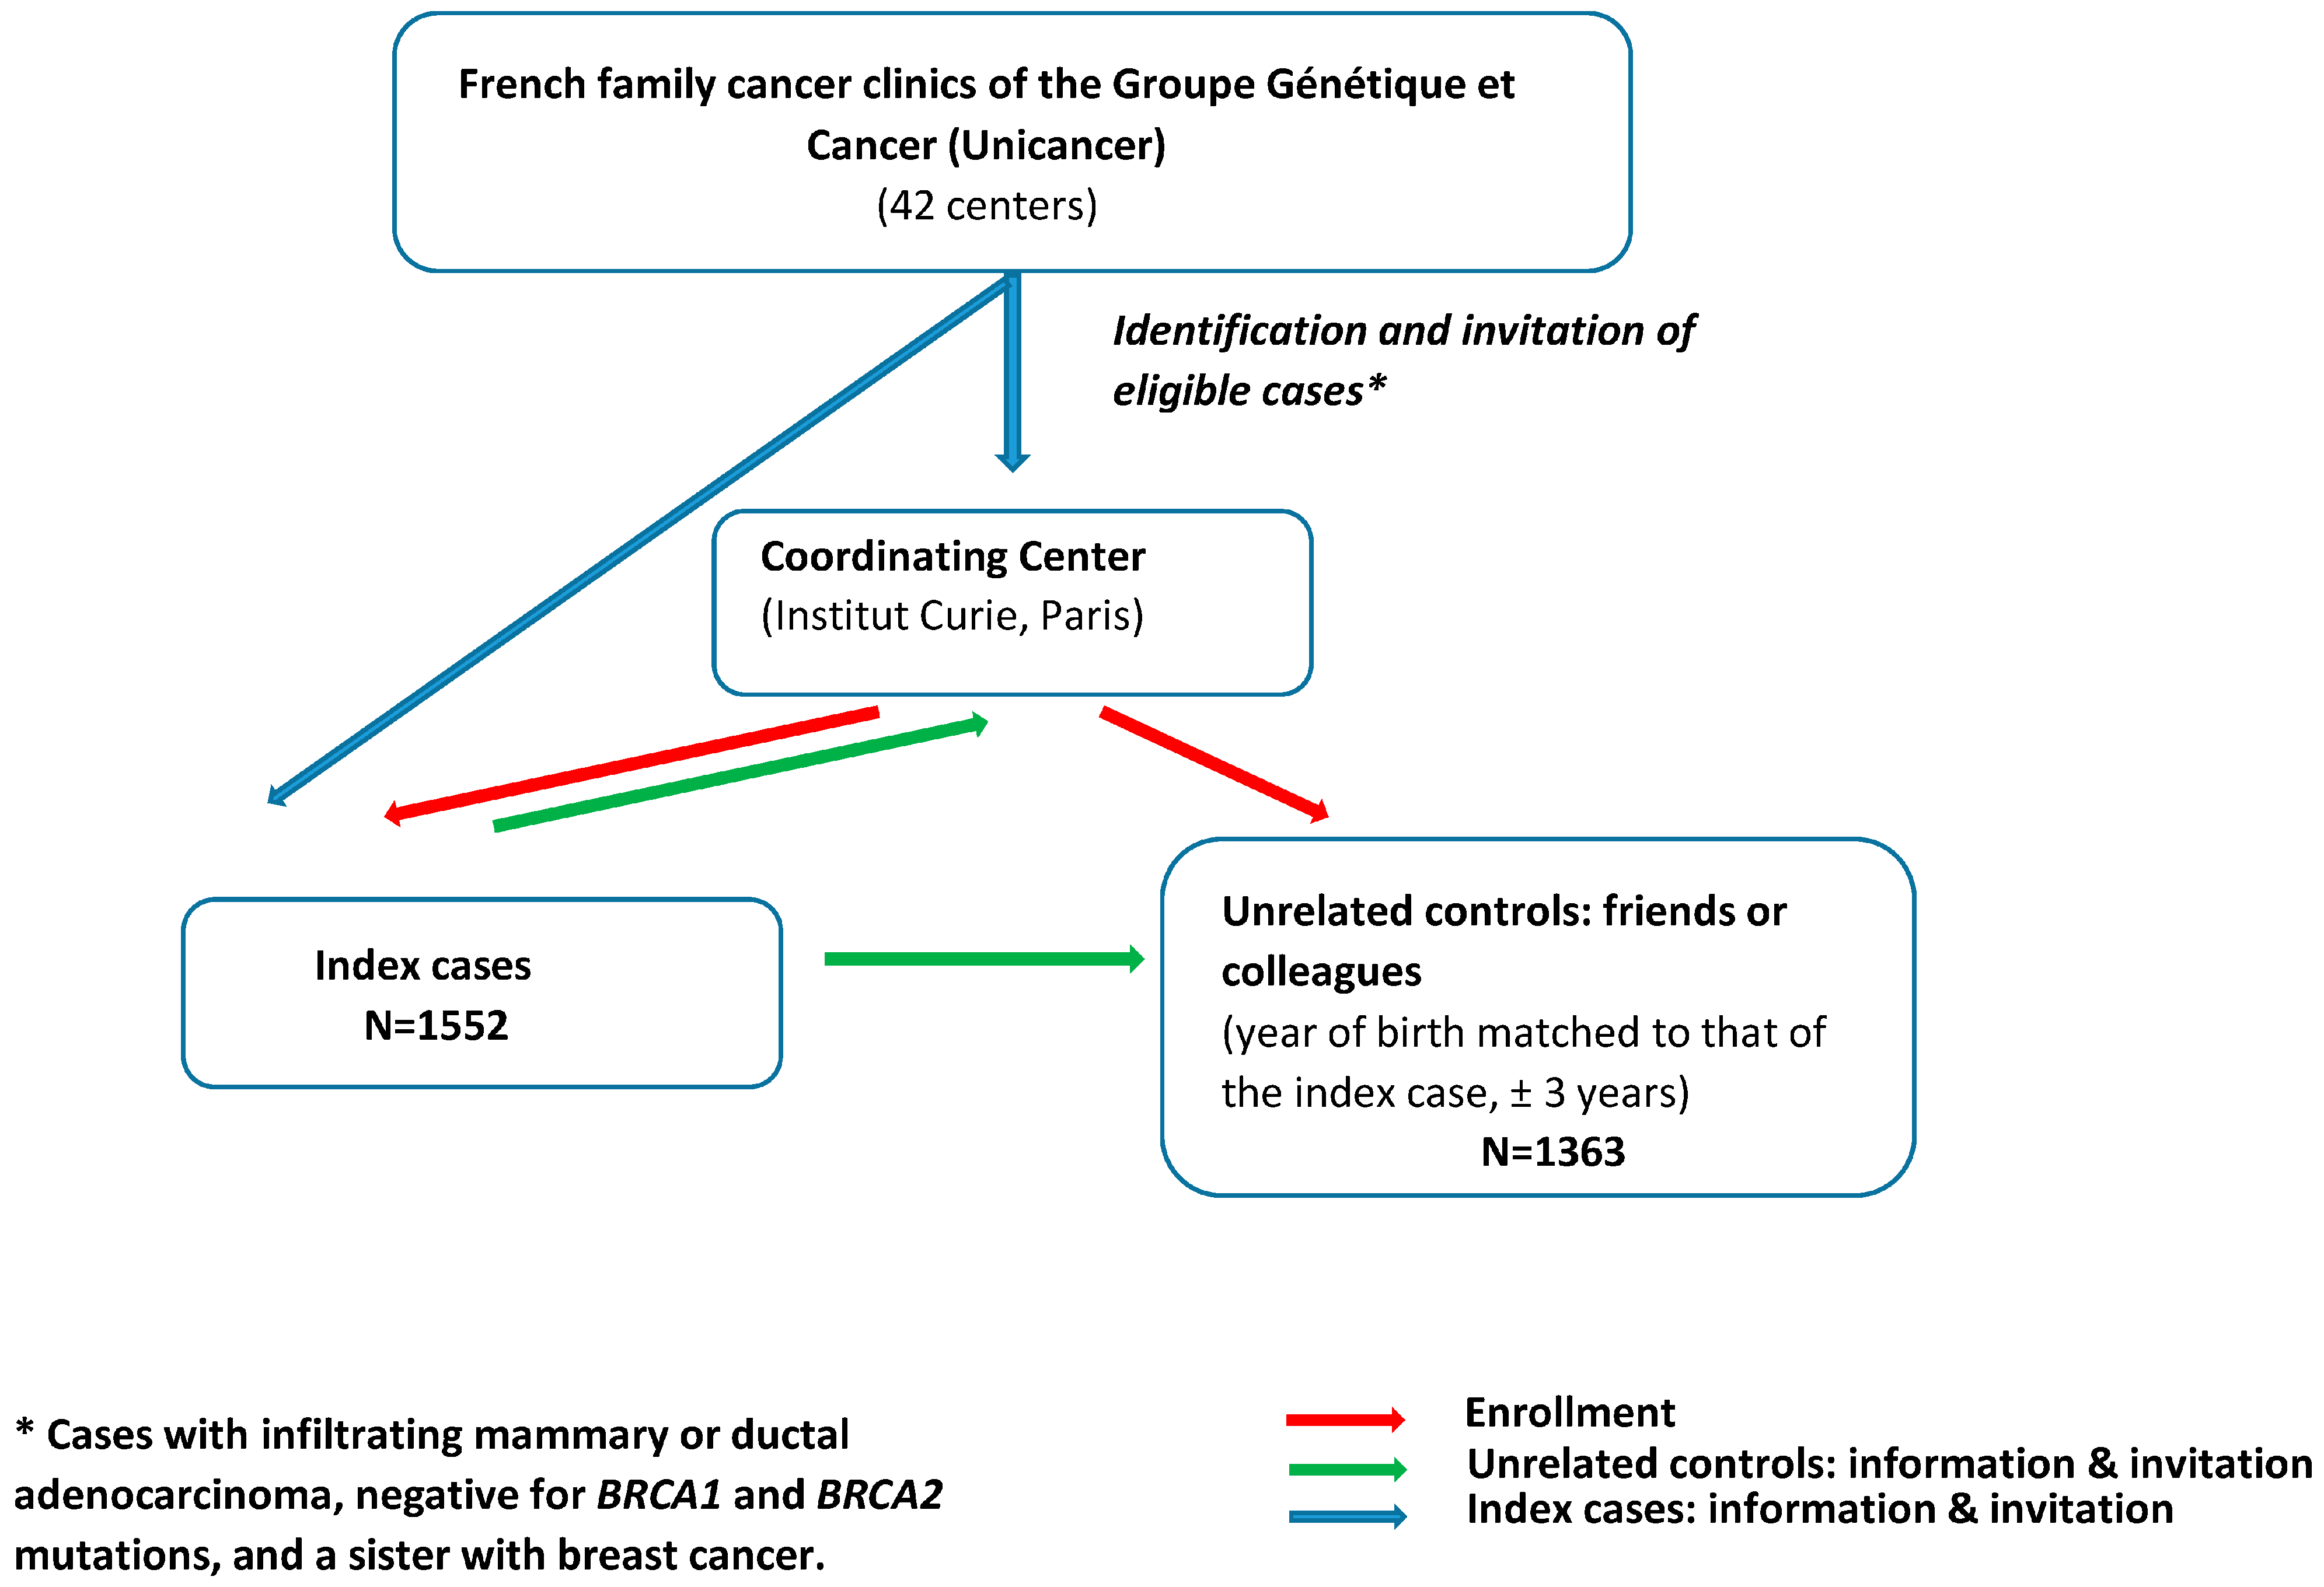
2.1. Study Population
2.2. Screening Mammography
2.3. Variants in DNA Repair Genes
2.4. Statistical Analyses
3. Results
4. Discussion
5. Conclusions
Supplementary Materials
Author Contributions
Funding
Institutional Review Board Statement
Informed Consent Statement
Data Availability Statement
Acknowledgments
Conflicts of Interest
Abbreviations
| BC | breast cancer |
| BRCA1/2 | BRCA1 or BRCA2 |
| CI | confidence interval |
| D-PDV | deleterious or predicted deleterious variant |
| DNA | deoxyribonucleic acid |
| OR | odds ratio |
| VRS | variant risk score |
References
- IARC Working Group on the Evaluation of Cancer-Preventive Strategies. Breast Cancer Screening; World Health Organization: Geneva, Switzerland, 2016.
- Pijpe, A.; Andrieu, N.; Easton, D.F.; Kesminiene, A.; Cardis, E.; Noguès, C.; Gauthier-Villars, M.; Lasset, C.; Fricker, J.P.; Peock, S.; et al. Exposure to diagnostic radiation and risk of breast cancer among carriers of BRCA1/2 mutations: Retrospective cohort study (GENE-RAD-RISK). BMJ 2012, 345, e5660. [Google Scholar] [PubMed]
- Andrieu, N.; Easton, D.F.; Chang-Claude, J.; Rookus, M.A.; Brohet, R.; Cardis, E.; Antoniou, A.C.; Wagner, T.; Simard, J.; Evans, G.; et al. Effect of chest X-rays on the risk of breast cancer among BRCA1/2 mutation carriers in the international BRCA1/2 carrier cohort study: A report from the EMBRACE, GENEPSO, GEO-HEBON, and IBCCS Collaborators’ Group. J. Clin. Oncol. 2006, 24, 3361–3366. [Google Scholar] [PubMed]
- Gronwald, J.; Pijpe, A.; Byrski, T.; Huzarski, T.; Stawicka, M.; Cybulski, C.; van Leeuwen, F.; Lubiński, J.; Narod, S.A. Early radiation exposures and BRCA1-associated breast cancer in young women from Poland. Breast Cancer Res. Treat. 2008, 112, 581–584. [Google Scholar]
- John, E.M.; Phipps, A.I.; Knight, J.A.; Milne, R.L.; Dite, G.S.; Hopper, J.L.; Andrulis, I.L.; Southey, M.; Giles, G.G.; West, D.W.; et al. Medical radiation exposure and breast cancer risk: Findings from the Breast Cancer Family Registry. Int. J. Cancer 2007, 121, 386–394. [Google Scholar]
- John, E.M.; McGuire, V.; Thomas, D.; Haile, R.; Ozcelik, H.; Milne, R.L.; Felberg, A.; West, D.W.; Miron, A.; Knight, J.A.; et al. Diagnostic chest X-rays and breast cancer risk before age 50 years for BRCA1 and BRCA2 mutation carriers. Cancer Epidemiol. Biomarkers Prev. 2013, 22, 1547–1556. [Google Scholar]
- Lecarpentier, J.; Noguès, C.; Mouret-Fourme, E.; Stoppa-Lyonnet, D.; Lasset, C.; Caron, O.; Fricker, J.P.; Gladieff, L.; Faivre, L.; Sobol, H.; et al. Variation in breast cancer risk with mutation position, smoking, alcohol, and chest X-ray history, in the French National BRCA1/2 carrier cohort (GENEPSO). Breast Cancer Res. Treat. 2011, 130, 927–938. [Google Scholar]
- Geoffroy-Perez, B.; Janin, N.; Ossian, K.; Laugé, A.; Stoppa-Lyonnet, D.; Andrieu, N. Variation in breast cancer risk of heterozygotes for ataxia-telangiectasia according to environmental factors. Int. J. Cancer 2002, 99, 619–623. [Google Scholar] [CrossRef]
- Giannakeas, V.; Lubinski, J.; Gronwald, J.; Moller, P.; Armel, S.; Lynch, H.T.; Foulkes, W.D.; Kim-Sing, C.; Singer, C.; Neuhausen, S.L.; et al. Mammography screening and the risk of breast cancer in BRCA1 and BRCA2 mutation carriers: A prospective study. Breast Cancer Res. Treat. 2014, 147, 113–118. [Google Scholar] [CrossRef] [PubMed]
- Narod, S.A.; Lubinski, J.; Ghadirian, P.; Lynch, H.T.; Moller, P.; Foulkes, W.D.; Rosen, B.; Kim-Sing, C.; Isaacs, C.; Domchek, S.; et al. Screening mammography and risk of breast cancer in BRCA1 and BRCA2 mutation carriers: A case-control study. Lancet Oncol. 2006, 7, 402–406. [Google Scholar]
- Berrington de Gonzalez, A.; Berg, C.D.; Visvanathan, K.; Robson, M. Estimated risk of radiation-induced breast cancer from mammographic screening for young BRCA mutation carriers. J. Natl. Cancer Inst. 2009, 101, 205–209. [Google Scholar]
- Goldfrank, D.; Chuai, S.; Bernstein, J.L.; Ramon, Y.; Cajal, T.; Lee, J.B.; Alonso, M.C.; Diez, O.; Baiget, M.; Kauff, N.D.; et al. Effect of mammography on breast cancer risk in women with mutations in BRCA1 or BRCA2. Cancer Epidemiol. Biomark. Prev. 2006, 15, 2311–2313. [Google Scholar]
- Canet, M.L.; Harbron, R.; Thierry-Chef, I.; Cardis, E. Cancer effects of low to moderate doses of ionising radiation in young people with cancer predisposing conditions: A systematic review. Cancer Epidemiol. Biomark. Prev. 2022, 31, 1871–1889. [Google Scholar]
- Kircher, M.; Witten, D.M.; Jain, P.; O’Roak, B.J.; Cooper, G.M.; Shendure, J. A general framework for estimating the relative pathogenicity of human genetic variants. Nat. Genet. 2014, 46, 310–315. [Google Scholar]
- Ribeiro, G.M.; Coignard, J.; Eon-Marchais, S.; Dondon, M.G.; Le Gal, D.; Beauvallet, J.; Mebirouk, N.; Belotti, M.; Caron, O.; Gauthier-Villars, M.; et al. Diagnostic chest X-rays and breast cancer risk among women with a hereditary predisposition to breast cancer unexplained by a BRCA1 or BRCA2 mutation. Breast Cancer Res. 2021, 23, 79. [Google Scholar] [CrossRef]
- Girard, E.; Eon-Marchais, S.; Olaso, R.; Renault, A.L.; Damiola, F.; Dondon, M.G.; Barjhoux, L.; Goidin, D.; Meyer, V.; Le Gal, D.; et al. Familial breast cancer and DNA repair genes: Insights into known and novel susceptibility genes from the GENESIS study, and implications for multigene panel testing. Int. J. Cancer 2019, 144, 1962–1974. [Google Scholar]
- Sinilnikova, O.M.; Dondon, M.G.; Eon-Marchais, S.; Damiola, F.; Barjhoux, L.; Marcou, M.; Verny-Pierre, C.; Sornin, V.; Toulemonde, L.; Beauvallet, J.; et al. GENESIS: A French national resource to study the missing heritability of breast cancer. BMC. Cancer 2016, 16, 13. [Google Scholar]
- StataCorp. Stata: Release 14. Statistical Software (2015); StataCorp LP: College Station, TX, USA, 2015. [Google Scholar]
- Breast Cancer Association Consortium; Dorling, L.; Carvalho, S.; Allen, J.; González-Neira, A.; Luccarini, C.; Wahlström, C.; Pooley, K.A.; Parsons, M.T.; Fortuno, C.; et al. Breast Cancer Risk Genes—Association Analysis in More than 113,000 Women. N. Engl. J. Med. 2021, 384, 428–439. [Google Scholar]
- Hu, C.; Hart, S.N.; Gnanaolivu, R.; Huang, H.; Lee, K.Y.; Na, J.; Gao, C.; Lilyquist, J.; Yadav, S.; Boddicker, N.J.; et al. Population-Based Study of Genes Previously Implicated in Breast Cancer. N. Engl. J. Med. 2021, 384, 440–451. [Google Scholar]
- Evans, D.G.; Kotre, C.J.; Harkness, E.; Wilson, M.; Maxwell, A.J.; Howell, A. No strong evidence for increased risk of breast cancer 8–26 years after multiple mammograms in their 30s in females at moderate and high familial risk. Br. J. Radiol. 2016, 89, 20150960. [Google Scholar] [CrossRef] [PubMed]
- Pijpe, A.; Mulder, R.L.; Manders, P.; Van Leeuwen, F.E.; Rookus, M.A. Validation study suggested no differential misclassification of self-reported mammography history in BRCA1/2 mutation carriers. J. Clin. Epidemiol. 2011, 64, 1434–1443. [Google Scholar]
- Walker, M.J.; Chiarelli, A.M.; Mirea, L.; Glendon, G.; Ritvo, P.; Andrulis, I.L.; Knight, J.A. Accuracy of Self-Reported Screening Mammography Use: Examining Recall among Female Relatives from the Ontario Site of the Breast Cancer Family Registry. Int. Sch. Res. Not. 2013, 2013, 810573. [Google Scholar] [CrossRef] [PubMed]
- Iavicoli, I.; Fontana, L.; Santocono, C.; Guarino, D.; Laudiero, M.; Calabrese, E.J. The challenges of defining hormesis in epidemiological studies: The case of radiation hormesis. Sci. Total Environ. 2023, 902, 166030. [Google Scholar] [CrossRef] [PubMed]
- Dauer, L.T.; Brooks, A.L.; Hoel, D.G.; Morgan, W.F.; Stram, D.; Tran, P. Review and evaluation of updated research on the health effects associated with low-dose ionising radiation. Radiat. Prot. Dosim. 2010, 140, 103–136. [Google Scholar] [CrossRef]
- Lewanski, C.R.; Gullick, W.J. Radiotherapy and cellular signalling. Lancet Oncol. 2001, 2, 366–370. [Google Scholar] [CrossRef] [PubMed]
- Van Buuren, S.; Boshuizen, H.C.; Knook, D.L. Multiple imputation of missing blood pressure covariates in survival analysis. Stat. Med. 1999, 18, 681–694. [Google Scholar] [CrossRef]
- Raghunathan, T.E. What do we do with missing data? Some options for analysis of incomplete data. Annu. Rev. Public Health 2004, 25, 99–117. [Google Scholar] [CrossRef]
- Little, R.J.A.; Rubin, D.B. Statistical Analysis with Missing Data, 2nd ed.; John Wiley & Sons: Hoboken, NJ, USA, 2002. [Google Scholar]
- Rubin, D.B.; Schenker, N. Multiple imputation in health-care databases: An overview and some applications. Stat. Med. 1991, 10, 585–598. [Google Scholar] [CrossRef]

| Characteristics | Cases N = 1552 | Controls N = 1363 | ||
|---|---|---|---|---|
| No. | % | No. | % | |
| Birth cohort | ||||
| ≤1945 | 488 | 31.4 | 294 | 21.6 |
| 1946–1959 | 797 | 51.4 | 706 | 51.8 |
| ≥1960 | 267 | 17.2 | 363 | 26.6 |
| Age at censoring, years | ||||
| Mean (SD) | 50.2 (9.3) | 55.8 (9.9) | ||
| ≤45 | 513 | 33.1 | 201 | 14.8 |
| 46–50 | 336 | 21.7 | 197 | 14.5 |
| 51–60 | 473 | 30.5 | 485 | 35.6 |
| >60 | 230 | 14.8 | 480 | 35.2 |
| Education level | ||||
| Intermediate/High | 780 | 50.3 | 916 | 67.2 |
| Basic | 714 | 46.0 | 434 | 31.8 |
| No graduated | 58 | 3.7 | 12 | 0.9 |
| Missing | 0 | 0.0 | 1 | 0.1 |
| Body Mass Index | ||||
| ≥18.5 and <25 | 1019 | 65.6 | 869 | 63.8 |
| <18.5 | 69 | 4.5 | 32 | 2.3 |
| ≥25 and <30 | 341 | 22.0 | 345 | 25.3 |
| ≥30 | 120 | 7.7 | 117 | 8.6 |
| Missing | 3 | 0.2 | 0 | 0.0 |
| Smoking | ||||
| No | 832 | 53.6 | 680 | 49.9 |
| Current | 159 | 10.2 | 158 | 11.6 |
| Past | 550 | 35.4 | 514 | 37.7 |
| Missing | 11 | 0.7 | 11 | 0.8 |
| Number of full-term pregnancies | ||||
| >2 | 445 | 28.7 | 411 | 30.2 |
| 1–2 | 921 | 59.3 | 763 | 56.0 |
| 0 | 185 | 11.9 | 187 | 13.7 |
| Missing | 1 | 0.1 | 2 | 0.1 |
| Number of breast cancers in the family at censure a | ||||
| None | 427 | 27.5 | 959 | 70.4 |
| 1 | 818 | 52.7 | 187 | 13.7 |
| ≥2 | 307 | 19.8 | 216 | 15.9 |
| Tumor estrogen receptors (ERs) | ||||
| ER+ | 818 | 52.7 | ||
| ER− | 168 | 10.8 | ||
| Missing | 566 | 36.5 | ||
| Total number of variants in DNA repair genes | ||||
| 0 | 191 | 19.2 | 241 | 20.7 |
| 1 | 294 | 29.5 | 374 | 32.2 |
| 2 | 265 | 26.6 | 291 | 25.0 |
| 3 | 151 | 15.2 | 160 | 13.8 |
| 4 | 61 | 6.1 | 64 | 5.5 |
| 5 | 26 | 2.6 | 28 | 2.4 |
| 6 | 5 | 0.5 | 4 | 0.3 |
| 7 | 3 | 0.3 | 0 | 0.0 |
| 8 | 1 | 0.1 | 0 | 0.0 |
| Missing | 555 | 35.8 | 201 | 14.8 |
| DNA repair gene group b | ||||
| Group “Reduced” | ||||
| 0 | 723 | 46.6 | 721 | 52.9 |
| ≥1 | 274 | 17.7 | 441 | 32.4 |
| Group “Independent” | ||||
| 0 | 575 | 37.1 | 659 | 48.4 |
| ≥1 | 422 | 27.2 | 503 | 36.9 |
| Group “Increased” | ||||
| 0 | 422 | 27.2 | 667 | 48.9 |
| ≥1 | 575 | 37.1 | 495 | 36.3 |
| Characteristics a | Cases N = 1552 | Controls N = 1363 | ||
|---|---|---|---|---|
| No. | % | No. | % | |
| Mammography | ||||
| Never | 266 | 17.1 | 102 | 7.5 |
| Ever | 1271 | 81.9 | 1252 | 91.9 |
| Missing | 15 | 1.0 | 9 | 0.7 |
| Lifetime number of mammograms | ||||
| 1–4 | 614 | 39.6 | 483 | 35.4 |
| 5–9 | 409 | 26.3 | 537 | 39.4 |
| ≥10 | 248 | 16.0 | 232 | 17.0 |
| No exposure | 266 | 17.1 | 102 | 7.5 |
| Missing | 15 | 1.0 | 9 | 0.7 |
| Mean b (SD b) | 6.04 (5.21) | 6.25 (4.19) | ||
| Lifetime number of mammogram views | ||||
| 1–9 | 208 | 1.4 | 165 | 12.1 |
| 10–19 | 198 | 12.8 | 227 | 16.7 |
| 20–29 | 158 | 10.2 | 233 | 17.1 |
| 30–39 | 123 | 7.9 | 189 | 13.9 |
| ≥40 | 206 | 13.3 | 230 | 16.9 |
| No exposure | 266 | 17.1 | 102 | 7.5 |
| Missing | 392 | 25.3 | 217 | 15.9 |
| Mean b (SD b) | 27.9 (25.2) | 27.7 (19.5) | ||
| Age at first exposure (years) | ||||
| ≥50 | 147 | 9.5 | 295 | 21.6 |
| 40–49 | 487 | 31.4 | 618 | 45.3 |
| 30–39 | 483 | 31.1 | 269 | 19.7 |
| <30 | 132 | 8.5 | 59 | 4.3 |
| No exposure | 266 | 17.1 | 102 | 7.5 |
| Missing | 37 | 2.4 | 20 | 1.5 |
| Mean b (SD b) | 38.9 (8.52) | 43.1 (8.25) | ||
| Duration since first exposure (years) | ||||
| ≤5 | 266 | 17.1 | 188 | 13.8 |
| 6–10 | 315 | 20.3 | 296 | 21.7 |
| 11–20 | 448 | 28.9 | 506 | 37.1 |
| >20 | 220 | 14.2 | 251 | 18.4 |
| No exposure | 266 | 17.1 | 102 | 7.5 |
| Missing | 37 | 2.4 | 20 | 1.5 |
| Mean b (SD b) | 12.7 (8.28) | 13.9 (7.82) | ||
| Number of | OR a | 95% CI | Multiple Imputation | |||
|---|---|---|---|---|---|---|
| Cases | Controls | OR a | 95% CI | |||
| Mammography exposure | ||||||
| Never | 266 | 102 | 1 | 1 | ||
| Ever | 1271 | 1252 | 0.99 | 0.69–1.43 | 0.98 | 0.68–1.42 |
| Number of mammograms | ||||||
| 0 | 266 | 102 | 1 | 1 | ||
| 1–4 | 614 | 483 | 1.04 | 0.72–1.51 | 1.02 | 0.70–1.49 |
| 5–9 | 409 | 537 | 0.82 | 0.54–1.24 | 0.82 | 0.55–1.24 |
| ≥10 | 248 | 232 | 1.36 | 0.86–2.16 | 1.36 | 0.86–2.16 |
| Continuous (incl 0) | 1.04 | 1.01–1.06 | ||||
| Age at first exposure, years b | ||||||
| No exposure | 266 | 102 | 1 | 1 | ||
| ≥50 | 147 | 295 | 0.56 | 0.34–0.91 | 0.56 | 0.34–0.91 |
| 40–49 | 457 | 618 | 0.67 | 0.45–0.99 | 0.67 | 0.45–0.99 |
| 30–39 | 483 | 269 | 1.22 | 0.82–1.80 | 1.20 | 0.81–1.77 |
| <30 | 132 | 59 | 1.52 | 0.91–2.53 | 1.46 | 0.88–2.45 |
| ≥50 | 147 | 295 | 1 | 1 | ||
| 40–49 | 457 | 618 | 1.20 | 0.87–1.64 | 1.20 | 0.87–1.65 |
| 30–39 | 483 | 269 | 2.17 | 1.49–3.18 | 2.15 | 1.47–3.15 |
| <30 | 132 | 59 | 2.71 | 1.60–4.58 | 2.63 | 1.55–4.46 |
| No exposure | 266 | 102 | 1.79 | 1.10–2.90 | 1.79 | 1.10–2.93 |
| Continuous (no exposure excluded) | 0.98 | 0.96–0.99 | ||||
| Time since first exposure, years b | ||||||
| No exposure | 266 | 102 | 0.98 | 0.65–1.48 | 0.99 | 0.66–1.49 |
| ≤5 | 266 | 188 | 1 | 1 | ||
| 6–10 | 315 | 296 | 0.90 | 0.64–1.26 | 0.90 | 0.64–1.26 |
| 11–20 | 448 | 506 | 0.97 | 0.70–1.35 | 0.97 | 0.69–1.34 |
| >20 | 220 | 251 | 1.17 | 0.77–1.78 | 1.14 | 0.75–1.75 |
| Continuous (no exposure excluded) | 1.02 | 1.01–1.04 | ||||
| ER− | ER+ | |||||||
|---|---|---|---|---|---|---|---|---|
| Number of | Number of | |||||||
| Cases N = 168 | Controls N = 1363 | OR a | 95% CI | Cases N = 818 | Controls N = 1363 | OR a | 95% CI | |
| Mammography exposure | ||||||||
| Never | 25 | 102 | 1 | 107 | 102 | 1 | ||
| Ever | 140 | 1252 | 1.78 | 0.83–3.83 | 706 | 1252 | 1.42 | 0.92–2.19 |
| Number of mammograms | ||||||||
| 0 | 25 | 102 | 1 | 67 | 102 | 1 | ||
| 1–4 | 77 | 483 | 1.87 | 0.87–4.00 | 244 | 483 | 1.46 | 0.94–2.26 |
| 5–9 | 50 | 537 | 1.29 | 0.54–3.07 | 314 | 537 | 1.27 | 0.77–2.09 |
| ≥10 | 13 | 232 | 1.01 | 0.35–2.92 | 605 | 232 | 2.40 | 1.38–4.15 |
| Continuous (incl 0) | 0.99 | 0.93–1.06 | 1.08 | 1.04–1.11 | ||||
| Age at first exposure, years b | ||||||||
| No exposure | 25 | 102 | 1 | 107 | 102 | 1 | ||
| ≥50 | 17 | 295 | 1.21 | 0.42–3.46 | 133 | 295 | 0.78 | 0.43–1.41 |
| 40–49 | 57 | 618 | 1.35 | 0.58–3.14 | 176 | 618 | 0.91 | 0.57–1.47 |
| 30–39 | 55 | 269 | 2.19 | 0.99–4.83 | 246 | 269 | 1.67 | 1.05–2.65 |
| <30 | 11 | 59 | 1.53 | 0.55–4.39 | 138 | 59 | 2.33 | 1.30–4.17 |
| Continuous (no exposure excluded) | 0.99 | 0.96–1.03 | 0.97 | 0.95–0.99 | ||||
| Time since first exposure, years b | ||||||||
| No exposure | 25 | 102 | 0.53 | 0.23–1.18 | 107 | 102 | 0.71 | 0.44–1.15 |
| ≤5 | 36 | 188 | 1 | 80 | 188 | 1 | ||
| 6–10 | 36 | 296 | 0.85 | 0.46–1.57 | 277 | 296 | 0.99 | 0.67–1.47 |
| 11–20 | 53 | 506 | 0.98 | 0.53–1.79 | 257 | 506 | 1.04 | 0.71–1.52 |
| >20 | 15 | 251 | 0.74 | 0.30–1.84 | 79 | 251 | 1.29 | 0.79–2.09 |
| Continuous (no exposure excluded) | 1.00 | 0.97–1.04 | 1.03 | 1.01–1.05 | ||||
| DNA Repair Rare Variants | Multiple Imputation for the Adjustment Variables | |||||
|---|---|---|---|---|---|---|
| Number of | ||||||
| Cases | Controls | OR a | 95% CI | OR a | 95% CI | |
| “Reduced” b | ||||||
| No | 723 | 721 | 1 | 1 | ||
| Yes | 274 | 441 | 0.62 | 0.50–0.77 | 0.62 | 0.50–0.77 |
| Number of variants | ||||||
| 0 | 723 | 721 | 1 | 1 | ||
| 1 | 227 | 341 | 0.66 | 0.53–0.84 | 0.67 | 0.53–0.84 |
| 2 | 44 | 85 | 0.52 | 0.34–0.81 | 0.51 | 0.33–0.79 |
| ≥3 | 3 | 15 | 0.26 | 0.07–1.03 | 0.25 | 0.06–1.01 |
| Continuous | 0.69 | 0.59–0.81 | 0.69 | 0.59–0.81 | ||
| “Independent” c | ||||||
| No | 575 | 659 | 1 | 1 | ||
| Yes | 422 | 503 | 1.02 | 0.84–1.25 | 1.03 | 0.84–1.25 |
| Number of variants | ||||||
| 0 | 575 | 659 | 1 | 1 | ||
| 1 | 309 | 389 | 0.97 | 0.78–1.21 | 0.97 | 0.78–1.21 |
| 2 | 96 | 92 | 1.16 | 0.81–1.67 | 1.17 | 0.82–1.67 |
| ≥3 | 17 | 22 | 1.32 | 0.62–2.80 | 1.32 | 0.62–2.77 |
| Continuous | 1.07 | 0.93–1.22 | 1.06 | 0.93–1.22 | ||
| “Increased” d | ||||||
| No | 422 | 667 | 1 | 1 | ||
| Yes | 575 | 495 | 1.98 | 1.62–2.42 | 1.98 | 1.62–2.42 |
| Number of variants | ||||||
| 0 | 422 | 667 | 1 | 1 | ||
| 1 | 381 | 357 | 1.86 | 1.49–2.32 | 1.81 | 1.45–2.26 |
| 2 | 142 | 116 | 1.99 | 1.44–2.74 | 1.95 | 1.42–2.68 |
| ≥3 | 52 | 22 | 3.91 | 2.15–7.08 | 3.88 | 2.15–7.01 |
| Continuous | 1.52 | 1.34–1.71 | 1.51 | 1.34–1.71 | ||
| “Reduced” | “Independent” | “Increased” | ||||||||||||
|---|---|---|---|---|---|---|---|---|---|---|---|---|---|---|
| Number of | Number of | Number of | Pint | |||||||||||
| Cases N = 274 | Controls N = 441 | OR a | 95% CI | Cases N = 422 | Controls N = 503 | OR a | 95% CI | Cases N = 575 | Controls N = 495 | OR a | 95% CI | “Independent” | “Increased” | |
| Mammography exposure | ||||||||||||||
| Never | 19 | 32 | 1 | 44 | 29 | 1 | 62 | 28 | 1 | |||||
| Ever | 251 | 406 | 2.17 | 0.92–5.15 | 377 | 471 | 1.25 | 0.62–2.54 | 509 | 464 | 0.92 | 0.48–1.75 | ns | 0.021 |
| Number of mammograms | ||||||||||||||
| 0 | 19 | 32 | 1 | 44 | 29 | 1 | 62 | 28 | 1 | |||||
| 1–4 | 105 | 149 | 2.27 | 0.95–5.41 | 158 | 162 | 1.34 | 0.66–2.74 | 207 | 158 | 0.99 | 0.52–1.90 | ns | 0.020 |
| 5–9 | 92 | 178 | 1.77 | 0.68–4.65 | 131 | 219 | 1.04 | 0.47–2.30 | 180 | 212 | 0.74 | 0.36–1.52 | ns | 0.019 |
| ≥10 | 54 | 79 | 2.34 | 0.81–6.74 | 88 | 90 | 2.30 | 0.96–5.54 | 122 | 94 | 1.49 | 0.67–3.30 | ns | ns |
| Continuous incl 0 | 1.03 | 0.98–1.08 | 1.06 | 1.02–1.10 | 1.06 | 1.02–1.10 | ||||||||
| Age at first exposure, years b | ||||||||||||||
| No exposure | 19 | 32 | 1 | 44 | 29 | 1 | 62 | 28 | 1 | |||||
| ≥50 | 29 | 100 | 1.65 | 0.53–5.08 | 40 | 111 | 1.01 | 0.39–2.62 | 62 | 111 | 0.75 | 0.32–1.73 | ns | 0.019 |
| 40–49 | 104 | 195 | 1.77 | 0.70–4.46 | 154 | 239 | 0.93 | 0.43–2.02 | 193 | 223 | 0.76 | 0.38–1.53 | ns | 0.021 |
| 30–39 | 90 | 88 | 2.22 | 0.91–5.54 | 138 | 97 | 1.48 | 0.70–3.11 | 196 | 102 | 0.99 | 0.50–1.94 | ns | 0.057 |
| <30 | 25 | 18 | 3.16 | 1.01–9.89 | 42 | 23 | 1.61 | 0.64–4.01 | 52 | 21 | 1.20 | 0.51–2.80 | ns | ns |
| Continuous (no exposure excluded) | 1.00 | 0.97–1.05 | 0.99 | 0.96–1.02 | 0.99 | 0.96–1.01 | ||||||||
| Time since first exposure, years b | ||||||||||||||
| No exposure | 19 | 32 | 0.39 | 0.16–0.99 | 44 | 29 | 0.69 | 0.32–1.51 | 62 | 28 | 0.98 | 0.48–2.01 | 0.017 | 0.008 |
| ≤5 | 51 | 61 | 1 | 62 | 65 | 1 | 79 | 58 | 1 | |||||
| 6–10 | 60 | 91 | 0.74 | 0.37–1.47 | 90 | 111 | 0.83 | 0.45–1.51 | 132 | 108 | 0.84 | 0.48–1.46 | ns | ns |
| 11–20 | 98 | 166 | 0.78 | 0.40–1.53 | 148 | 191 | 0.87 | 0.49–1.55 | 190 | 188 | 0.94 | 0.54–1.62 | ns | ns |
| >20 | 39 | 83 | 0.55 | 0.23–1.33 | 74 | 100 | 0.83 | 0.40–1.72 | 102 | 103 | 0.99 | 0.51–1.94 | ns | 0.051 |
| Continuous (no exposure excluded) | 0.99 | 0.96–1.03 | 1.01 | 0.98–1.04 | 1.01 | 0.99–1.04 | ||||||||
| Number of | OR a | 95% CI | p | ||
|---|---|---|---|---|---|
| Cases | Controls | ||||
| Mammography exposure | |||||
| No exposure | 92 | 74 | 1 | ||
| Ever and VRS < ln(0.8) | 83 | 214 | 2.56 | 0.94–6.94 | |
| Ever and ln(0.8) ≤ VRS < ln(0.95) | 82 | 134 | 3.88 | 1.39–10.8 | |
| Ever and ln(0.95) ≤ VRS < ln(1.1) | 247 | 332 | 2.29 | 1.07–4.92 | Phet = 0.104 |
| Ever and ln(1.1) ≤ VRS < ln(1.5) | 232 | 243 | 1.24 | 0.54–2.87 | Pint b = 0.006 |
| Ever and VRS ≥ ln(1.5) | 254 | 157 | 0.30 | 0.10–0.87 | |
| Age at first exposure, years | |||||
| No exposure | 92 | 74 | 1 | ||
| ≥40 and VRS < ln(0.95) | 87 | 256 | 1.41 | 0.57–3.48 | |
| ≥40 and ln(0.95) ≤ VRS < ln(1.1) | 124 | 245 | 1.05 | 0.50–2.19 | |
| ≥40 and ln(1.1) ≤ VRS < ln(1.5) | 122 | 180 | 0.74 | 0.33–1.66 | ns |
| ≥40 and VRS ≥ ln(1.5) | 126 | 109 | 0.33 | 0.14–0.82 | |
| <40 and VRS < ln(0.95) | 76 | 90 | 2.60 | 1.03–6.55 | |
| <40 and ln(0.95) ≤ VRS < ln(1.1) | 116 | 83 | 2.36 | 1.10–5.05 | |
| <40 and ln(1.1) ≤ VRS < ln(1.5) | 108 | 62 | 1.59 | 0.68–3.71 | ns |
| <40 and VRS ≥ ln(1.5) | 126 | 44 | 0.64 | 0.25–1.60 | |
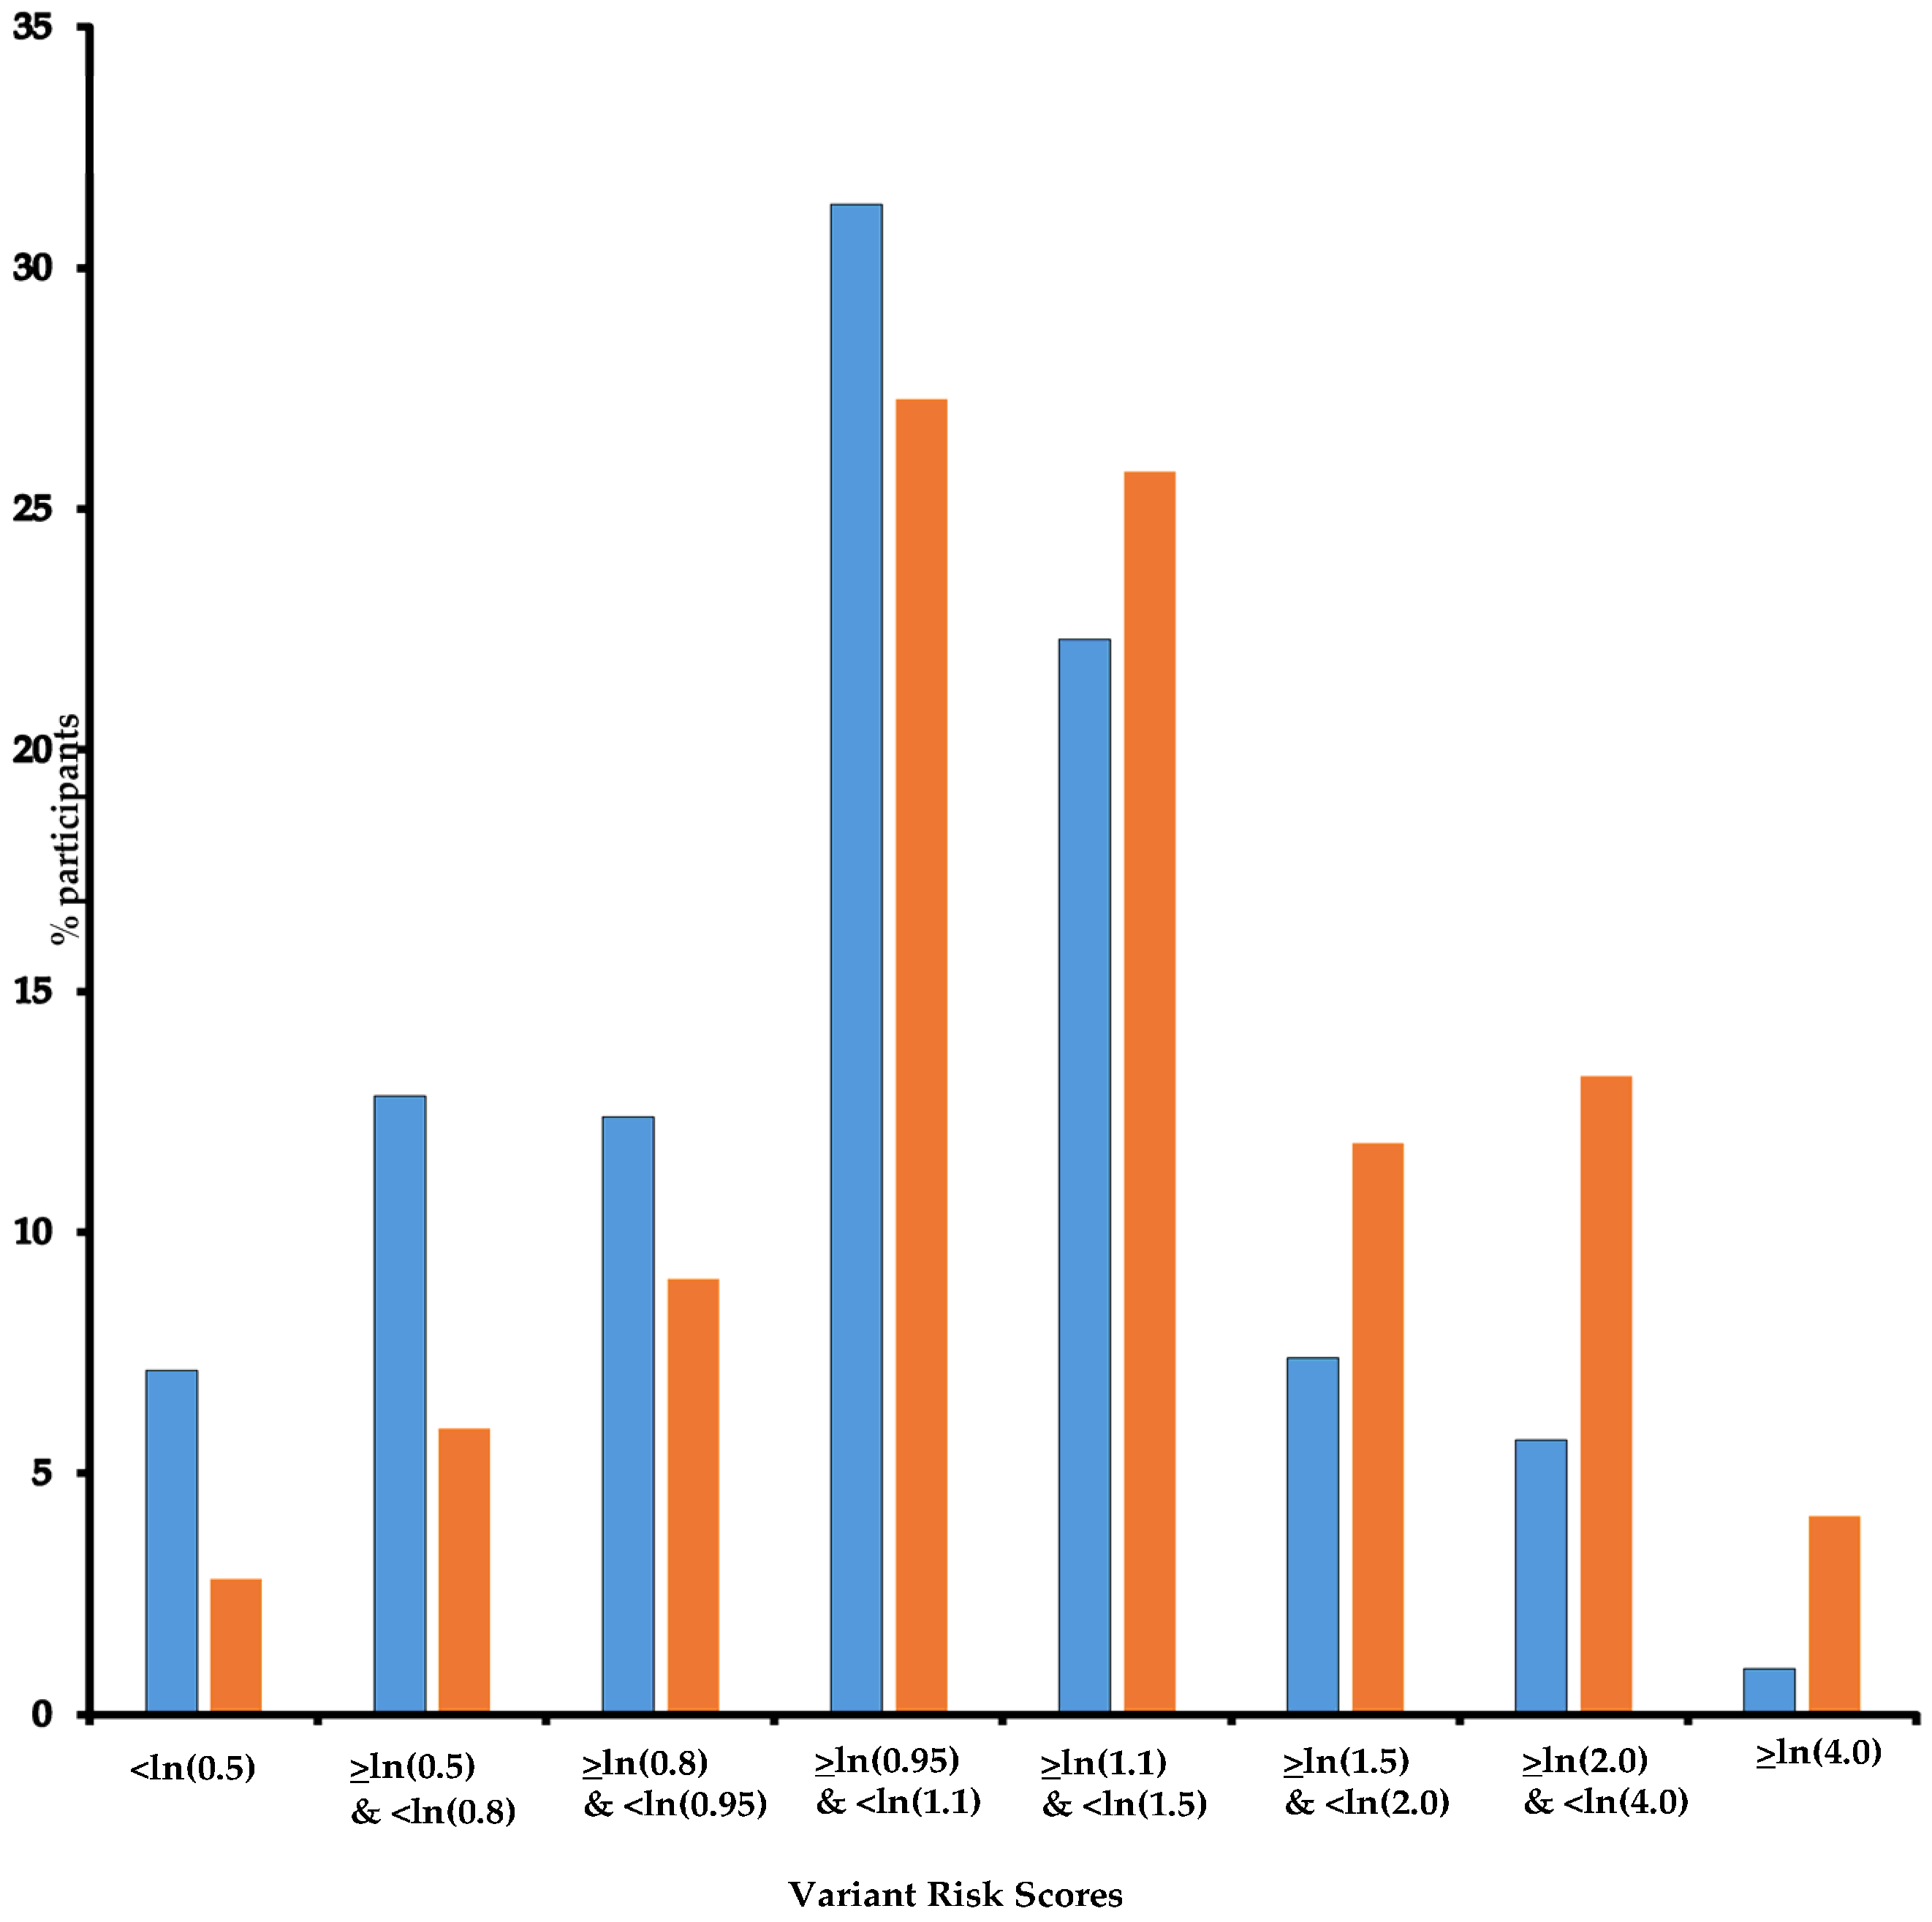
| Variant Risk Score | |||||
| <ln(0.8) | 28 | 83 | 1 | ||
| ≥ln(0.8) and <ln(0.95) | 149 | 293 | 1.71 | 0.96–3.02 | |
| ≥ln(0.95) and <ln(1.1) | 272 | 364 | 2.29 | 1.32–3.99 | |
| ≥ln(1.1) and <ln(1.5) | 257 | 259 | 3.12 | 1.78–5.46 | |
| ≥ln(1.5) | 291 | 163 | 5.71 | 3.23–10.1 | |
| “Reduced” | “Independent” | “Increased” | ||||||||||
|---|---|---|---|---|---|---|---|---|---|---|---|---|
| Number of | Number of | Number of | ||||||||||
| Cases N = 274 | Controls N = 441 | OR a | 95% CI | Cases N = 422 | Controls N = 503 | OR a | 95% CI | Cases N = 575 | Controls N = 495 | OR a | 95% CI | |
| Mammography exposure | ||||||||||||
| Never | 19 | 32 | 1 | 44 | 29 | 1 | 62 | 28 | 1 | |||
| Ever | 251 | 406 | 2.11 | 0.89–5.02 | 377 | 471 | 1.22 | 0.61–2.50 | 509 | 464 | 0.89 | 0.46–1.70 |
| Number of mammograms | ||||||||||||
| 0 | 19 | 32 | 1 | 44 | 29 | 1 | 62 | 28 | 1 | |||
| 1–4 | 52 | 81 | 2.25 | 0.89–5.66 | 63 | 84 | 1.10 | 0.50–2.39 | 87 | 83 | 0.93 | 0.45–1.62 |
| 5–9 | 51 | 97 | 1.83 | 0.71–4.69 | 82 | 112 | 1.21 | 0.56–2.60 | 103 | 111 | 0.73 | 0.37–1.45 |
| ≥10 | 98 | 205 | 2.46 | 0.93–6.51 | 155 | 243 | 1.56 | 0.72–3.40 | 220 | 236 | 1.37 | 0.67–2.82 |
| Age at first exposure, years b | ||||||||||||
| No exposure | 19 | 32 | 1 | 44 | 29 | 1 | 62 | 28 | 1 | |||
| ≥50 | 29 | 100 | 1.52 | 0.60–4.89 | 40 | 111 | 0.75 | 0.30–1.85 | 62 | 111 | 0.64 | 0.28–1.47 |
| 40–49 | 104 | 195 | 1.72 | 0.68–4.35 | 154 | 239 | 0.81 | 0.38–1.74 | 193 | 223 | 0.66 | 0.33–1.32 |
| 30–39 | 90 | 88 | 2.12 | 0.85–5.29 | 138 | 97 | 1.36 | 0.65–2.87 | 196 | 102 | 0.88 | 0.44–1.74 |
| <30 | 25 | 18 | 2.85 | 0.90–9.04 | 42 | 23 | 1.46 | 0.58–3.68 | 52 | 21 | 0.97 | 0.41–2.30 |
| Time since first exposure, years b | ||||||||||||
| No exposure | 51 | 61 | 0.42 | 0.16–1.05 | 44 | 29 | 0.76 | 0.35–1.65 | 62 | 28 | 1.06 | 0.51–2.18 |
| ≤5 | 19 | 32 | 1 | 62 | 65 | 1 | 79 | 58 | 1 | |||
| 6–10 | 60 | 91 | 0.70 | 0.35–1.43 | 90 | 111 | 0.78 | 0.42–1.45 | 132 | 108 | 0.75 | 0.42–1.34 |
| 11–20 | 98 | 166 | 0.70 | 0.33–1.50 | 148 | 191 | 0.82 | 0.43–1.58 | 190 | 188 | 0.76 | 0.41–1.40 |
| >20 | 39 | 83 | 0.56 | 0.23–1.39 | 74 | 100 | 1.08 | 0.35–1.65 | 102 | 103 | 1.00 | 0.50–1.98 |
Disclaimer/Publisher’s Note: The statements, opinions and data contained in all publications are solely those of the individual author(s) and contributor(s) and not of MDPI and/or the editor(s). MDPI and/or the editor(s) disclaim responsibility for any injury to people or property resulting from any ideas, methods, instructions or products referred to in the content. |
© 2025 by the authors. Licensee MDPI, Basel, Switzerland. This article is an open access article distributed under the terms and conditions of the Creative Commons Attribution (CC BY) license (https://creativecommons.org/licenses/by/4.0/).
Share and Cite
Ribeiro-Guerra, M.; Dondon, M.-G.; Eon-Marchais, S.; Le Gal, D.; Beauvallet, J.; Mebirouk, N.; Belotti, M.; Cavaciuti, E.; Adenis-Lavignasse, C.; Audebert-Bellanger, S.; et al. Screening Mammography and Breast Cancer: Variation in Risk with Rare Deleterious or Predicted Deleterious Variants in DNA Repair Genes. Cancers 2025, 17, 1062. https://doi.org/10.3390/cancers17071062
Ribeiro-Guerra M, Dondon M-G, Eon-Marchais S, Le Gal D, Beauvallet J, Mebirouk N, Belotti M, Cavaciuti E, Adenis-Lavignasse C, Audebert-Bellanger S, et al. Screening Mammography and Breast Cancer: Variation in Risk with Rare Deleterious or Predicted Deleterious Variants in DNA Repair Genes. Cancers. 2025; 17(7):1062. https://doi.org/10.3390/cancers17071062
Chicago/Turabian StyleRibeiro-Guerra, Maximiliano, Marie-Gabrielle Dondon, Séverine Eon-Marchais, Dorothée Le Gal, Juana Beauvallet, Noura Mebirouk, Muriel Belotti, Eve Cavaciuti, Claude Adenis-Lavignasse, Séverine Audebert-Bellanger, and et al. 2025. "Screening Mammography and Breast Cancer: Variation in Risk with Rare Deleterious or Predicted Deleterious Variants in DNA Repair Genes" Cancers 17, no. 7: 1062. https://doi.org/10.3390/cancers17071062
APA StyleRibeiro-Guerra, M., Dondon, M.-G., Eon-Marchais, S., Le Gal, D., Beauvallet, J., Mebirouk, N., Belotti, M., Cavaciuti, E., Adenis-Lavignasse, C., Audebert-Bellanger, S., Berthet, P., Bonadona, V., Buecher, B., Caron, O., Cavaille, M., Chiesa, J., Colas, C., Coupier, I., Delnatte, C., ... Andrieu, N. (2025). Screening Mammography and Breast Cancer: Variation in Risk with Rare Deleterious or Predicted Deleterious Variants in DNA Repair Genes. Cancers, 17(7), 1062. https://doi.org/10.3390/cancers17071062